Introduction
Among malignant tumours, lung cancer poses the
greatest threat to human health, and non-small cell lung cancer
(NSCLC) accounts for 85–90% of all lung cancer cases. Metastasis is
present in the majority of patients with NSCLC upon diagnosis, and
surgery is an option in only ~20% of cases. Local and distal NSCLC
metastases are the major causes of treatment failure (1). There is currently no effective
prophylactic treatment against NSCLC metastasis available.
Therefore, it is important to investigate the mechanisms underlying
the invasion and metastasis of NSCLC.
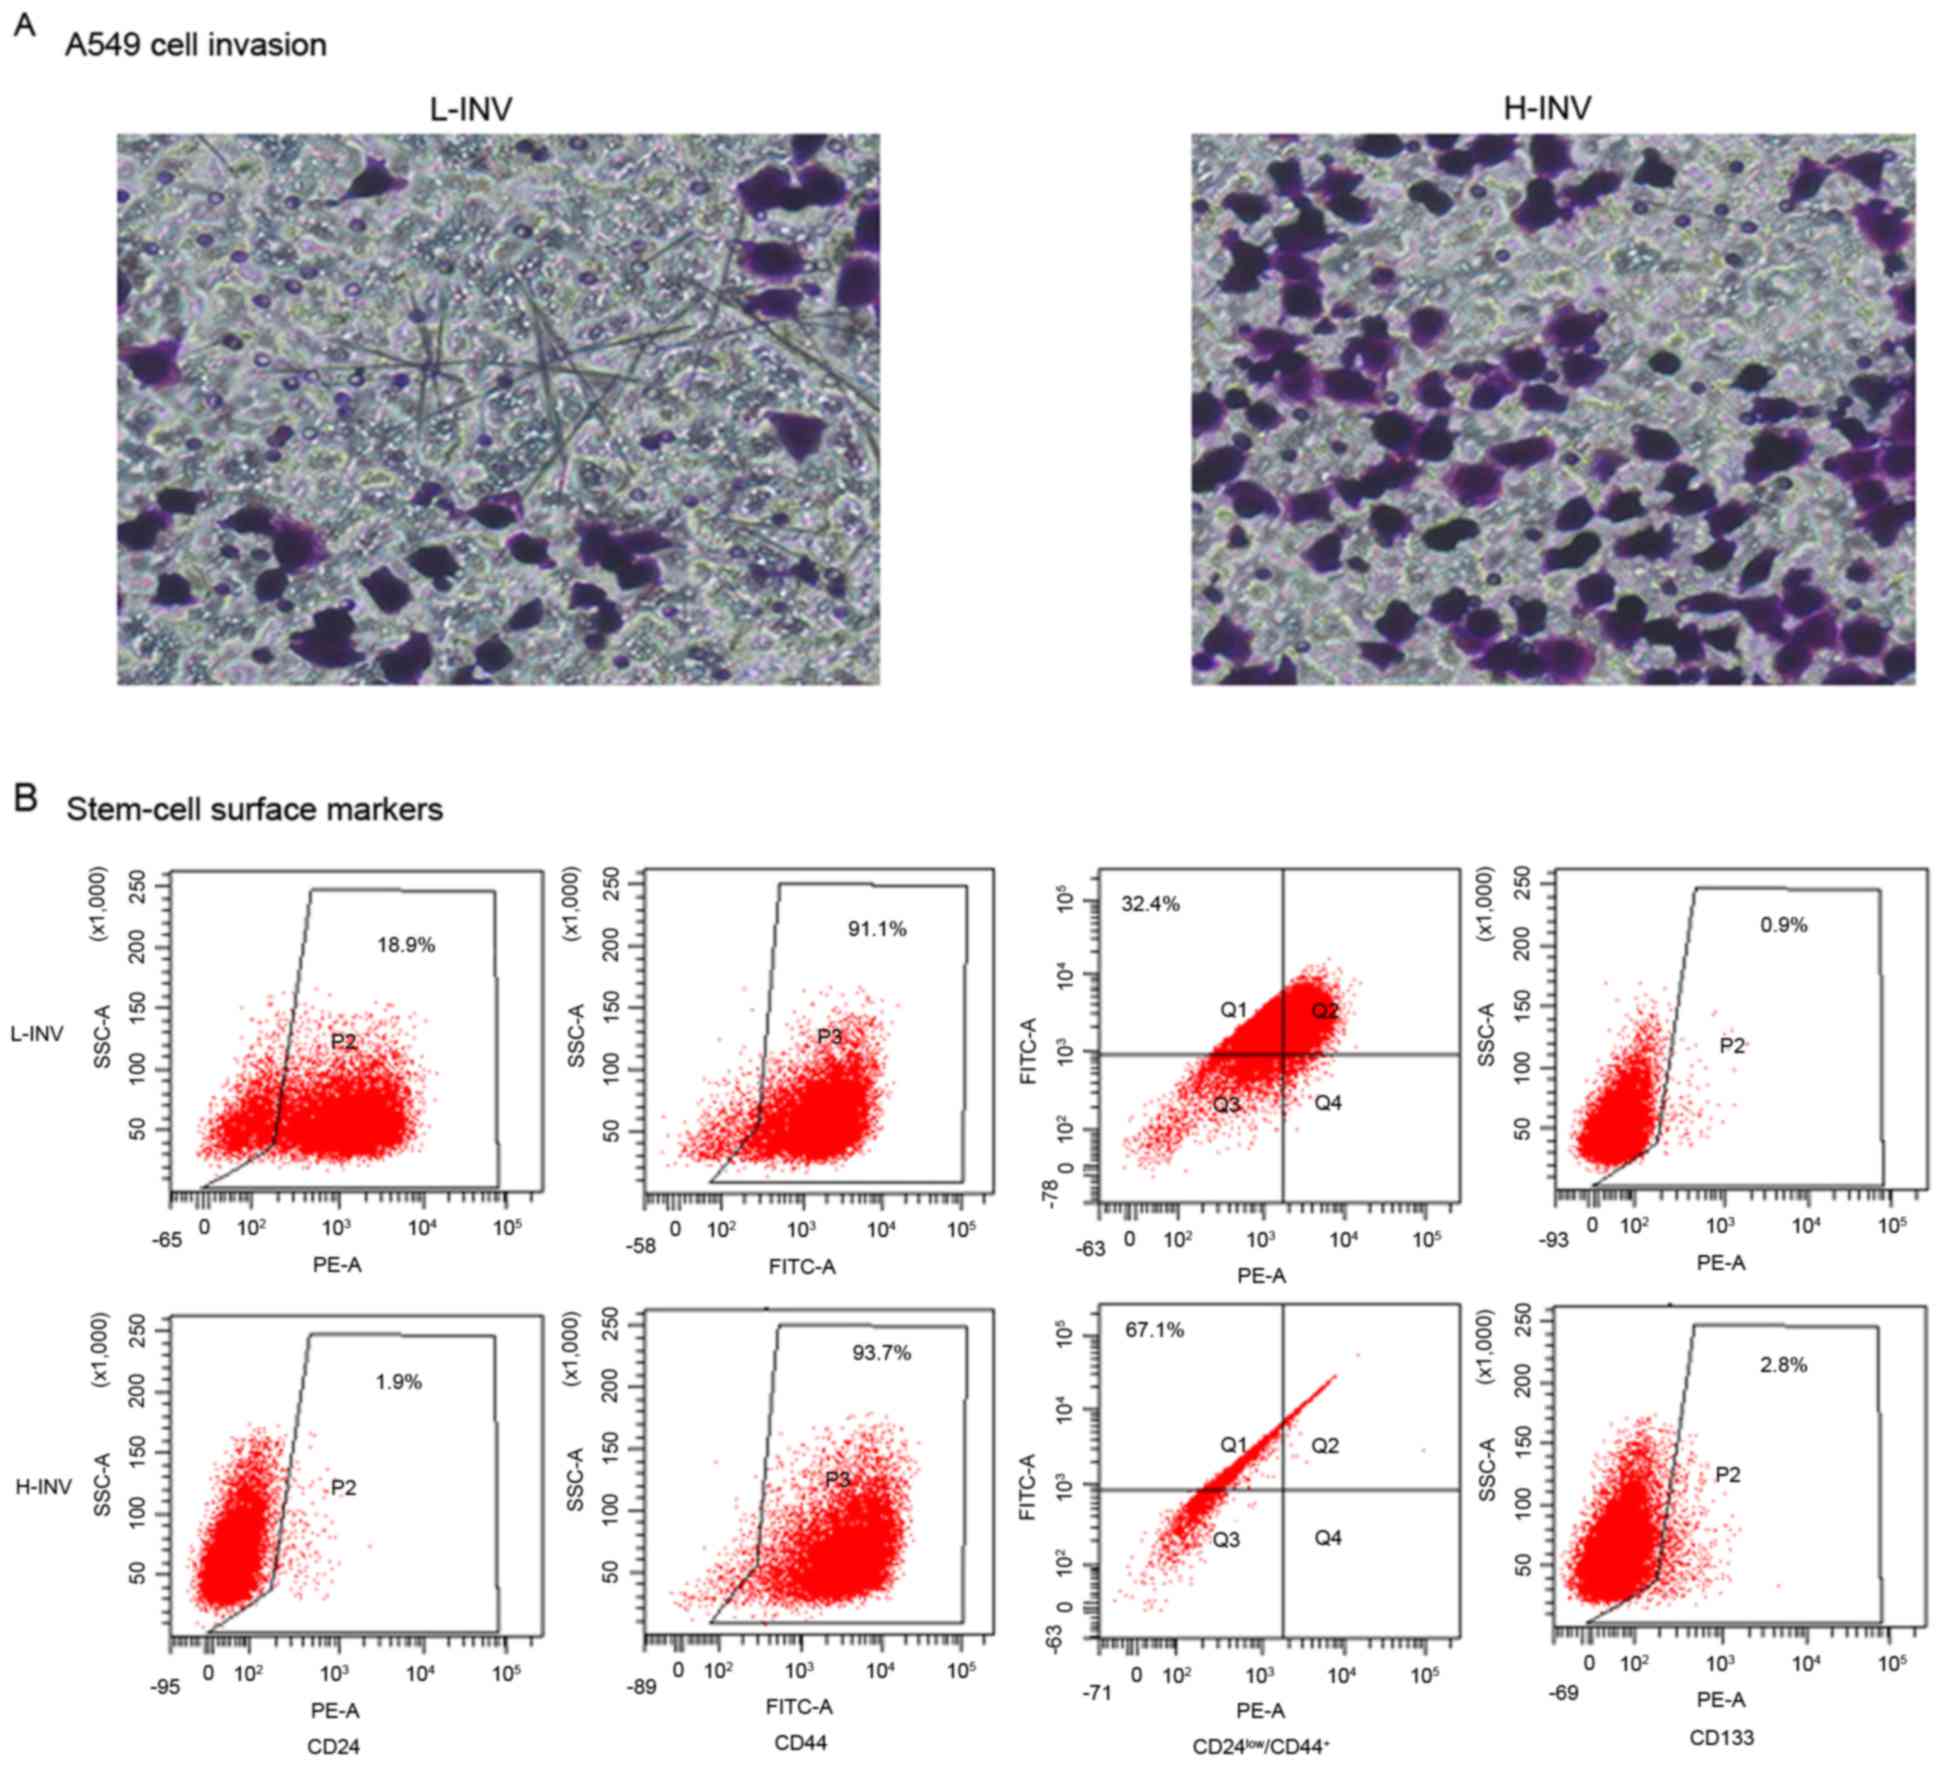
In our previous study, the invasive/metastatic
potential of NSCLC cells were analysed using an in vitro
tumour cell invasion assay (2).
Transwell inserts were used, and a Transwell membrane with an
appropriate pore size was coated with basement membrane extract
(BME). Those cells with a high invasive/metastatic potential
migrated to the lower surface of the membrane or to the lower
chamber. By repeated screening, stable subpopulations of high/low
invasive potential (H/L-INV) were obtained from the A549 lung
cancer cell line, and from prostate, breast and colon cancer cell
lines (Fig. 1A). Analysis of the
H/L-INV A549 cells revealed that the H-INV subpopulation exhibited
the typical cancer stem cell phenotype
(CD24low/CD44+ and CD133), but the L-INV
subpopulation did not (Fig.
1B).
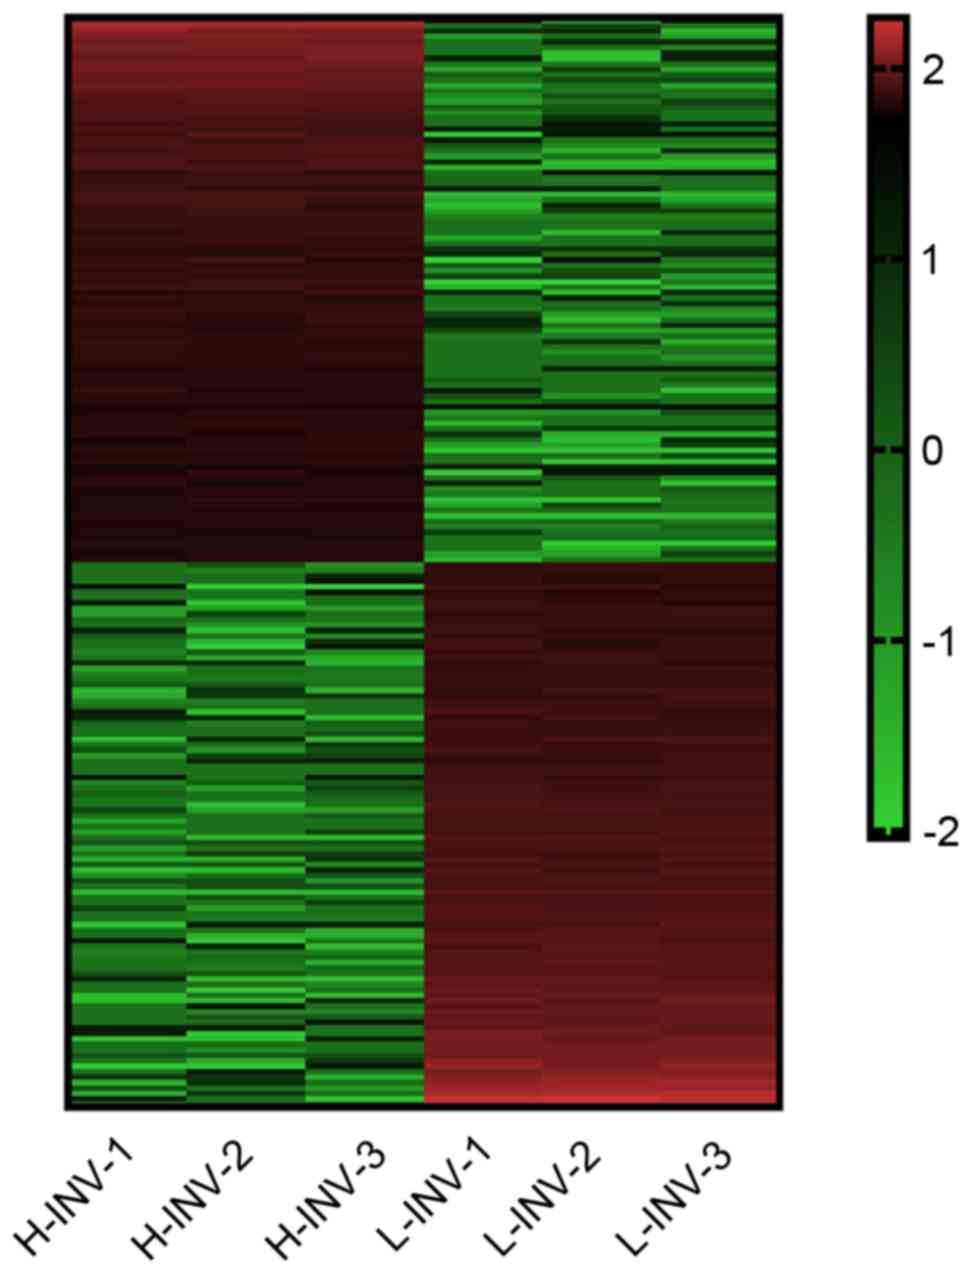
In the present study, microarray analysis of the
H/L-INV A549 subpopulations was performed to evaluate genes
associated with high invasiveness, and Forkhead box protein A1
(FOXA1) was selected for further investigation. The expression
levels of FOXA1 in primary lesions and metastatic lymph nodes were
assessed via reverse transcription-quantitative polymerase chain
reaction (RT-qPCR) analysis. In addition, the mRNA and protein
expression levels of FOXA1 were examined in H-INV A549 cells
transfected with a specific FOXA1 small interfering RNA (siRNA),
and the role of FOXA1 in proliferation, invasion and metastasis in
the NSCLC cells was evaluated.
Materials and methods
Cell culture
The human A549 lung cancer cell line was obtained
from the American Type Culture Collection (Manassas, VA, USA). The
H/L-INV A549 cells were obtained by repeated Transwell screening
and routinely cultured in RPMI-1640 medium supplemented with 10%
foetal bovine serum (FBS) and penicillin/streptomycin (all from
Sigma-Aldrich; Merck Millipore, Darmstadt, Germany). The cells were
incubated at 37°C in 5% CO2.
Gene microarray
Total RNA was extracted from the H/L-INV A549 cells
with TRIzol reagent (Invitrogen; Thermo Fisher Scientific, Inc.,
Waltham, MA, USA). The mRNA was purified using the RNeasy Mini kit
(Qiagen, Inc., Valencia, CA, USA) and reverse transcribed into
cDNA, which was transcribed to biotin-labelled cRNA using T7 DNA
polymerase (Invitrogen; Thermo Fisher Scientific, Inc.). The cRNA
samples were fragmented into fragments of between 50 and 100 nt in
fragmentation buffer (Invitrogen; Thermo Fisher Scientific, Inc.).
The fragmented cRNA was dissolved in hybridization buffer
(Invitrogen; Thermo Fisher Scientific, Inc.) and hybridised with
the GeneChip (Illumina, Inc., San Diego, CA, USA) at 45°C for 16 h.
The chip was then washed and stained according to the
manufacturer's protocol and scanned using an Illumina BeadArray
reader. Microarray Suite 5.0 (Affymetrix, Inc., Santa Clara, CA,
USA) was used to comprehensively analyse and compare the microarray
data.
To identify the genes with high invasive/metastatic
potential, genes with significantly different expression levels
between H-INV A549 and L-INV A549 were examined. The gene sets with
≥2-fold differences in mRNA levels are shown in Tables I and II.
 | Table I.Total 153 genes with >2-fold
upregulation in H-INV cells vs. L-INV cells. |
Table I.
Total 153 genes with >2-fold
upregulation in H-INV cells vs. L-INV cells.
| Gene | P-value (H vs.
L) | Fold-change (H vs.
L) |
|---|
| PI3 | 1E-12 | 29.7 |
| IL13RA2 | 2E-11 | 25.4 |
| SOST | 2E-12 | 13.8 |
| PRND | 2E-12 | 12.4 |
| LOC653879 | 3E-13 | 11.4 |
| CES1 | 3E-13 | 11.3 |
| LCP1 | 2E-13 | 10.7 |
| KRT81 | 4E-13 | 10.4 |
| THBS1 | 1E-10 | 10.1 |
| NNMT | 6E-11 | 9.3 |
| COL9A2 | 5E-11 | 8.8 |
| CLIC3 | 5E-12 | 8.4 |
| OLFML3 | 1E-11 | 8.3 |
| LOC100133511 | 2E-09 | 7.0 |
| TGFA | 2E-11 | 6.3 |
| EVI1 | 9E-11 | 6.1 |
| FLJ35767 | 4E-10 | 5.8 |
| C3 | 1E-11 | 5.3 |
| TNIP1 | 2E-10 | 5.2 |
| TNIP3 | 1E-10 | 5.1 |
| FZD4 | 3E-09 | 5.1 |
| SLC12A3 | 1E-09 | 5.0 |
| BST2 | 6E-11 | 4.8 |
| COBLL1 | 9E-11 | 3.3 |
| NDN | 5E-08 | 3.3 |
| HS.568928 | 2E-09 | 3.3 |
| ZC3H12A | 6E-10 | 3.3 |
| LOC100134370 | 6E-08 | 3.2 |
| F2RL2 | 4E-10 | 3.2 |
| LOC100132240 | 3E-09 | 3.2 |
| SULT1A2 | 2E-11 | 3.2 |
| HKDC1 | 1E-09 | 3.1 |
| PLTP | 4E-13 | 3.1 |
| KCTD14 | 1E-08 | 3.0 |
| GSTM1 | 2E-10 |
3.0 |
| SULT1A1 | 2E-10 |
3.0 |
| FOXA1 | 5E-10 |
3.0 |
| LYPD6 | 4E-08 |
3.0 |
| WWC1 | 4E-08 |
2.9 |
| ARHGEF5 | 7E-10 |
2.9 |
| SLFN11 | 9E-09 |
2.8 |
| ID1 | 7E-09 |
2.8 |
| SLPI | 2E-08 |
2.7 |
| TBC1D9 | 6E-09 |
2.7 |
| PVRL3 | 1E-08 |
2.7 |
| GSTM3 | 1E-07 |
2.7 |
| ZDHHC23 | 1E-09 |
2.3 |
| SLIT2 | 2E-09 |
2.3 |
| C14ORF132 | 2E-09 |
2.3 |
| MAP1A | 3E-09 |
2.3 |
| DBNDD2 | 8E-08 |
2.3 |
| EMP1 | 1E-08 |
2.3 |
| NINJ1 | 2E-07 |
2.3 |
| AMOT | 6E-07 |
2.3 |
| E2F2 | 3E-09 |
2.3 |
| CXORF57 | 4E-07 |
2.3 |
| DMKN | 3E-09 |
2.2 |
| IRX3 | 4E-09 |
2.2 |
| MMP7 | 3E-08 |
2.2 |
| TMSB15A | 1E-08 |
2.2 |
| TMEM47 | 3E-08 |
2.2 |
| NFKBIA | 6E-08 |
2.2 |
| HS.373429 | 9E-10 |
2.2 |
| NXT2 | 2E-07 |
2.2 |
| GINS2 | 1E-07 |
2.2 |
| SPOCK1 | 2E-07 |
2.2 |
| IGFBP6 | 3E-08 |
2.2 |
| GPC4 | 2E-08 |
2.1 |
| FBN2 | 7E-08 |
2.1 |
| TGM2 | 5E-09 |
2.1 |
| SCARNA9 | 2E-05 |
2.1 |
| TUBB2B | 5E-09 |
2.0 |
| SMAD6 | 5E-08 |
2.0 |
| AKR1B15 | 4E-06 |
2.0 |
| FAM111A | 6E-09 |
2.0 |
| IFIH1 | 3E-07 |
2.0 |
| NES | 1E-06 |
2.0 |
| DLG4 | 1E-08 |
2.0 |
| IL1A | 8E-10 |
4.7 |
| LOC100134134 | 2E-11 |
4.6 |
| ARHGAP4 | 2E-10 |
4.3 |
| CLDN11 | 5E-10 |
4.2 |
| LOC100129681 | 2E-10 |
4.1 |
| CES4 | 2E-11 |
4.0 |
| SULT1A4 | 3E-11 |
4.0 |
| ARHGEF5L | 5E-12 |
3.9 |
| ARAP3 | 2E-10 |
3.9 |
| DIO2 | 3E-10 |
3.9 |
| SNAI2 | 1E-12 |
3.8 |
| LOC648815 | 7E-11 |
3.8 |
| PLAC8 | 3E-09 |
3.7 |
| CCND3 | 6E-09 |
3.6 |
| PTGDS | 7E-09 |
3.6 |
| OLFM1 | 9E-10 |
3.5 |
| GBP1 | 3E-09 |
3.5 |
| EFNB2 | 3E-11 |
3.5 |
| CTDSPL | 1E-10 |
3.5 |
| GAS1 | 2E-09 |
3.5 |
| GCA | 4E-09 |
3.4 |
| SERPINA3 | 5E-07 |
3.4 |
| SPINK5L3 | 3E-08 |
3.4 |
| CP | 6E-09 |
2.7 |
| MAOA | 1E-07 |
2.6 |
| ID3 | 1E-08 |
2.6 |
| SPARC | 5E-07 |
2.6 |
| CCDC74B | 3E-08 |
2.6 |
| WDR69 | 1E-09 |
2.6 |
| KLHDC8B | 1E-09 |
2.6 |
| IL7R | 3E-10 |
2.5 |
| GSTM2 | 1E-07 |
2.5 |
| BMP7 | 6E-09 |
2.5 |
| CASP1 | 6E-10 |
2.5 |
| C6ORF150 | 3E-09 |
2.5 |
| CAMK2N1 | 9E-10 |
2.5 |
| SALL2 | 2E-07 |
2.5 |
| NUP210 | 5E-09 |
2.5 |
| AXL | 7E-08 |
2.5 |
| CEBPD | 3E-08 |
2.4 |
| CCR1 | 4E-08 |
2.4 |
| ANKRD41 | 5E-10 |
2.4 |
| ZNF467 | 2E-10 |
2.4 |
| STRA6 | 2E-07 |
2.4 |
| NFKBIZ | 3E-09 |
2.4 |
| PDLIM3 | 1E-11 |
2.4 |
| CCDC74A | 5E-07 |
2.1 |
| DUSP2 | 1E-06 |
2.1 |
| TGFBR3 | 4E-08 |
2.1 |
| GPX3 | 1E-06 |
2.1 |
| FLYWCH2 | 3E-09 |
2.1 |
| FAT1 | 3E-08 |
2.1 |
| DBC1 | 1E-08 |
2.1 |
| HEBP1 | 2E-08 |
2.1 |
| PRPS2 | 4E-09 |
2.1 |
| RPS23 | 2E-08 |
2.1 |
| SOX2 | 2E-08 |
2.1 |
| EGFLAM | 2E-10 |
2.1 |
| MAMLD1 | 1E-07 |
2.1 |
| CLDN23 | 3E-08 |
2.1 |
| KCNK1 | 2E-08 |
2.1 |
| EPM2AIP1 | 1E-07 |
2.1 |
| LITAF | 6E-08 |
2.1 |
| LMTK3 | 9E-07 |
2.1 |
| C8ORF4 | 3E-07 |
2.1 |
| NEFL | 7E-07 |
2.1 |
| LOC158376 | 5E-09 |
2.1 |
| KIF15 | 3E-06 |
2.0 |
| ACSL4 | 2E-07 |
2.0 |
| CDCP1 | 2E-06 |
2.0 |
| SH3GL3 | 1E-07 |
2.0 |
| UNC13C | 5E-10 |
2.0 |
| PPEF1 | 2E-09 |
2.0 |
| SULT1A3 | 8E-09 |
2.0 |
| EPSTI1 | 3E-07 |
2.0 |
| PNMA2 | 5E-07 |
2.0 |
| COL3A1 | 2E-06 |
2.0 |
| Table II.Total 297 genes with >2
fold-change downregulation in H-INV cells vs. L-INV cells. |
Table II.
Total 297 genes with >2
fold-change downregulation in H-INV cells vs. L-INV cells.
| Gene | P-value (H vs.
L) | Fold-change (H vs.
L) |
|---|
| TBC1D19 | 4E-07 |
−2.0 |
| ZNF277 | 2E-06 |
−2.0 |
| MIF4GD | 4E-07 |
−2.0 |
| SH3BGRL3 | 6E-07 |
−2.0 |
| MACROD1 | 8E-07 |
−2.0 |
| FAM46A | 3E-09 |
−2.0 |
| PTGER4 | 8E-08 |
−2.0 |
| PLAUR | 5E-11 |
−2.0 |
| TBX2 | 1E-08 |
−2.0 |
| HIST3H2A | 3E-06 |
−2.0 |
| ZNF365 | 7E-10 |
−2.0 |
| PLCB1 | 7E-07 |
−2.0 |
| COCH | 6E-08 |
−2.0 |
| CFH | 6E-09 |
−2.0 |
| PLOD3 | 4E-08 |
−2.1 |
| EPGN | 4E-07 |
−2.1 |
| PTPRM | 3E-08 |
−2.1 |
| CCDC68 | 2E-09 |
−2.1 |
| GLCE | 4E-07 |
−2.1 |
| CD226 | 4E-09 |
−2.1 |
| SYT1 | 3E-09 |
−2.1 |
| CALU | 1E-07 |
−2.1 |
| BST2 | 6E-11 | 4.8 |
| PDE7B | 1E-08 |
−2.2 |
| C7ORF68 | 2E-07 |
−2.2 |
| CA2 | 2E-08 |
−2.2 |
| AHNAK2 | 6E-06 |
−2.2 |
| HS.4892 | 3E-08 |
−2.2 |
| HBQ1 | 1E-08 |
−2.2 |
| CRIM1 | 8E-08 |
−2.2 |
| AADAC | 8E-08 |
−2.2 |
| PMEPA1 | 2E-08 |
−2.2 |
| PDE1A | 1E-10 |
−2.2 |
| GMDS | 2E-07 |
−2.2 |
| TSPAN7 | 1E-08 |
−2.2 |
| VEGFC | 6E-07 |
−2.2 |
| GDPD5 | 1E-07 |
−2.2 |
| MYPN | 4E-09 |
−2.2 |
| SERPINB1 | 2E-07 |
−2.2 |
| HEBP2 | 8E-07 |
−2.2 |
| CYFIP2 | 7E-10 |
−2.2 |
| PPAPDC1B | 3E-09 |
−2.2 |
| FHL1 | 2E-09 |
−2.2 |
| ITFG1 | 4E-08 |
−2.2 |
| EPB41L3 | 4E-08 |
−2.2 |
| NR4A2 | 3E-07 |
−2.2 |
| SH3RF1 | 1E-08 |
−2.2 |
| AHCYL2 | 1E-06 |
−2.2 |
| NFIA | 1E-07 |
−2.2 |
| ADM2 | 4E-08 |
−2.2 |
| MTHFD2L | 5E-09 |
−2.2 |
| MN1 | 1E-10 |
−2.2 |
| EGR1 | 2E-06 |
−2.2 |
| XYLT1 | 2E-10 |
−2.2 |
| TFB1M | 3E-08 |
−2.2 |
| TMEM106B | 4E-07 |
−2.2 |
| NCOA7 | 7E-06 |
−2.2 |
| ACAT2 | 3E-09 |
−2.2 |
| EFNA1 | 4E-07 |
−2.2 |
| QPCT | 2E-09 |
−2.3 |
| PKIA | 2E-09 |
−2.3 |
| LOC645993 | 1E-06 |
−2.3 |
| BMPER | 2E-08 |
−2.3 |
| MFGE8 | 5E-08 |
−2.3 |
| ELL2 | 5E-09 |
−2.3 |
| HS.444329 | 2E-07 |
−2.3 |
| LEPREL2 | 4E-12 |
−2.3 |
| LYPD1 | 2E-11 |
−2.3 |
| TXNIP | 6E-06 |
−2.3 |
| VAV3 | 6E-10 |
−2.5 |
| HS.193557 | 2E-07 |
−2.5 |
| INSL4 | 4E-08 |
−2.6 |
| KCNMB4 | 8E-09 |
−2.6 |
| LOC100130506 | 1E-07 |
−2.6 |
| HS.551128 | 2E-10 |
−2.6 |
| PLA2G4A | 5E-08 |
−2.6 |
| PDLIM5 | 3E-10 |
−2.6 |
| PDE4D | 3E-07 |
−2.6 |
| LOC644070 | 6E-10 |
−2.6 |
| CNN3 | 3E-07 |
−2.7 |
| DPYD | 4E-09 |
−2.7 |
| PNMA1 | 1E-10 |
−2.7 |
| SOX4 | 5E-08 |
−2.7 |
| AGPAT9 | 9E-07 |
−2.7 |
| IRS2 | 5E-08 |
−2.7 |
| LOC100134073 | 1E-08 |
−2.7 |
| IL8 | 1E-09 |
−2.7 |
| BMP5 | 1E-08 |
−2.7 |
| SLC2A1 | 4E-09 |
−2.7 |
| CXCL5 | 8E-09 |
−2.7 |
| LXN | 8E-11 |
−2.8 |
| LOC124220 | 7E-09 |
−2.8 |
| C13ORF15 | 2E-09 |
−3.0 |
| C14ORF72 | 4E-07 |
−3.0 |
| IRS1 | 4E-10 |
−3.0 |
| PERP | 8E-08 |
−3.0 |
| SLC16A6 | 5E-10 |
−3.1 |
| TUBB3 | 1E-09 |
−3.1 |
| CD55 | 9E-07 |
−3.1 |
| CKB | 7E-09 |
−3.1 |
| MOCOS | 6E-10 |
−3.1 |
| DCBLD2 | 1E-08 |
−3.1 |
| ALDOC | 6E-09 |
−3.1 |
| ISG20 | 2E-09 |
−3.5 |
| VGF | 2E-09 |
−3.5 |
| GJA1 | 1E-08 |
−3.5 |
| C9ORF167 | 3E-08 |
−3.5 |
| KLF2 | 2E-10 |
−3.6 |
| SCARA5 | 1E-10 |
−3.6 |
| LGR4 | 8E-10 |
−3.6 |
| NRIP1 | 2E-10 |
−3.6 |
| SLC16A14 | 1E-10 |
−3.6 |
| GPR65 | 1E-10 |
−3.6 |
| CLDN1 | 3E-08 |
−3.6 |
| FLJ14213 | 1E-09 |
−3.7 |
| DOCK11 | 2E-11 |
−3.7 |
| BMP6 | 3E-09 |
−3.7 |
| HS.133181 | 2E-09 |
−3.8 |
| PYGB | 2E-08 |
−3.9 |
| DUSP1 | 2E-08 |
−3.9 |
| FLRT2 | 6E-09 |
−3.9 |
| PRICKLE1 | 1E-09 |
−3.9 |
| SRPX | 2E-10 |
−3.9 |
| PION | 2E-08 |
−4.0 |
| ESM1 | 8E-10 |
−4.0 |
| HCLS1 | 8E-11 |
−4.1 |
| TSPAN13 | 2E-10 |
−4.9 |
| GPR37 | 3E-09 |
−4.9 |
| TSC22D1 | 4E-10 |
−4.9 |
| SPATA7 | 4E-10 |
−4.9 |
| GDF15 | 3E-10 |
−5.0 |
| SERPINB11 | 2E-11 |
−5.1 |
| MALL | 2E-12 |
−5.1 |
| LAMB1 | 6E-11 |
−5.2 |
| CDH10 | 4E-09 |
−5.3 |
| CITED2 | 9E-11 |
−5.3 |
| KIAA1199 | 1E-09 |
−5.3 |
| SERPINE2 | 1E-10 |
−5.4 |
| DKK1 | 2E-10 |
−5.4 |
| FOXC1 | 1E-08 |
−5.6 |
| ALDH3A1 | 1E-09 |
−5.6 |
| EPHA4 | 5E-11 |
−5.8 |
| TMX4 | 2E-12 |
−5.8 |
| LGALS3 | 8E-09 |
−6.2 |
| SLC7A2 | 1E-12 |
−6.2 |
| SERPIND1 | 6E-10 |
−6.2 |
| JUP | 2E-10 |
−6.8 |
| PITPNC1 | 5E-11 |
−6.8 |
| PRDM8 | 9E-11 |
−7.1 |
| CYR61 | 5E-07 |
−2.1 |
| LOC388755 | 7E-12 |
−2.1 |
| TSC22D3 | 8E-10 |
−2.1 |
| HS.25318 | 2E-07 |
−2.1 |
| GLRX | 6E-08 |
−2.1 |
| GPT2 | 3E-08 |
−2.1 |
| PHF10 | 1E-06 |
−2.1 |
| C9ORF5 | 2E-07 |
−2.1 |
| MEF2C | 4E-07 |
−2.1 |
| HS.552826 | 7E-06 |
−2.1 |
| TMEM84 | 2E-08 |
−2.1 |
| CTSL1 | 1E-08 |
−2.1 |
| ULK1 | 1E-08 |
−2.1 |
| MT2A | 1E-06 |
−2.1 |
| C6ORF48 | 2E-08 |
−2.1 |
| MIR302C | 2E-09 |
−2.1 |
| SMOC1 | 1E-08 |
−2.1 |
| LOC730074 | 5E-07 |
−2.1 |
| PDGFRL | 6E-11 |
−2.1 |
| TMEM2 | 7E-09 |
−2.1 |
| RAB38 | 4E-09 |
−2.2 |
| PTPN12 | 6E-07 |
−2.2 |
| C10ORF140 | 4E-11 |
−2.2 |
| CDKN1A | 1E-07 |
−2.4 |
| SERPINB5 | 4E-11 |
−2.4 |
| OAS1 | 3E-10 |
−2.4 |
| SOCS3 | 5E-09 |
−2.4 |
| BTG1 | 7E-07 |
−2.4 |
| GOLSYN | 1E-08 |
−2.4 |
| TGFBR2 | 1E-09 |
−2.4 |
| TNFAIP3 | 2E-08 |
−2.4 |
| C1ORF24 | 5E-06 |
−2.4 |
| CENPV | 9E-08 |
−2.4 |
| HBA2 | 2E-08 |
−2.4 |
| NCKAP5 | 5E-10 |
−2.4 |
| TMEM154 | 2E-08 |
−2.5 |
| RGS2 | 3E-06 |
−2.5 |
| SHC4 | 7E-09 |
−2.5 |
| STX1A | 5E-07 |
−2.5 |
| CSGALNACT1 | 4E-09 |
−2.5 |
| PCSK1 | 3E-09 |
−2.5 |
| PDE1C | 2E-09 |
−2.5 |
| CNTNAP1 | 5E-08 |
−2.5 |
| CTNNAL1 | 2E-09 |
−2.5 |
| SAT1 | 1E-09 |
−2.5 |
| CA12 | 8E-09 |
−2.5 |
| HOPX | 9E-08 |
−2.3 |
| LRP11 | 3E-08 |
−2.3 |
| HBE1 | 3E-08 |
−2.3 |
| MAP7 | 1E-10 |
−2.3 |
| HERPUD1 | 7E-10 |
−2.3 |
| HS.579530 | 2E-07 |
−2.3 |
| MET | 5E-08 |
−2.3 |
| PDLIM1 | 1E-10 |
−2.3 |
| SNCA | 1E-09 |
−2.3 |
| GKN1 | 3E-07 |
−2.3 |
| DDAH1 | 1E-06 |
−2.4 |
| TIMP1 | 9E-10 |
−2.4 |
| HNMT | 3E-10 |
−2.4 |
| EZR | 4E-08 |
−2.4 |
| ANKRD32 | 1E-07 |
−2.4 |
| HS.492187 | 4E-08 |
−2.4 |
| ARID5B | 1E-09 |
−2.4 |
| ANXA10 | 2E-09 |
−2.4 |
| GALIG | 8E-09 |
−2.4 |
| RPH3AL | 7E-09 |
−2.4 |
| PRKAR1A | 7E-09 |
−2.4 |
| FAM129A | 7E-07 |
−2.4 |
| TMEM100 | 3E-08 |
−2.4 |
| SYTL2 | 3E-12 |
−2.8 |
| CTGF | 6E-09 |
−2.8 |
| VIL2 | 3E-09 |
−2.8 |
| VASN | 8E-08 |
−2.8 |
| LAMC1 | 2E-08 |
−2.8 |
| ABCA8 | 2E-11 |
−2.8 |
| MTHFD1L | 2E-08 |
−2.8 |
| MARCKS | 4E-10 |
−2.8 |
| MBP | 8E-08 |
−2.8 |
| WDFY2 | 4E-11 |
−2.9 |
| CD163L1 | 3E-08 |
−2.9 |
| GLDC | 2E-07 |
−2.9 |
| SPRY2 | 6E-08 |
−2.9 |
| CSRP1 | 9E-10 |
−2.9 |
| CADPS2 | 1E-09 |
−2.9 |
| TNFRSF21 | 3E-08 |
−3.0 |
| TGFB2 | 2E-09 |
−3.0 |
| SEMA3A | 5E-07 |
−3.0 |
| SEPP1 | 3E-09 |
−3.0 |
| ASNS | 2E-09 |
−3.0 |
| HS.24119 | 2E-09 |
−3.0 |
| DDIT3 | 8E-08 |
−3.0 |
| TTC32 | 3E-09 |
−3.0 |
| KLF4 | 3E-11 |
−3.2 |
| ZFP36 | 9E-09 |
−3.2 |
| MYO5C | 3E-09 |
−3.2 |
| CDH1 | 4E-10 |
−3.2 |
| WDR72 | 9E-08 |
−3.2 |
| FJX1 | 7E-11 |
−3.3 |
| UBE2L6 | 3E-11 |
−3.3 |
| RAB31 | 1E-09 |
−3.3 |
| C20ORF108 | 1E-09 |
−3.3 |
| KRT80 | 4E-09 |
−3.3 |
| DEFB1 | 1E-10 |
−3.4 |
| ERRFI1 | 2E-08 |
−4.1 |
| FAM107B | 7E-09 |
−4.1 |
| EDN1 | 8E-12 |
−4.1 |
| SUCNR1 | 9E-09 |
−4.1 |
| ADAM19 | 3E-13 |
−4.1 |
| C5ORF46 | 3E-10 |
−4.3 |
| FAM113B | 1E-09 |
−4.4 |
| GREM2 | 3E-10 |
−4.4 |
| CYP24A1 | 1E-09 |
−4.5 |
| CAV1 | 2E-10 |
−4.5 |
| M160 | 3E-09 |
−4.5 |
| C13ORF30 | 3E-10 |
−4.6 |
| FST | 7E-11 |
−4.6 |
| STS-1 | 1E-10 |
−4.7 |
| ITGA2 | 3E-12 |
−4.7 |
| TNFRSF11B | 2E-11 |
−4.7 |
| PDK4 | 2E-11 |
−4.8 |
| C12ORF39 | 5E-09 |
−4.8 |
| ITPRIP | 1E-10 |
−4.8 |
| NRCAM | 5E-10 |
−4.8 |
| OLFML2A | 2E-11 |
−4.8 |
| DDX10 | 7E-10 |
−4.8 |
| LEPREL1 | 2E-10 |
−4.8 |
| C1ORF85 | 3E-12 |
−7.1 |
| RAB3C | 1E-10 |
−7.9 |
| GSTO2 | 5E-12 |
−8.0 |
| PAPPA | 6E-11 |
−8.0 |
| LAMA1 | 3E-13 |
−8.1 |
| GPR64 | 2E-12 |
−8.5 |
| DLG2 | 6E-12 |
−9.2 |
| TFPI | 2E-10 |
−9.2 |
| ANTXR2 | 8E-13 |
−9.3 |
| RSPO3 | 9E-11 | −10.2 |
| CD24 | 8E-13 | −10.3 |
| FLJ21986 | 9E-14 | −10.7 |
| KRT19 | 4E-12 | −13.2 |
| IGFBP4 | 4E-12 | −14.0 |
| MLPH | 1E-12 | −14.0 |
| SERPINB2 | 2E-13 | −16.9 |
| TSPAN8 | 3E-10 | −20.0 |
| COL8A1 | 2E-13 | −20.9 |
| GALC | 3E-12 | −29.5 |
| AGR2 | 3E-16 | −45.9 |
| CDH11 | 1E-13 | −49.4 |
| PTGS2 | 6E-09 |
−3.5 |
NSCLC specimen collection
A total of 40 pairs of primary tumour tissues and
corresponding metastatic lymph nodes were collected from patients
who underwent tumour resection at Hangzhou Hospital Affiliated to
Nanjing Medical University (Hangzhou, China) between 2014 and 2015.
The tissues were confirmed to be NSCLC by post-operative
pathological evaluation. The fresh specimens were frozen in liquid
nitrogen and stored at −80°C. The present study was approved by the
ethics committee of Nanjing Medical University and was performed
with the provision of written informed consent from patients.
RT-qPCR analysis
Total RNA was extracted from the tissues and cells
using TRIzol reagent (Invitrogen; Thermo Fisher Scientific, Inc.).
cDNA was synthesised from 1 µg of total RNA and used as a template
in a 50-µl reaction using TaqMan RT reagents according to the
manufacturer's protocol (Applied Biosystems; Thermo Fisher
Scientific, Inc.). The RT-qPCR was performed to amplify genes from
the cDNA template with gene-specific primer sets. The following PCR
primers were used: FOXA1, forward 5′-TAATCATTGCCATCGTGTGCTT-3′ and
reverse 5′-ATAATGAAACCCGTCTGGCTA-3′; GAPDH, forward
5′-ATCCCATCACCATCTTCCAGGAGCG-3′ and reverse
5′-AAATGAGCCCCAGCCTTCTCCATG-3′. To avoid amplifying genomic DNA,
gene primers were selected from different exons. The reaction was
performed in a total reaction volume of 50 µl, which contained 2 µl
of cDNA solution, 0.2 µM sense and antisense primers, 25 µl GoTaq
qPCR Master mix (Promega Corporation, Madison, WI, USA) and
DEPC-treated water. The amplification conditions were as follows:
Pre-denaturation at 95°C for 10 min, followed by 35–40 cycles of
denaturation at 95°C for 15 sec, and annealing and extension at
60°C for 1 min. The relative expression level of FOXA1 was
calculated using the comparative Cq (ΔΔCq) method (expression fold
value=2−ΔΔCq) (3),
using GAPDH as the internal reference. Each sample was measured in
triplicate.
H-INV A549 transfection with
siRNA
FOXA1 siRNA and the negative control siRNA were
purchased from Biotend (Shanghai, China). The siRNA sequences were
as follows: FOXA1 siRNA-1: 5′-GUACUACCAAGGUGUGUAUdTdT-3′; FOXA1
siRNA-2: 5′-CUGUCCUUCAAUGACUGCUdTdT-3′; FOXA1 siRNA-3:
5′-CGUCCUUCAACAUGUCCUAdTdT-3′. The cells were divided into three
groups: Non-transfected, Ctrl-siRNA and FOXA1-siRNA. In
vitro transfections were performed using Lipofectamine 2000
(Invitrogen; Thermo Fisher Scientific, Inc.). The cells were seeded
in 6-well plates in 1,500 µl of RPMI-O-MEM without antibiotics or
FBS (1.5×10⁶ cells/well). Upon reaching 30–50%
confluence, the cells were transfected with 500 µl of transfection
mixture containing 20, 30 or 50 nM siRNA. The cells were washed 6 h
following transfection and harvested at 24 or 48 h
post-transfection for subsequent experiments.
Western blot analysis
Total proteins were extracted from the cells of the
three groups described above 48 h following transfection. The cell
lysates were centrifuged at 16,000 × g for 10 min at 4°C, and the
supernatant was collected and stored at −20°C. The protein
concentration was determined using a BCA assay kit (Pierce; Thermo
Fisher Scientific, Inc.), and 50 µg of protein was loaded into each
well and subjected to sodium dodecyl sulfate-polyacrylamide gel
electrophoresis. The proteins were then transferred onto a
nitrocellulose membrane (Immobilon-P; EMD Millipore, Bedford, MA,
USA) in an ice bath at 80 V. Subsequently, the membrane was blocked
using 5% skim milk (Bio-Rad Laboratories, Inc., Hercules, CA, USA)
and incubated with 1:1,000 dilutions of either rabbit FOXA1
antibody (cat no. 58613; Cell Signaling Technology, Inc., Danvers,
MA, USA) or rabbit β-actin antibody (cat no. 4970; Cell Signaling
Technology, Inc.) as the primary antibody overnight at 4°C.
Following washing with Tris-buffered saline solution containing 1%
Tween-20 the membrane was incubated with horseradish
peroxidase-conjugated goat anti-rabbit IgG secondary antibody (cat
no. 4412; dilution 1:5,000; Cell Signalling Technology, Inc.) at
room temperature for 1 h. Finally, the proteins were detected using
enhanced chemiluminescence (GE Healthcare Life Sciences, Upsulla,
Sweden). The molecular mass (kDa) of the proteins was determined
using the prestained protein marker (Bio-Rad Laboratories, Inc.,
Hercules, California, USA). The blot image was analysed using
Image-Pro Plus software version 6.0 (Media Cybernetics, Inc.,
Rockville, MD, USA). FOXA1 and β-actin IOD values were obtained,
and the relative value of the target protein was indicated by the
IOD ratio of the target protein to β-actin in the same sample. This
experiment was repeated three times.
In vitro Transwell invasion and
migration assays
Each 8-µm insert membrane (Falcon; BD Biosciences,
Franklin Lakes, NJ, USA) was coated with 50 µl of BME gel
(Tervigen, Gaithersburg, MD, USA) and incubated overnight at 37°C.
The non-transfected, FOXA1-siRNA (24 h post-transfection) and
Ctrl-siRNA cells were subjected to the assay in triplicate. The
cell suspension was adjusted to 2×10⁵ cells/ml in
RPMI-1640 with 0.1% FBS, and 200 µl of cell suspension was added to
each Transwell. The lower compartment contained 600 µl of RPMI-1640
with 10% FBS. After 48 h, the cells on the upper surface of the
membrane were wiped off, and the membrane was fixed in methanol for
15 min, followed by staining with 1% rystal violet for 15 min.
Using a CX31 microscope (Olympus Corporation, Tokyo, Japan), five
fields were randomly selected (magnification, ×100) on each
membrane and the number of the cells which had crossed the membrane
were counted, with the average being calculated. The invasive
potential of the tumour cells was measured using the relative
invasion index (%), which was calculated as follows: Relative
invasion index (%) = (invading cell count of transfected
cells/invading cell count of non-transfected cells) ×100%. To
compare the migration ability of the three groups of cells, the
experiment was performed in the same manner with the same method
for counting following incubation for 24 h, but without the BME gel
coating on the Transwell membrane.
Scratch wound assay
The non-transfected, FOXA1-siRNA and Ctrl-siRNA
cells were seeded in 6-well plates (3×10⁶ cells/well).
At 24 h post-transfection, a scratch was created across the bottom
surface of each well with a sterile 200-µl pipette tip. The
detached cells were gently washed off with PBS, and the remaining
cells were cultured with serum-free RPMI-1640. The cells along the
scratch edges were observed under a CX31 microscope (Olympus
Corporation) at 0, 24 and 48 h post-scratch. The width of the
scratch was measured at these time points, and the average scratch
healing rate was calculated. The scratch healing rate was
calculated as follows: Scratch healing rate (%) = (scratch width at
0 h-scratch width at 48 h)/scratch width at 0 h ×100%. This
experiment was repeated three times.
MTS colorimetric assay
The non-transfected, FOXA1-siRNA (24 h
post-transfection) and Ctrl-siRNA cells were seeded in 96-well
plates at a density of 8,000 cells/100 µl/well. At 24, 48, 72 and
96 h post-seeding, 20 µl of MTS (Promega Corporation, Madison, WI,
USA) solution was added to each well and incubated for 1 h. The
absorbance at 490 nm was measured on a plate reader. The growth
inhibition rate was calculated as follows: Growth inhibition rate =
(control group absorption-experiment group absorption)/control
group absorption. This experiment was repeated three times.
Cell cycle analysis using flow
cytometry
The non-transfected, FOXA1-siRNA (24 h
post-transfection) and Ctrl-siRNA cells (1×10⁶ each)
were collected and washed in PBS. The cells were fixed and stained
using a cell cycle staining kit (Multisciences Biotech Co., Ltd.,
Shanghai, China) according to the manufacturer's protocol. Flow
cytometric analysis was performed using a BD FACSCalibur flow
cytometer (BD Biosciences) equipped with a 488-nm argon-ion laser.
This experiment was repeated three times.
Statistical analysis
Data were analysed using SPSS 16.0 (SPSS, Inc.,
Chicago, IL, USA) and expressed as the mean ± standard deviation.
Significant differences among multiple groups were analysed using
one-way analysis of variance and the significance of pair-wise
differences was analysed by Student's t-test. P<0.05 was
considered to indicate a statistically significant difference.
Results
Expression of FOXA1 is high in the
H-INV A549 subpopulation
The microarray analysis revealed 450 differentially
expressed genes with ≥2-fold changes between the H-INV and the
L-INV subpopulations. Among these genes, 297 and 153 genes were
expressed at low and high levels, respectively, in the H-INV
subpopulation. The results of the preliminary microarray data
analysis are shown in Fig. 2 and
Tables I and II. FOXA1 was expressed at a high level
in the H-INV subpopulation of A549 cells, and the level of
expression was 3-fold higher, compared with that in the L-INV cells
(P=5E-10).
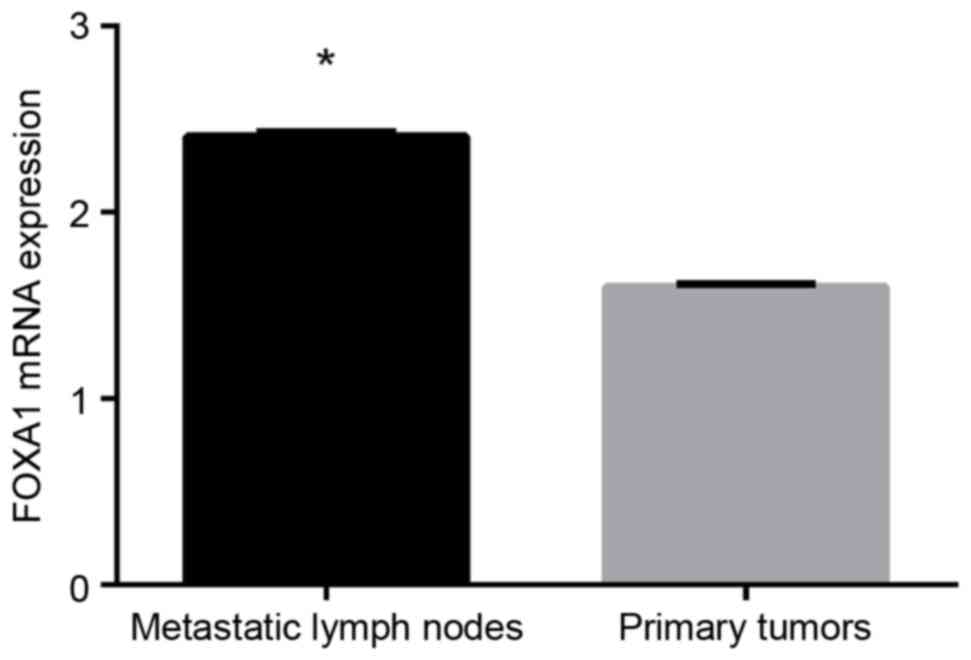
Expression of FOXA1 is higher in
metastatic lymph nodes, compared with NSCLC primary tumours
The mRNA expression of FOXA1 in 40 primary NSCLC
tumours and 40 corresponding metastatic lymph nodes were examined
using RT-qPCR analysis. FOXA1 mRNA was expressed in the primary
NSCLC tumours and metastatic lymph nodes, and expression was higher
in the metastatic lymph nodes, compared with that in the
corresponding primary tumour tissues (P<0.05; Fig. 3).
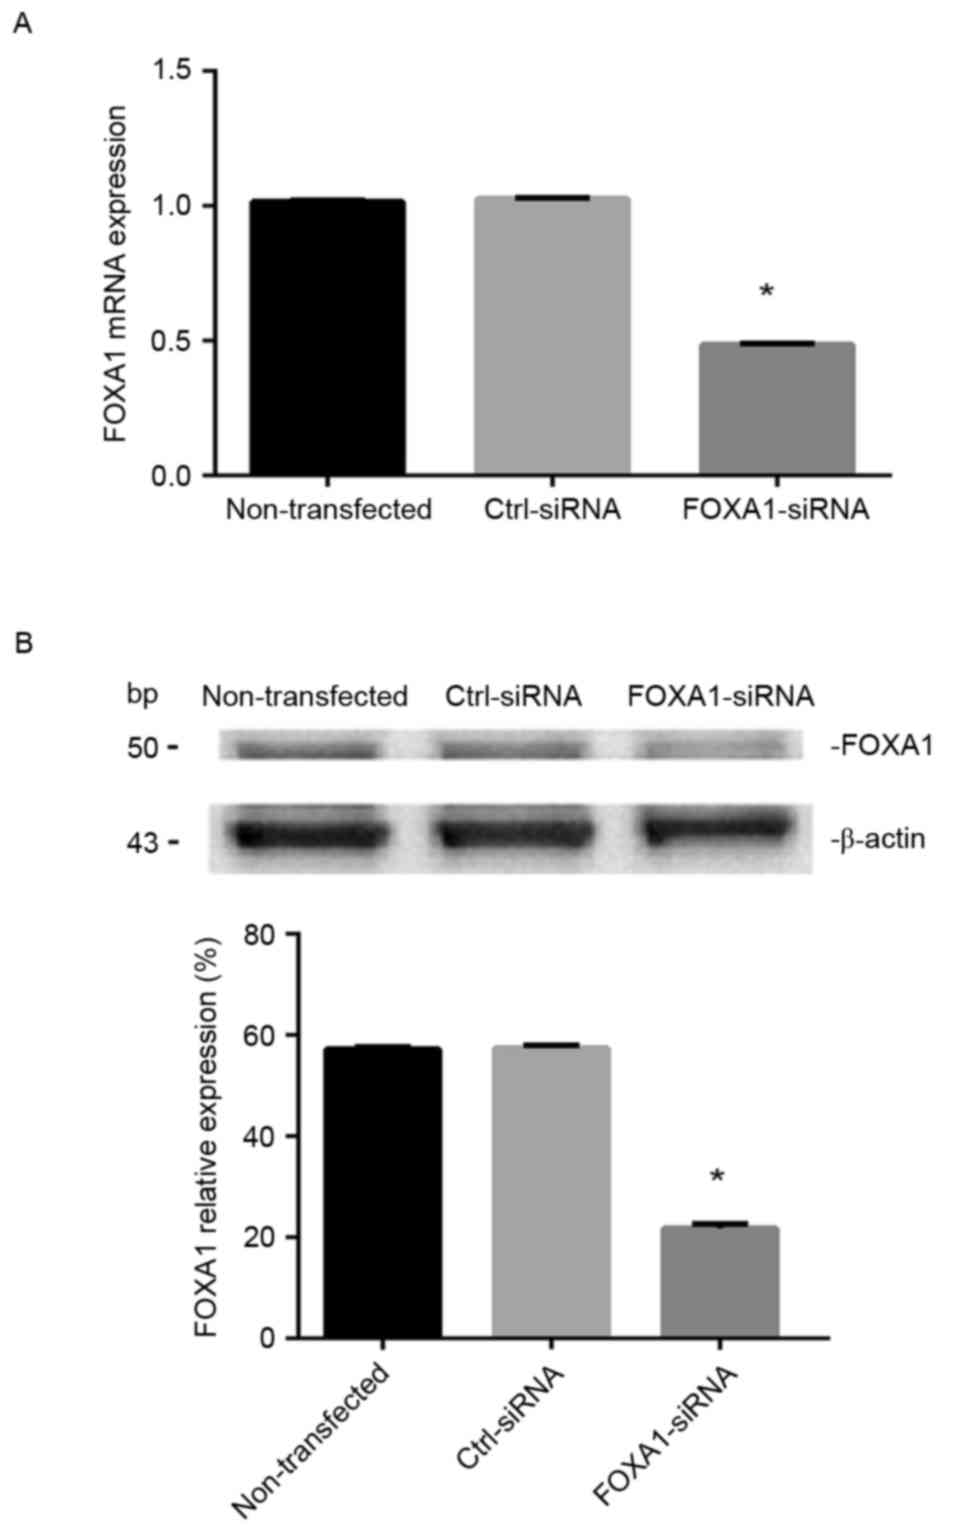
mRNA expression of FOXA1 is reduced in
FOXA1-siRNA transfected cells
The H-INV A549 cells were transfected with 20, 30 or
50 nM FOXA1 siRNA-1/2/3, and the mRNA expression of FOXA1 in each
group was measured using RT-qPCR analysis 24 and 48 h following
transfection. As shown in Fig. 4A,
the mRNA expression level of FOXA1 was lowest in the cells
transfected with FOXA1-siRNA-2 (30 nM; 24 h post-transfection;
0.485±0.007), which was significantly lower, compared with level in
the non-transfected group (1.015±0.062; P<0.05) and the
Ctrl-siRNA group (1.027±0.082; P<0.05). There was no significant
difference between the non-transfected and Ctrl-siRNA groups. On
the basis of the above results, FOXA1-siRNA-2 was selected for use
in subsequent experiments at the optimal transfection concentration
of 30 nM and examination duration of 24 h post-transfection.
Transfection with FOXA1-siRNA leads to
a decrease in the protein expression of FOXA1
The results of the western blot analysis showed that
the protein expression of FOXA1 was significantly reduced in the
FOXA1-siRNA transfected H-INV A549 cells 48 h following
transfection, compared with the expression levels in the
non-transfected and Ctrl-siRNA-transfected cells (P<0.05;
Fig. 4B). There was no significant
difference between the non-transfected and Ctrl-siRNA groups. This
result confirmed that FOXA1-siRNA reduced the protein expression of
FOXA1 in the H-INV A549 cells.
Transfection with FOXA1-siRNA reduces
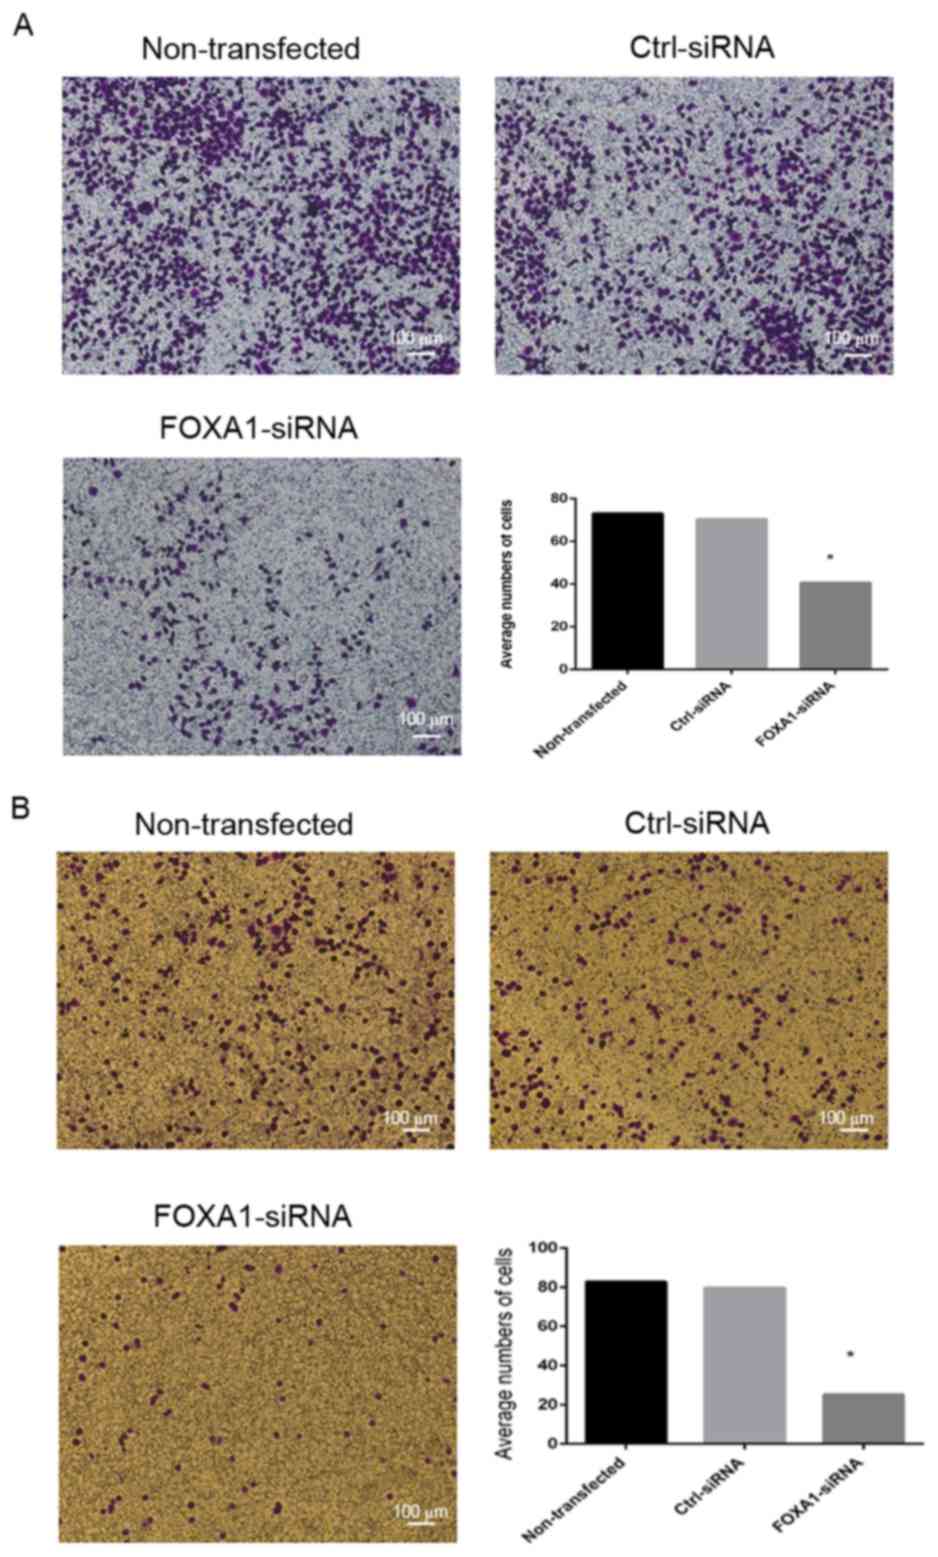
the invasion and migration abilities of H-INV A549 cells
The results of the Transwell invasion assay showed
that the number of invading cells in the FOXA1-siRNA group was
40.60±0.89, with an invasion index of 59±0.37%, whereas the number
of invading cells in the Ctrl-siRNA group was 70.40±1.22, with an
invasion index of 96±0.46%. The invasive potentials of the
FOXA1-siRNA and Ctrl-siRNA-transfected cells were significantly
different (P<0.05; Fig. 5A).
This result indicated that downregulation of the gene expression of
FOXA1 reduced the invasiveness of the metastatic A549 cells.
The Transwell migration assay showed that the
numbers of cells crossing the membrane were 25.20±0.35, 82.77±0.56
and 79.72±0.28 in the FOXA1-siRNA, non-transfected and Ctrl-siRNA
groups, respectively. The number of cells crossing the membrane was
significantly lower in the FOXA1-siRNA group, compared with that in
the Ctrl-siRNA and non-transfected groups (P<0.05; Fig. 5B). This result demonstrated that
FOXA1 siRNA effectively reduced the migration ability of the H-INV
A549 cells in vitro.
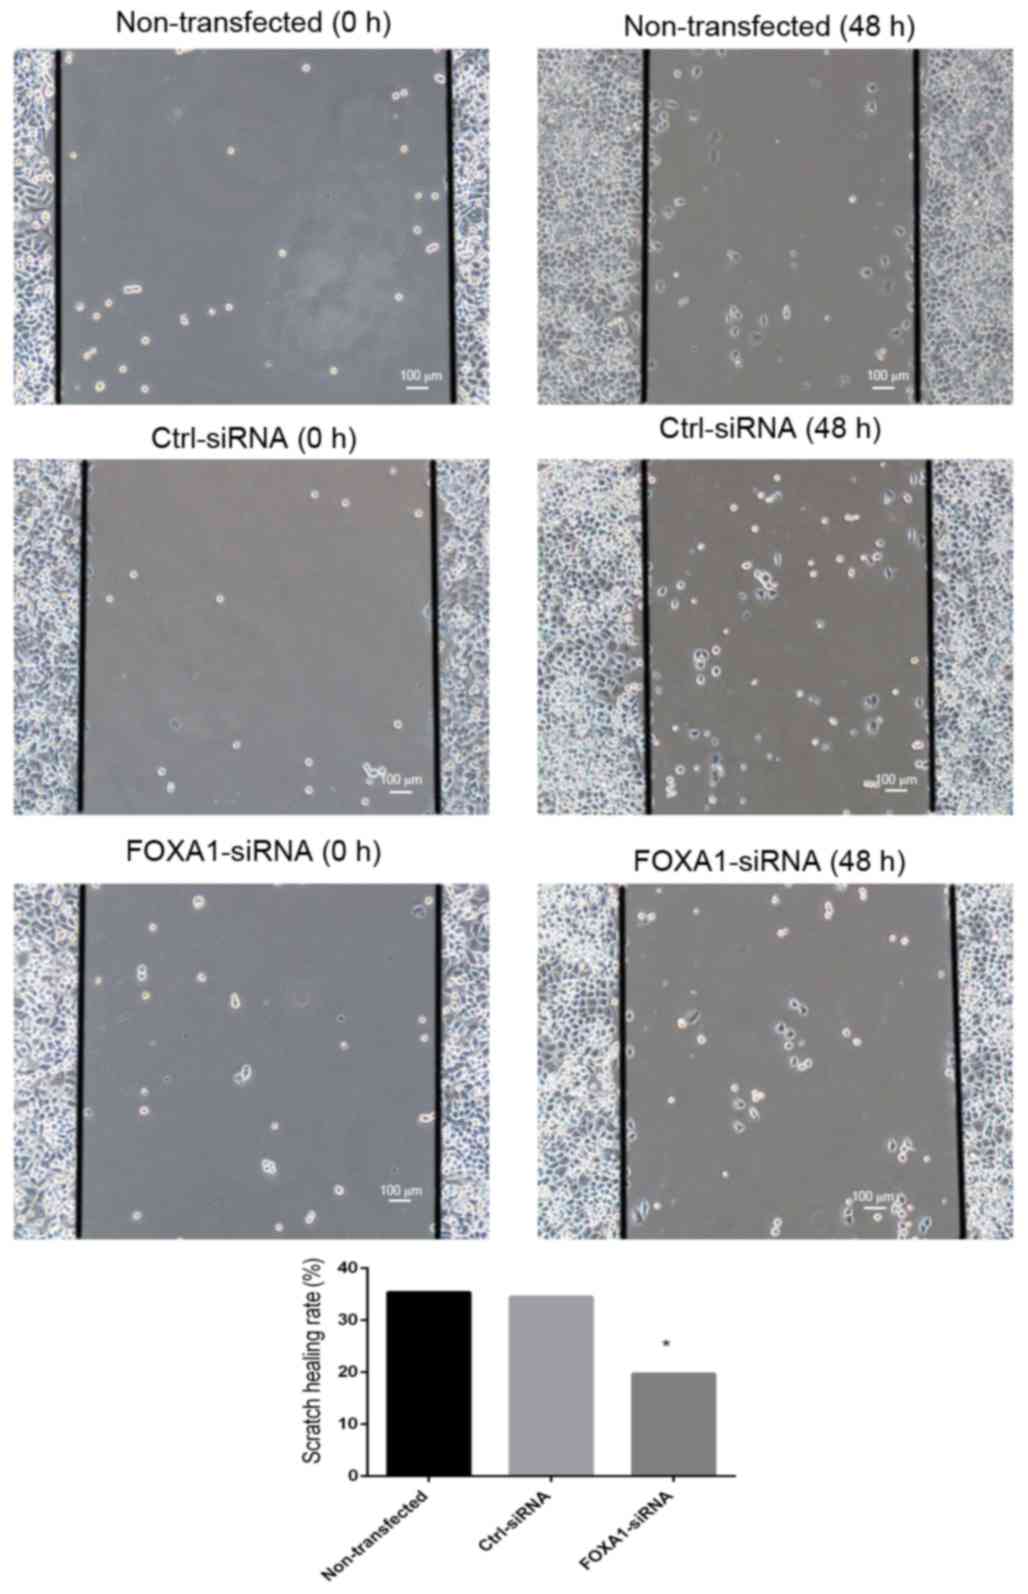
In the scratch wound assay, no significant
differences were found in the scratch healing rates within 48 h
post-scratching between the non-transfected group and the
Ctrl-siRNA group (35.34±6.68 and 34.45±4.08%, respectively). By
contrast, the healing rate in the FOXA1-siRNA cells was
19.66±5.05%, revealing significantly reduced migration ability
(Fig. 6).
FOXA1-siRNA decreases H-INV A549
proliferation activity
The MTS assay showed that transfection with
FOXA1-siRNA (24 h post-transfection) led to significant growth
inhibition at 24, 48 and 72 h (P<0.05; Table III).
| Table III.Effect of FOXA1-siRNA on growth of
high invasive potential A549 cells. |
Table III.
Effect of FOXA1-siRNA on growth of
high invasive potential A549 cells.
|
| Cell growth
inhibition rate (%) |
|---|
|
|
|
|---|
| Group | 24 h | 48 h | 72 h | 96 h |
|---|
| FOXA1-siRNA |
0.3573±0.055a |
0.5081±0.001a |
0.5439±0.013a |
0.2904±0.001 |
| Ctrl-siRNA |
0.0646±0.029 |
0.0506±0.018 |
0.0456±0.070 |
0.0374±0.700 |
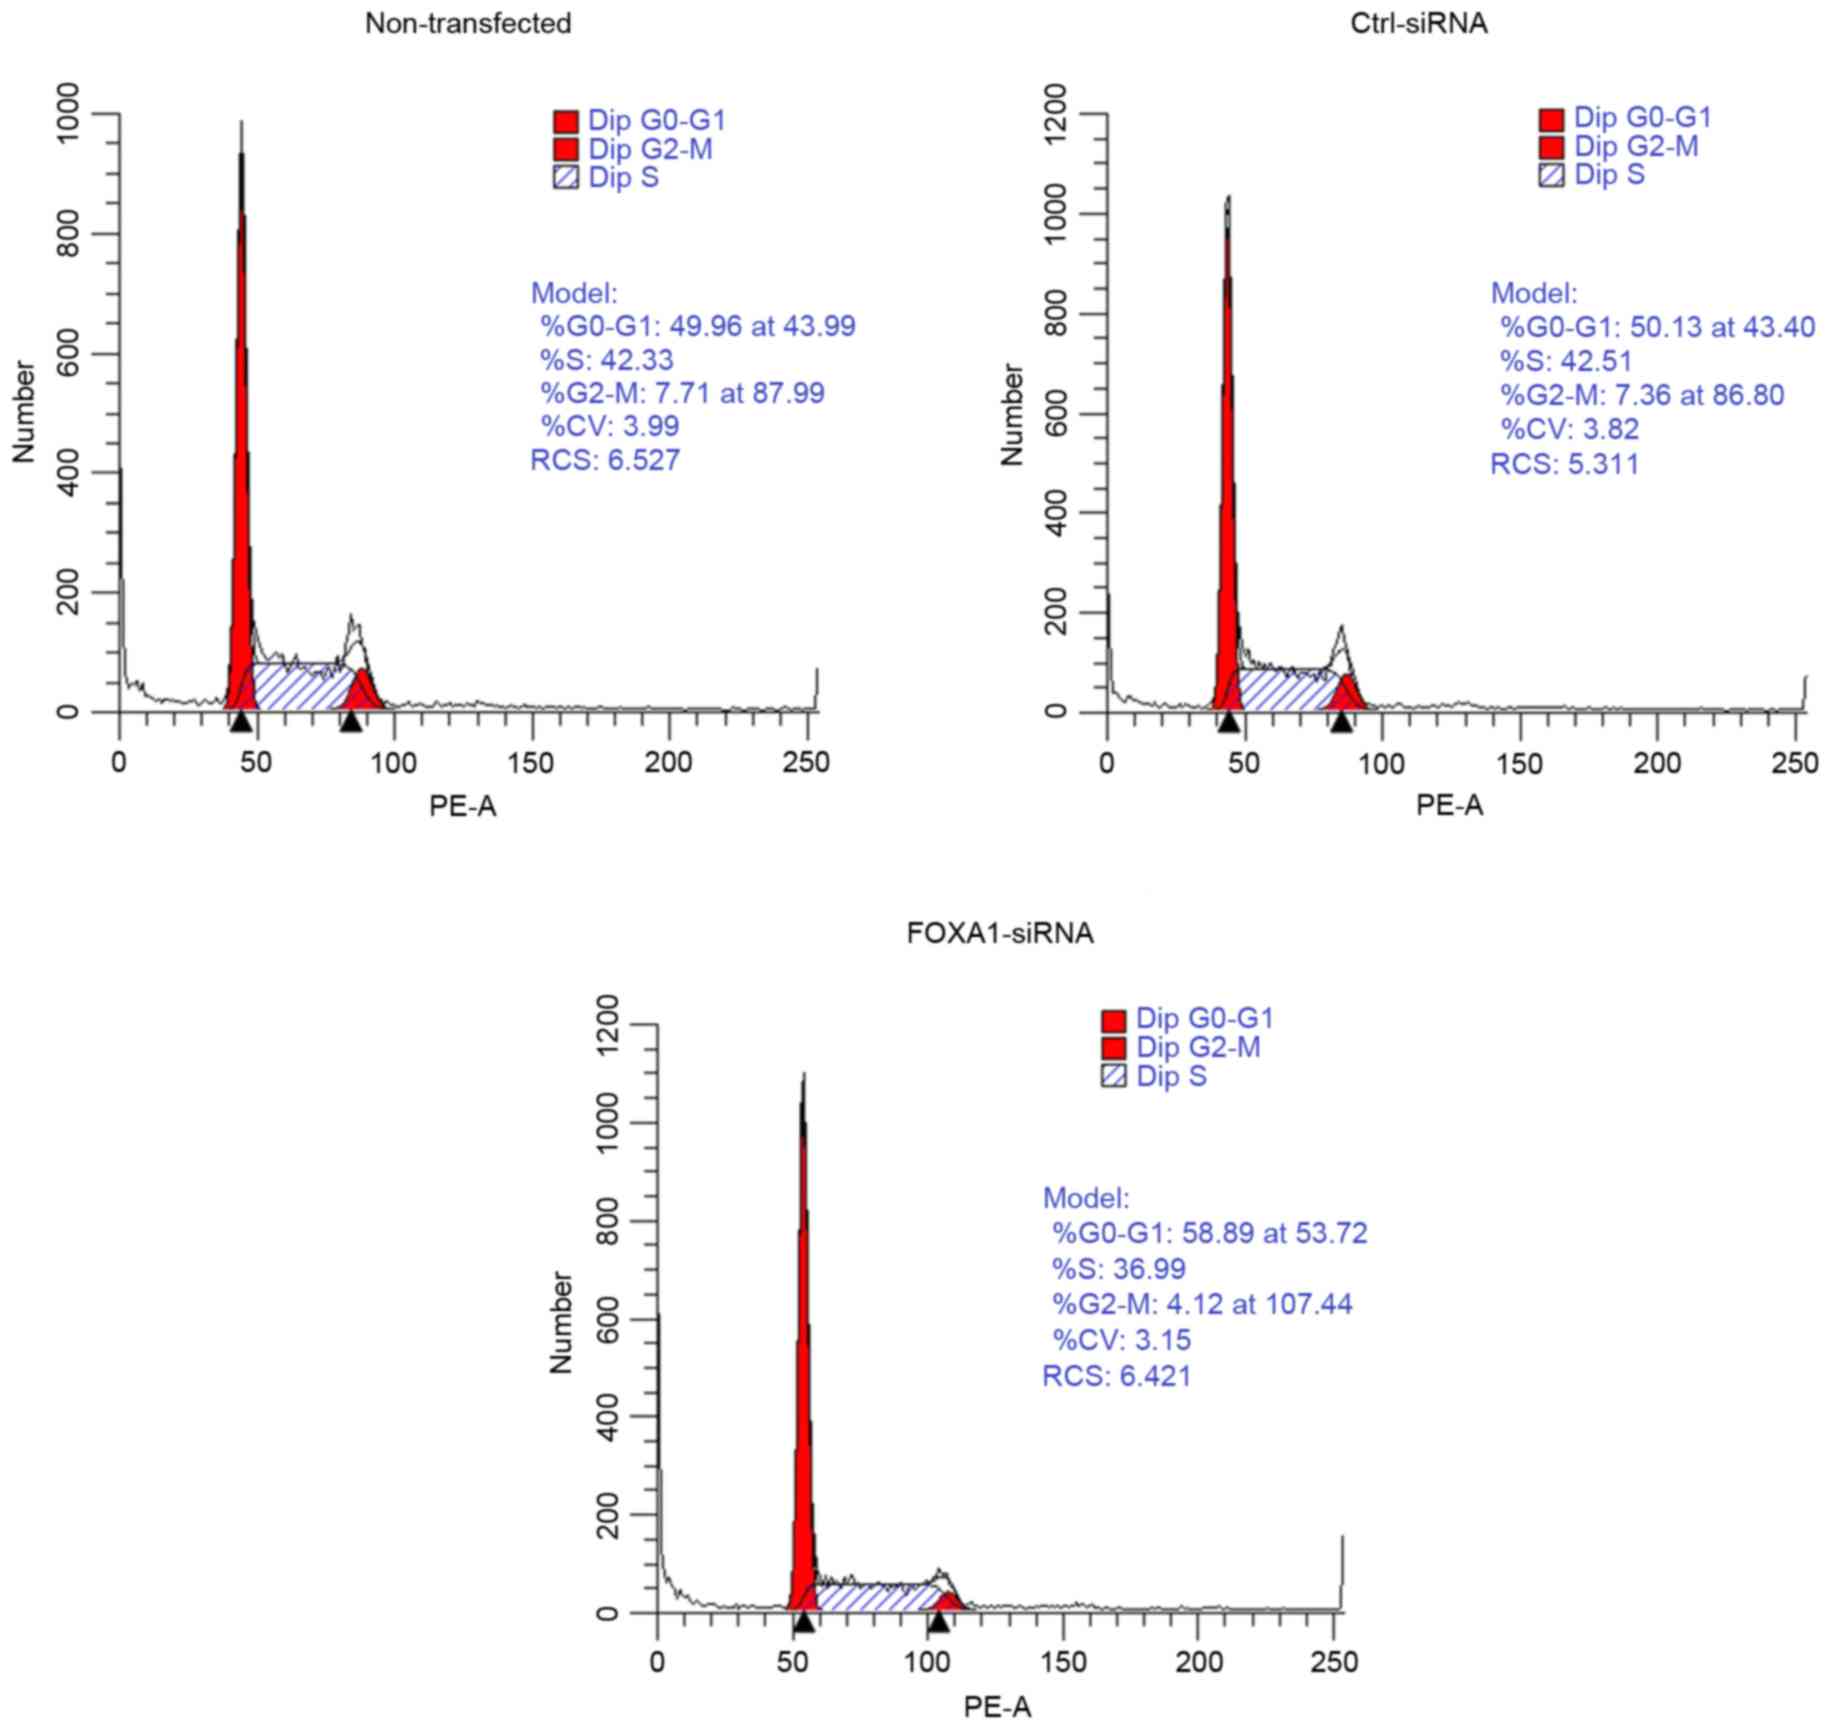
FOXA1-siRNA induces G0/G1 arrest in
H-INV A549 cells
Cell cycle was assessed using flow cytometry 24 h
following transfection. As shown in Table IV, 49.31±3.20% of the
non-transfected cells and 49.69±3.51% of the Ctrl-siRNA transfected
cells were in the G0/G1 phase, with no significant difference
between these two groups. By contrast, the FOXA1-siRNA group
exhibited a significantly higher percentage of cells in the G0/G1
phase (58.99±3.20%; P<0.05), suggesting that FOXA1-silencing
induced G0/G1 arrest in the H-INV A549 cells (Fig. 7).
| Table IV.Effect of FOXA1-siRNA on H-INV A549
cell cycle. |
Table IV.
Effect of FOXA1-siRNA on H-INV A549
cell cycle.
|
| Cells in phase
(%) |
|---|
|
|
|
|---|
| H-INV A549 cell
cycle phase |
Non-transfected | Ctr-siRNA | FOXA1-siRNA |
|---|
| G0/G1 |
49.31±3.20 |
49.69±3.51 |
58.99±3.20a |
| S |
42.35±0.53 |
42.49±1.16 |
36.90±2.05a |
| G2/M |
7.63±3.48 |
7.58±0.25 |
4.10±1.12a |
Discussion
In terms of lung cancer-associated mortality, ~90%
of cases are due to tumour cell invasion and metastasis (3). Distal metastasis is already present
in ~40–50% of patients with lung cancer patients at the time of
diagnosis and develops in the remaining 50–60% of patients during
the course of treatment (4).
Clinical data indicate that ~30% of patients with late-stage NSCLC
who receive the targeted drug epidermal growth factor receptor
tyrosine kinase inhibitor develop intracranial metastasis during
the course of treatment (5,6),
representing one of the major causes of treatment failure of
late-stage NSCLC-targeted molecules. Although there has been
progress in elucidating the molecular mechanisms underlying lung
cancer metastasis, successful translation into clinical application
has been limited. Therefore, it is important to investigate the
molecular mechanisms underlying lung cancer metastasis in a stable
and effective model to identify biomarkers potentially associated
with lung cancer metastasis, and to ensure effective prevention and
treatment of lung cancer metastasis.
Based on its significantly high expression in the
H-INV subpopulation of A549 cells, FOXA1 was selected in the
present study for investigation in subsequent experiments. FOXA1
contains a forkhead (or winged helix) DNA-binding domain of ~100
amino acids and is a member of the pioneer FOXA transcription
factor family. The transcription factor FOXA1 binds to the
chromosome and induces nucleosome remodelling to facilitate the
binding of other transcription factors on the chromosome to
initiate tissue-specific transcriptional programmes (7–11).
Previous studies have identified FOXA1 as either a pro- or
anti-tumourigenic factor in specific human malignancies. For
example, 40% of breast carcinoma cases and up to 80% of estrogen
receptor-positive breast carcinoma are positive for FOXA1, and the
expression of FOXA1 is associated with improved prognosis (12). In endometrial cancer, FOXA1 also
functions as a tumour suppressor in cancer progression (13). By contrast, the expression levels
of FOXA1 in prostate cancer are positively correlated with tumour
size, extraprostatic extension and lymph node metastasis, and
negatively correlated with patient survival rates (14). In pancreatic cancer, the loss of
FOXA1 is necessary and sufficient for epithelial to mesenchymal
transition during cancer progression (15). The overexpression and amplification
of FOXA1 have also been observed in oesophageal, colorectal and
thyroid cancer, and FOXA1 is considered a potential oncogene
(16–18). In addition, Deutsch et al
reported that the expression of FOXA1 in squamous cell carcinoma of
the lung was associated with distant metastasis and an unfavourable
survival rate; it was also found that the expression of FOXA1 in
brain metastasis samples from patients with squamous cell cancer
was marginally higher, compared with that in non-matched primary
tumours (56 vs. 43%) (19). In the
present study, the combined analysis of all tumour samples
confirmed that FOXA1 mRNA was expressed in the primary lesions and
metastatic lymph nodes, with higher expression levels in the
metastatic lymph nodes, compared with the primary lesions. This
suggested that FOXA1 is important in the tumourigenesis and
progression of NSCLC.
The present study further demonstrated the role of
FOXA1 in the invasion, migration and proliferation of NSCLC cells
in vitro. Using the A549 NSCLC cell line, the importance of
FOXA1 in NSCLC metastasis was confirmed. In addition, the
proliferation assay and flow cytometric analysis revealed the
reduced proliferation of FOXA1-siRNA cells due to cell cycle arrest
at the G0/G1 phase, suggesting that FOXA1 affected the
transformation of tumour cells. FOXA1 has also been shown to
promote epithelial to mesenchymal transition in A549 NSCLC cells
(20), and the overexpression of
FOXA1 inhibits the pro-apoptotic, anti-invasive and anti-migratory
capacities of miR-194 in H1299 and A549 NSCLC cells (21). FOXA1 also promotes the migration
and invasion of H1299, PC9 and A549 lung adenocarcinoma cancer
cells (22).
In conclusion, the results of the present study
suggested that FOXA1 is a potential oncogene in NSCLC; therefore,
specific interference of the expression of FOXA1 may represent a
novel approach for the treatment of NSCLC.
Acknowledgements
The present study was supported by the Major Science
and Technology Innovation Project of Hangzhou (grant no.
20112312A01 to Professor Shenglin Ma), the Zhejiang Medical Science
Foundation of China (grant no. 2014KYA178 to Mrs. Shirong Zhang),
the Hangzhou Key Disease and Discipline Foundation of China (grant
no. 20140733Q15 to Mrs. Shirong Zhang) and the Zhejiang Provincial
Natural Science Foundation of China (grant no. LY15H160010 to Mrs.
Shirong Zhang).
References
|
1
|
Jemal A, Bray F, Center MM, Ferlay J, Ward
E and Forman D: Global cancer statistics. CA Cancer J Clin.
61:69–90. 2011. View Article : Google Scholar : PubMed/NCBI
|
|
2
|
Zhang S, Wu K, Feng J, Wu Z, Deng Q, Guo
C, Xia B, Zhang J, Huang H, Zhu L, et al: Epigenetic therapy
potential of suberoylanilide hydroxamic acid on invasive human
non-small cell lung cancer cells. Oncotarget. 7:68768–68780. 2016.
View Article : Google Scholar : PubMed/NCBI
|
|
3
|
Livak KJ and Schmittgen TD: Analysis of
relative gene expression data using real-time quantitative PCR and
the 2(-Delta Delta C(T)) methods. Methods. 25:402–408. 2001.
View Article : Google Scholar : PubMed/NCBI
|
|
4
|
Coleman RE: Clinical features of
metastatic bone disease and risk of skeletal morbidity. Clin Cancer
Res. 12:6243–6249. 2006. View Article : Google Scholar
|
|
5
|
Omuro AM, Kris MG, Miller VA, Franceschi
E, Shah N, Milton DT and Abrey LE: High incidence of disease
recurrence in the brain and leptomeninges in patients with
non-small cell lung carcinoma after response to gefitinib. Cancer.
103:2344–2348. 2005. View Article : Google Scholar : PubMed/NCBI
|
|
6
|
Lee YJ, Choi HJ, Kim SK, Chang J, Moon JW,
Park IK, Kim JH and Cho BC: Frequent central nervous system failure
after clinical benefit with epidermal growth factor receptor
tyrosine kinase inhibitors in Korean patients with non small-cell
lung cancer. Cancer. 116:1336–1343. 2010. View Article : Google Scholar : PubMed/NCBI
|
|
7
|
Cirillo LA and Zaret KS: An early
developmental transcription factor complex that is more stable on
nucleosome core particles than on free DNA. Mol Cell. 4:961–969.
1999. View Article : Google Scholar : PubMed/NCBI
|
|
8
|
Zaret K: Developmental competence of the
gut endoderm: Genetic potentiation by GATA and HNF3/fork head
proteins. Dev Biol. 209:1–10. 1999. View Article : Google Scholar : PubMed/NCBI
|
|
9
|
Cirillo LA, Lin FR, Cuesta I, Friedman D,
Jarnik M and Zaret KS: Opening of compacted chromatin by early
developmental transcription factors HNF3 (FoxA) and GATA-4. Mol
Cell. 9:279–289. 2002. View Article : Google Scholar : PubMed/NCBI
|
|
10
|
Carroll JS, Liu XS, Brodsky AS, Li W,
Meyer CA, Szary AJ, Eeckhoute J, Shao W, Hestermann EV, Geistlinger
TR, et al: Chromosome-wide mapping of estrogen receptor binding
reveals long-range regulation requiring the forkhead protein FoxA1.
Cell. 122:33–43. 2005. View Article : Google Scholar : PubMed/NCBI
|
|
11
|
Laganiere J, Deblois G, Lefebvre C,
Bataille AR, Robert F and Giguere V: From the cover: Location
analysis of estrogen receptor alpha target promoters reveals that
FOXA1 defines a domain of the estrogen response. Proc Natl Acad Sci
USA. 102:11651–11656. 2005. View Article : Google Scholar : PubMed/NCBI
|
|
12
|
Albergaria A, Paredes J, Sousa B, Milanezi
F, Carneiro V, Bastos J, Costa S, Vieira D, Lopes N, Lam EW, et al:
Expression of FOXA1 and GATA-3 in breast cancer: The prognostic
significance in hormone receptor-negative tumors. Breast Cancer
Res. 11:R402009. View
Article : Google Scholar : PubMed/NCBI
|
|
13
|
Abe Y, Ijichi N, Ikeda K, Kayano H,
Horie-Inoue K, Takeda S and Inoue S: Forkhead box transcription
factor, forkhead box A1, shows negative association with lymph
nodes status in endometrial cancer, and represses cell
proliferation and migration of endometrial cancer cells. Cancer
Sci. 103:806–812. 2012. View Article : Google Scholar : PubMed/NCBI
|
|
14
|
Sahu B, Laakso M, Ovaska K, Mirtti T,
Lundin J, Rannikko A, Sankila A, Turunen JP, Lundin M, Konsti J, et
al: Dual role of FOXA1 in androgen receptor binding to chromatin,
androgen signaling and prostate cancer. EMBO J. 30:3962–3976. 2011.
View Article : Google Scholar : PubMed/NCBI
|
|
15
|
Song Y, Washington MK and Crawford HC:
Loss of FOXA1/2 is essential for the epithelial-to-mesenchymal
transition in pancreatic cancer. Cancer Res. 70:2115–2125. 2010.
View Article : Google Scholar : PubMed/NCBI
|
|
16
|
Lin L, Miller CT, Contreras JI, Prescott
MS, Dagenais SL, Wu R, Yee J, Orringer MB, Misek DE, Hanash SM, et
al: The hepatocyte nuclear factor 3 alpha gene, HNF3alpha (FOXA1),
on chromosome band 14q13 is amplified and overexpressed in
esophageal and lung adenocarcinomas. Cancer Res. 62:5273–5279.
2002.PubMed/NCBI
|
|
17
|
Ma W, Jiang J, Li M, Wang H, Zhang H, He
X, Huang L and Zhou Q: The clinical significance of forkhead box
protein A1 and its role in colorectal cancer. Mol Med Rep.
14:2625–2631. 2016. View Article : Google Scholar : PubMed/NCBI
|
|
18
|
Nucera C, Eeckhoute J, Finn S, Carroll JS,
Ligon AH, Priolo C, Fadda G, Toner M, Sheils O, Attard M, et al:
FOXA1 is a potential oncogene in anaplastic thyroid carcinoma. Clin
Cancer Res. 15:3680–3689. 2009. View Article : Google Scholar : PubMed/NCBI
|
|
19
|
Deutsch L, Wrage M, Koops S, Glatzel M,
Uzunoglu FG, Kutup A, Hinsch A, Sauter G, Izbicki JR, Pantel K and
Wikman H: Opposite roles of FOXA1 and NKX2-1 in lung cancer
progression. Gene Chromosome Canc. 51:618–629. 2012. View Article : Google Scholar
|
|
20
|
Wang H, Meyer CA, Fei T, Wang G, Zhang F
and Liu XS: A systematic approach identifies FOXA1 as a key factor
in the loss of epithelial traits during the
epithelial-to-mesenchymal transition in lung cancer. BMC Genomics.
14:6802013. View Article : Google Scholar : PubMed/NCBI
|
|
21
|
Zhu X, Li D, Yu F, Jia C, Xie J, Ma Y, Fan
S, Cai H, Luo Q, Lv Z and Fan L: miR-194 inhibits the
proliferation, invasion, migration, and enhances the
chemosensitivity of non-small cell lung cancer cells by targeting
forkhead box A1 protein. Oncotarget. 7:13139–13152. 2016.
View Article : Google Scholar : PubMed/NCBI
|
|
22
|
Wang R, Shi Y, Chen L, Jiang Y, Mao C, Yan
B, Liu S, Shan B, Tao Y and Wang X: The ratio of FOXA1 to FOXA2 in
lung adenocarcinoma is regulated by LncRNA HOTAIR and chromatin
remodeling factor LSH. Sci Rep. 5:178262015. View Article : Google Scholar : PubMed/NCBI
|