Introduction
Diabetic kidney disease (DKD) is the primary cause
of end-stage kidney disease (ESRD) in western countries, and ~43.8%
of patients with ESRD have diabetes, according to a US renal data
system report (1). The incidence
rate of DKD has surpassed that of glomerulonephritis, which has led
to DKD becoming the major causative factor of ESRD in China
(2) and an increasingly
predominant cause of ESRD in other developing countries.
Long-term hyperglycemia in patients with diabetes
leads to intracellular glucose overload and energy stress. As a
result, a number of signaling pathways, including transforming
growth factor-β (TGF-β)-mothers against decapentaplegic homolog
2-mitogen-activated protein kinase 1 and tyrosine-protein kinase
JAK/signal transducer and activator of transcription, are activated
via similar mechanisms in different types of renal cells (3). The activation of the aforementioned
pathways leads to the impairment of mitochondrial structure and
function in kidney cells, which in turn leads to increased reactive
oxygen species (ROS) synthesis. The subsequent oxidative stress is
a key factor in podocyte and mesangial cell impairment and is a
common mechanism in multiple pathways that lead to DKD occurrence
and progression (3).
Early stage DKD is characterized by an increased
glomerular filtration rate, transient microalbuminuria, podocyte
and mesangial cell impairment, glomerular basement membrane (GBM)
thickening and extracellular matrix accumulation in the mesangium.
Increasing evidence indicates important roles for TGF-β in energy
and metabolic balance, mitochondrial stability and ROS synthesis
(4,5), which are major contributors to
podocyte depletion and kidney fibrosis.
A previous report demonstrated that peroxisome
proliferator-activated receptor γ (PPARγ) coactivator-1α (PGC-1α)
participates in mitochondrial biogenesis in tissues with high
energy consumption, including skeletal muscle and the heart, as a
key nuclear factor in energy and oxidative stress (6). PGC-1α is also highly expressed in the
kidney (7,8) and is reported to protect against
several kidney diseases. Specifically, PGC-1α upregulation has been
demonstrated to alleviate mitochondrial dysfunction in acute kidney
injury and an adriamycin nephrosis model (9,10).
However, to the best of our knowledge, the role of PGC-1α in DKD is
yet to be established.
PPARγ agonists, as major pharmaceutical inducers of
PGC-1α, have been widely employed to investigate the mechanisms of
PGC-1α (11–13). In the present study, the PPARγ
agonist rosiglitazone was used in a db/db mouse model of DKD to
investigate the effects of PGC-1α in vivo. Furthermore,
genetic regulation of PGC-1α was investigated in renal mesangial
cells to investigate the underlying mechanisms in vitro. The
results of the current study revealed a novel association between
PGC-1α expression and DKD progression and the underlying
mechanisms. These observations indicate that endogenous PGC-1α may
have potential as an effective therapeutic target in DKD.
Materials and methods
Animal experiments
Animal maintenance and experimental procedures were
approved by the Animal Care Committee of Ruijin Hospital, Shanghai
Jiao Tong University School of Medicine (Shanghai, China). A total
of 12 male db/db diabetic mice weighing 32–34 g with a C57BL/KsJ
(BKS.Cg-Dock7m+/+Leprdb/Nju) background and 6
male non-diabetic littermate control db/m mice weighing 16–18g (6
weeks old) were obtained from Nanjing Biomedical Research Institute
of Nanjing University (Nanjing, China). Mice were separated into
three groups (n=6/group) as follows: db/m (control); db/db (DKD
group) and db/db mice administered 20 mg/kg/day rosiglitazone
(Sigma-Aldrich; Merck KGaA, Darmstadt, Germany; RGZ group) by
gavage for 8 weeks. Mice were housed in a specific pathogen-free
room at a constant temperature of 22±2°C and a constant humidity of
50±5%, normal air CO2 and a 12-h light/dark cycle and
kept with free access to chow and water. Mice were sacrificed after
the treatment for 8 weeks.
Immortalized mouse podocyte
culture
Conditionally immortalized mouse podocytes were
kindly provided by Professor John Cijiang He (Department of
Nephrology, Icahn School of Medicine at Mount Sinai, New York City,
NY, USA) and cultured as previously described (14). Briefly, cells were cultured on
Corning Collagen I plates (Corning Incorporated, Corning, NY, USA)
at 33°C in RPMI 1640 medium (Gibco; Thermo Fisher Scientific, Inc.,
Waltham, MA, USA) with the presence of 20 U/ml mouse recombinant
interferon (IFN)-γ (R&D Systems, Inc., Minneapolis, MN, USA)
and 10% fetal bovine serum (FBS; Gibco; Thermo Fisher Scientific,
Inc.) to enhance the expression of thermosensitive T antigen.
Immortalized mouse podocyte cell lines are routinely characterized
in the laboratory on the basis of morphology and gene expression
patterns, prior to the experimentation. Immortalized cells for all
experiments in the current study were between passages 4 and 12. To
induce differentiation, podocytes were maintained in RPMI medium
and FBS at 37°C without IFN-γ for 10–12 days. Podocytes prepared
for experiments were serum deprived for 24 h prior to intervention,
followed by culture with D-glucose (Sigma-Aldrich; Merck KGaA) or
D-mannitol (Sigma-Aldrich; Merck KGaA) added to the cultures at 30
mM glucose as high-glucose stimulation or at 5.5 mM glucose and
24.5 mM mannitol as isotonic control for 24 or 48 h.
Mouse mesangial cell culture and
transfection
SV40 MES 13 mouse mesangial cells were obtained from
the American Type Culture Collection (Manassas, VA, USA) and
maintained in 3:1 mixture of Dulbecco's modified Eagle's medium
(Gibco; Thermo Fisher Scientific, Inc.) and Ham's F12 medium with
14 mM HEPES (Gibco; Thermo Fisher Scientific, Inc.) and 5% FBS
(Gibco; Thermo Fisher Scientific, Inc.) as full medium at 37°C with
5% CO2. The overexpression plasmid for PGC-1α and its
negative control were gifts from Professor Zhiguo Zhang (State Key
Laboratory of Medical Genomics, Shanghai Institute of Endocrine and
Metabolic Diseases, Shanghai Clinical Center for Endocrine and
Metabolic Diseases, Ruijin Hospital, Shanghai Jiaotong University
School of Medicine, Shanghai, China) (15). Mesangial cells were seeded at
3×10⁵ cells/well and were transfected using
Lipofectamine™ 3000 (Invitrogen; Thermo Fisher Scientific, Inc.)
with 2.5 µg plasmid DNA/well, according to the manufacturer's
protocol. A total of 24 h following transfection, cells were
stimulated at the concentration of 30 mM D-glucose (high glucose)
or 5.5 mM D-glucose + 24.5 mM D-mannitol (isotonic control) for 48
h.
Lentivirus production and cell
infection
The lentivirus suppressing PGC-1α was produced with
the short hairpin (sh)RNA sequence 5′-TCCAGTAAGCACACGTTTATT-3′. A
scrambled shRNA sequence 5′-TTCTCCGAACGTGTCACGT-3′ was used as the
negative control for shRNA-PGC-1α. Double-strand oligonucleotides
were inserted into the linear pLKO.1 vector (Genechem, Shanghai,
China) to produce the lentivirus. Briefly, two pairs of DNA primer
fragments with AgeI and EcoR I restriction sites were
synthesized and annealed to form double strands, which were ligated
with linear pLKO.1 vector by T4 ligase and confirmed by sequencing,
respectively. The Lenti-Easy Packaging System (cat. no. LPK001,
Genechem) was applied to generate the packaged virus with 293T cell
line (American Type Culture Collection) according to the
manufacturers' protocol. The SV40 MES 13 mouse mesangial cells were
seeded at 3×10⁵ cells/well in a 6-well plate with full
medium. The next day cells were washed with PBS and left for 2 h in
1 ml serum-free medium, each well containing 2×10⁶ viral
particles (the appropriate number of viral particles were
determined by a preliminary experiment, using puromycin screening).
Subsequently 1 ml full medium was added in each well and the medium
was replaced with fresh full medium after 24 h. A total of 72 h
following-infection, the expression of PGC-1α in infected SV40 MES
13 cells was confirmed by reverse transcription-quantitative
polymerase chain reaction (RT-qPCR) and D-glucose or D-mannitol
treatment (at the concentration of 30 mM D-glucose or 5.5 mM
D-glucose + 24.5 mM D-mannitol for 48 h) was administered.
Biochemical analysis of serum and
urine samples
Albumin concentration in urine was detected using
Mouse Albumin ELISA Quantitation Set (cat. no. E90-134) (Bethyl
Laboratories, Inc., Montgomery, TX, USA) and glucose concentration
in serum was detected by Glucose LiquiColor® (Enzymatic)
test kit (Stanbio Laboratory; EFK Diagnostics, Inc., Boerne, TX,
USA), according to the manufacturers' protocols. After 8 weeks of
treatment, urine was collected over 24 h in metabolic cages to
measure and calculate the urinary albumin excretion (UAE). Blood
from the caudal vein was collected for monitoring serum glucose
weekly. Briefly, 200 µl blood was collected into an Eppendorf tube
and placed at 4°C for 1 h until blood coagulation. Subsequently the
blood was centrifuged at 3,000 × g, 4°C for 10 min and serum
supernatant was collected and stored at −80°C prior to
analysis.
Mitochondrial superoxide dismutase
activity assay
Mitochondrial fractions of kidney cortexes of the
mice were isolated using Minute™ Mitochondria Isolation kit for
mammalian cells and tissues (cat. no. MP-007; Invent
Biotechnologies, Inc., Plymouth, MN, USA), according to the
manufacturer's protocol. The isolated mitochondria were solubilized
in Non-denatured Protein Solubilization reagent (Invent
Biotechnologies, Inc.) for downstream superoxide dismutase (SOD)
activity determination. SOD activity was detected using SOD assay
kit (WST-1 method; cat. no. A001-3; Jiancheng Bioengineering
Institute, Nanjing, China) and an iMark™ Microplate Reader (Bio-Rad
Laboratories, Inc., Hercules, CA, USA), according to the
manufacturers' protocols.
Kidney histopathology
Kidneys removed from euthanized mice and were
immediately cut in half, fixed in 10% formaldehyde in 0.1 mol/l PBS
(pH 7.2) at 4°C for 24 h, then embedded in paraffin and sectioned
at 4 µm. The 4-µm-sections were dewaxed in xylene, rehydrated
through decreasing concentrations of ethanol and washed in PBS.
Subsequently, for each sample, one section was stained with Harris
hematoxylin staining solution for 5 min and eosin staining solution
for 2 min (Goodbio Technology CO., LTD, Wuhan, China) as H&E
staining. For each sample, another section was stained with
Weigert's iron hematoxylin for 5 min, Ponceau S for 6 min,
molybdphosphoric acid resolution for 3 min and aniline blue for 5
min, as Masson's trichrome staining. All aforementioned staining
steps were performed at room temperature (23°C). Following
staining, sections were dehydrated through increasing
concentrations of ethanol and xylene. The general histological
alterations in glomerular and tubular structures were evaluated
under a light microscope.
Western blot analysis
Nuclear and cytosolic fractions of the kidney
cortexes were separated using NE-PER™ Nuclear and Cytoplasmic
Extraction reagents (Applied Biosystems; Thermo Fisher Scientific,
Inc.) and cells were lysed in radioimmunoprecipitation assay buffer
(Beyotime Institute of Biotechnology, Haimen, China) containing
protease inhibitor cocktail (Bimake, Houston, TX, USA) to extract
the total protein. The concentration of proteins was determined by
Bicinchoninic Acid (BCA) method using BCA Protein Assay kit (cat.
no. ZJ101; Shanghai Epizyme Biotechnology Co., Ltd., Shanghai,
China). A total of 30 µg cytoplasmic or total protein sample or 20
µg nuclear protein sample was loaded per lane. Electrophoretic
analysis of proteins was carried out on 10% SDS-PAGE gel and
transferred onto polyvinylidene difluoride membranes (EMD
Millipore, Billerica, MA, USA). Membranes were blocked with
QuickBlock™ Blocking Buffer (cat. no. P0252; Beyotime Institute of
Biotechnology) at room temperature on a horizontal shaker for 10
min. Subsequently the membranes were incubated with the primary
antibodies overnight at 4°C. For nuclear or cytoplasmic proteins of
renal cortex tissues and total proteins of SV40 MES 13 mouse
mesangial cells anti-PGC-1α (cat. no. ab3242; 1:1,000; EMD
Millipore) was used. For cytoplasmic proteins of renal cortex
tissues, anti-E-cadherin (cat. no. ab76055; 1:1,000; Abcam,
Cambridge, MA, USA), anti-collagen type 1 α1 (COL1α1; cat. no.
sc-8784; 1:200; Santa Cruz Biotechnology, Inc., Dallas, TX, USA)
and anti-α-smooth muscle actin (α-SMA; cat. no. sc-53015; 1:300;
Santa Cruz Biotechnology, Inc.) were used. For total proteins of
mice podocytes, anti-nephrin (cat. no. ab58968; 1:300; Abcam),
anti-synaptopodin (cat. no. sc-21537; 1:300; Santa Cruz
Biotechnology, Inc.) and anti-cleaved-caspase-3 (cat. no. 9661;
1:1,000; Cell Signaling Technology, Inc., Danvers, MA, USA) were
used. Anti-histone H2A.X (cat. no. 7631; 1:1,000; Cell Signaling
Technology, Inc.) and anti-β-actin (cat. no. ab8226; 1:2,000;
Abcam) were used as the loading controls for nuclear and
cytoplasmic/total protein expression, respectively. Subsequently,
membrane were incubated with anti-mouse immunoglobulin (Ig)G,
horseradish peroxidase (HRP)-conjugated antibody (cat. no. 7076;
1:2,000; Cell Signaling Technology, Inc.) or anti-rabbit IgG,
HRP-conjugated antibody (cat. no. 7074; 1:2,000; Cell Signaling
Technology, Inc.) for 1 h at room temperature on a horizontal
shaker. The bands were detected using Immobilon Western
Chemiluminescent HRP Substrate (cat. no. WBKLS0100; EMD Millipore)
and band intensities were quantified using ImageJ (version number
1.8.0; National Institutes of Health, Bethesda, MD, USA).
RT-qPCR
Total RNA from mouse podocytes and SV40 MES 13
mesangial cells was extracted using TRIzol reagent (Thermo Fisher
Scientific, Inc.). RNA concentration was determined with an ND-1000
spectrophotometer (NanoDrop Technologies; Thermo Fisher Scientific,
Inc.). First-strand cDNA synthesis was performed using 2 µg RNA
with High-Capacity cDNA Reverse Transcription kit with RNase
Inhibitor (Applied Biosystems; Thermo Fisher Scientific, Inc.),
according to the manufacturer's protocol. To test for genomic DNA
contamination, additional reactions were performed without the
addition of reverse transcriptase. qPCR was performed using the
SYBR® Green PCR Master Mix (Applied Biosystems; Thermo
Fisher Scientific, Inc.) and the StepOnePlus Real-Time PCR System
(Applied Biosystems; Thermo Fisher Scientific, Inc.) using the
two-step method and the following reaction conditions: Initial
denaturation at 95°C for 10 min; 40 cycles of 95°C for 15 sec, 60°C
for 60 sec, according to manufacturer's protocol. The primer
sequences used are presented in Table
I. mRNA expression was normalized to β-actin and quantified
using the comparative quantification cycle (2−ΔΔCq)
method (16).
 | Table I.Primer sequences used in the reverse
transcription-quantitative polymerase chain reaction to detect mRNA
expression. |
Table I.
Primer sequences used in the reverse
transcription-quantitative polymerase chain reaction to detect mRNA
expression.
| Gene | Forward primer
(5′-3′) | Reverse primer
(5′-3′) |
|---|
| NDUFS1 |
CACCCATTGGATTGTCCTATTT |
ACAGCACGCTTCCCCTCT |
| COX4I1 |
GCTTTCCCCACTTACGCTG |
TTGGTGCCCCTGTTCATCT |
| PGC-1α |
TGACAGATGGAGCCGTGACC |
TGTGGGTGTGGTTTGCTG |
| PPARγ |
TTTCAAGGGTGCCAGTTTCG |
GGGAGGCCAGCATCGTGT |
| PPRC1 |
ACTGCTTGCCCAACCTCAC |
ATCTGCCGCACCACGAC |
| NRF1 |
TCGTACCATCACAGACCGTAGT |
GCCCAGTTTTGTTCCACCT |
| β-actin |
GGCTGTATTCCCCTCCATCG |
CCAGTTGGTAACAATGCCATGT |
Measurement of intracellular ROS
Intracellular ROS levels were measured using an ROS
assay kit (Beyotime Institute of Biotechnology). Following
overexpression or knockdown of PGC-1α, SV40 MES 13 cells were
treated with 30 mM D-glucose or 5.5 mM D-glucose + 24.5 mM
D-mannitol for 48 h at 37°C and subsequently replaced by fresh
FBS-free medium for mesangial cells (mentioned above) with 10 µM
2′,7′-dichlorodihydrofluorescein diacetate (DCFH-DA) in Reactive
Oxygen Species Assay kit (Beyotime Institute of Biotechnology) to
stain for 60 min at 37°C. Following washing twice, fluorescence was
measured (485 nm excitation/528 nm emission) with a Synergy 2
fluorescence microplate reader (BioTek Instruments, Inc., Winooski,
VT, USA).
Statistical analysis
All experiments were repeated at least three times
and data are presented as the mean ± standard deviation.
Statistical analysis was performed using SPSS 22.0 (IBM Corp.,
Armonk, NY, USA) and significance was calculated with one way
analysis of variance followed by Tukey's post-hoc analysis for
multiple comparisons, or the Student's t-test for comparisons
between two groups. All tests were two tailed. P<0.05 was
considered to indicate a statistically significant difference.
Results
PPARγ agonist induces PGC-1α
expression in the kidney cortex of db/db mice
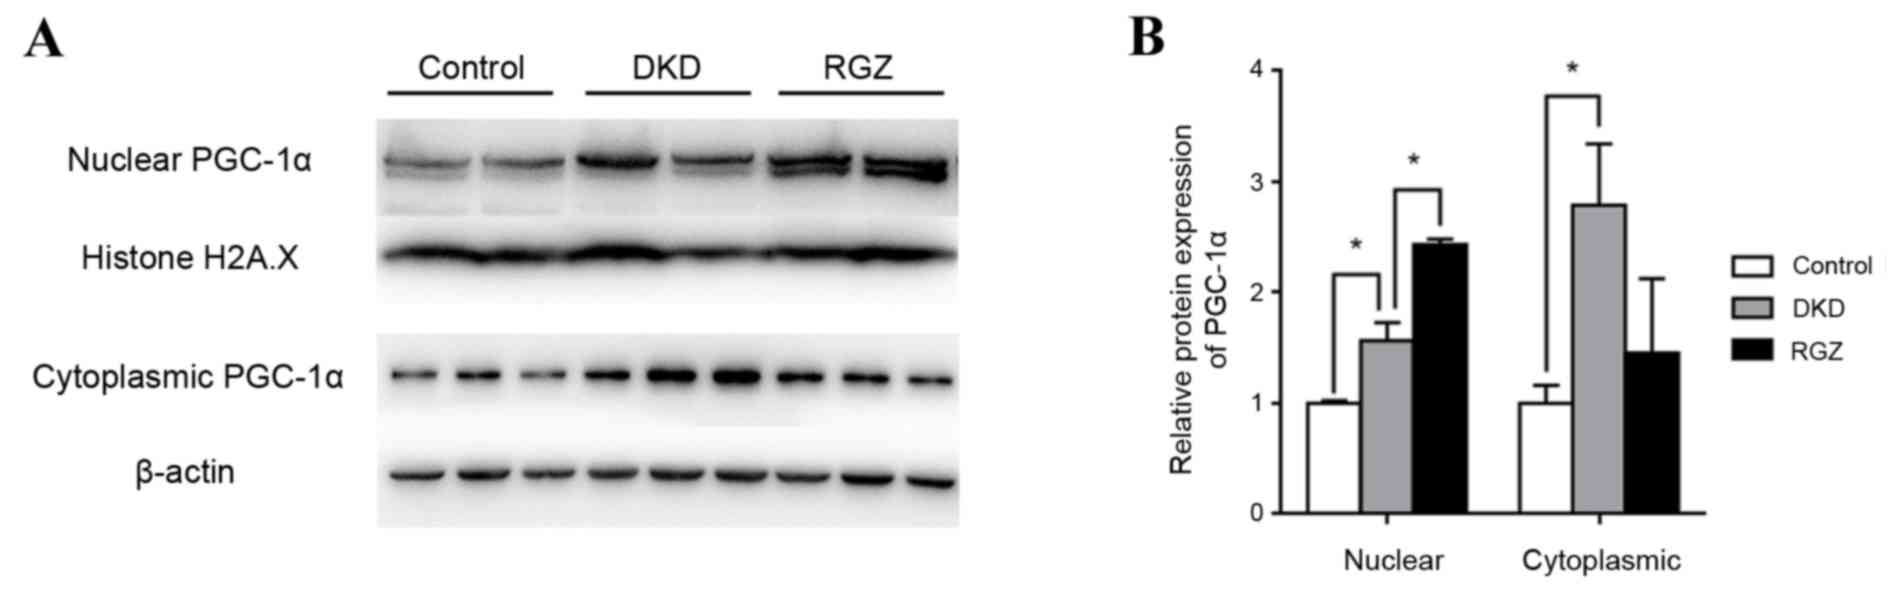
Control mice (db/m) were considered to exhibit basal
expression levels of PGC-1α protein (Fig. 1). PGC-1α protein expression was
significantly increased in the nuclear and cytoplasmic extractions
from db/db kidney cortex compared with the db/m controls
(P<0.05; Fig. 1). Furthermore,
PGC-1α expression was increased in rosiglitazone-treated DKD mice
(RGZ group) compared with the DKD group in the nuclear fraction,
but not in the cytoplasmic fraction (Fig. 1).
Pharmacological upregulation of PGC-1α
alleviates DKD in db/db mice
Serum glucose levels of the 6 week old db/db mice
(DKD and RGZ groups) were significantly higher compared with the
db/m control group (Fig. 2A).
However, levels decreased to control levels after 1 week of
rosiglitazone administration, while the DKD group exhibited a
consistently high serum glucose level throughout the experimental
period (Fig. 2A). After the 8 week
experimental period (14 week old mice), the UAE of the DKD group
was significantly increased compared with the control group, while
8 weeks of rosiglitazone treatment reduced the UAE of DKD mice
significantly (P<0.05; Fig.
2B). Additionally, mitochondrial SOD activity was reduced in
kidney cortexes of the DKD group compared with the control group
(P<0.05; Fig. 2C), while
rosiglitazone significantly reversed the inhibition of SOD activity
in DKD mice (P<0.05; Fig.
2C).
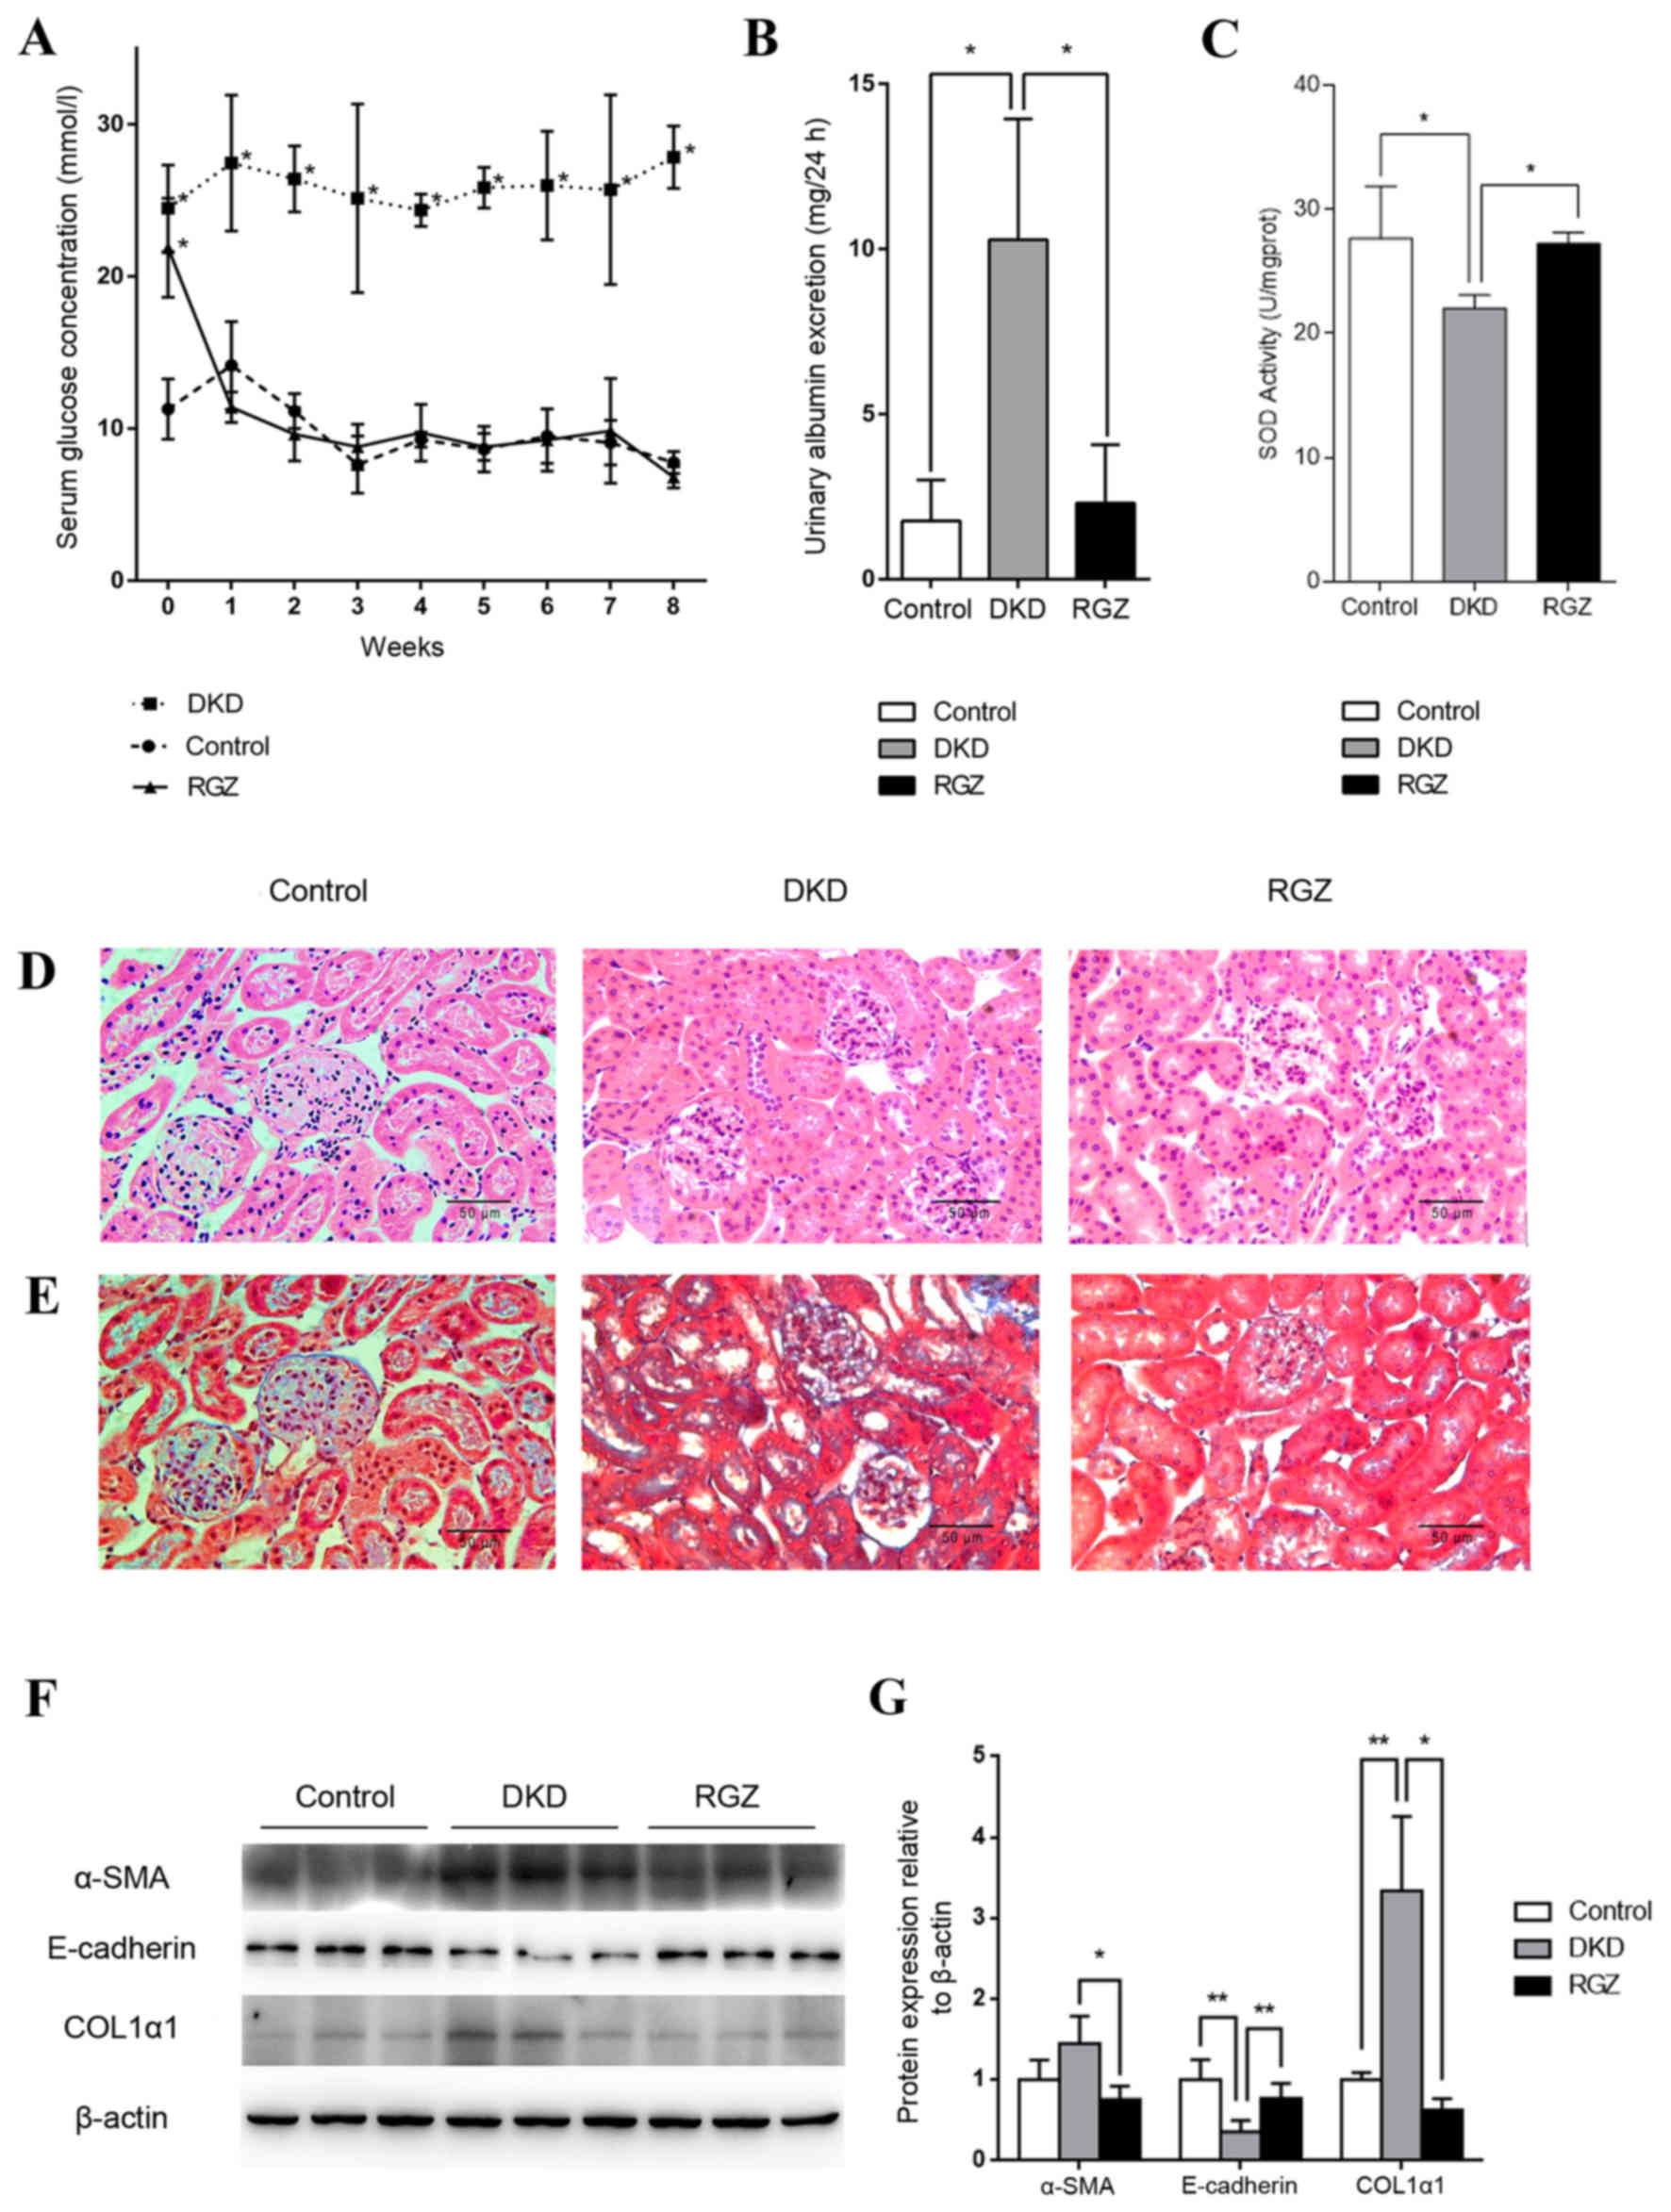 | Figure 2.Pharmacological upregulation of PGC-1α
by 20 mg/kg/day rosiglitazone treatment exhibited protective
effects against DKD in mice. (A) Serum glucose levels were detected
weekly in the control, DKD and RGZ groups. Data are presented as
the mean ± standard deviation (n=6 per group). *P<0.05 vs.
control at the same time point. (B) After 8 weeks of treatment, 24
h urinary albumin excretion in mice in control, DKD and RGZ groups.
n=6 per group. *P<0.05, as indicated. (C) Mitochondrial SOD
activity for mice after treatment for 8 weeks (n=6 per group).
*P<0.05, as indicated. Representative photomicrographs depicting
(D) hematoxylin and eosin and (E) Masson's trichome staining in the
control, DKD and RGZ groups after the 8 week experimental period.
Original magnification, ×400. (F) Western blot analysis of α-SMA,
E-cadherin, COL1α1 and β-actin protein expression in the renal
cortexes of control, DKD and RGZ mice. (G) Densitometric analysis
of western blot results. Relative band intensity was normalized to
the intensity of the respective β-actin signal. Data are presented
as the mean ± standard deviation (n=6 per group).*P<0.05 and
**P<0.01, as indicated. PGC-1α, peroxisome
proliferator-activated receptor γ coactivator-1α; DKD, diabetic
kidney disease; RGZ, rosiglitazone; α-SMA, α-smooth muscle actin;
COL1α1, collagen type 1 α1. |
H&E staining revealed obvious glomerular
hypertrophy and mesangial cell proliferation in the DKD group
compared with the control group (Fig.
2D), while Masson's trichome staining revealed substantial
mesangial matrix expansion, glomerulosclerosis and
tubulointerstitial in the DKD group (Fig. 2E). Rosiglitazone treatment resulted
in only minor differences compared with the control group and no
marked pathological characteristics were observed (Fig. 2D and E).
Furthermore, western blot analysis revealed a
significant decrease in E-cadherin protein expression and an
increase in COL1α1 expression in the renal tissues of the DKD group
compared with the control group (P<0.01; Fig. 2F and G). These proteins indicate
the occurrence of epithelial-mesenchymal transition (EMT) and
fibrosis. However, PGC-1α upregulation mediated by rosiglitazone
counteracted the alterations in α-SMA (P<0.05), E-cadherin
(P<0.01) and COL1A1 (P<0.05) expression in db/db mice
(Fig. 2F and G). Taken together,
these data indicate that PGC-1α upregulation by rosiglitazone in
db/db mice may lead to the amelioration of key DKD features,
including albuminuria, inhibited renal cortex mitochondrial SOD
activity and kidney fibrosis.
Impairment of high glucose on mouse
podocytes and renal mesangial cells
Following stimulation with high glucose
concentrations (30 mM) for 24 h, PGC-1α expression in mouse
podocytes increased moderately but significantly (P<0.05), and
PGC-1-related coactivator (PPRC1) was also upregulated (P<0.01),
compared with the 24 h D-mannitol group (Fig. 3A). However, after 48 h stimulation
with 30 mM glucose, the mRNA expression of PGC-1α, PPRC1, PPARγ,
downstream nuclear respiratory factor 1 (NRF1), NADH dehydrogenase
(ubiquinone) Fe-S protein 1 (NDUFS1) and cytochrome c oxidase
subunit 4I1 (COX4I1) of mitochondrial redox carriers in mouse
podocytes were all significantly downregulated compared with the
isotonic D-mannitol control (Fig.
3A). At the protein level, 48 h stimulation with 30 mM glucose
decreased the expression of specific podocyte marker proteins and
increased cleaved-caspase 3 expression (P<0.05; Fig. 3B and C) in mouse podocytes,
indicating potential podocyte injury and apoptosis. Additionally,
ROS levels were examined by DCF-DA fluorescence in cultured SV40
MES 13 mouse mesangial cells, and levels were markedly increased
following stimulation with 30 mM glucose for 48 h compared with the
synchronous D-mannitol stimulation at the same concentration
(Fig. 3D). These results indicate
that high glucose may induce mitochondrial dysfunction in cultured
podocytes and renal mesangial cells.
 | Figure 3.Mouse podocyte and renal mesangial
cell impairment by high glucose concentrations. (A) Effect of high
glucose on PGC-1α, PPRC1, PPARγ, NRF1, NDUFS1 and COX4I1 mRNA
expression. Mouse podocytes were cultured in 30 mM glucose medium
for 24 or 48 h. Medium containing 5.5 mM glucose with 24.5 mM
mannitol was applied as control. *P<0.05 and
#P<0.01, as indicated. (B) Western blot analysis of
nephrin, synaptopodin and cleaved-caspase-3 protein levels in
podocytes following treatment with 30 mM glucose. (C)
Quantification of average band intensity from four separate western
blots. Data are presented as the mean ± standard deviation (n=3).
*P<0.05, as indicated. (D) Levels of reactive oxygen species
were detected using dichlorofluorescin diacetate and were observed
with phase contrast bright-field (left panels) and epi-fluorescence
(right panels) microscopy in SV40 MES 13 cells stimulated with
either 30 mM D-mannitol (top) or 30 mM D-glucose (bottom) for 48 h.
Magnification, ×400. PPARγ, peroxisome proliferator-activated
receptor γ; PGC-1α, PPARγ coactivator-1α; PPRC1, PGC-1-related
coactivator; NRF1, nuclear respiratory factor 1; NDUFS1, NADH
dehydrogenase (ubiquinone) Fe-S protein 1; COX4I1, cytochrome C
oxidase subunit 4I1. |
Effect of genetic regulation of PGC-1α
in high glucose-stimulated renal mesangial cells
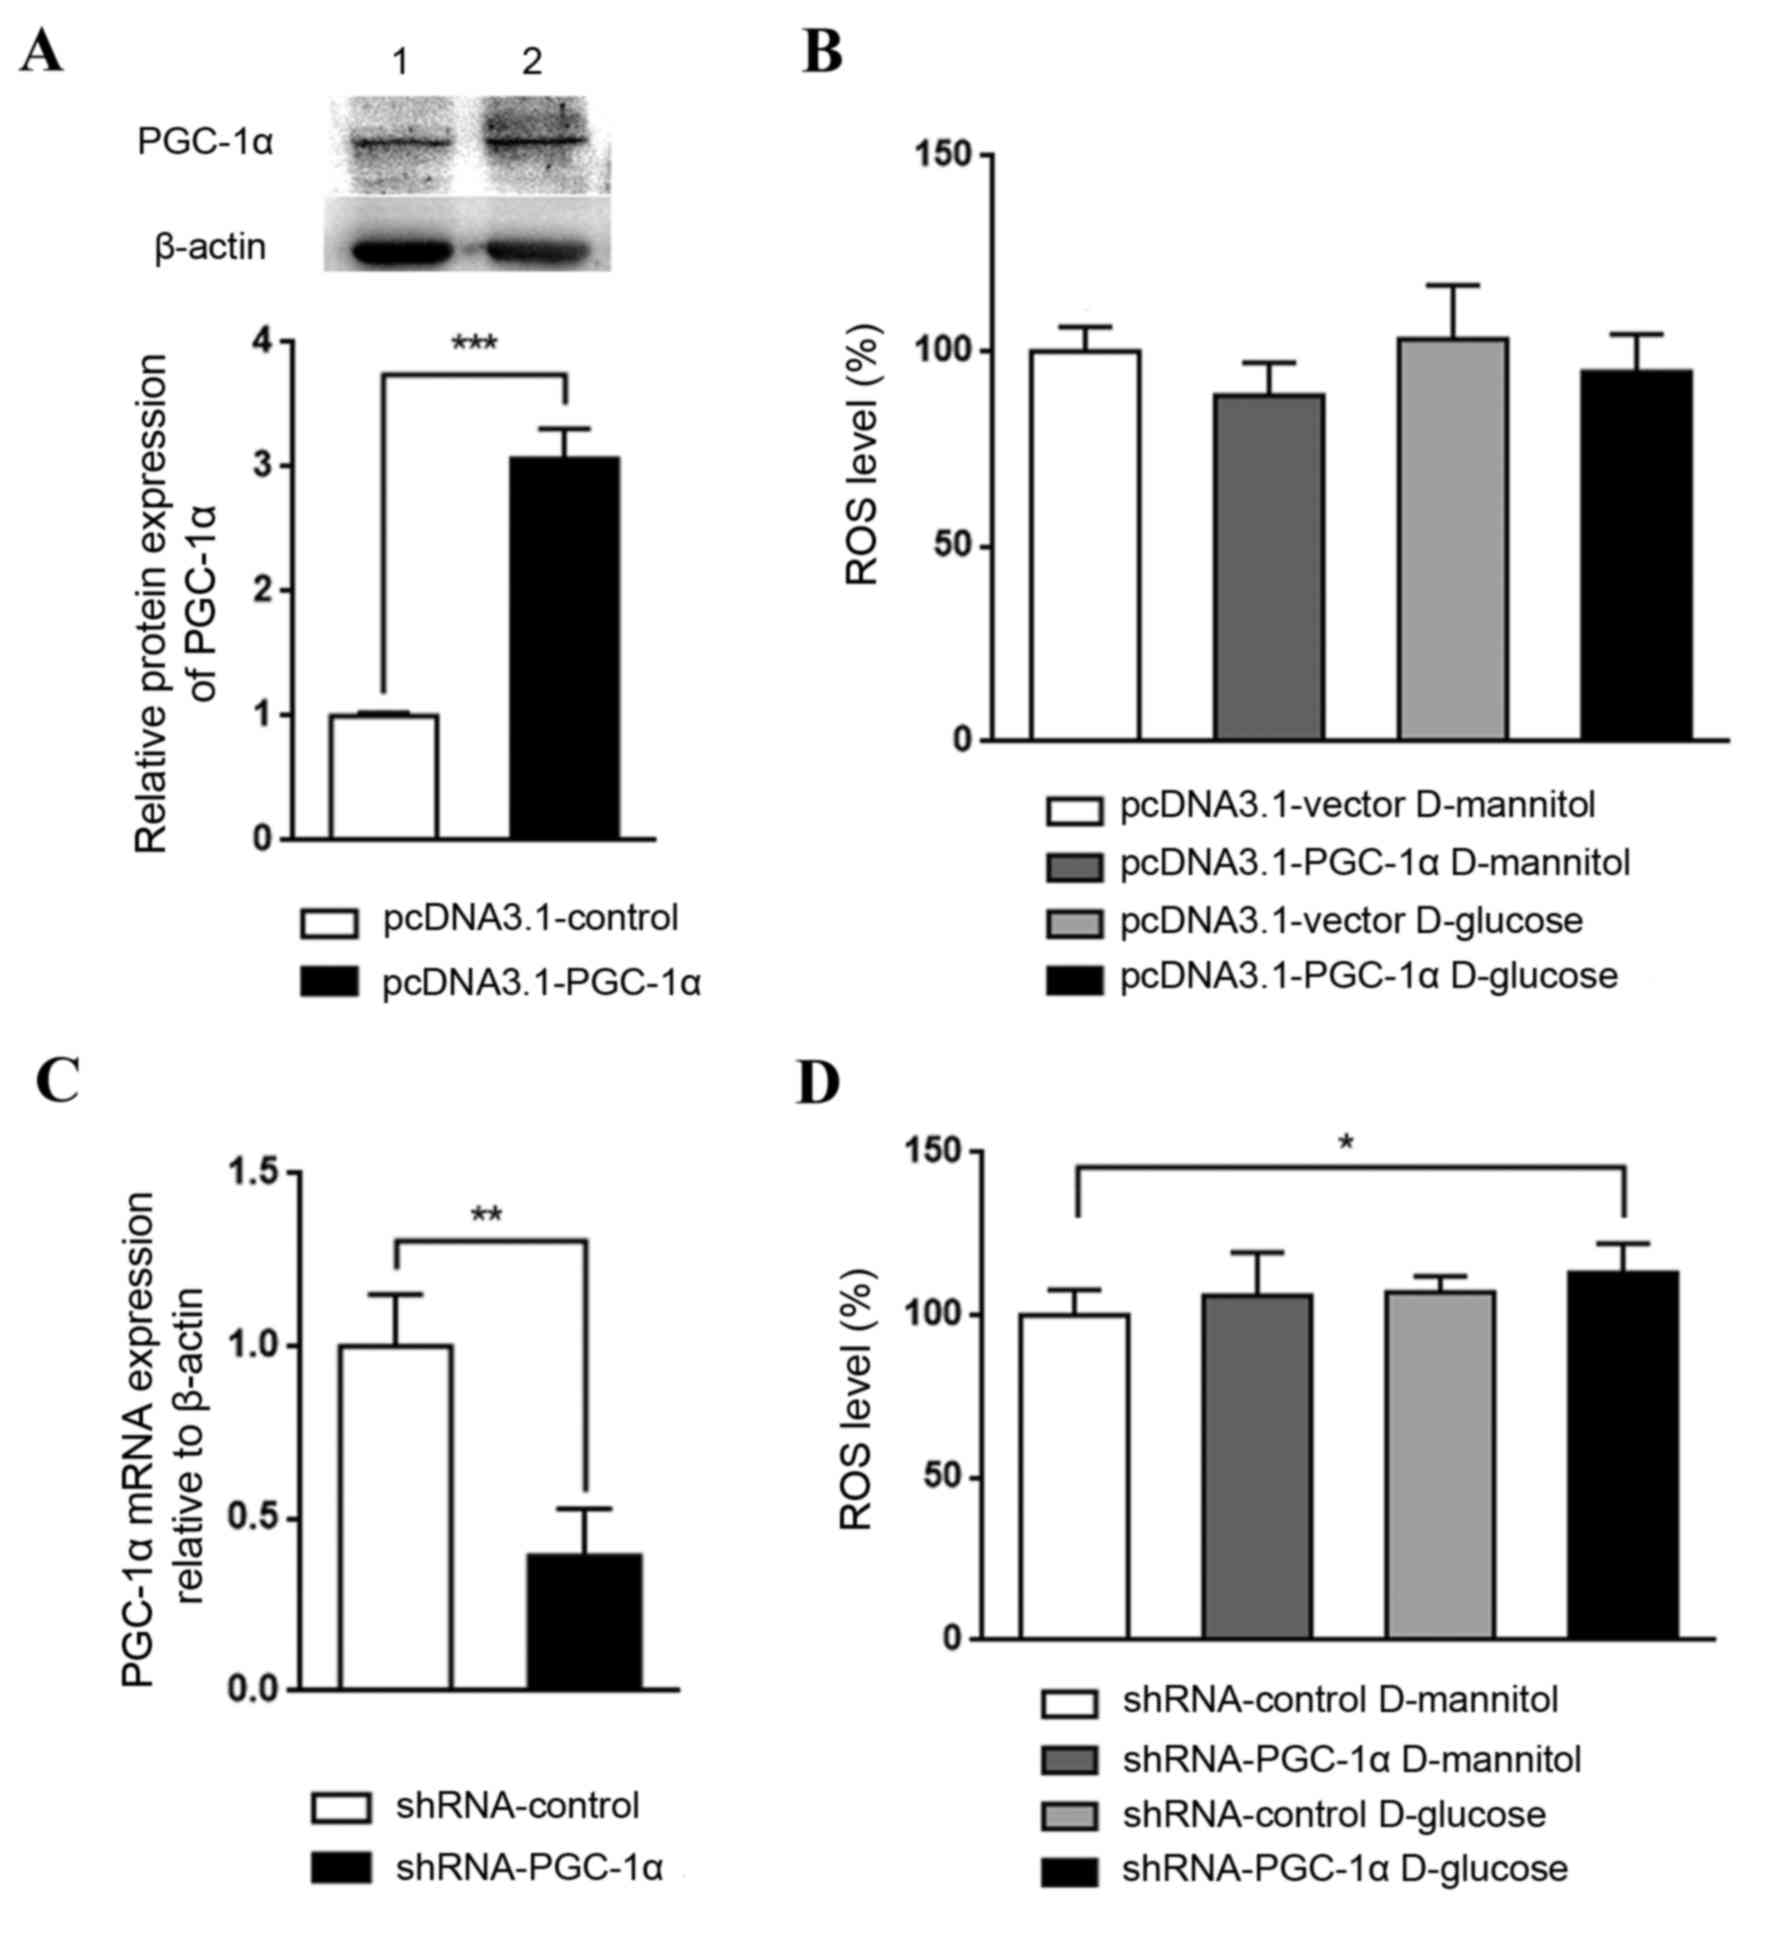
The role PGC-1α in renal mesangial cells in DKD was
investigated by establishing cells with overexpression or knockdown
of PGC-1α. PGC-1α overexpression, which was confirmed by western
blotting (Fig. 4A), appeared to
reduce ROS levels in cultured SV40 MES 13 cells, although not
significantly (Fig. 4B). By
contrast, PGC-1α knockdown, which was confirmed by RT-qPCR
(Fig. 4C), with glucose treatment
significantly increased ROS levels, compared with the shRNA-control
D-mannitol group (P<0.05; Fig.
4D). These results indicate that the downregulation of PGC-1α
may be a key step in DKD pathogenesis; PGC-1α activation may lead
to an antioxidative effect and may aid in halting DKD
progression
Discussion
Rosiglitazone is a pharmacological agonist of PPARγ
that promotes the expression of its coactivator, PGC-1α. As the
bridge for communication between homeostasis and mitochondrial
function, PGC-1α induces NRF1 and NRF2 activation, which are
nuclear-encoded transcription factors that promote the expression
of multiple nuclear-encoded genes involved in the regulation of
mitochondrial DNA transcription and the mitochondrial respiratory
chain, leading to an overall reduction in ROS synthesis (17,18).
Mitochondrial dysfunction and oxidative stress are
considered to be major pathogenic mechanisms in DKD. Although
PGC-1α is a major nuclear factor that maintains mitochondrial
dynamics and function, to the best of our knowledge, the effects
and underlying mechanisms of PGC-1α in DKD are yet to be
elucidated. Recent findings have also indicated a protective role
for PPARs in acute and chronic kidney disease, primarily through
anti-inflammatory action (19,20).
However, only a limited number of studies have investigated the
renoprotective effects of PPARγ agonists in regulating local and
systemic metabolism through mitochondrial biogenesis (19,20).
In the present study, increased levels of PGC-1α in
nuclear and cytosolic fractions were observed in the db/db mouse
model, and expression of E-cadherin was markedly reduced and COL1α1
levels increased, indicating that EMT and renal cortex tissue
fibrosis occurred in the db/db mice models aged 14 weeks, and
demonstrated pathological features of the early-stage DKD,
determined as previously described (21). Additionally, rosiglitazone
treatment induced PGC-1α expression in nucleus and significantly
ameliorated EMT and fibrosis compared with the DKD group. These
findings indicate that PGC-1α expression may be increased in the
early stage of DKD as a compensatory response, as observed in
cultured podocytes following glucose stimulation for 24 h.
Rosiglitazone promoted the protective effects of PGC-1α against
kidney fibrosis in DKD. In vitro and in vivo findings
were consistent, as in vitro experiments on cultured SV40
MES 13 renal mesangial cells demonstrated that PGC-1α knockdown
increased glucose-induced ROS levels. Thus, PGC-1α may have a
protective role in oxidative stress and mitochondrial function.
In the current study, PGC-1α upregulation was
observed in DKD mice in vivo and was consistent with the
observation that PGC-1α mRNA expression was increased in mouse
podocytes following glucose stimulation for 24 h. However, this
upregulation in mouse podocytes was reversed following a further 24
h stimulation. It is feasible that in the early stages of DKD, high
glucose concentrations cause overloading of mitochondria, leading
to the induction of PGC-1α expression to enhance mitochondrial
biogenesis and to reduce ROS synthesis, as a compensatory response.
However, eventual decompensation leads to a more severe impairment
in DKD. Upregulated PGC-1α expression was previously reported in
ATP depletion, exogenous ROS expression (22) and septicopyemia (23). In the present study, SV40 MES 13
renal mesangial cells stimulated with high glucose for 48 h
exhibited a higher fluorescence intensity, indicating higher ROS
levels compared with mannitol controls. However, this result was
not observed in the subsequent overexpression and knockdown studies
in SV40 MES 13 cells. Specifically, there was no significant
difference detected in ROS levels following high glucose treatment
in mesangial cells transfected with pcDNA3.1 vector or pLKO.1 shRNA
control. This result may be due to the influence of transfection
and infection, which has the potential to alter the susceptibility
of the cells to high glucose concentrations.
Mitochondria are the major source of ROS in the
majority of cell types (24). The
results of the present study revealed that the expression of key
mitochondrial respiratory chain complex components significantly
decreased when diabetic podocytes were stimulated with high
glucose, indicating potential mitochondrial impairment. Based on
this data, it may be hypothesized that intracellular ROS was
generated from the mitochondria to initiate multiple profibrotic
responses (25), leading to a
final outcome of kidney fibrosis in the context of diabetes.
In conclusion, the results of the current study
indicate that the PPARγ agonist rosiglitazone may induce PGC-1α
expression to maintain mitochondrial function and to reduce ROS
generation. It may ameliorate podocyte impairment, GBM thickening
and kidney fibrosis to aid in the prevention of DKD occurrence and
progression. These results for rosiglitazone treatment in the
present study indicated the potential ability of PPARγ agonists to
be employed and developed as future DKD therapies.
Acknowledgements
The present study was supported by the National Key
Research and Development Program of China (grant no.
2016YFC1305402), the National Natural Science Foundation of China
(grant nos. 81270782 and 30771000), the Research Project of Science
and Technology Commission of Shanghai Municipality (grant no.
15140902800), the Key Projects of National Basic Research Program
of China 973 (grant no. 2012CB517701) and the National Key
Technology R&D Program (grant no. 2011BAI10B00).
References
|
1
|
Collins AJ, Foley RN, Chavers B,
Gilbertson D, Herzog C, Johansen K, Kasiske B, Kutner N, Liu J, St
Peter W, et al: United States Renal Data System 2011 Annual Data
Report: Atlas of chronic kidney disease & end-stage renal
disease in the United States. Am J Kidney Dis. 59 1 Suppl 1:(A7):
e1–e420. 2012.
|
|
2
|
Zhang L, Long J, Jiang W, Shi Y, He X,
Zhou Z, Li Y, Yeung RO, Wang J, Matsushita K, et al: Trends in
chronic kidney disease in China. N Engl J Med. 375:905–906. 2016.
View Article : Google Scholar : PubMed/NCBI
|
|
3
|
Kanwar YS, Wada J, Sun L, Xie P, Wallner
EI, Chen S, Chugh S and Danesh FR: Diabetic nephropathy: Mechanisms
of renal disease progression. Exp Biol Med (Maywood). 233:4–11.
2008. View Article : Google Scholar : PubMed/NCBI
|
|
4
|
Abe Y, Sakairi T, Beeson C and Kopp JB:
TGF-β1 stimulates mitochondrial oxidative phosphorylation and
generation of reactive oxygen species in cultured mouse podocytes,
mediated in part by the mTOR pathway. Am J Renal Physiol.
305:F1477–F1490. 2013. View Article : Google Scholar
|
|
5
|
Casalena G, Daehn I and Bottinger E:
Transforming growth factor-beta, bioenergetics, and mitochondria in
renal disease. Semin Nephrol. 32:295–303. 2012. View Article : Google Scholar : PubMed/NCBI
|
|
6
|
Liu C and Lin JD: PGC-1 coactivators in
the control of energy metabolism. Acta Bioch Bioph Sin (Shanghai).
43:248–257. 2011. View Article : Google Scholar
|
|
7
|
Handschin C and Spiegelman BM: Peroxisome
proliferator-activated receptor gamma coactivator 1 coactivators,
energy homeostasis, and metabolism. Endocr Rev. 27:728–735. 2007.
View Article : Google Scholar
|
|
8
|
Andersson U and Scarpulla RC:
Pgc-1-related coactivator, a novel, serum-inducible coactivator of
nuclear respiratory factor 1-dependent transcription in mammalian
cells. Mol Cell Biol. 21:3738–3749. 2001. View Article : Google Scholar : PubMed/NCBI
|
|
9
|
Hickey FB, Corcoran JB, Docherty NG,
Griffin B, Bhreathnach U, Furlong F, Martin F, Godson C and Murphy
M: IHG-1 promotes mitochondrial biogenesis by stabilizing PGC-1α. J
Am Soc Nephrol. 22:1475–1485. 2011. View Article : Google Scholar : PubMed/NCBI
|
|
10
|
Tran M and Parikh SM: Mitochondrial
biogenesis in the acutely injured kidney. Nephron Clin Pract.
127:42–45. 2014. View Article : Google Scholar : PubMed/NCBI
|
|
11
|
Marmolino D, Manto M, Acquaviva F, Vergara
P, Ravella A, Monticelli A and Pandolfo M: PGC-1alpha
down-regulation affects the antioxidant response in Friedreich's
ataxia. PLoS One. 5:e100252010. View Article : Google Scholar : PubMed/NCBI
|
|
12
|
Miglio G, Rosa AC, Rattazzi L, Collino M,
Lombardi G and Fantozzi R: PPARgamma stimulation promotes
mitochondrial biogenesis and prevents glucose deprivation-induced
neuronal cell loss. Neurochem Int. 55:496–504. 2009. View Article : Google Scholar : PubMed/NCBI
|
|
13
|
Wenz T, Diaz F, Spiegelman BM and Moraes
CT: Activation of the PPAR/PGC-1alpha pathway prevents a
bioenergetic deficit and effectively improves a mitochondrial
myopathy phenotype. Cell Metab. 8:249–256. 2008. View Article : Google Scholar : PubMed/NCBI
|
|
14
|
Jin Y, Ratnam K, Chuang PY, Fan Y, Zhong
Y, Dai Y, Mazloom AR, Chen EY, D'Agati V, Xiong H, et al: A systems
approach identifies HIPK2 as a key regulator of kidney fibrosis.
Nat Med. 18:580–588. 2012. View
Article : Google Scholar : PubMed/NCBI
|
|
15
|
Zhang Z, Zhang H, Li B, Meng X, Wang J,
Zhang Y, Yao S, Ma Q, Jin L, Yang J, et al: Berberine activates
thermogenesis in white and brown adipose tissue. Nat Commun.
5:54932014. View Article : Google Scholar : PubMed/NCBI
|
|
16
|
Livak KJ and Schmittgen TD: Analysis of
relative gene expression data using real-time quantitative PCR and
the 2(-Delta Delta C(T)) method. Methods. 25:402–408. 2001.
View Article : Google Scholar : PubMed/NCBI
|
|
17
|
Weinberg JM: Mitochondrial biogenesis in
kidney disease. J Am Soc Nephrol. 22:431–436. 2011. View Article : Google Scholar : PubMed/NCBI
|
|
18
|
Ishimoto Y and Inagi R: Mitochondria: A
therapeutic target in acute kidney injury. Nephrol Dial Transpl.
31:1062–1069. 2016. View Article : Google Scholar
|
|
19
|
Ruan X, Zheng F and Guan Y: PPARs and the
kidney in metabolic syndrome. Am J Physiol Renal Physiol.
294:F1032–F1047. 2008. View Article : Google Scholar : PubMed/NCBI
|
|
20
|
Wang XX, Jiang T and Levi M: Nuclear
hormone receptors in diabetic nephropathy. Nat Rev Nephrol.
6:342–351. 2010. View Article : Google Scholar : PubMed/NCBI
|
|
21
|
Sharma K, McCue P and Dunn SR: Diabetic
kidney disease in the db/db mouse. Am J Physiol Renal Physiol.
284:F1138–F1144. 2003. View Article : Google Scholar : PubMed/NCBI
|
|
22
|
St-Pierre J, Drori S, Uldry M, Silvaggi
JM, Rhee J, Jäger S, Handschin C, Zheng K, Lin J, Yang W, et al:
Suppression of reactive oxygen species and neurodegeneration by the
PGC-1 transcriptional coactivators. Cell. 127:397–408. 2006.
View Article : Google Scholar : PubMed/NCBI
|
|
23
|
Haden DW, Suliman HB, Carraway MS,
Welty-Wolf KE, Ali AS, Shitara H, Yonekawa H and Piantadosi CA:
Mitochondrial biogenesis restores oxidative metabolism during
Staphylococcus aureus sepsis. Am J Resp Crit Care. 176:768–777.
2007. View Article : Google Scholar
|
|
24
|
Lambert AJ and Brand MD: Reactive oxygen
species production by mitochondria. Methods Mol Biol. 554:165–181.
2009. View Article : Google Scholar : PubMed/NCBI
|
|
25
|
Coughlan MT and Sharma K: Challenging the
dogma of mitochondrial reactive oxygen species overproduction in
diabetic kidney disease. Kidney Int. 90:272–279. 2016. View Article : Google Scholar : PubMed/NCBI
|