Introduction
Ovarian cancer (OC) is the seventh most commonly
diagnosed cancer in women in the USA and the average five-year
survival rate of patients with OC in the USA is 45% (1). OC frequently recurs following
treatment (2). Furthermore, 20% of
patients with stage I and II cancer experience recurrence within a
5 year period in the USA (1).
Recurrence is closely associated with the prognosis of OC (1), and, therefore, there is a requirement
for novel biomarkers to predict recurrence of OC in order to
improve the outcome of patients with OC.
Previous studies have identified numerous relevant
prognostic biomarkers (3–5). Elevated levels of serum interleukin
(IL)-37 are predictive of poor prognosis in patients with
epithelial OC (6). Sprouty 2 is an
independent prognostic biomarker for the survival and recurrence of
human epithelial OC (7). IL-8 has
been revealed to represent a biomarker for prognostic prediction in
patients with recurrent platinum-sensitive OC (8). In addition, upregulation of Golgi
phosphoprotein 3 is associated with poor prognosis in patients with
epithelial OC (9). Class III
β-tubulin overexpression within the tumor microenvironment has been
demonstrated to represent a prognostic biomarker for poor overall
survival in patients with OC (10). Mitogen-activated protein
kinase/extracellular signal-regulated kinase 1 has been reported to
represent a promising candidate prognostic biomarker and to be
correlated with response rates to platinum based chemotherapy in OC
(11). Flap structure-specific
endonuclease 1 overexpression has been revealed to be associated
with the poor survival of patients exhibiting high grade and
advanced stage OC (12). In
addition, overexpression of fibroblast growth factor 18 (FGF18) is
an independent predictive marker for poor clinical outcome in
patients with OC, and FGF18 has been demonstrated to regulate OC
cell migration, invasion and tumorigenicity via nuclear factor-κB
activation (13). Tumor necrosis
factor α-induced protein 8 overexpression is associated with
epithelial OC metastasis and poor survival, and, therefore, can
function as a prognostic and therapeutic biomarker for epithelial
OC (14). However, biomarkers with
a greater accuracy are required to predict recurrence and prognosis
of OC.
In the present study, data of samples from patients
with recurrent and non-recurrent OC in three gene expression
datasets were analyzed to identify differentially expressed genes
(DEGs). Following this, relevant feature genes were identified and
subsequently used to establish a support vector machine (SVM)
classifier, the results of which were further verified using
independent data. The results of the present study suggested that
the SVM classifier may facilitate the prediction of OC recurrence
and prognosis.
Materials and methods
Gene expression data
Gene expression data were retrieved from the Gene
Expression Omnibus (www.ncbi.nlm.nih.gov/geo) by searching for the
following key words: ‘Ovarian cancer,’ ‘recurrence,’ ‘homo sapiens’
and ‘recurrence.’ Datasets were selected for further analysis if
they fulfilled the following criteria: i) Included gene expression
profiles of patients with OC; and ii) included gene expression
profiles of patients with recurrent and non-recurrent OC. Following
this, three gene expression datasets [GSE17260 (15), GSE44104 (16) and GSE51088 (17)] were downloaded for subsequent
analysis (Table I).
 | Table I.Summary of gene expression datasets
used in the present study. |
Table I.
Summary of gene expression datasets
used in the present study.
| Accession
number | Platform | Recurrence
samples | Non-recurrence
samples | Total number of
samples |
|---|
| GSE17260 | GPL6480 | 76 | 34 | 110 |
| GSE44104 | GPL570 | 20 | 40 | 60 |
| GSE51088 | GPL7264 | 17 | 130 | 147 |
Background correction and normalization were
performed using gene expression dataset GSE44104 with package
affy 1.42.3 (18) of R
3.1.0 (19). Missing values were
filled using the median value (20). Microarray Suite (21) was used to perform background
correction. The quantile method was used for standardization.
Screening of DEGs
Prior to meta-analysis, the characteristics of the
three gene expression datasets were investigated by principal
component analysis (PCA) and standardized mean rank using the
MetaQC package (22). The
homogeneity test of gene expression profiles among datasets
(internal quality control), homogeneity test of gene expression
profiles with pathway database (external quality control), accuracy
quality control, accuracy of feature genes and pathways,
consistency quality control and consistency in the ranking of
feature genes and pathways were investigated for quality control
purposes using the MetaQC package.
DEGs were screened for using MetaDE.ES from
the MetaDE package (23).
Firstly, tests for heterogeneity of gene expression value in
numerous platforms were performed using three statistical
parameters: Tau2, Q value and Cochran's Q value. Values
of tau2=0 and Cochran's Q value >0.05 served as the
criteria for the identification of homogenous genes. Following
this, the false discovery rate (<0.05) of DEGs between
non-recurrent samples and recurrent samples within each dataset was
investigated. Two-way clustering analysis of sample data from
patients with recurrent and non-recurrent OC in each dataset was
performed using selected DEGs and then visualized by a heatmap
using R 3.1.0 (19).
Construction of a protein-protein
interaction (PPI) network
PPI information was downloaded from Biological
General Repository for Interaction Datasets (BioGRID; thebiogrid.org), Human Protein Reference Database
(HPRD; www.hprd.org) and Database of
Interacting Proteins (DIP; dip.doe-mbi.ucla.edu). Using Cytoscape version 3.5.1
(http://www.cytoscape.org/) (24), DEGs were mapped into the downloaded
PPIs to construct the PPI network. Gene Ontology (GO; www.geneontology.org) enrichment analysis and Kyoto
Encyclopedia of Genes and Genomes (KEGG) pathway enrichment
analysis (www.kegg.jp) were performed for the
genes in the PPI network using Fisher's exact test using Cytoscape
version 3.5.1.
Construction of the SVM
classifier
To determine which genes in the PPI network could be
classified as hub genes, the degree of nodes and betweenness
centrality (BC) scores were determined (25). The BC score was calculated as
follows using the igraph package version 1.2.1 in R 3.1.0
(https://cran.r-project.org/web/packages/igraph/index.html).
CB(v)=∑t≠v≠u∈Vσst(v)σst
Here, σst is the number of shortest paths
from s to t; σst (ν) is the number of shortest
paths from s to t that pass node v; BC
score is between 0 and 1, and greater BC score indicates
higher degree of hubness in the network.
The top 100 DEGs, as determined by BC scores, were
selected as candidate feature genes. The dataset GSE17260 was
selected as the training set because the sample is larger than the
other datasets, and the difference between the number of
non-recurrent samples and recurrent samples is relatively small. An
optimum combination of feature genes was determined by performing
recursive feature elimination using R caret_6.0–79 (https://cran.r-project.org/web/packages/caret/)
(26). The SVM classifier was
subsequently established to predict OC recurrence based on the
expression levels of the screened feature genes.
The other two datasets (GSE44104 and GSE51088) were
used to further verify the results of the SVM classifier.
Sensitivity, specificity, positive predictive value (PPV), negative
predictive value (NPV) and area under the receiver operating
characteristic curve (AUROC) values were determined to evaluate the
performance of the established SVM classifier.
Verification of results generated by
the SVM classifier using independent data
A further set of microarray data from samples of
patients with OC was downloaded from the Cancer Genome Atlas (TCGA;
http://cancergenome.nih.gov/) (27) and used to further verify the
results of the SVM classifier. This dataset contained 222 recurrent
and 173 non-recurrent OC samples. The OC samples were classified
into two groups: Predicted recurrent OC samples and predicted
non-recurrent OC samples. Kaplan-Meier (KM) survival curves were
then plotted for the two groups to determine the reliability of the
SVM classifier regarding patient prognosis.
Results
DEGs
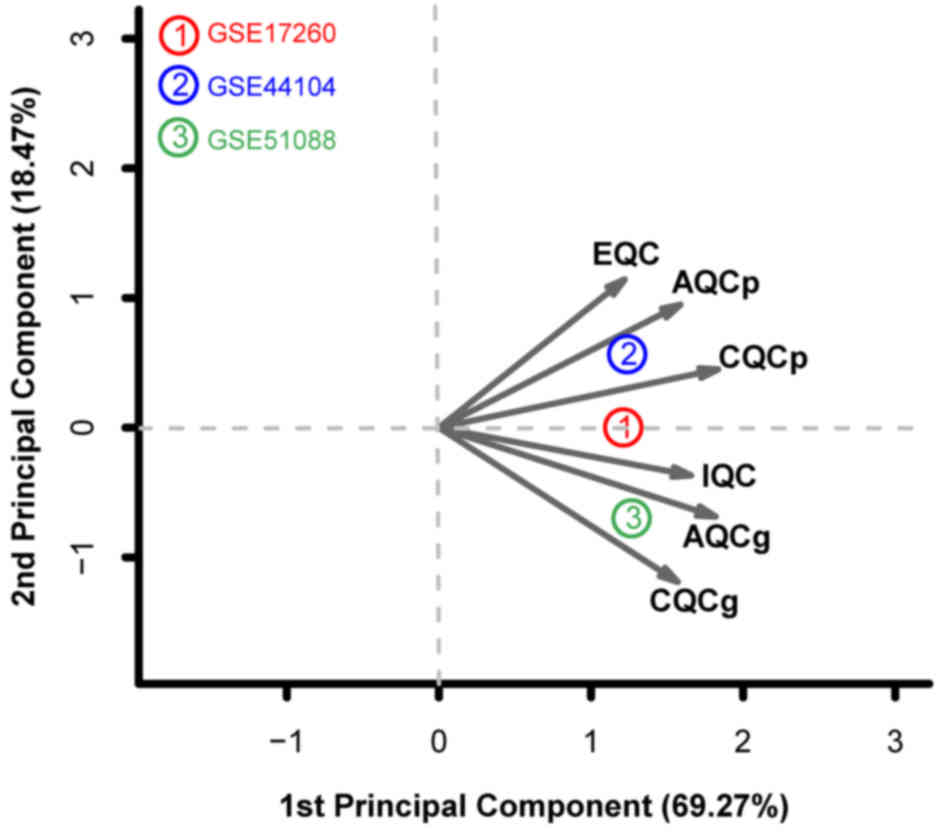
Quality control analysis using data from the three
gene expression datasets (GSE17260, GSE44104 and GSE51088) revealed
that there was no significant bias among these datasets according
to the SMR values (Table II)
(22). In addition, PCA analysis
revealed that all three datasets are distributed on the same side
of the arrow, which suggest good comparability. (Fig. 1). For this reason, all three
datasets were retained for subsequent analysis in the present
study.
| Table II.Results of quality control measures
and standardized mean rank test from data included in GSE17260,
GSE44104 and GSE51088 datasets. |
Table II.
Results of quality control measures
and standardized mean rank test from data included in GSE17260,
GSE44104 and GSE51088 datasets.
| Accession
number | IQC | EQC | CQCg | CQCp | AQCg | AQCp | SMR |
|---|
| GSE17260 | 5.48 | 3.36 | 110.95 | 165.26 | 34.03 | 94.54 | 1.69 |
| GSE44104 | 4.55 | 3.29 |
66.72 | 152.42 | 27.52 | 100.64 | 2.51 |
| GSE51088 | 6.33 | 1.14 | 105.17 | 118.9 | 20.32 | 30.64 | 4.08 |
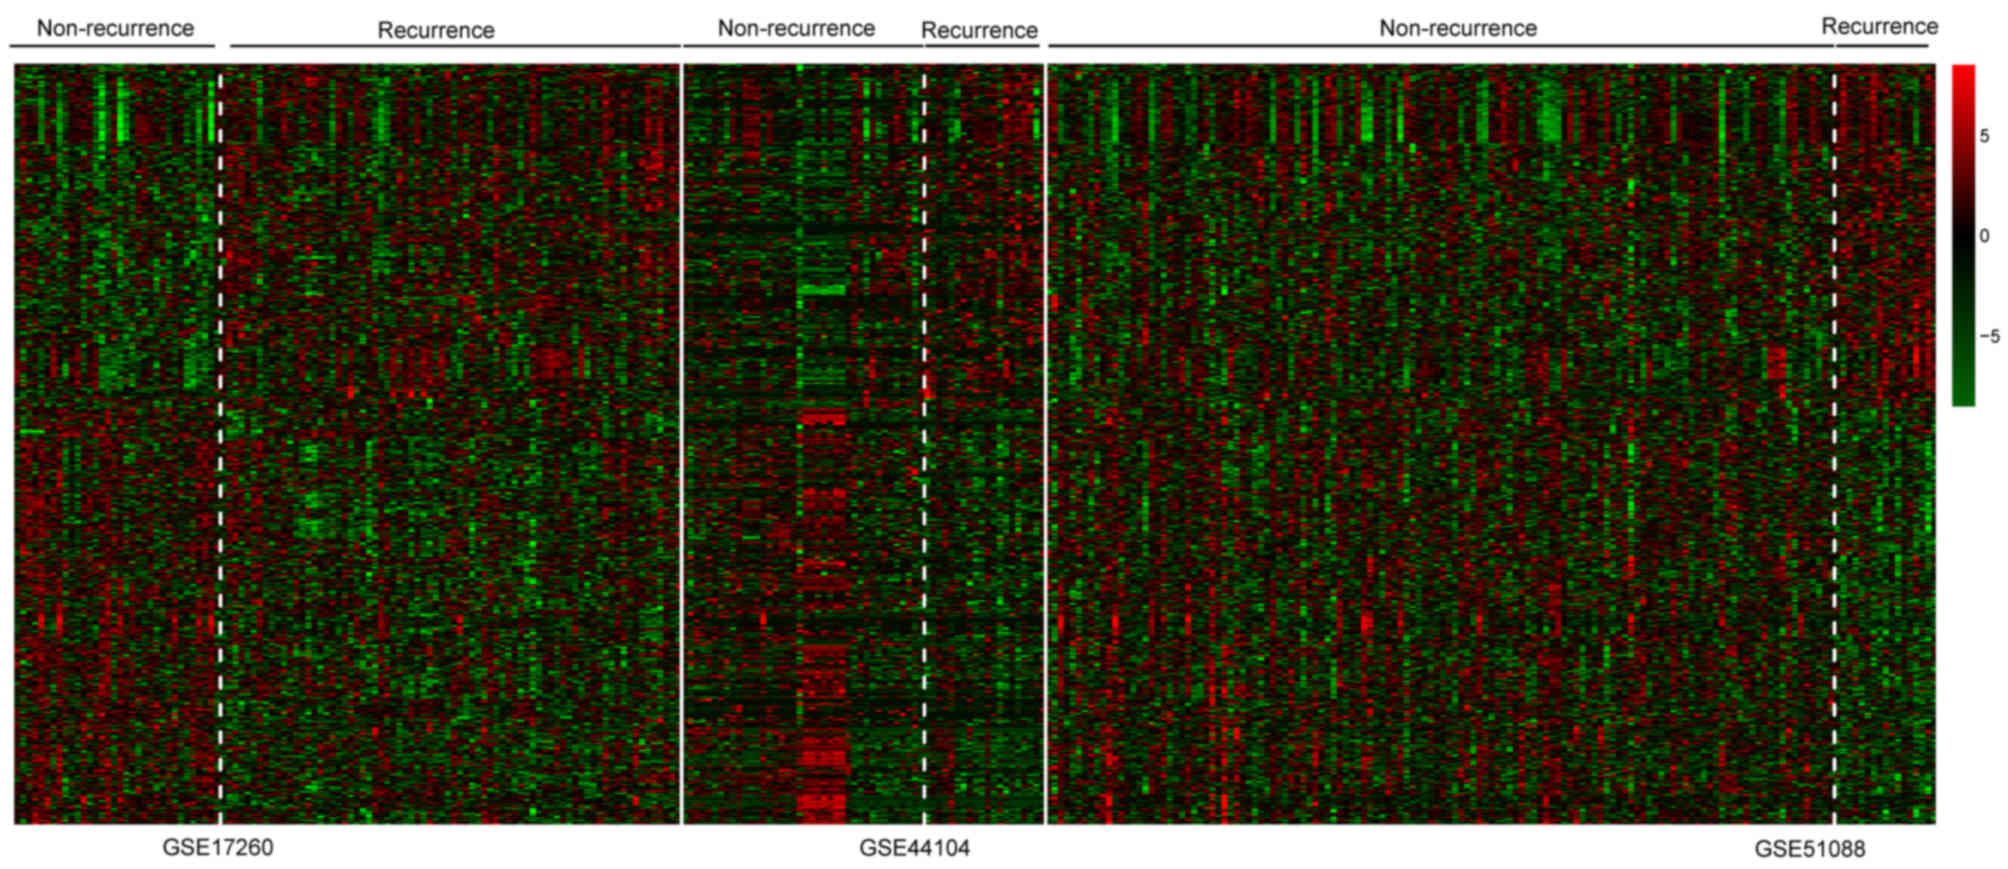
Based on the aforementioned criteria, a total of 639
DEGs were identified from the GSE17260, GSE44104 and GSE51088
datasets, including 279 upregulated DEGs and 360 downregulated
DEGs. The heatmap of two-way clustering revealed marked differences
in gene expression between the patient samples with recurrent and
non-recurrent OC in each dataset (Fig.
2).
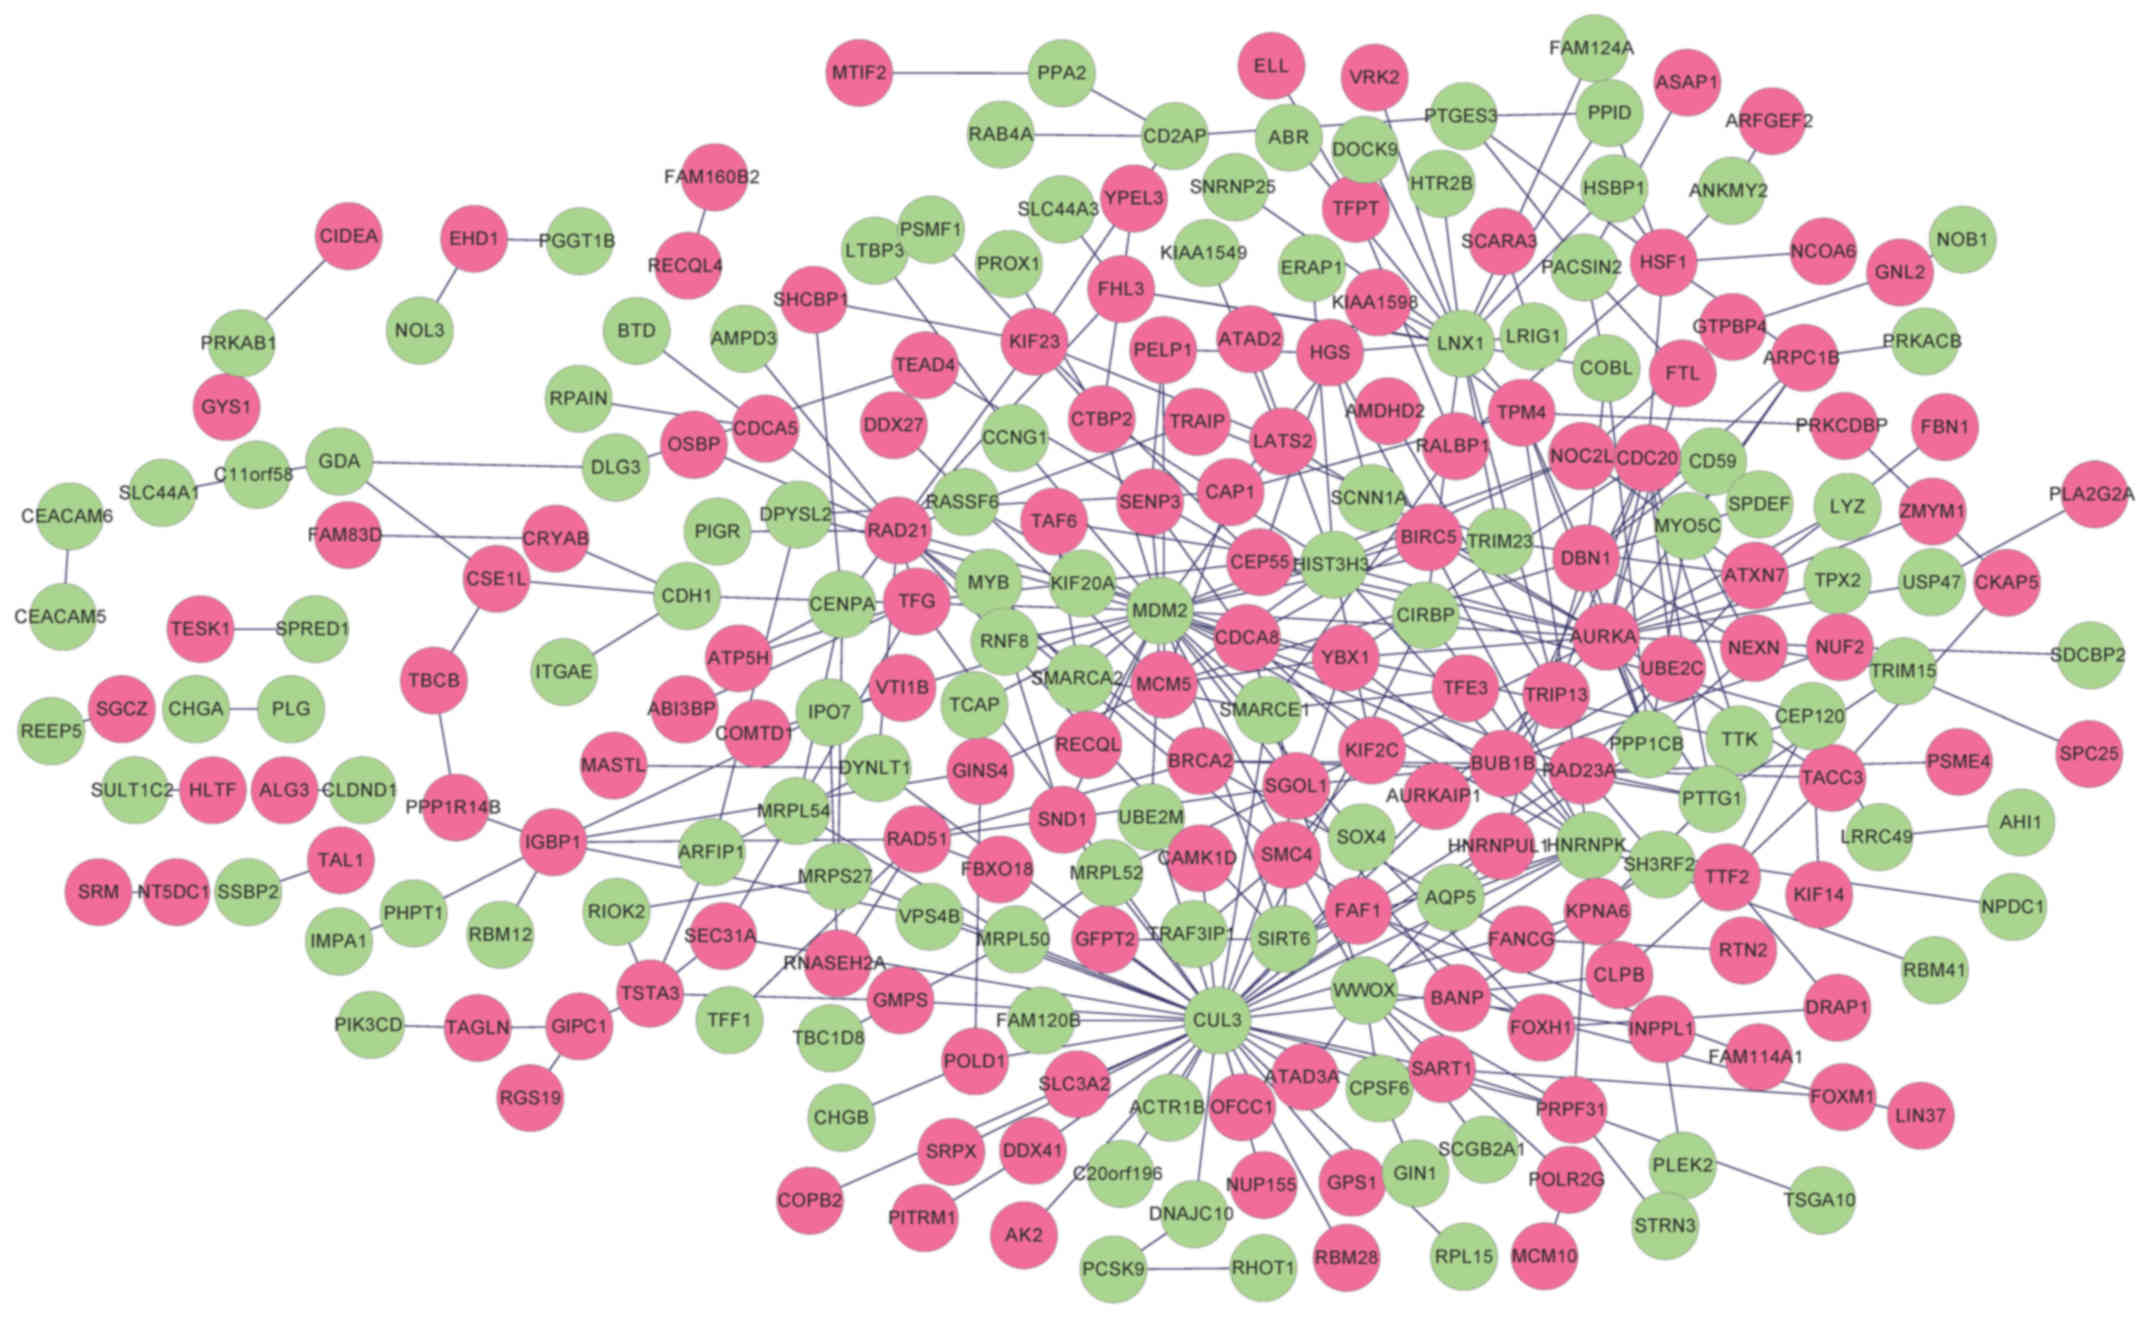
PPI network
A total of 321 and 296 PPIs for selected DEGs were
identified in HPRD and BioGRID, respectively. Overlapping PPIs were
selected and visualized using Cytoscape (Fig. 3). The constructed PPI network
contained 249 nodes (115 downregulated genes and 134 upregulated
genes) and 354 edges. Functional enrichment analysis revealed the
genes in the PPI network were significantly associated with 14 GO
terms, including ‘cell cycle phase’, ‘M phase’, ‘mitotic cell
cycle’ and ‘cell cycle process’ (Table III). Furthermore, five KEGG
pathways, including ‘cell cycle’, ‘homologous recombination’,
‘purine metabolism’, ‘pathways in cancer’ and ‘DNA replication’
were revealed to be significantly enriched for the genes in the PPI
network (Table IV).
| Table III.Gene Ontology biological process
terms significantly associated with the genes included in the
protein-protein interaction network. |
Table III.
Gene Ontology biological process
terms significantly associated with the genes included in the
protein-protein interaction network.
| Term | Count | P-value | FDR |
|---|
| GO:0022403, cell
cycle phase | 33 |
8.56×10⁻¹⁵ |
1.40×10⁻¹¹ |
| GO:0000279, M
phase | 29 |
4.41×10⁻¹⁴ |
7.23×10⁻¹¹ |
| GO:0000278, mitotic
cell cycle | 30 |
1.24×10⁻¹³ |
2.04×10⁻¹⁰ |
| GO:0022402, cell
cycle process | 36 |
3.14×10⁻¹³ |
5.15×10⁻¹⁰ |
| GO:0007067,
mitosis | 23 |
1.12×10⁻¹² |
1.83×10⁻⁹ |
| GO:0000280, nuclear
division | 23 |
1.12×10⁻¹² |
1.83×10⁻⁹ |
| GO:0000087, M phase
of mitotic cell cycle | 23 |
1.61×10⁻¹² |
2.64×10⁻⁹ |
| GO:0007049, cell
cycle | 41 |
1.90×10⁻¹² |
3.12×10⁻⁹ |
| GO:0048285,
organelle fission | 23 |
2.52×10⁻¹² |
4.13×10⁻⁹ |
| GO:0051301, cell
division | 24 |
5.77×10⁻¹¹ |
9.47×10⁻⁸ |
| GO:0000226,
microtubule cytoskeleton organization | 13 |
1.65×10⁻⁶ |
2.71×10⁻³ |
| GO:0007051, spindle
organization | 8 |
3.67×10⁻⁶ |
6.02×10⁻³ |
| GO:0007017,
microtubule-based process | 16 |
4.71×10⁻⁶ |
7.72×10⁻³ |
| GO:0007010,
cytoskeleton organization | 21 |
6.25×10⁻⁶ |
1.03×10⁻² |
| Table IV.Significantly enriched Kyoto
Encyclopedia of Genes and Genomes pathways for genes in the
protein-protein interaction network. |
Table IV.
Significantly enriched Kyoto
Encyclopedia of Genes and Genomes pathways for genes in the
protein-protein interaction network.
| Term | Count | P-value | Genes |
|---|
| hsa04110:Cell
cycle | 7 |
6.62×10⁻³ | RAD21, BUB1B, MDM2,
TTK, CDC20, PTTG1, MCM5 |
| hsa03440:Homologous
recombination | 3 |
5.47×10⁻³ | POLD1, BRCA2,
RAD51 |
| hsa00230:Purine
metabolism | 6 |
3.57×10⁻² | POLR2G, GDA, POLD1,
AK2, AMPD3, GMPS |
| hsa05200:Pathways
in cancer | 9 |
4.44×10⁻² | CTBP2, RALBP1,
PIK3CD, TFG, MDM2, BRCA2, BIRC5, CDH1, RAD51 |
| hsa03030:DNA
replication | 3 |
4.51×10⁻² | POLD1, RNASEH2A,
MCM5 |
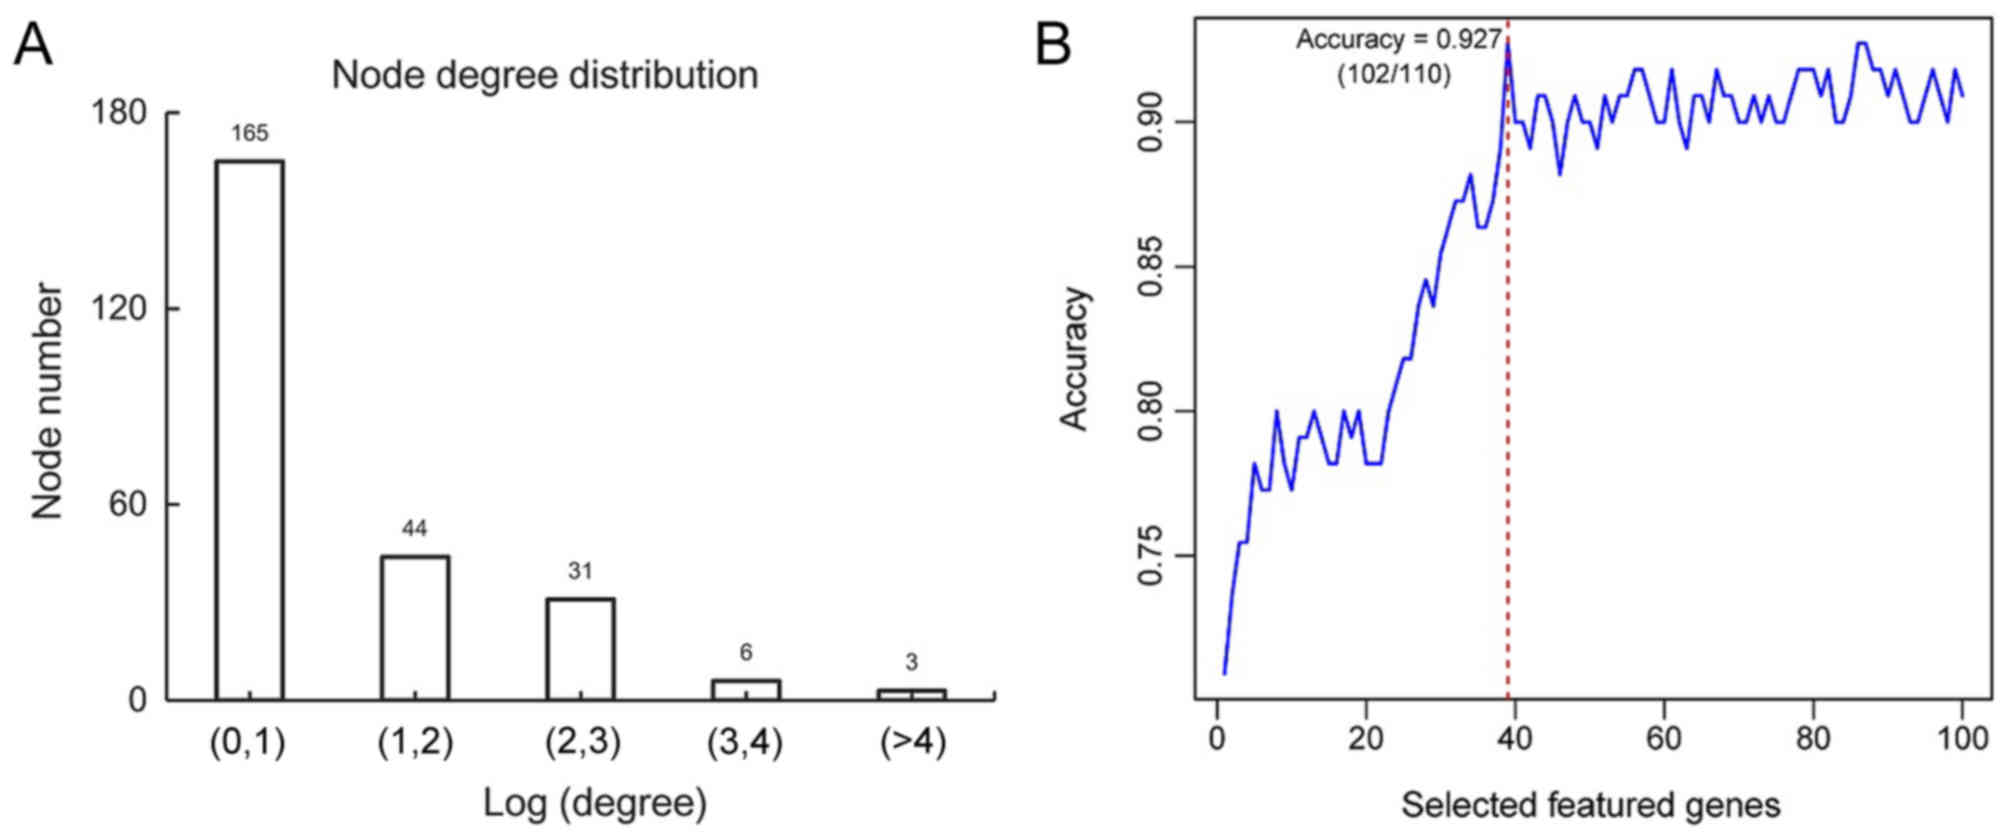
The distribution of calculated degree demonstrated
that 165 genes exhibited a small degree score [Log (degree) <1];
whereas 3 genes exhibited a large degree score (Log>4; Fig. 4A). This revealed that this PPI
network exhibited scale-free property similar to the majority of
biological networks (25). Genes
exhibiting high degrees were considered to represent hub genes and
may serve important roles in the development of ovarian cancer.
SVM classifier
Following the calculation of BC scores for each node
and the subsequent ranking of the top 100 nodes, 39 feature genes
[including cullin 3 (CUL3), mouse double minute 2 homolog (MDM2),
aurora kinase A (AURKA), WW domain containing oxidoreducatase
(WWOX), large tumor suppressor kinase (LATS)2, sirtuin 6 (SIRT6),
staphylococcal nuclease and tudor domain containing 1 (SND1),
leucine rich repeats and immunoglobulin like domains 1 (LRIG1) and
aurora kinase 1 interacting protein 1 (AURKAIP1)] were determined
by the recursive feature elimination (Table V). The highest prediction accuracy
determined from analysis of training dataset GSE17260 was 92.7%
[102 out of 110 samples (27 samples from patients with
non-recurrent OC and 75 samples from patients with recurrent OC)]
when 39 feature genes were used (Fig.
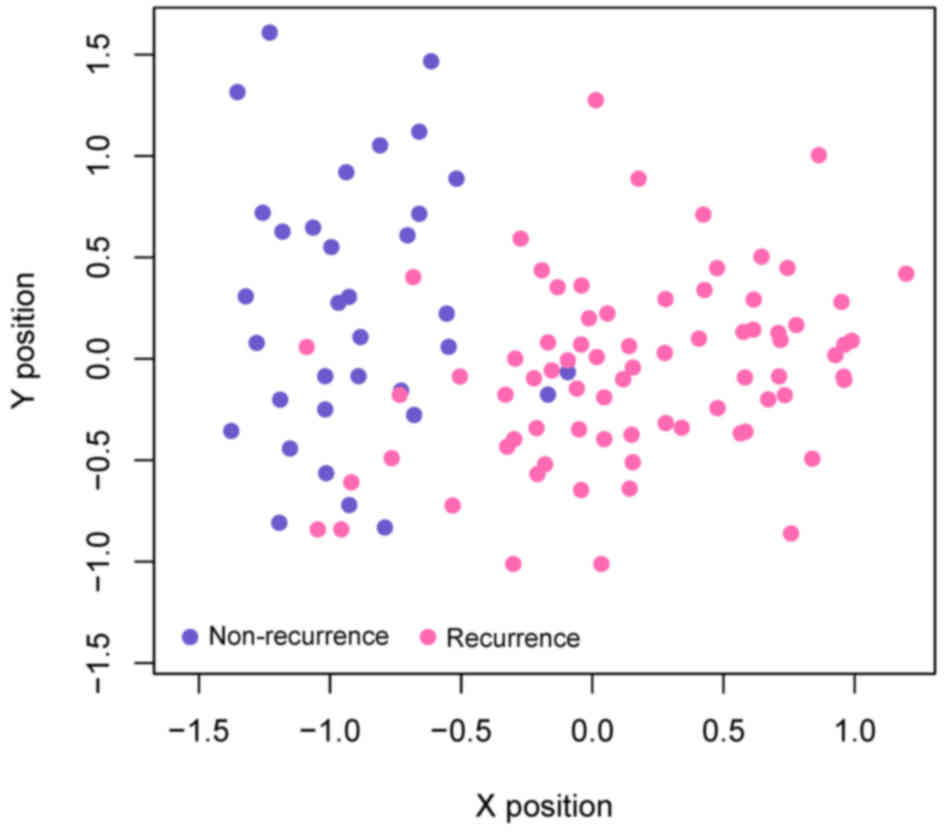
4B). The samples from patients with non-recurrent OC and
recurrent OC from training dataset GSE17260 were also presented in
a scatter plot, which clearly distinguished the recurrence samples
from non-recurrence samples (Fig.
5). This result illustrated the effectiveness of the SVM
classifier.
| Table V.Screened feature genes used for
construction of support vector machine classifier as determined by
recursive feature elimination. |
Table V.
Screened feature genes used for
construction of support vector machine classifier as determined by
recursive feature elimination.
| Gene | BC | Degree | P-value | FDR | Q value | Cochran's Q
value |
tau2 | Log fold
change |
|---|
| CUL3 | 0.759895 | 41 | 0.009775 | 0.02304 | 0.198586 | 0.905478 | 0 | −3.08977 |
| MDM2 | 0.694803 | 25 | 0.014685 | 0.034611 | 0.513419 | 0.773593 | 0 | −1.09727 |
| AURKA | 0.558121 | 19 | 0.001087 | 0.002561 | 1.286947 | 0.525464 | 0 | 1.42154 |
| HNRNPK | 0.50414 | 13 | 0.011236 | 0.026482 | 1.021909 | 0.599923 | 0 | −0.96217 |
| RAD21 | 0.490358 | 12 | 0.014482 | 0.034133 | 0.386617 | 0.824228 | 0 | 2.596818 |
| WWOX | 0.458579 | 10 | 0.013516 | 0.031857 | 0.857721 | 0.651251 | 0 | −3.74564 |
| IGBP1 | 0.449997 | 7 | 0.011454 | 0.026997 | 0.47506 | 0.788573 | 0 | 0.321061 |
| IPO7 | 0.442128 | 5 | 0.002717 | 0.006405 | 1.598947 | 0.449566 | 0 | −1.03747 |
| RAD23A | 0.441265 | 8 | 0.012419 | 0.02927 | 0.900161 | 0.637577 | 0 | 1.194153 |
| TSTA3 | 0.436658 | 5 | 0.010425 | 0.02457 | 0.358922 | 0.835721 | 0 | 2.936405 |
| BRCA2 | 0.435695 | 5 | 0.003583 | 0.008444 | 0.100529 | 0.950978 | 0 | 1.948855 |
| FHL3 | 0.433658 | 6 | 0.001257 | 0.002963 | 0.279246 | 0.869686 | 0 | 0.987126 |
| LATS2 | 0.430752 | 4 | 0.011053 | 0.026051 | 0.09771 | 0.952319 | 0 | 0.4797 |
| NOC2L | 0.430291 | 4 | 0.013451 | 0.031703 | 0.014566 | 0.992743 | 0 | 1.077813 |
| CD2AP | 0.42926 | 4 | 0.018901 | 0.044548 | 0.026358 | 0.986908 | 0 | −1.79036 |
| TPM4 | 0.428095 | 7 | 0.013303 | 0.031355 | 1.621492 | 0.444526 | 0 | 2.932572 |
| MCM5 | 0.427881 | 7 | 0.006661 | 0.0157 | 0.397359 | 0.819813 | 0 | 0.44911 |
| CTBP2 | 0.427047 | 5 | 0.013728 | 0.032356 | 1.715255 | 0.424167 | 0 | 0.877948 |
| SIRT6 | 0.426042 | 6 | 0.009524 | 0.022448 | 0.145688 | 0.929746 | 0 | −0.81214 |
| RALBP1 | 0.42506 | 3 | 0.008046 | 0.018964 | 1.608012 | 0.447533 | 0 | 1.788163 |
| DBN1 | 0.422172 | 9 | 0.001295 | 0.003052 | 1.479727 | 0.477179 | 0 | 1.499493 |
| FAF1 | 0.420131 | 4 | 0.014442 | 0.034039 | 1.184726 | 0.553019 | 0 | 1.782133 |
| SMC4 | 0.416491 | 5 | 0.005295 | 0.01248 | 0.238612 | 0.887536 | 0 | 1.769396 |
| SND1 | 0.41646 | 3 | 0.003913 | 0.009222 | 0.920509 | 0.631123 | 0 | 1.238259 |
| TEAD4 | 0.414377 | 2 | 0.008077 | 0.019037 | 1.729928 | 0.421067 | 0 | 0.992568 |
| BANP | 0.411436 | 3 | 0.004271 | 0.010067 | 0.305887 | 0.858178 | 0 | 0.759078 |
| SART1 | 0.409053 | 3 | 0.01088 | 0.025643 | 0.068045 | 0.96655 | 0 | 1.254434 |
| INPPL1 | 0.408929 | 2 | 9.41E-05 | 0.000222 | 1.3698 | 0.504141 | 0 | 2.084808 |
| LRIG1 | 0.408929 | 2 | 0.018088 | 0.042633 | 1.901966 | 0.386361 | 0 | −1.42735 |
| LRRC49 | 0.408929 | 2 | 0.011943 | 0.028148 | 0.263645 | 0.876497 | 0 | −1.66365 |
| PCSK9 | 0.408929 | 2 | 0.000332 | 0.000782 | 0.045994 | 0.977266 | 0 | −5.13551 |
| PHPT1 | 0.408929 | 2 | 0.009973 | 0.023507 | 0.52427 | 0.769407 | 0 | −1.60935 |
| POLR2G | 0.408929 | 2 | 0.010377 | 0.024458 | 0.509447 | 0.775131 | 0 | 1.450648 |
| PPA2 | 0.408929 | 2 | 0.002415 | 0.005691 | 0.983689 | 0.611498 | 0 | −0.77017 |
| USP47 | 0.408929 | 2 | 0.016431 | 0.038727 | 1.485343 | 0.475841 | 0 | −2.70658 |
| TTK | 0.408856 | 3 | 0.019272 | 0.045422 | 0.154504 | 0.925656 | 0 | −0.23932 |
| ARFIP1 | 0.408051 | 3 | 5.30E-06 | 1.25E-05 | 1.795171 | 0.407552 | 0 | −2.91913 |
| FTL | 0.407729 | 2 | 0.00145 | 0.003417 | 1.83461 | 0.399595 | 0 | 2.012816 |
| AURKAIP1 | 0.407431 | 2 | 0.006809 | 0.016048 | 0.532797 | 0.766134 | 0 | 0.828771 |
The SVM classifier was further validated using
GSE44104 and GSE51088 datasets. The prediction accuracy for dataset
GSE44104 was revealed to be 93.3% [56 out of 60 samples (40 samples
from patients with non-recurrent OC and 16 samples from patients
with recurrent OC)]. The accuracy for dataset GSE51088 was revealed
to be 96.6% [142 out of 147 samples (126 non-recurrent OC samples
and 16 recurrent OC samples)]. The correct rate, sensitivity,
specificity, positive predictive value (PPV), negative predictive
value (NPV) and area under receiver operating characteristic curve
(AUROC) values were presented in Table VI. It can be observed that the SVM
classifier had a good classification effect in all 3 data sets.
Furthermore, the AUROC values of GSE17260, GSE44104 and GSE51088
datasets were 0.988, 0.970, and 0.967, respectively (Table VI). All values are close to 1,
which means close to the perfect prediction effect.
| Table VI.Prediction results of the support
vector machine classifier using sample data from GSE17260, GSE44104
and GSE51088. |
Table VI.
Prediction results of the support
vector machine classifier using sample data from GSE17260, GSE44104
and GSE51088.
| Datasets | Number of
samples | Correct
samples | Correct rate | Sensitivity | Specificity | PPV | NPV | AUROC |
|---|
| GSE17260 | 110 | 102 | 0.927 | 0.894 | 0.987 | 0.964 | 0.915 | 0.988 |
| GSE44104 | 60 | 56 | 0.933 | 1.000 | 0.800 | 0.909 | 1.000 | 0.970 |
| GSE51088 | 147 | 142 | 0.966 | 0.969 | 0.941 | 0.992 | 0.800 | 0.967 |
| TCGA | 395 | 357 | 0.9038 | 0.987 | 0.801 | 0.862 | 0.979 | 0.981 |
Results of validation
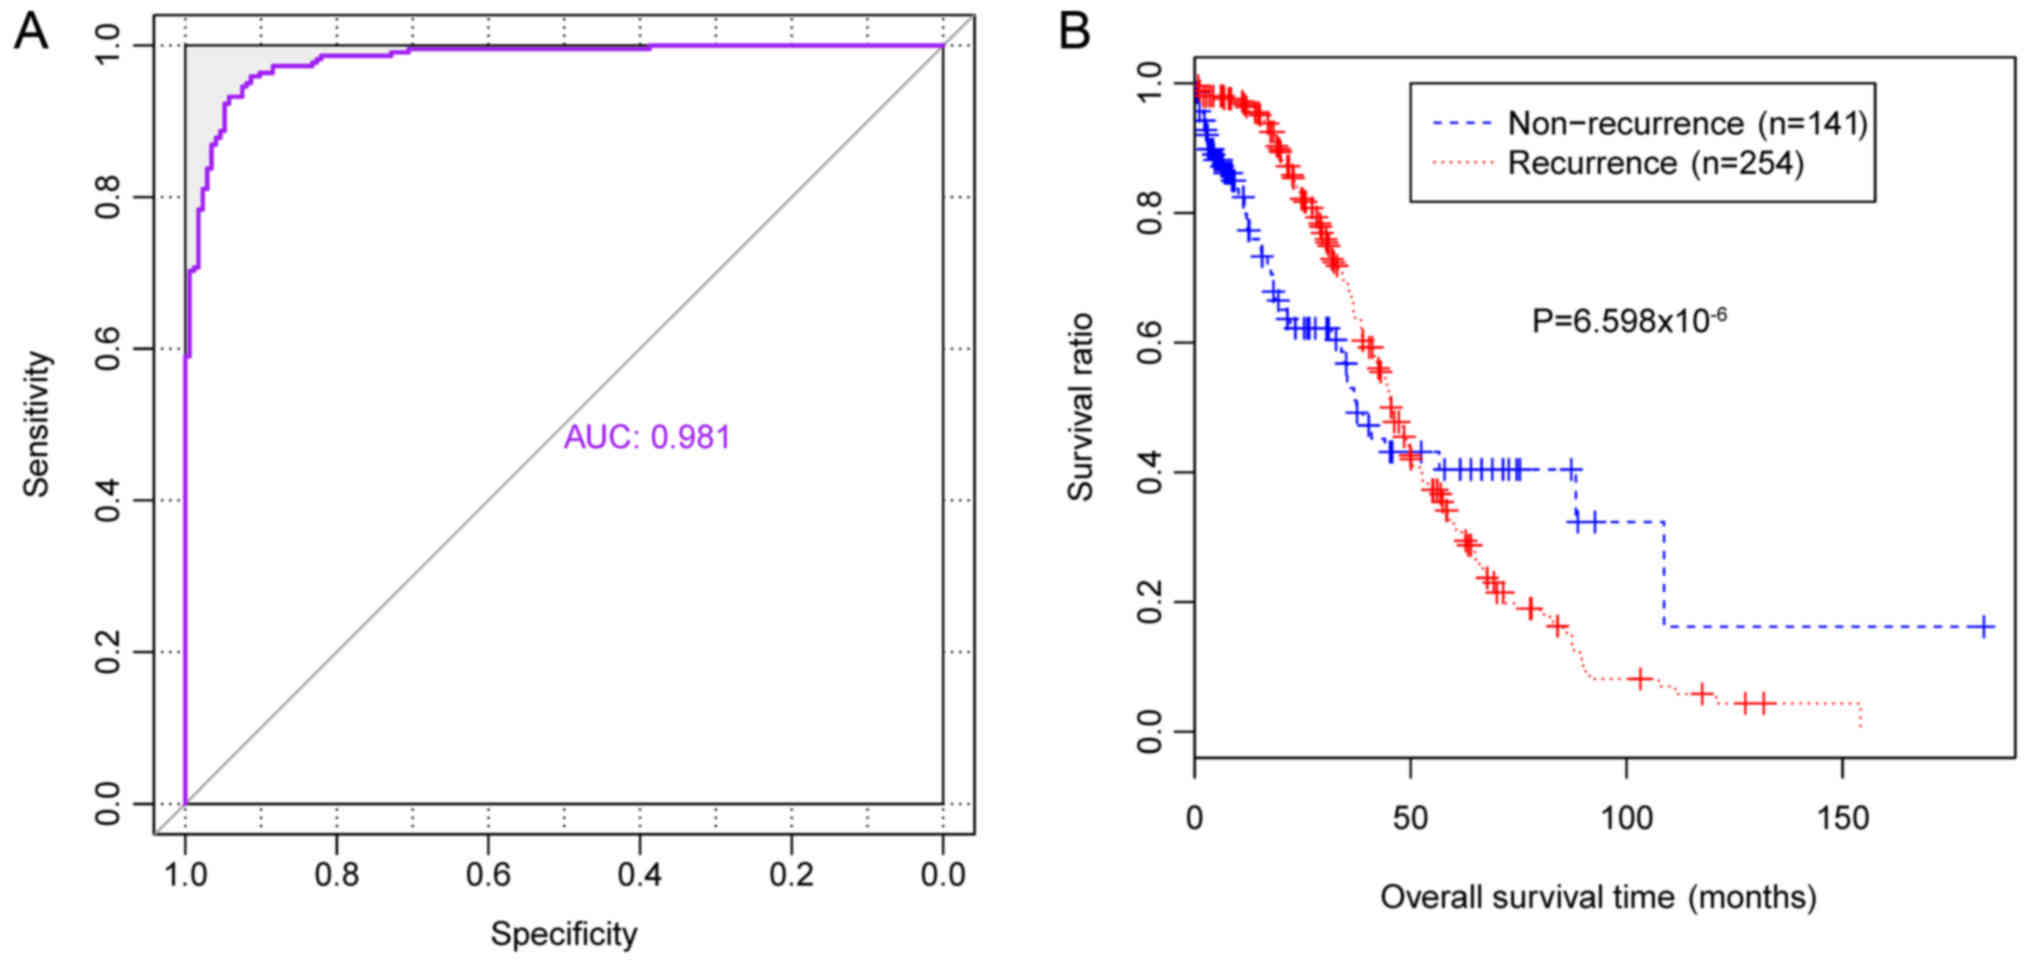
Prediction accuracy of independent gene expression
data downloaded from TCGA was revealed to be 90.4% [357 out of 395
samples (138 samples from patients with non-recurrent OC and 219
samples from patients with recurrent OC)], with an AUROC value of
0.981 (Table VI, Fig. 6A). In addition, survival ratios
were determined for the 394 patients with OC (172 patients with
non-recurrent OC and 222 patients with recurrent OC). The KM
survival curve revealed that survival times of patients with
predicted non-recurrent OC were significantly increased compared
with patients with predicted recurrent OC (P=6.598×10⁻⁶;
Fig. 6B), which suggested that the
classifier may accurately predict the prognosis of patients with
OC.
Discussion
In the present study, a SVM classifier consisting of
specific genes was revealed to predict the rates of non-recurrent
and recurrent OC. Gene expression profiles of patients with
recurrent OC were compared with patients with non-recurrent OC to
identify DEGs. Homogeneity and quality control analyses using three
gene expression datasets were performed to improve the prediction
accuracy of the classifier. A PPI network was then constructed
using identified DEGs, which included 249 nodes and 354 edges.
Functional and pathway enrichment analysis demonstrated that genes
in the PPI network were significantly associated with 14 GO terms,
including ‘cell cycle,’ ‘homologous recombination’, ‘purine
metabolism’ and ‘pathways in cancer and DNA replication’. A total
of 39 genes were selected by recursive feature elimination,
including CUL3, MDM2, AURKA, WWOX, LATS2, SIRT6, SND1, LRIG1 and
AURKAIP1.
Constitutive activation of nuclear factor erythroid
2 like 2 (NRF2) is associated with acquisition of malignant
features in OC (28,29). Markedly increased frequencies of
DNA and mRNA alterations compared with healthy controls affect
components of the kelch like ECH associated protein 1
(KEAP1)/CUL3/ring-box 1 (RBX1) E3-ubiquitin ligase complex, which
regulates NRF2 expression, have been revealed via sequencing of
KEAP1, CUL3 and RBX1 in a cohort of 568 samples obtained from
patients with OC detailed in TCGA (30). MDM2 is a nuclear-localized E3
ubiquitin ligase that promotes tumor formation by targeting tumor
suppressor proteins, including p53, and has an important role in
the development of OC (31). It
has been previously demonstrated that overexpression of MDM2 can
increase cisplatin cytotoxicity in human ovarian cell lines
(32). Furthermore, it has been
demonstrated that antagonists of MDM2 can induce apoptosis in human
ovarian cancer cells and synergize with cisplatin to attenuate the
chemoresistance of patients exhibiting wild-type tumor protein p53
(33). AURKA expression has been
revealed to be closely correlated with prognosis of endometrioid OC
in a study including 51 tumor samples (34), which may result from its role in
the regulation of OC cell migration and adhesion (35). The predominant full-length
transcript (variant 1) of WWOX functions as a suppressor of ovarian
tumorigenesis (36) by inducing
apoptosis in detached cells, and regulating the interaction between
tumor cells and the extracellular matrix (37). WWOX can regulate the cell cycle and
apoptosis of OC stem cells (38),
which suggests that WWOX may represent an important molecular
target for the treatment of OC. Numerous studies have reported that
miR-25 and miR-181b can promote OC by targeting LATS2, which is a
serine/threonine protein kinase belonging to the LATS tumor
suppressor family and is involved in the proliferation, migration
and invasion of OC cells (39,40).
SIRT6, a member of NAD+ dependent class III deacetylase
sirtuin family, has been revealed to inhibit the proliferation of
OC cells by downregulating Notch 3 expression (41). Decreased expression of SIRT6 has
been revealed to promote tumor cell growth and is closely
correlated with poor prognosis of OC (42). Therefore, SIRT6 may represent a
therapeutic target for the prevention and treatment of OC. LRIG1 is
a tumor suppressor used in clinical practice (43). Decreased LRIG1 expression has been
demonstrated to propagate chemoresistance in etoposide-resistant
human OC cells by downregulating multidrug resistance-associated
protein 1 and apoptosis (44). In
addition, AURKAIP1 promotes the degradation of the Aurora A
oncogene via an alternative ubiquitin-independent pathway (45). Therefore, AURKAIP1 may be involved
in the development and recurrence of OC. SND1, a transcriptional
co-activator, has been demonstrated to promote breast cancer
metastasis via the tumor growth factor β1/mad (smad) mothers
against dpp pathway (46), which
has been previously used for the prediction of colon cancer
prognosis (47), and to promote
prostate cancer via interaction with KH domain-containing
RNA-binding signal transduction-associated protein 1 (48). However, the role of SND1 in OC
remains unclear. Studies on the aforementioned feature genes may
help to determine the complex molecular mechanisms underlying the
recurrence of OC.
In the present study, a SVM classifier consisting of
39 specific genes was constructed and verified for the prediction
of the recurrence of OC. The prediction accuracy of the SVM
classifier for GSE17260, GSE44104 and GSE51088 datasets was 92.7,
93.3 and 96.6%, respectively. The prediction accuracy of the SVM
classifier using independent gene expression data downloaded from
TCGA demonstrated an accuracy of 90.4%. Furthermore, the patients
with predicted non-recurrent OC exhibited a significantly longer
survival time compared with patients with predicted recurrent OC
(P=6.598×10⁻⁶); therefore suggesting that the SVM
classifier has the potential for use in the prognostic prediction
of patients with OC. Unlike sequencing technology, the SVM
classifier only requires the expression levels of 39 genes for
prognostic prediction. Therefore, application of the established
SVM classifier is more economical and efficient compared with
sequencing for the prognostic prediction of patients with OC.
In conclusion, a SVM classifier consisting of 39
genes was established in the present study for the accurate
prediction of the recurrence of OC. The 39 included genes serve
roles in the development of OC and may represent novel therapeutic
targets for the treatment of OC. Furthermore, the established SVM
classifier may be used for prognostic prediction in patients with
OC. However, further studies investigating an independent cohort of
patients with non-recurrent and recurrent OC are required to
further validate the results of the present study.
Acknowledgements
Not applicable.
Funding
This study was supported by Hubei Province's
Outstanding Medical Academic Leader Program and Hubei Province
Health and Family Planning Scientific Research project (grant no.
WJ2015MA024) and the general project of Natural Science Foundation
of Hubei Province (grant no. 2017CFB335).
Availability of data and materials
The datasets used and/or analyzed during the current
study are available from the corresponding author on reasonable
request.
Authors' contributions
JZ and LL performed data analyses and wrote the
manuscript. LW, XL and HX contributed significantly in data
analyses. LC conceived and designed the study. All authors read and
approved the final manuscript.
Ethics approval and consent to
participate
In the original article of the datasets, the trials
were approved by the local institutional review boards of all
participating centers, and informed consent was obtained from all
patients.
Patient consent for publication
Not applicable.
Competing interests
The authors declare that they have no competing
interests.
References
|
1
|
Howlader N, Noone AM, Krapcho M, Garshell
J, Miller D, Altekruse SF, Kosary CL, Yu M, Ruhl J, Tatalovich Z,
et al: SEER Cancer Statistics Review 1975–2012. National Cancer
Institute; Bethesda, MD: 2015, https://seer.cancer.gov/archive/csr/1975_2012/November
18–2015
|
|
2
|
Davidson B and Tropé CG: Ovarian cancer:
Diagnostic, biological and prognostic aspects. Womens Health
(Lond). 10:519–533. 2014. View Article : Google Scholar : PubMed/NCBI
|
|
3
|
Gloss BS and Samimi G: Epigenetic
biomarkers in epithelial ovarian cancer. Cancer Lett. 342:257–263.
2014. View Article : Google Scholar : PubMed/NCBI
|
|
4
|
Leung F, Diamandis EP and Kulasingam V:
Ovarian cancer biomarkers: Current state and future implications
from high-throughput technologies. Adv Clin Chem. 66:25–77. 2014.
View Article : Google Scholar : PubMed/NCBI
|
|
5
|
Au KK, Josahkian JA, Francis JA, Squire JA
and Koti M: Current state of biomarkers in ovarian cancer
prognosis. Future Oncol. 11:3187–3195. 2015. View Article : Google Scholar : PubMed/NCBI
|
|
6
|
Huo J, Hu J, Liu G, Cui Y and Ju Y:
Elevated serum interleukin-37 level is a predictive biomarker of
poor prognosis in epithelial ovarian cancer patients. Arch Gynecol
Obstet. 295:459–465. 2017. View Article : Google Scholar : PubMed/NCBI
|
|
7
|
Masoumi-Moghaddam S, Amini A, Wei AQ,
Robertson G and Morris DL: Sprouty 2 protein, but not Sprouty 4, is
an independent prognostic biomarker for human epithelial ovarian
cancer. Int J Cancer. 137:560–570. 2015. View Article : Google Scholar : PubMed/NCBI
|
|
8
|
Lee JM, Trepel JB, Choyke P, Cao L,
Sissung T, Houston N, Yu M, Figg WD, Turkbey IB, Steinberg SM, et
al: CECs and IL-8 have prognostic and predictive utility in
patients with recurrent platinum-sensitive ovarian cancer:
Biomarker correlates from the randomized phase-2 trial of olaparib
and cediranib compared with olaparib in recurrent
platinum-sensitive ovarian cancer. Front Oncol. 5:1232015.
View Article : Google Scholar : PubMed/NCBI
|
|
9
|
Feng Y, He F, Wu H, Huang H, Zhang L, Han
X and Liu J: GOLPH3L is a novel prognostic biomarker for epithelial
ovarian cancer. J Cancer. 6:893–900. 2015. View Article : Google Scholar : PubMed/NCBI
|
|
10
|
Roque DM, Buza N, Glasgow M, Bellone S,
Bortolomai I, Gasparrini S, Cocco E, Ratner E, Silasi DA, Azodi M,
et al: Class III β-tubulin overexpression within the tumor
microenvironment is a prognostic biomarker for poor overall
survival in ovarian cancer patients treated with neoadjuvant
carboplatin/paclitaxel. Clin Exp Metastasis. 31:101–110. 2014.
View Article : Google Scholar : PubMed/NCBI
|
|
11
|
Penzvalto Z, Lanczky A, Lenart J,
Meggyesházi N, Krenács T, Szoboszlai N, Denkert C, Pete I and
Győrffy B: MEK1 is associated with carboplatin resistance and is a
prognostic biomarker in epithelial ovarian cancer. BMC Cancer.
14:8372014. View Article : Google Scholar : PubMed/NCBI
|
|
12
|
Abdel-Fatah TM, Russell R, Albarakati N,
Maloney DJ, Dorjsuren D, Rueda OM, Moseley P, Mohan V, Sun H,
Abbotts R, et al: Genomic and protein expression analysis reveals
flap endonuclease 1 (FEN1) as a key biomarker in breast and ovarian
cancer. Mol Oncol. 8:1326–1338. 2014. View Article : Google Scholar : PubMed/NCBI
|
|
13
|
Wei W, Mok SC, Oliva E, Kim SH, Mohapatra
G and Birrer MJ: FGF18 as a prognostic and therapeutic biomarker in
ovarian cancer. J Clin Invest. 123:4435–4448. 2013. View Article : Google Scholar : PubMed/NCBI
|
|
14
|
Liu T, Gao H, Chen X, Lou G, Gu L, Yang M,
Xia B and Yin H: TNFAIP8 as a predictor of metastasis and a novel
prognostic biomarker in patients with epithelial ovarian cancer. Br
J Cancer. 109:1685–1692. 2013. View Article : Google Scholar : PubMed/NCBI
|
|
15
|
Yoshihara K, Tajima A, Yahata T, Kodama S,
Fujiwara H, Suzuki M, Onishi Y, Hatae M, Sueyoshi K, Fujiwara H, et
al: Gene expression profile for predicting survival in
advanced-stage serous ovarian cancer across two independent
datasets. PLoS One. 5:e96152010. View Article : Google Scholar : PubMed/NCBI
|
|
16
|
Wu YH, Chang TH, Huang YF, Huang HD and
Chou CY: COL11A1 promotes tumor progression and predicts poor
clinical outcome in ovarian cancer. Oncogene. 33:3432–3440. 2014.
View Article : Google Scholar : PubMed/NCBI
|
|
17
|
Karlan BY, Dering J, Walsh C, Orsulic S,
Lester J, Anderson LA, Ginther CL, Fejzo M and Slamon D:
POSTN/TGFBI-associated stromal signature predicts poor prognosis in
serous epithelial ovarian cancer. Gynecol Oncol. 132:334–342. 2014.
View Article : Google Scholar : PubMed/NCBI
|
|
18
|
Liu WM, Mei R, Di X, Ryder TB, Hubbell E,
Dee S, Webster TA, Harrington CA, Ho MH, Baid J and Smeekens SP:
Analysis of high density expression microarrays with signed-rank
call algorithms. Bioinformatics. 18:1593–1599. 2002. View Article : Google Scholar : PubMed/NCBI
|
|
19
|
R Development Core Team, . R: a language
and environment for statistical computing. the R Foundation for
Statistical Computing; Vienna: 2016
|
|
20
|
de Souto MC, Jaskowiak PA and Costa IG:
Impact of missing data imputation methods on gene expression
clustering and classification. BMC Bioinformatics. 16:642015.
View Article : Google Scholar : PubMed/NCBI
|
|
21
|
Affymetrix® Microarray Suite.
User's Guide. Version 5.0. Affymetrix, Inc.; Santa Clara: 2001
|
|
22
|
Kang DD, Sibille E, Kaminski N and Tseng
GC: MetaQC: Objective quality control and inclusion/exclusion
criteria for genomic meta-analysis. Nucleic Acids Res. 40:e152012.
View Article : Google Scholar : PubMed/NCBI
|
|
23
|
Qi C, Hong L, Cheng Z and Yin Q:
Identification of metastasis-associated genes in colorectal cancer
using metaDE and survival analysis. Oncol Lett. 11:568–574. 2016.
View Article : Google Scholar : PubMed/NCBI
|
|
24
|
Shannon PI, Markiel A, Ozier O, Baliga NS,
Wang JT, Ramage D, Amin N, Schwikowski B and Ideker T: Cytoscape: A
software environment for integrated models of biomolecular
interaction networks. Genome Res. 13:2498–2504. 2003. View Article : Google Scholar : PubMed/NCBI
|
|
25
|
Goh KI, Oh E, Jeong H, Kahng B and Kim D:
Classification of scale-free networks. Proc Natl Acad Sci USA.
99:pp. 12583–12588. 2002; View Article : Google Scholar : PubMed/NCBI
|
|
26
|
Qureshi MN, Min B, Jo HJ and Lee B:
Multiclass classification for the differential diagnosis on the
ADHD subtypes using recursive feature elimination and hierarchical
extreme learning machine: Structural MRI study. PLoS One.
11:e01606972016. View Article : Google Scholar : PubMed/NCBI
|
|
27
|
Tomczak K, Czerwińska P and Wiznerowicz M:
The cancer genome atlas (TCGA): An immeasurable source of
knowledge. Contemp Oncol (Pozn). 19:A68–A77. 2015.PubMed/NCBI
|
|
28
|
Sporn MB and Liby KT: NRF2 and cancer: The
good, the bad and the importance of context. Nat Rev Cancer.
12:564–571. 2012. View
Article : Google Scholar : PubMed/NCBI
|
|
29
|
Liao H, Zhou Q, Zhang Z, Wang Q, Sun Y, Yi
X and Feng Y: NRF2 is overexpressed in ovarian epithelial carcinoma
and is regulated by gonadotrophin and sex-steroid hormones. Oncol
Rep. 27:1918–1924. 2012.PubMed/NCBI
|
|
30
|
Martinez VD, Vucic EA, Thu KL, Pikor LA,
Hubaux R and Lam WL: Unique pattern of component gene disruption in
the NRF2 inhibitor KEAP1/CUL3/RBX1 E3-ubiquitin ligase complex in
serous ovarian cancer. Biomed Res Int. 2014:1594592014. View Article : Google Scholar : PubMed/NCBI
|
|
31
|
Ginath S, Menczer J, Friedmann Y, Aingorn
H, Aviv A, Tajima K, Dantes A, Glezerman M, Vlodavsky I and
Amsterdam A: Expression of heparanase, Mdm2, and erbB2 in ovarian
cancer. Int J Oncol. 18:1133–1144. 2001.PubMed/NCBI
|
|
32
|
Mi RR and Ni H: MDM2 sensitizes a human
ovarian cancer cell line. Gynecol Oncol. 90:238–244. 2003.
View Article : Google Scholar : PubMed/NCBI
|
|
33
|
Mir R, Tortosa A, Martinez-soler F, Vidal
A, Condom E, Pérez-Perarnau A, Ruiz-Larroya T, Gil J and
Giménez-Bonafé P: Mdm2 antagonists induce apoptosis and synergize
with cisplatin overcoming chemoresistance in TP53 wild-type ovarian
cancer cells. Int J Cancer. 132:1525–1536. 2013. View Article : Google Scholar : PubMed/NCBI
|
|
34
|
Yang F, Guo X, Yang G, Rosen DG and Liu J:
AURKA and BRCA2 expression highly correlate with prognosis of
endometriofid ovarian carcinoma. Mod Pathol. 24:836–845. 2011.
View Article : Google Scholar : PubMed/NCBI
|
|
35
|
Do TV, Xiao F, Bickel LE, Klein-Szanto AJ,
Pathak HB, Hua X, Howe C, O'Brien SW, Maglaty M, Ecsedy JA, et al:
Aurora kinase A mediates epithelial ovarian cancer cell migration
and adhesion. Oncogene. 33:539–549. 2014. View Article : Google Scholar : PubMed/NCBI
|
|
36
|
Gourley C, Paige AJW, Taylor KJ, Scott D,
Francis NJ, Rush R, Aldaz CM, Smyth JF and Gabra H: WWOX mRNA
expression profile in epithelial ovarian cancer supports the role
of WWOX variant 1 as a tumour suppressor, although the role of
variant 4 remains unclear. Int J Oncol. 26:1681–1689.
2005.PubMed/NCBI
|
|
37
|
Gourley C, Paige AJ, Taylor KJ, Ward C,
Kuske B, Zhang J, Sun M, Janczar S, Harrison DJ, Muir M, et al:
WWOX gene expression abolishes ovarian cancer tumorigenicity in
vivo and decreases attachment to fibronectin via integrin alpha3.
Cancer Res. 69:4835–4842. 2009. View Article : Google Scholar : PubMed/NCBI
|
|
38
|
Yan H, Tong J, Lin X, Han Q and Huang H:
Effect of the WWOX gene on the regulation of the cell cycle and
apoptosis in human ovarian cancer stem cells. Mol Med Rep.
12:1783–1788. 2015. View Article : Google Scholar : PubMed/NCBI
|
|
39
|
Feng S, Pan W, Jin Y and Zheng J: MiR-25
promotes ovarian cancer proliferation and motility by targeting
LATS2. Tumour Biol. 35:12339–12344. 2014. View Article : Google Scholar : PubMed/NCBI
|
|
40
|
Xia Y and Gao Y: MicroRNA-181b promotes
ovarian cancer cell growth and invasion by targeting LATS2. Biochem
Biophys Res Commun. 447:446–451. 2014. View Article : Google Scholar : PubMed/NCBI
|
|
41
|
Zhang J, Yin XJ, Xu CJ, Ning YX, Chen M,
Zhang H, Chen SF and Yao LQ: The histone deacetylase SIRT6 inhibits
ovarian cancer cell proliferation via down-regulation of Notch 3
expression. Eur Rev Med Pharmacol Sci. 19:818–824. 2015.PubMed/NCBI
|
|
42
|
Zhang G, Liu Z, Qin S and Li K: Decreased
expression of SIRT6 promotes tumor cell growth correlates closely
with poor prognosis of ovarian cancer. Eur J Gynaecol Oncol.
36:629–632. 2015. View Article : Google Scholar : PubMed/NCBI
|
|
43
|
Lindquist D, Kvarnbrink S, Henriksson R
and Hedman H: LRIG and cancer prognosis. Acta Oncol. 53:1135–1142.
2014. View Article : Google Scholar : PubMed/NCBI
|
|
44
|
Yang H, Yao J, Yin J and Wei X: Decreased
LRIG1 in human ovarian cancer cell SKOV3 upregulates MRP-1 and
contributes to the chemoresistance of VP16. Cancer Biother
Radiopharm. 31:125–132. 2016. View Article : Google Scholar : PubMed/NCBI
|
|
45
|
Lim SK and Gopalan G: Aurora-A kinase
interacting protein 1 (AURKAIP1) promotes Aurora-A degradation
through an alternative ubiquitin-independent pathway. Biochem J.
403:119–127. 2007. View Article : Google Scholar : PubMed/NCBI
|
|
46
|
Yu L, Liu X, Cui K, Di Y, Xin L, Sun X,
Zhang W, Yang X, Wei M, Yao Z and Yang J: SND1 acts downstream of
TGFβ1 and upstream of Smurf1 to promote breast cancer metastasis.
Cancer Res. 75:1275–1286. 2015. View Article : Google Scholar : PubMed/NCBI
|
|
47
|
Wang N, Du X, Zang L, Song N, Yang T, Dong
R, Wu T, He X and Lu J: Prognostic impact of metadherin–SND1
interaction in colon cancer. Mol Biol Rep. 39:10497–10504. 2012.
View Article : Google Scholar : PubMed/NCBI
|
|
48
|
Cappellari M, Bielli P, Paronetto MP,
Ciccosanti F, Fimia GM, Saarikettu J, Silvennoinen O and Sette C:
The transcriptional co-activator SND1 is a novel regulator of
alternative splicing in prostate cancer cells. Oncogene.
33:3794–3802. 2014. View Article : Google Scholar : PubMed/NCBI
|