Introduction
Triple negative breast cancers (TNBC) lack
expression of three important receptors (ER, PR, and HER2). These
cancers account for 10–15% of breast cancers, and are characterized
by overexpression of epidermal growth factor receptor (EGFR), high
proliferative rate, and mutations in the p53 and BRCA1 tumour
suppressor genes (1). TNBC are
aggressive, metastatic cancers associated with early age of onset,
high relapse rates, and poor clinical outcome (1). The MDA-MB-231 cell line is a model
for TNBC, and is classified as a mesenchymal, stem-like, subtype of
TNBC (2). TNBC is managed with
standard chemotherapy agents since there are no suitable
therapeutic targets (1,3). Therefore, it is important to identify
new genetic markers and therapeutic targets for TNBC. Accordingly,
we re-analysed 6 microarray GEO datasets and identified a common
list of 71 genes upregulated in MDA-MB-231 vs. MCF7 cells. Notably,
this list contains known and novel genes that regulate the invasive
phenotype of MDA-MB-231 cells. It also contain known and novel
therapeutic target genes for TNBC.
The AXL and VIM genes are linked with very poor
prognosis in TNBC (4).
Furthermore, mechanisms of action of the AXL and VIM proteins are
unclear. Therefore, elucidation of functional gene networks for AXL
and VIM, could provide insights on therapeutic targets for TNBC. As
reported earlier (5), our data
showed significant upregulation of the AXL and VIM genes in
MDA-MB-231 vs. MCF7 cells. Interestingly, pattern miner analysis
showed that different subsets of the 71 genes upregulated in
MDA-MB-231 vs. MCF7 cells, were significantly and specifically
co-expressed with either AXL or VIM. These co-expressed gene
subsets were used to model distinct functional networks for AXL and
VIM. Notably, these networks contain several novel genes and
potential therapeutic targets in TNBC.
Materials and methods
Microarray analysis
BRB-Array Tools is an integrated software package
for visualization and statistical analysis of raw microarray data
(6). We used the BRB-Array
(v.4.3.2) class comparison tool to identify differentially
expressed genes (DEGs) between MDA-MB-231 vs. MCF7 cell lines from
6 published Gene Expression Omnibus (GEO) datasets. These 6
datasets were deposited into the GEO database. Four of the 6
datasets have not been published yet, and include GSE 26370 (Kung
et al, unpublished data), GSE 34987 (Lin et al,
unpublished data), GSE 41445 (Groth et al, unpublished
data), and GSE 54326 (Braunstein et al, unpublished data).
The remaining 2 datasets have published data, and include GSE 29682
(7) and GSE 32474 (8). Class comparison data from each
dataset was analysed with the multivariate permutation test
computed with 1,000 random permutations and a false discovery rate
of 1%. For each dataset, we obtained a list of genes with
>2-fold change in expression between the 2 cell lines with high
statistical significance (P=10−4 to 10−8).
The VENNY program is a web-server that compares gene lists.
Accordingly, VENNY analysis identified 71 genes as significantly
upregulated in MDA-MB-231 vs. MCF7 cells in at least 3 of the 6
datasets.
Gene ontology analysis
Gene ontology (GO) analysis of the 71 genes
upregulated in MDA-MB-231 vs. MCF7 cells was done. Accordingly,
Table I shows functional
categories of genes regulating the 4 most statistically significant
biological processes. The Gene Card database (http://www.genecards.org/) also provided additional
information on these 71 genes.
 | Table I.Gene Ontology of 71 genes upregulated
in MDA-MB-231 vs. MCF7 cells. |
Table I.
Gene Ontology of 71 genes upregulated
in MDA-MB-231 vs. MCF7 cells.
| GO term | Gene symbols (Gene
count) | FDR adjusted
P-value |
|---|
| GO:0006928 Cell
movement | IL8a, EXT1, F2RL1a, MAP1B, RAC2a, ARHGD1ba, CD97, GPX1, MSNa.c, VIMc, CD44a,c, CTGFa, HBEGFa, CALD1c, PLAUa,b, CYR61b, SLC16A3, AXLb, PRNPc, COL4A1a, VEGFCa.c (21) |
6.11×10−06 |
| GO:0009611 Response
to wounding | F2RL1a, ANXA1a, AXLb, ADM, RAC2, CTGFa,b, SRGN, OPTNb, GPX1, SERPINE1,
VEGFCa,c, AOX1b, HBEGFa, LOXb, SLC16A3 (15) |
5.20×10−05 |
| GO:0005925 Focal
adhesion | ANXA1a, CAPN2, CNN3, CD44a,c, CD97, EGFRa, MSNa,c, RAC2a, TGM2b, PLAUa,b, VIMc (11) |
2.55×10−05 |
| GO:0043066 Negative
regulation of apoptosis | ANXA1a, BIRC3a, CD44a,c, CYR61a,b, EGFRa, GPX1, GSTP1a, OPTNb, PLAC8, PRNPc, SERPINE1a, SPRY2a (12) |
3.59×10−03 |
Protein-protein interactions
Protein-protein interactions (PPIs) were analysed by
STRING [https://string-db.org/, v.10.5, with a
setting of high confidence (0.70)]. Combined STRING scores for each
PPI are based on three types of evidence (experimental data,
databases, and published texts). PPIs with combined STRING scores
ranging from 0.700–0.990 were considered for the present study.
Pattern miner systems biology
tool
The Pattern miner tool provides Pearson's
correlation coefficients (R-values) between input and output
parameters such as gene expression and a cell line (9). All significant correlations are based
on data from a minimum of 35 of 60 cell lines in the NCI-60 cancer
cell line database. R values > +0.340, indicate that input and
output values increase in a statistically significant manner
(P<0.05). For example, a ligand and its significantly
co-expressed receptor, would share an R-value > +0.340. For this
study, we used higher Pearson's correlation coefficients
(R>0.450, P<0.001).
Statistical analysis
P-values adjusted for false positive rates for the
71 individual DEG were obtained from microarray analysis. The
P-values for 19 of these 71 DEGs are in Table II. In all Tables, P-values are
expressed as negative exponents. For example, a P-value of 1E-06
indicates P=0.000001.
| Table II.Novel genes upregulated in MDA-MB-231
vs. MCF7 cells. |
Table II.
Novel genes upregulated in MDA-MB-231
vs. MCF7 cells.
| Gene | Mean ± SD fold
change | P-value | Gene name and
function |
|---|
| Cell migration |
|
ADORA2B | 23.80±5.80 |
5.00×10−08 | Adenosine Receptor
A2B |
|
BCAT1 | 25.15±6.00 |
8.30×10−08 | Branched Chain
Amino Acid Transaminase1 |
|
COL13A1a | 105.90 ±1.30 |
2.80×10−05 | COL13A1 Isoform of
Collagen |
|
EXT1 | 18.10±2.60 |
3.30×10−06 | EXT1
Glycosyltransferase |
|
LIMCH1a | 48.80±6.10 |
6.00×10−06 | LIM and
Calponin-homology domain 1 |
| Metastasis |
|
AKR1B1a | 41.60±6.30 |
1.20×10−07 | Aldo-Keto Reductase
1 |
|
CNN3a | 212.00±27.81 |
1.00×10−06 | Calponin 3 |
|
CYBRD1 | 24.20±1.70 |
5.00×10−08 | Cytochrome B
Reductase1 |
|
FXYD5 | 27.70±6.60 |
1.50×10−07 | FXYD Domain
containing Ion Transport Regulator 5 |
|
SRGNa | 123.60±16.80 |
5.00×10−08 | Serglycin is a
Proteoglycan |
| Senescence |
|
IFI16a | 69.80±8.70 |
1.10×10−04 | Interferon Gamma
Inducible Protein 16 |
|
IGFBP7a | 67.20±22.40 |
5.00×10−08 | Insulin Like Growth
Factor Binding Protein 7 |
|
TMEM158 | 28.90±7.30 |
1.00×10−06 | TMEM158 encodes a
Ras induced Senescence protein (RIS1) |
|
GNG11a | 67.80±28.70 |
5.00×10−08 | G Protein Subunit
Gamma 11 protein |
| Autophagy |
|
PLAC8a | 85.60±15.00 |
3.00×10−06 | PLAC8 (Placenta
Specific 8) |
|
SRPX |
|
| 33.40±2.30 |
3.00×10−07 | SRPX (Sushi Repeat
Containing Protein-X-Linked). SRPX is also named DRS |
| Multi-drug
resistance |
|
AGPS | 10.40±1.80 |
5.00×10−08 | Alkylglycerone
Phosphate Synthase |
|
PTRF | 22.10±5.40 |
2.80×10−07 | Polymerase 1 and
Transcript Release factor |
Results
Functional analysis of genes
upregulated in MDA-MB-231 vs. MCF7 cells
Our microarray analysis identified 71 genes
significantly upregulated in MDA-MB-231 vs. MCF7 cells from 6 GEO
datasets (P=5E-08 to 1E-04). GO analysis of these 71 genes put 59
genes into four statistically significant GO terms (Table I). Since 16 genes were in more than
1 GO term, a total of 43 (59–16) of the 71 genes regulate cell
movement, response to wounding, adhesion, and survival (Table I). Interestingly, another 19 of the
71 genes upregulated in MDA-MB-231 vs. MCF7 cells, are not reported
for TNBC (Table II). The gene
card database showed that 5 of these 19 novel genes promote
migration (ADORA2B, BCAT1, COL13A1, EXT1, and LIMCH1), whereas
another 5 novel genes promote metastasis (AKR1B1, CNN3, CYBRD1,
FXYD5, and SRGN).
We also identified genes in two pathways which are
poorly understood in TNBC. The first pathway is senescence, which
is promoted by 6 genes with a 28–82 fold upregulation in MDA-MB-231
vs. MCF7 cells. These 6 genes include IFI16, IGFBP7, TMEM158,
GNG11, PLAU and SERPINE1 (Tables I
and II). The second pathway is
autophagy, which is regulated by 4 novel genes (PLAC8, SRPX, CTGF,
and OPTN) that were 12–85 fold upregulated in MDA-MB-231 vs. MCF7
cells. These data strongly suggest that senescence and autophagy
play important roles in promoting survival and chemo-resistance in
MDA-MB-231 cells (3). The
literature also shows that senescence plays a key role in breast
cancer progression, and that autophagy regulates maintenance of
‘stem cell-like’ properties of MDA-MB-231 cells (3,10).
In summary, GO analysis of the 71 genes upregulated
in MDA-MB-231 vs. MCF7 cells shows 43 known genes regulating cell
adhesion, migration, and survival (Table I). As Table II shows 10 novel upregulated genes
promoting known processes (migration and metastases), and 9 novel
genes regulating senescence, autophagy, and drug resistance.
Therefore, 62 (43+10+9) of the 71 genes upregulated in MDA-MB-231
vs. MCF7 cells, account for the invasive and malignant phenotype of
MDA-MB-231 cells.
Interactions of 71 proteins
overexpressed in MDA-MB-231 cells
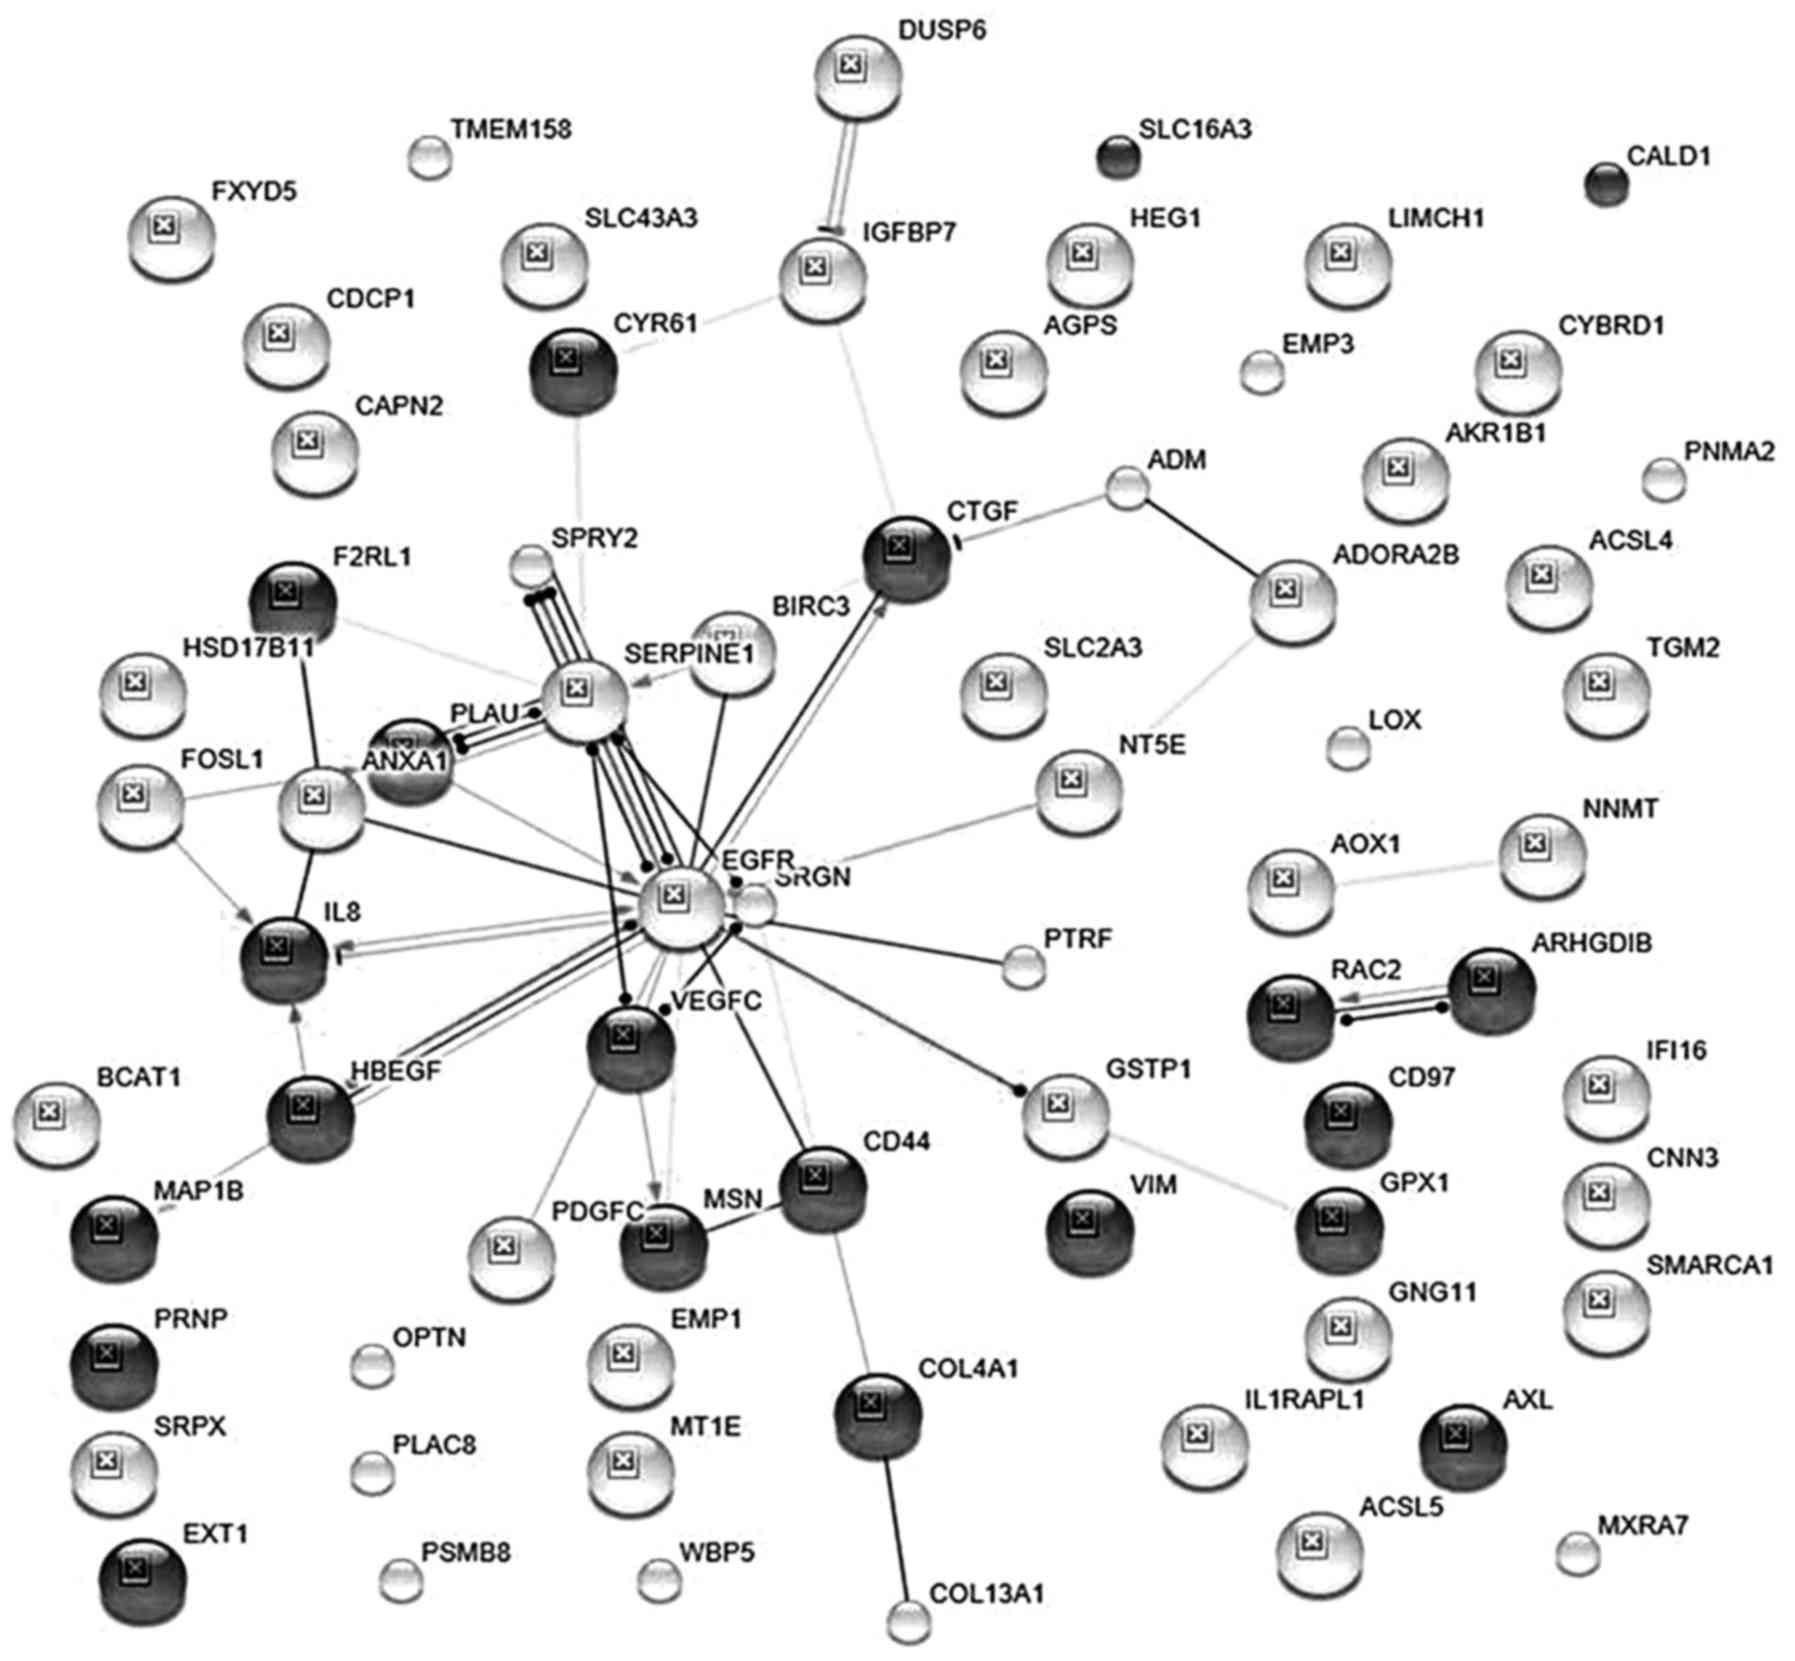
STRING analysis showed that the 71 gene products
overexpressed in MDA-MB-231 vs. MCF7 cells showed 42
protein-protein interactions (PPIs) with significant enrichment
(P=4.14×10⁻¹¹). STRING data also provided robust
evidence for interactions between EGFR and 5 proteins which
maintain cell survival (STRING scores of 0.730–0.950). These 5
proteins are ANXA1, BIRC3, CD44, GSTP1, and SPRY2. Notably, genes
encoding these 5 survival proteins are in the GO term for ‘negative
regulation of apoptosis’, and were 15–40 fold upregulated in
MDA-MB-231 vs. MCF7 cells (Table
I). EGFR also binds proteins that induce angiogenesis (CTGF and
HBEGF), drug resistance (PTRF), matrix remodelling (CTGF), and
epithelial-mesenchymal transition (ANXA1, CTGF). Combined STRING
scores for these EGFR interactions ranged from 0.715–0.998.
Interestingly, Fig. 1 also shows
that interactions between EGFR, HBEGF, and FOSL1, modulate
expression of the pro-inflammatory cytokine, IL8. This is important
since IL8 is linked with poor prognosis in node-negative breast
cancers, and resistance to EGFR inhibitors (11).
In summary, STRING data in Fig. 1 show that specific EGFR
interactions promote cell survival, epithelial-mesenchymal
transition (EMT), angiogenesis, drug resistance, and inflammation.
This is consistent with reports showing that EGFR signalling drives
migration and metastasis of MDA-MB-231 breast cancer cells
(12).
Importance of the AXL and VIM genes in
TNBC
Although EGFR is a promising therapeutic target in
TNBC, anti-EGFR monoclonal antibodies have poor cytotoxicity in
TNBC derived cells. This can occur because the AXL-receptor
tyrosine kinase dimerizes with EGFR, and initiates signalling that
blocks activity of anti-EGFR therapies (5). AXL is upregulated by VIM, which
encodes a key marker of EMT (13).
Furthermore, overexpression of VIM correlated with increased
migration and invasion of breast cancer cells (13). Clinical data show that TNBC
patients overexpressing AXL and VIM, have poorer prognosis and
survival than TNBC patients expressing high levels of either gene
(4,5).
Our data showed that AXL and VIM were 80 and 100
fold upregulated in MDA-MB-231 vs. MCF7 cells, respectively.
Although AXL and VIM regulate cell migration and invasion, these
proteins are not involved in PPIs (Fig. 1), and their signaling mechanisms
are unclear. Therefore, identifying functional networks for AXL and
VIM requires new approaches. Accordingly, we used the pattern miner
tool to identify members of the 71 genes which show statistically
significant co-expression with AXL or VIM. This approach is
supported by other studies on molecular networks in breast cancer.
For example, a co-expression approach analysed interactions between
mRNAs and long noncoding RNAs in TNBC (14). Wang et al (15), used gene co-expression networks
built by Pearson's correlation coefficients, to compare metastatic
and non-metastatic breast cancers. The pattern miner tool also uses
Pearson's correlation coefficients to identify significantly
co-expressed genes in the NCI-60 cancer cell database. Therefore,
we tested and used this tool to develop functional networks for the
AXL and VIM genes in MDA-MB-231 cells.
Testing pattern miner tool on genes
upregulated in MDA-MB-231 vs. MCF7 cells
Genes which are significantly co-expressed with each
other have a high probability of sharing similar functions.
Interestingly, Kohn et al (9), reported 5 co-expressed genes which
regulate cancer cell migration by different mechanisms. Notably,
all 5 genes from Kohn's study (EGFR, AXL, VIM, CAPN2, and COL4A1),
were significantly upregulated in MDA-MB-231 vs. MCF7 cells. The
functions of EGFR, AXL, and VIM, are explained above. CAPN2 encodes
a calpain 2 protease which triggers invasion of breast cancer cells
(16), whereas COL4A1 encodes an
isoform of collagen which controls cell invasion (17).
Since the pattern miner tool identifies co-expressed
genes, we tested this tool with our data. Accordingly, we
determined whether the 5 ‘migration-regulating genes’ identified by
Kohn et al (9), are
significantly co-expressed with any of the other 71 genes
upregulated in MDA-MB-231 vs. MCF7 cells. Our results showed that
all 5 ‘migration-regulating genes’ (EGFR, AXL, VIM, COL4A1, CAPN2)
are significantly correlated with 7 of the 71 genes upregulated in
MDA-MB-231 cells (R= +0.450 to +0.699, P<0.001). These seven
genes are EXT1, MAP1b, VEGFC, SERPINE1, CNN3, PTRF, and MXRA7. Five
of these 7 genes regulate cell migration (EXT1, MAP1b, VEGFC,
SERPINE1, and CNN3) (Table I and
Fig. 1). The sixth gene (PTRF),
regulates multidrug resistance (18), and the function of the seventh gene
(MXRA7), is unknown. Since PTRF and MXRA7 were significantly
co-expressed with the 5 genes controlling migration (EGFR, AXL,
VIM, CAPN2, and COL4A1), pattern miner predicts that both PTRF and
MXRA7 can also regulate cancer cell migration. This pilot test
showed that pattern miner is a valid and reliable tool to identify
novel genes which regulate cell migration, and show co-expression
with AXL or VIM.
Strategy to identify AXL and VIM gene
networks with pattern miner
The previous section showed that only 7 of the 71
genes upregulated in MDA-MB-231 vs. MCF7 cells, were co-expressed
with all 5 ‘migration-regulating genes’ (EGFR, AXL, VIM, CAPN2, and
COL4A1) (9). However, Tables I and II clearly showed that additional members
of these 71 genes regulate cell migration. In order to find these
additional members, we used different combinations of these 5
‘migration-regulating genes’ as input ‘baits’ for pattern miner
analysis. Thus, 7 gene pairs (AXL-EGFR, AXL-VIM, AXL-COL4A1,
AXL-CAPN2, VIM-EGFR, VIM-COL4A1, and VIM-CAPN2), 2 gene triplets
(AXL-COL4A1-VIM and AXL-EGFR-CAPN2), and 2 gene quadruplets
(AXL-COL4A1-EGFR-CAPN2 and AXL-VIM-EGFR-CAPN2) were used as input
‘baits’. Next, we used the pattern miner tool to determine whether
each of these ‘baits’ were specifically and significantly
co-expressed with any of the 71 genes upregulated in MDA-MB-231 vs.
MCF7 cells. This approach should identify subsets of the 71
upregulated genes which co-express with AXL or VIM, and form
functional networks that regulate migration of MDA-MB-231
cells.
Identifying and modelling the AXL gene
network
We used pattern miner to determine whether any of
the 71 genes upregulated in MDA-MB-231 vs. MCF7 cells, were
co-expressed with the different input ‘baits’ listed above.
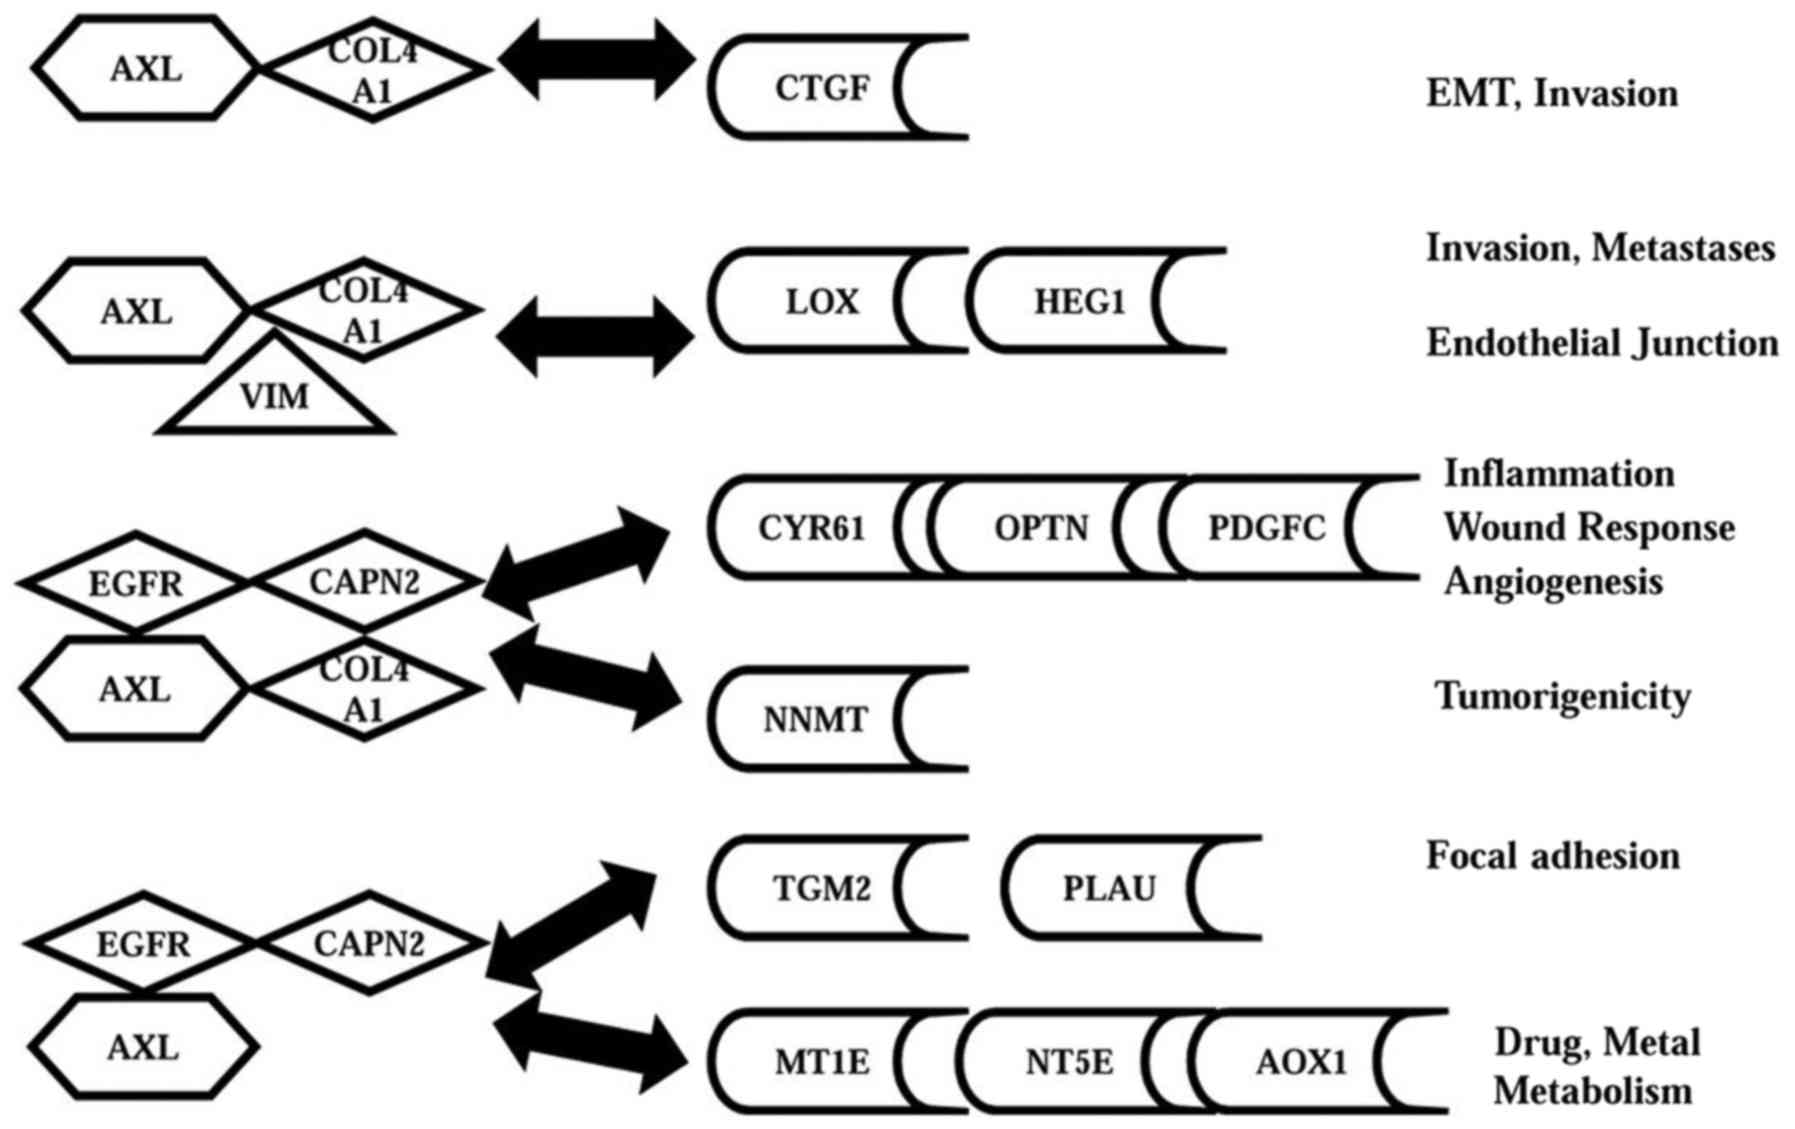
Table III shows that 4 input
baits containing AXL, were specifically and significantly
co-expressed with 4 different subsets of these 71 genes. This data
was used to develop a model for the AXL gene network (Fig. 2). Thus, Fig. 2 shows that the first ‘bait’
(AXL-COL4A1) was significantly co-expressed with CTGF, which
regulates EMT (19). The second
‘bait’ (AXL-COL4A1-VIM) was co-expressed with the HEG1 and LOX
genes which control vasculogenesis and metastasis (20). The third ‘bait’
(AXL-COL4A1-EGFR-CAPN2), was significantly co-expressed with 3
genes regulating wound healing, angiogenesis, and cell survival,
(PDGFC, CYR61, and OPTN; Table I).
This bait was also co-expressed with a gene that regulates
tumorigenicity (NNMT) (21). The
fourth ‘bait’ (AXL-EGFR-CAPN2) was co-expressed with 2 genes
regulating adhesion and drug resistance (TGM2, PLAU), and 3 genes
controlling stress response (MT1E, NT5E, and AOX1) (Tables I and III) (22).
| Table III.Pattern Miner data for genes
co-expressed with AXL. |
Table III.
Pattern Miner data for genes
co-expressed with AXL.
| Input gene Colum 1
input | Genes co-expressed
with each input Column 2 output | R-value with AXL
Column 3 | R-value with COL4A1
Column 4 | R-value with VIM
Column 5 | R-value with EGFR
Column 6 | R-value with CAPN2
Column 7 |
|---|
| AXL-COL4A1 |
|
| CTGF | 0.581 | 0.575 | 0.417 | 0.403 | 0.357 |
| AXL-COL4A1-VIM |
|
| HEG1 | 0.555 | 0.490 | 0.632 | X | 0.416 |
|
| LOX | 0.605 | 0.711 | 0.457 | X | 0.379 |
|
AXL-COL4A1-EGFR-CAPN2 |
|
| CYR61 | 0.764 | 0.645 | 0.390 | 0.664 | 0.554 |
|
| OPTN | 0.532 | 0.492 | 0.427 | 0.552 | 0.626 |
|
| PDGFC | 0.568 | 0.533 | X | 0.587 | 0.450 |
|
| NNMT | 0.730 | 0.740 | 0.440 | 0.700 | 0.500 |
| AXL-EGFR-CAPN2 |
|
| TGM2 | 0.564 | X | X | 0.648 | 0.549 |
|
| PLAU | 0.726 | 0.410 | X | 0.675 | 0.574 |
|
| MT1E | 0.637 | 0.387 | X | 0.541 | 0.523 |
|
| NT5E | 0.594 | X | 0.403 | 0.480 | 0.604 |
|
| AOX1 | 0.708 | X | 0.413 | 0.524 | 0.470 |
In summary, the AXL network has 4 distinct sets of
co-expressed genes with different functions. These 4 sets contain
12 genes which were 12–85 fold upregulated in MDA-MB-231 vs. MCF7
cells, and account for key functions of AXL (Tables I, III, and Fig. 2). Notably, 6 of these 12 genes
(HEG1, OPTN, MT1E, NNMT, AOX1, and TGM2) have not been reported for
TNBC.
Identifying and modelling the VIM gene
network
Since pattern miner analysis provided insights into
the AXL gene network, we undertook a similar study for the VIM
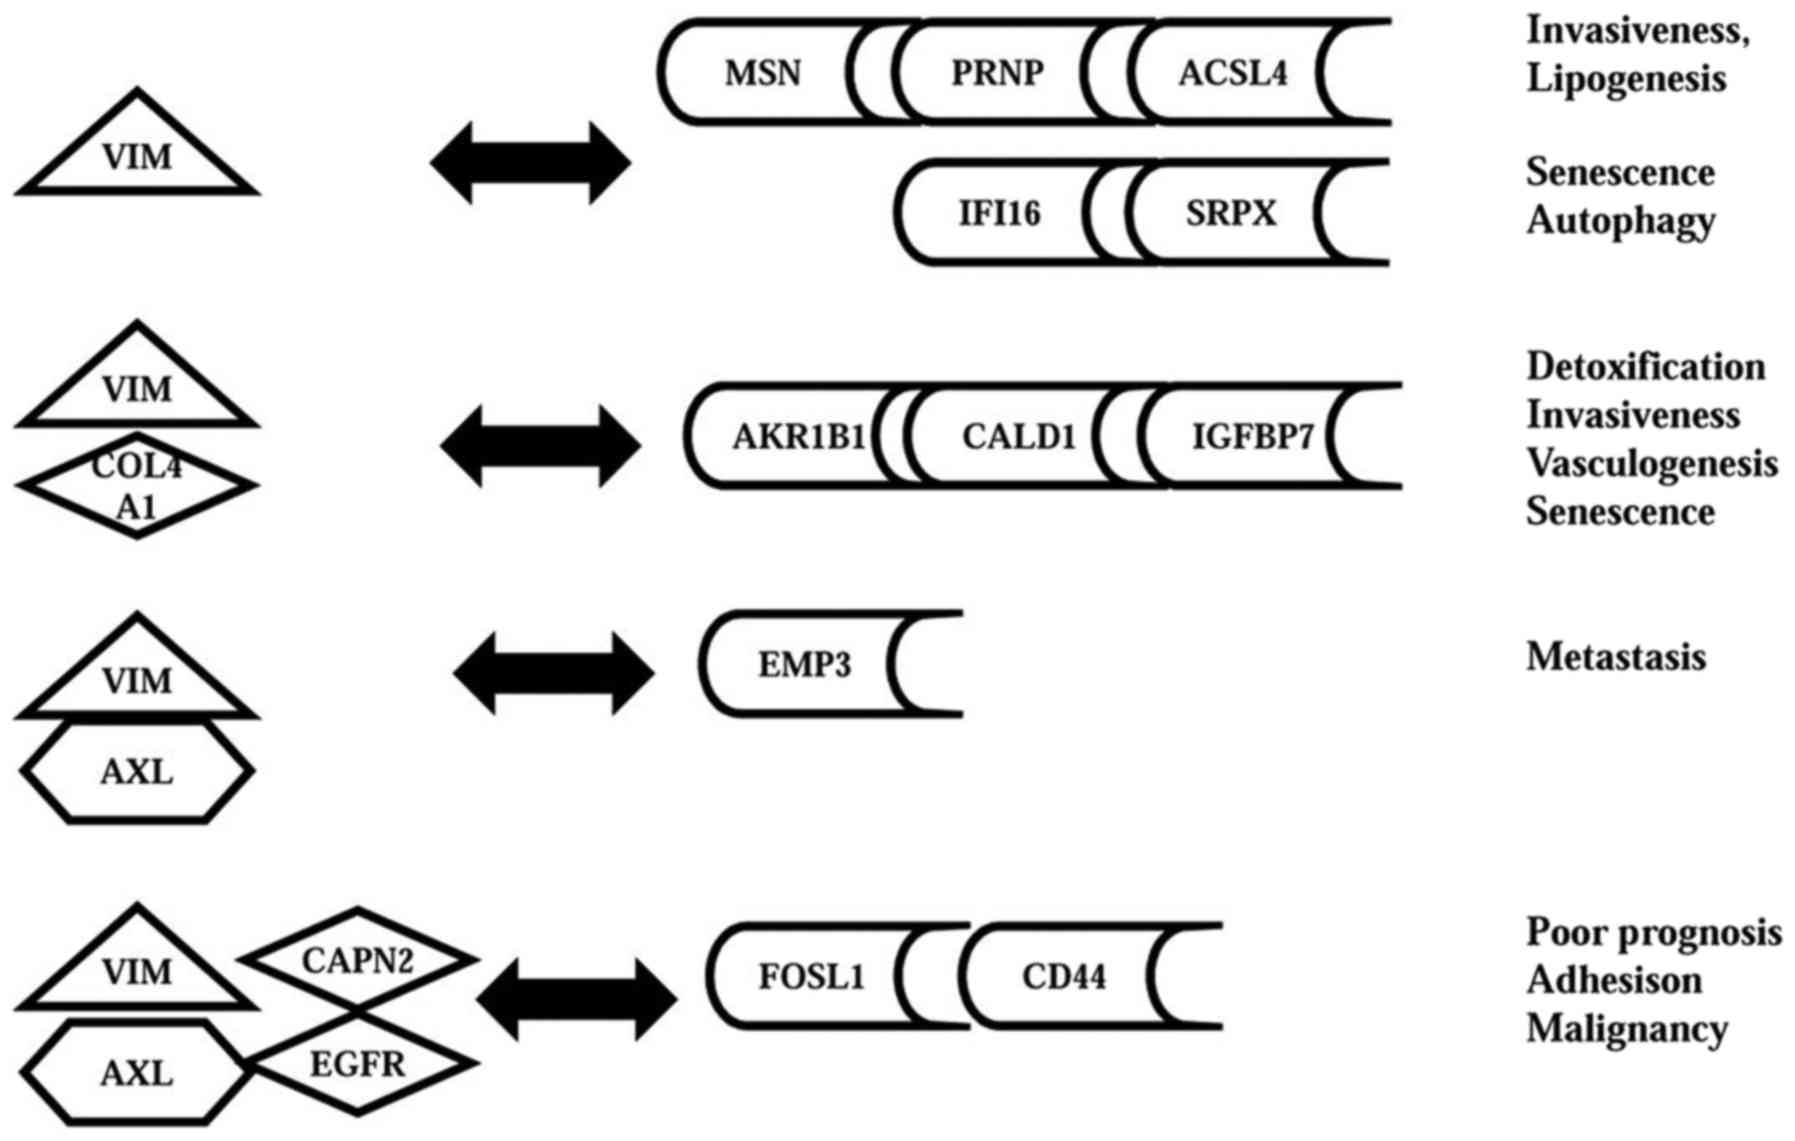
gene. Table IV shows that VIM,
and 3 input baits containing VIM, were specifically co-expressed
with 4 different subsets of the 71 genes upregulated in MDA-MB-231
vs. MCF7 cells. This data was used to develop a model for the VIM
gene network (Fig. 3). Thus, VIM
alone was co-expressed with 5 genes (MSN, PRNP, ACSL4, IFI16, and
SRPX) with varying functions. MSN regulates invasiveness, PRNP
protects against endoplasmic reticular stress (Table I), and ACSL4 promotes lipogenesis
(23). The IFI16 and SRPX genes
regulate senescence and autophagy, respectively (24,25)
(Tables II and IV). The first ‘bait’ (VIM-COL4A1), was
co-expressed with three genes (CALD1, AKR1B1, and IGFBP7) that
regulate motility, detoxification, and senescence (26,27)
(Tables II and IV). The second ‘bait’ (VIM-AXL), was
exclusively co-expressed with an oncogene correlated with lymph
node metastases (EMP3) (28). The
third bait (VIM-AXL-EGFR-CAPN2), was co-expressed with the FOSL1
and CD44 genes. Notably, the FOSL1/Fra-1 transcription factor
controls the invasive phenotype of MDA-MB-231 cells (29), and can regulate expression of 3
other genes upregulated in these cells (CD44, VEGFC, and ADORA2B).
CD44 regulates extracellular interactions, and is a marker of
tumour progression (30), whereas
VEGFC and ADORA2B regulate migration (31).
| Table IV.Pattern Miner Data for Genes
Co-expressed with VIM. |
Table IV.
Pattern Miner Data for Genes
Co-expressed with VIM.
| Input gene Colum 1
input | Genes co-expressed
with each input Column 2 output | R value with VIM
Column 3 | R value with COL4A1
Column 4 | R value with AXL
Column 5 | R value with EGFR
Column 6 | R value with CAPN2
Column 7 |
|---|
| VIM |
|
| MSN | 0.802 | 0.351 | 0.355 | X | X |
|
| PRNP | 0.624 | X | X | X | 0.445 |
|
| ACSL4 | 0.565 | X | 0.436 | X | 0.390 |
|
| IFI16 | 0.555 | X | X | X | X |
|
| SRPX | 0.533 | X | X | X | X |
| VIM-COL4A1 |
|
| AKR1B1 | 0.614 | 0.584 | 0.423 | 0.379 | X |
|
| IGFBP7 | 0.493 | 0.559 | 0.363 | X | X |
|
| CALD1 | 0.465 | 0.651 | X | X | X |
| VIM-AXL |
|
| EMP3 | 0.754 | X | 0.466 | X | 0.363 |
|
VIM-AXL-EGFR-CAPN2 |
|
| CD44 | 0.594 | 0.397 | 0.598 | 0.492 | 0.650 |
|
| FOSL1 | 0.589 | X | 0.750 | 0.579 | 0.722 |
In summary, the 4 components of the VIM network
contain 11 genes which were 12–105 fold upregulated in MDA-MB-231
vs. MCF7 cells, and account for key functions of VIM (Tables I, II and IV and Fig.
3). Notably, 6 of these 11 genes (PRNP, AKR1B1, CALD1, EMP3,
SRPX, and IFI16) have not been reported for TNBC.
Comparison of the AXL and VIM gene
networks
We carefully compared the AXL and VIM gene networks
shown in Figs. 2 and 3. Notably, these networks contain very
different subsets of the 71 genes upregulated in MDA-MB-231 vs.
MCF7 cells. The AXL network has 12 genes regulating EMT, invasion,
adhesion, and chemo-resistance, whereas the VIM network has 11
genes regulating lipogenesis, senescence, autophagy, and
metastases. These results strongly support our hypothesis that AXL
and VIM participate in 2 separate networks of co-expressed genes
that are highly upregulated in MDA-MB-231 vs. MCF7 cells.
Identifying therapeutic targets in
MDA-MB-231 cells
One of our objectives was to identify novel
therapeutic targets in MDA-MB-231 cells. The gene card database
showed that 15 of the 71 genes upregulated in MDA-MB-231 vs. MCF7
cells, are therapeutic targets in other cancers. These 15
therapeutic targets regulate EGFR signalling, invasion,
inflammation, angiogenesis, metastases, senescence, and autophagy
(CD44, CTGF, CYR61/CCN1, EMP3, HEG1, IL8, ADORA2B, AGPS, AKR1B1,
EXT1, IGFBP7, PLAC8, PTRF, SRGN, and TMEM158/RIS1). Six of these 15
target genes (CD44, CTGF, CYR61/CCN1, EMP3, HEG1, and IL8) are
reported for TNBC. Notably, three of these 6 known therapeutic
targets are in the AXL network in Fig.
2 (CTGF, CYR61/CCN1, and HEG1), and another 2 are in the VIM
network in Fig. 3 (CD44 and EMP3).
However, 9 of these 15 therapeutic targets are novel for TNBC, and
are in Table II (ADORA2B, AGPS,
AKR1B1, EXT1, IGFBP7, PLAC8, PTRF, SRGN, and TMEM158/RIS1).
Interestingly, 2 of these 9 novel genes are in the VIM network.
(AKR1B1 and IGFBP7) (Fig. 3). We
also note 2 other novel, potential therapeutic target genes which
regulate iron uptake (CYBRD1 and FXYD5, Table II).
To summarize, our re-analysis of the 6 GEO datasets
identified many therapeutic targets from the list of 71 genes
upregulated in MDA-MB-231 vs. MCF7 cells. Thus, we identified 6
known therapeutic gene targets reported in other cancers, 9 novel
therapeutic targets for TNBC, and 2 potential targets which
regulate iron uptake (Table
II).
Discussion
This study is unique for five reasons. First, we
re-analysed raw data from 6 microarray GEO datasets and identified
a common list of 71 genes upregulated in MDA-MB-231 vs. MCF7 cells.
Second, we identified novel upregulated genes regulating migration
and metastasis in MDA-MB-231 vs. MCF7 cells. This is important,
since migration and metastasis are phenotypic hallmarks of TNBC.
Third, we found 9 novel upregulated genes that promote senescence,
autophagy, chemo-resistance, and stem-cell like properties of
MDA-MB-231 cells. Fourth, we used pattern miner to determine
whether any of the 71 genes upregulated in MDA-MB-231 vs. MCF7
cells, were significantly co-expressed with different combinations
of the 5 ‘migration-regulating genes’ (EGFR, AXL, VIM, CAPN2, and
COL4A1). Interestingly, our results identified 2 distinct,
non-overlapping networks of upregulated genes significantly
co-expressed with either AXL or VIM. Notably, these networks can
drive malignancy by regulating very different processes in
MDA-MB-231 cells. Furthermore, these networks contain known
therapeutic target genes, and other novel genes that can expand the
signalling network and functionality of the AXL and VIM proteins in
MDA-MB-231 cells. Fifth, we identified 6 known therapeutic targets,
9 novel therapeutic targets, and 2 potential therapeutic target
genes; from the list of 71 genes upregulated in MDA-MB-231 vs. MCF7
cells. All novel therapeutic targets for TNBC require experimental
verification.
Acknowledgements
The authors sincerely thank the Management of Dr.
M.G.R. Educational and Research Institute (Chennai, India) for
providing laboratory and computational facilities. The authors
thank Dr. Rama Vaidyanathan, Director R&D (Dr. M.G.R.
Educational and Research Institute) for valuable support.
Funding
The present study was supported by the Science and
Engineering Research Board, Government of India under the Fast
track Scheme for Young Scientists (grant no.
SR/FT/LS-140/2010).
Availability of data and materials
The original microarry data are freely available
from the GEO datasets of NCBI (https://www.ncbi.nlm.nih.gov/gds). Analysis of these
microarray data for this study will be made available from the
corresponding author on reasonable request.
Authors' contributions
SM and MR contributed to the acquisition and
analysis of data, and preparation of figures. VNS and SN performed
the interpretation of data, manuscript writing and critical
revisions for important intellectual content. All authors approved
the final version to be published.
Ethics approval and consent to
participate
Not applicable.
Patient consent for publication
Not applicable.
Competing interests
The authors declare that they have no competing
interests.
Glossary
Abbreviations
Abbreviations:
|
DEGs
|
differentially expressed genes
|
|
EGFR
|
epidermal growth factor receptor
|
|
EMT
|
epithelial-mesenchymal transition
|
|
GEO
|
Gene Expression Omnibus
|
|
GO
|
Gene Ontology
|
|
ER
|
estrogen receptor
|
|
PPIs
|
protein-protein interactions
|
|
PR
|
progesterone receptor
|
|
TNBC
|
triple negative breast cancers
|
References
|
1
|
Cleator S, Heller W and Coombes RC:
Triple-negative breast cancer: Therapeutic options. Lancet Oncol.
8:235–244. 2007. View Article : Google Scholar : PubMed/NCBI
|
|
2
|
Lehmann BD, Bauer JA, Chen X, Sanders ME,
Chakravarthy AB, Shyr Y and Pietenpol JA: Identification of human
triple-negative breast cancer subtypes and preclinical models for
selection of targeted therapies. J Clin Invest. 121:2750–2767.
2011. View
Article : Google Scholar : PubMed/NCBI
|
|
3
|
O'Reilly EA, Gubbins L, Sharma S, Tully R,
Guang MH, Weiner-Gorzel K, McCaffrey J, Harrison M, Furlong F, Kell
M and McCann A: The fate of chemoresistance in triple negative
breast cancer (TNBC). BBA Clin. 3:257–275. 2015. View Article : Google Scholar : PubMed/NCBI
|
|
4
|
Tanaka K, Tokunaga E, Inoue Y, Yamashita
N, Saeki H, Okano S, Kitao H, Oki E, Oda Y and Maehara Y: Impact of
expression of vimentin and Axl in breast cancer. Clin Breast
Cancer. 16:520–526.e2. 2016. View Article : Google Scholar : PubMed/NCBI
|
|
5
|
Meyer AS, Miller MA, Gertler FB and
Lauffenburger DA: The receptor AXL diversifies EGFR signaling and
limits the response to EGFR-targeted inhibitors in triple-negative
breast cancer cells. Sci Signal. 6:ra662013. View Article : Google Scholar : PubMed/NCBI
|
|
6
|
Simon R, Lam A, Li MC, Ngan M, Menenzes S
and Zhao Y: Analysis of gene expression data using BRB-ArrayTools.
Cancer Inform. 3:11–17. 2007. View Article : Google Scholar : PubMed/NCBI
|
|
7
|
Reinhold WC, Mergny JL, Liu H, Ryan M,
Pfister TD, Kinders R, Parchment R, Doroshow J, Weinstein JN and
Pommier Y: Exon array analyses across the NCI-60 reveal potential
regulation of TOP1 by transcription pausing at guanosine quartets
in the first intron. Cancer Res. 70:2191–2203. 2010. View Article : Google Scholar : PubMed/NCBI
|
|
8
|
Pfister TD, Reinhold WC, Agama K, Gupta S,
Khin SA, Kinders RJ, Parchment RE, Tomaszewski JE, Doroshow JH and
Pommier Y: Topoisomerase I levels in the NCI-60 cancer cell line
panel determined by validated ELISA and microarray analysis and
correlation with indenoisoquinoline sensitivity. Mol Cancer Ther.
8:1878–1884. 2009. View Article : Google Scholar : PubMed/NCBI
|
|
9
|
Kohn KW, Zeeberg BR, Reinhold WC, Sunshine
M, Luna A and Pommier Y: Gene expression profiles of the NCI-60
human tumor cell lines define molecular interaction networks
governing cell migration processes. PLoS One. 7:e357162012.
View Article : Google Scholar : PubMed/NCBI
|
|
10
|
Cufí S, Vazquez-Martin A,
Oliveras-Ferraros C, Martin-Castillo B, Vellon L and Menendez JA:
Autophagy positively regulates the CD44(+) CD24(−/low) breast
cancer stem-like phenotype. Cell Cycle. 10:3871–3885. 2011.
View Article : Google Scholar : PubMed/NCBI
|
|
11
|
Liu YN, Chang TH, Tsai MF, Wu SG, Tsai TH,
Chen HY, Yu SL, Yang JC and Shih JY: IL-8 confers resistance to
EGFR inhibitors by inducing stem cell properties in lung cancer.
Oncotarget. 6:10415–10431. 2015.PubMed/NCBI
|
|
12
|
Price JT, Tiganis T, Agarwal A, Djakiew D
and Thompson EW: Epidermal growth factor promotes MDA-MB-231 breast
cancer cell migration through a phosphatidylinositol 3′-kinase and
phospholipase C-dependent mechanism. Cancer Res. 59:5475–5478.
1999.PubMed/NCBI
|
|
13
|
Satelli A and Li S: Vimentin in cancer and
its potential as a molecular target for cancer therapy. Cell Mol
Life Sci. 68:3033–3046. 2011. View Article : Google Scholar : PubMed/NCBI
|
|
14
|
Liu YR, Jiang YZ, Xu XE, Yu KD, Jin X, Hu
X, Zuo WJ, Hao S, Wu J, Liu GY, et al: Comprehensive transcriptome
analysis identifies novel molecular subtypes and subtype-specific
RNAs of triple-negative breast cancer. Breast Cancer Res.
18:332016. View Article : Google Scholar : PubMed/NCBI
|
|
15
|
Wang X, Qian H and Zhang S: Discovery of
significant pathways in breast cancer metastasis via module
extraction and comparison. IET Syst Biol. 8:47–55. 2014. View Article : Google Scholar : PubMed/NCBI
|
|
16
|
Cortesio CL, Chan KT, Perrin BJ, Burton
NO, Zhang S, Zhang ZY and Huttenlocher A: Calpain 2 and PTP1B
function in a novel pathway with Src to regulate invadopodia
dynamics and breast cancer cell invasion. J Cell Biol. 180:957–971.
2008. View Article : Google Scholar : PubMed/NCBI
|
|
17
|
Miyake M, Hori S, Morizawa Y, Tatsumi Y,
Toritsuka M, Ohnishi S, Shimada K, Furuya H, Khadka VS, Deng Y, et
al: Collagen type IV alpha 1 (COL4A1) and collagen type XIII alpha
1 (COL13A1) produced in cancer cells promote tumor budding at the
invasion front in human urothelial carcinoma of the bladder.
Oncotarget. 8:36099–36114. 2017. View Article : Google Scholar : PubMed/NCBI
|
|
18
|
Yi JS, Mun DG, Lee H, Park JS, Lee JW, Lee
JS, Kim SJ, Cho BR, Lee SW and Ko YG: PTRF/cavin-1 is essential for
multidrug resistance in cancer cells. J Proteome Res. 12:605–614.
2013. View Article : Google Scholar : PubMed/NCBI
|
|
19
|
Zhu X, Zhong J, Zhao Z, Sheng J, Wang J,
Liu J, Cui K, Chang J, Zhao H and Wong S: Epithelial derived CTGF
promotes breast tumor progression via inducing EMT and collagen I
fibers deposition. Oncotarget. 6:25320–25338. 2015. View Article : Google Scholar : PubMed/NCBI
|
|
20
|
Liu JL, Wei W, Tang W, Jiang Y, Yang HW,
Li JT and Zhou X: Silencing of lysyl oxidase gene expression by RNA
interference suppresses metastasis of breast cancer. Asian Pac J
Cancer Prev. 13:3507–3511. 2012. View Article : Google Scholar : PubMed/NCBI
|
|
21
|
Zhang J, Wang Y, Li G, Yu H and Xie X:
Down-regulation of nicotinamide N-methyltransferase induces
apoptosis in human breast cancer cells via the
mitochondria-mediated pathway. PLoS One. 9:e892022014. View Article : Google Scholar : PubMed/NCBI
|
|
22
|
Loi S, Pommey S, Haibe-Kains B, Beavis PA,
Darcy PK, Smyth MJ and Stagg J: CD73 promotes anthracycline
resistance and poor prognosis in triple negative breast cancer.
Proc Natl Acad Sci USA. 110:pp. 11091–11096. 2013; View Article : Google Scholar : PubMed/NCBI
|
|
23
|
Wu X, Li Y, Wang J, Wen X, Marcus MT,
Daniels G, Zhang DY, Ye F, Wang LH, Du X, et al: Long chain fatty
Acyl-CoA synthetase 4 is a biomarker for and mediator of hormone
resistance in human breast cancer. PLoS One. 8:e770602013.
View Article : Google Scholar : PubMed/NCBI
|
|
24
|
Clarke CJ, Hii LL, Bolden JE and Johnstone
RW: Inducible activation of IFI 16 results in suppression of
telomerase activity, growth suppression and induction of cellular
senescence. J Cell Biochem. 109:103–112. 2010.PubMed/NCBI
|
|
25
|
Tambe Y, Yamamoto A, Isono T, Chano T,
Fukuda M and Inoue H: The drs tumor suppressor is involved in the
maturation process of autophagy induced by low serum. Cancer Lett.
283:74–83. 2009. View Article : Google Scholar : PubMed/NCBI
|
|
26
|
Wu X, Li X, Fu Q, Cao Q, Chen X, Wang M,
Yu J, Long J, Yao J, Liu H, et al: AKR1B1 promotes basal-like
breast cancer progression by a positive feedback loop that
activates the EMT program. J Exp Med. 214:1065–1079. 2017.
View Article : Google Scholar : PubMed/NCBI
|
|
27
|
Benatar T, Yang W, Amemiya Y, Evdokimova
V, Kahn H, Holloway C and Seth A: IGFBP7 reduces breast tumor
growth by induction of senescence and apoptosis pathways. Breast
Cancer Res Treat. 133:563–573. 2012. View Article : Google Scholar : PubMed/NCBI
|
|
28
|
Wang YW, Cheng HL, Ding YR, Chou LH and
Chow NH: EMP1, EMP 2, and EMP3 as novel therapeutic targets in
human cancer. Biochim Biophys Acta. 1868:199–211. 2017.PubMed/NCBI
|
|
29
|
Young MR and Colburn NH: Fra-1 a target
for cancer prevention or intervention. Gene. 379:1–11. 2006.
View Article : Google Scholar : PubMed/NCBI
|
|
30
|
Bourguignon LY: CD44 mediated oncogenic
signaling and cytoskeleton activation during mammary tumor
progression. J Mammary Gland Neoplasia. 6:287–297. 2001. View Article : Google Scholar
|
|
31
|
Desmet CJ, Gallenne T, Prieur A, Reyal F,
Visser NL, Wittner BS, Smit MA, Geiger TR, Laoukili J, Iskit S, et
al: Identification of a pharmacologically tractable Fra-1/ADORA2B
axis promoting breast cancer metastasis. Proc Natl Acad Sci USA.
110:pp. 5139–5144. 2013; View Article : Google Scholar : PubMed/NCBI
|