Introduction
As a systemic inflammatory response syndrome (SIRS)
induced by infection, sepsis is a life-threatening disease
(1). The most common symptoms of
sepsis are fever, confusion, and increased breathing and heart rate
(2). Sepsis is usually caused by
infection in the abdomen, the urinary tract and the lungs (3). Globally, sepsis accounts for a high
mortality every year and results in the highest mortality in
hospitals (4). Worldwide, the
estimated incidence of sepsis is 18 million cases each year
(5). In the United States, sepsis
impacts ~3 in 1,000 people (6). In
addition, severe sepsis results in >200,000 mortality incidences
each year (7). Therefore,
exploring the mechanisms of sepsis and developing novel therapies
are necessary.
Callahan and Supinski demonstrated that
downregulation of genes encoding important glycolytic and electron
transport proteins help the development and maintenance of
abnormalities in cellular energy metabolism in patients with sepsis
(8). Nuclear factor-erythroid
2-related factor 2, a leucine zipper transcription factor that
mediates stress response and redox balance, determines survival of
sepsis patients through mounting a proper innate immune response
(9,10). Hypoxia-inducible factor 1α (HIF-1α)
in hypoxic and inflamed areas can release T cells that contribute
to anti-bacterial response; thus, HIF-1α in T cells may be used for
therapeutic anti-pathogen strategies (11,12).
Several studies have reported that breast cancer 1, an important
regulator of cell survival and DNA damage repair, can serve as
therapeutic target for decreasing multiple-organ failure, systemic
inflammation, and mortality in experimental sepsis (13–15).
Sepsis and endotoxemia can cause declining B-cell CLL/lymphoma 2
(Bcl-2) levels in lymphocytes, and overexpression of lymphocyte
Bcl-2 has been proved to improve sepsis survival (16,17).
In 2016, Davenport et al (18) analyzed the transcriptomic response
of 265 patients with sepsis in a discovery cohort, and screened
3080 differentially expressed genes (DEGs) in sepsis response
signature 1 (including 820 upregulated and 2,260 downregulated
genes) with a fold change (FC) >1.5 and adjusted P<0.05.
Using more strict thresholds, the present study investigated the
DEGs between the survival and the non-survival group. In addition,
protein-protein interaction (PPI) network and module analyses were
conducted to identify key genes implicated in sepsis. Furthermore,
a support vector machine (SVM) classifier was constructed and
performed to further confirm the key genes identified.
Materials and methods
Expression profile data
Expression profiles of E-MTAB-4421 (used for the
main analysis) and E-MTAB-4451 (used for the validation) were
downloaded from the European Molecular Biology Laboratory-European
Bioinformatics Institute database (www.ebi.ac.uk/arrayexpress/experiments), both of which
were deposited by Davenport et al (18) and sequenced on the array of
A-MEXP-2210-Illumina HumanHT-12_V4_0_R1_15002873_B. E-MTAB-4421
included leukocytes isolated from 265 patients with sepsis
(including 207 survivors and 58 non-survivors). Additionally,
E-MTAB-4451 included leukocytes isolated from 106 patients with
sepsis (including 56 survivors and 50 non-survivors). The patients
were recruited from 29 intensive care units between Feb 1, 2006,
and Feb 20, 2014. Following the admission of the patients, total
blood leucocytes were rapidly isolated from whole blood samples
(~10 ml) using the LeukoLOCK depletion filter technology (Thermo
Fisher Scientific, Inc., Waltham, MA, USA) (18). The study of Davenport et al
(18) was approved by national
ethics committees and locally individual participating centers. In
addition, the patients (aged >18 years) with sepsis caused by
community-acquired pneumonia provided informed consent forms.
DEG screening
Probes corresponded to gene symbols were based on
the annotation platform of Illumina HumanHT-12_V4. In addition,
unloaded probes were filtered out. Gene expression value was
obtained by calculating the mean value of the probes corresponded
to the gene. Based on E-MTAB-4421, the DEGs between the survival
group and the non-survival group were analyzed by the linear models
for microarray data using R (limma package; www.r-project.org/) (19). Genes with |logFC|>1 and
P<0.05 were considered as DEGs. Using the Pheatmap package
(cran.r-project.org/web/packages/pheatmap/index.html)
(20) in R, hierarchical
clustering analysis was conducted for the DEGs.
PPI network analysis
The Biological General Repository for Interaction
Datasets database (BioGRID, version BIOGRID-ORGANISM-3.4.135;
www.thebiogrid.org) (21) which includes genetic and physical
interactions, was utilized to map the identified DEGs into the
human PPI network. Additionally, the non-DEGs which interacted with
≥10 DEGs were also expanded into PPI network. The complete PPI
network was constructed by the Cytoscape software (version 2.8;
www.cytoscape.org) (22). In the PPI network, nodes and edges
separately represented proteins and their interactions.
Furthermore, the degree of a node was equal to the number of edges
linked with it. Additionally, the Mcode (threshold: The degree of
each node in module >2) (23)
and BiNGO plugins (threshold, adjusted P<0.05) (24) in the Cytoscape software were
applied to perform module division and module annotation,
respectively.
SVM classifier construction
Based on statistical theory, SVMs are effective
classifiers, which can be applied in two-class classification
problems of gene expression profiles and achieve high
classification accuracy (25).
Based on the expression values of key genes in the identified
modules, the SVM function of e1071 package (version 1.6–7;
cran.r-project.org/web/packages/e1071/index.html)
(26) in R was used to confirm
whether the key genes could distinguish between the two groups of
samples (parameter: Gamma=0.45, cost=5 and cross=10).
Verification and assessment of the
efficiency of SVM classifier
To verify the SVM classifier, the expression values
of the key genes were extracted from E-MTAB-4451. In addition, the
efficiency of SVM classifier was assessed by the sensitivity,
specificity, and positive-(PPV) and negative predictive values
(NPV) and the area under receiver operating characteristic curve
(AUROC).
Results
DEGs analysis
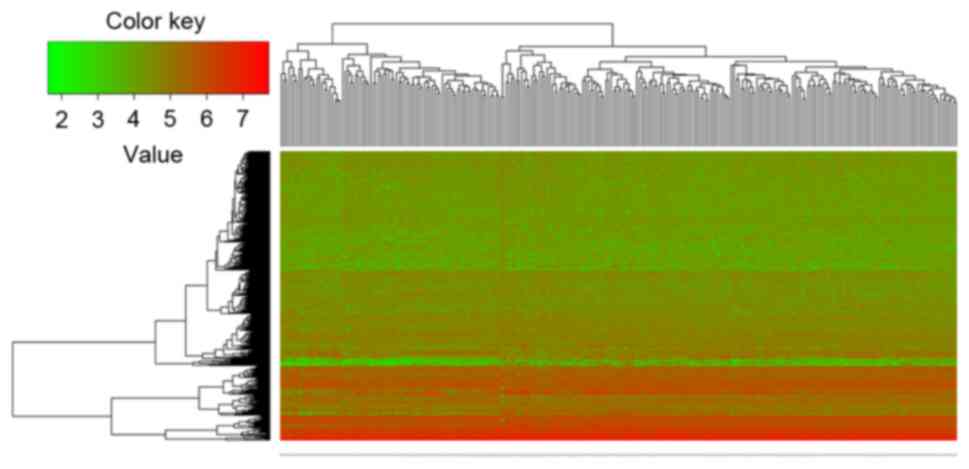
Compared with the non-survival group, there were 384
DEGs in the survival group. Among these DEGs, 153 genes were
significantly upregulated and 231 genes were significantly
downregulated (Fig. 1). The top 10
DEGs with the smallest P-values are listed in Table I. Additionally, the heatmap of
hierarchical clustering illustrated that the DEGs could distinguish
the two groups of samples (Fig.
1).
 | Table I.Top 10 differentially expressed genes
with the smallest P-values. |
Table I.
Top 10 differentially expressed genes
with the smallest P-values.
| Gene | P-value | Log fold change |
|---|
| SYNE1 | 0.000508 | −1.09577 |
| DSCR4 | 0.000603 | 1.049525 |
| GNB5 | 0.000691 | −1.09117 |
| KIAA1271 | 0.000875 | −1.07996 |
| LOC651643 | 0.001157 | −1.09987 |
| LOC730546 | 0.001244 | −1.09267 |
| KRT24 | 0.001267 | −1.08809 |
| LOC645445 | 0.001676 | 1.022562 |
| LOC650261 | 0.001911 | −1.11435 |
| UPF2 | 0.002267 | −1.0723 |
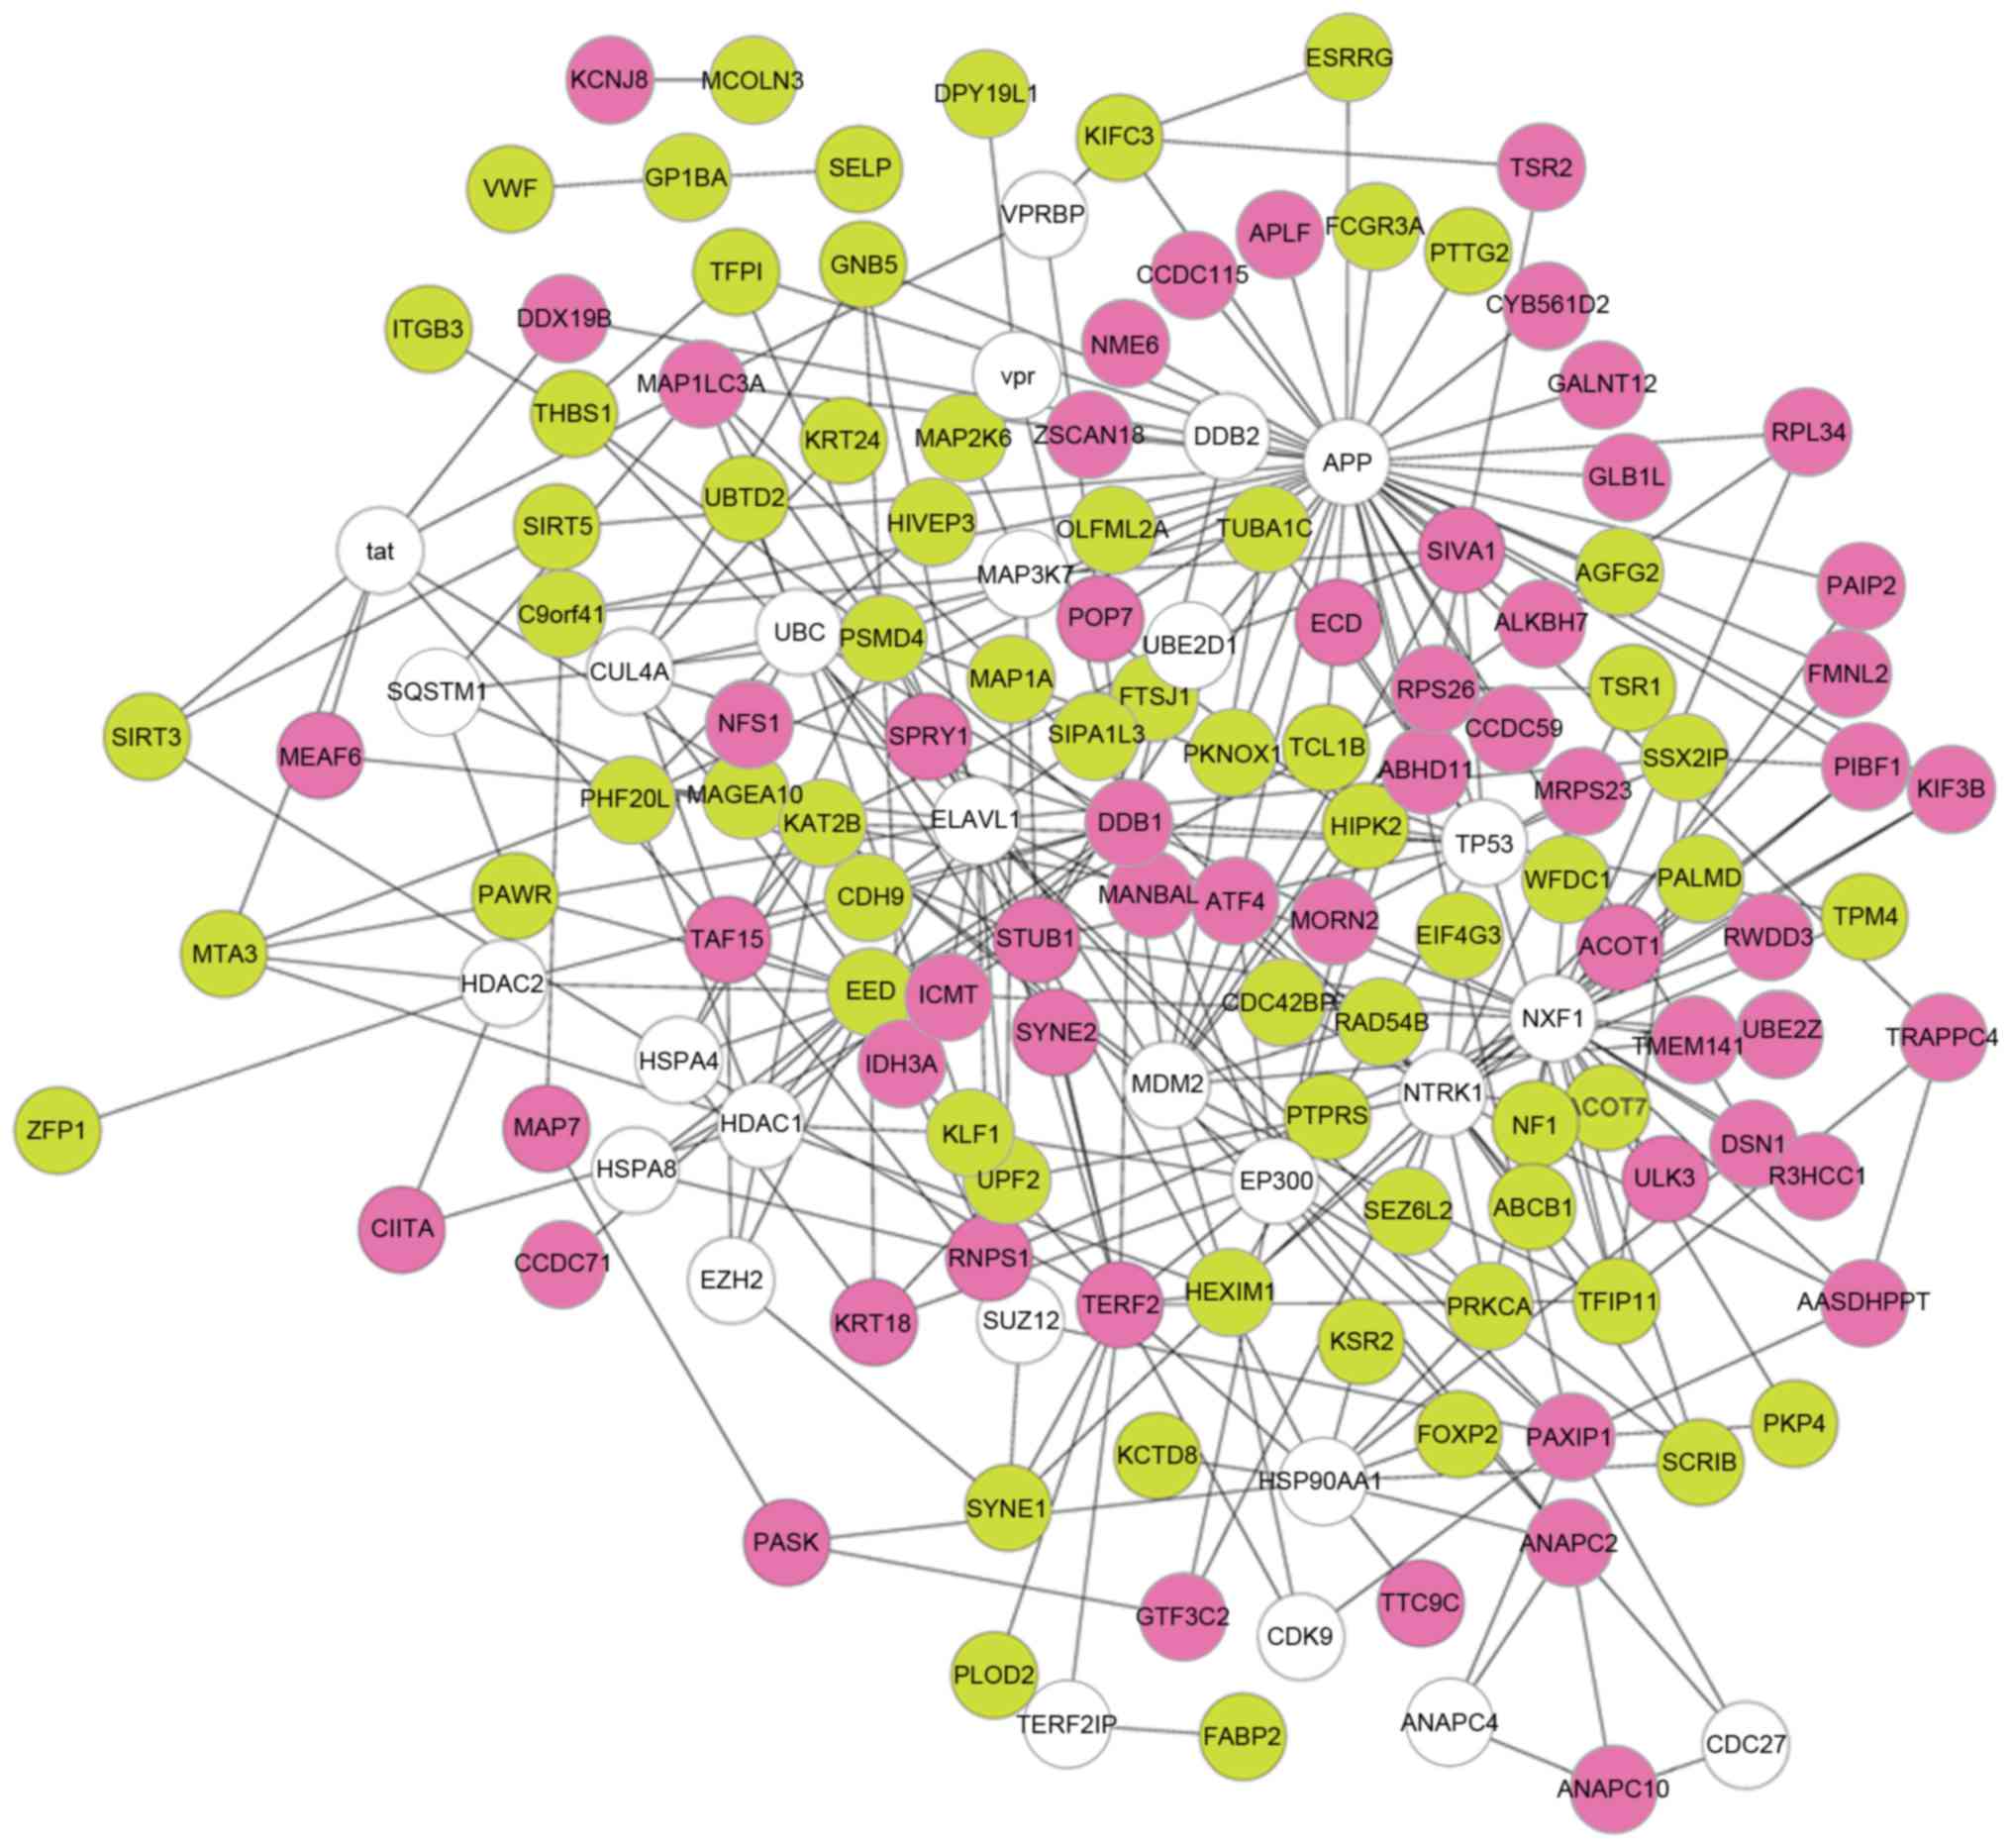
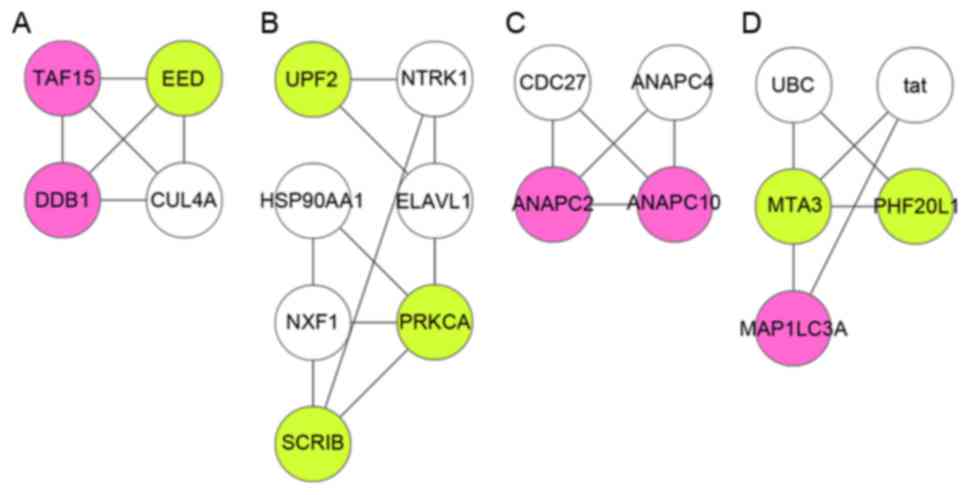
PPI network analysis
A PPI network was constructed for the DEGs, which
had 148 nodes and 305 interactions (Fig. 2). Based on the Mcode plugin, the
PPI network was divided into 4 modules (module A, B, C and D;
Fig. 3). A total of 11 DEGs
[including microtubule-associated protein 1 light chain 3 alpha
(MAP1LC3A), protein kinase C-alpha (PRKCA), metastasis associated 1
family member 3 (MTA3), and scribbled planar cell polarity protein
(SCRIB)] were involved in the 4 modules, and almost all of them
were among the top 21 in the PPI network according to degree rank
(Table II). In addition, SCRIB
and PRKCA in module B, as well as MAP1LC3A and MTA3 in module D
hold interactions with each other. Using the BiNGO plugin,
functional annotation was conducted for the 4 modules. A total of
9, 10, 12 and 5 functional terms were enriched for the DEGs in
modules A, B, C and D, respectively. The main terms included
ubiquitin-dependent protein catabolic process (module A,
P=1.11E-03), histone H3-T6 phosphorylation (module B, P=9.78E-04),
regulation of mitosis (module C, P=1.11E-03), and autophagic
vacuole assembly (module D, P=1.11E-03, which involved MAP1LC3A;
Table III).
| Table II.Differentially expressed genes
involved in the 4 modules identified from the protein-protein
interaction network. |
Table II.
Differentially expressed genes
involved in the 4 modules identified from the protein-protein
interaction network.
| Gene | P-value | Log fold change | Degree | Degree rank in
network | Module |
|---|
| DDB1 | 0.025129 | 1.015005 | 15 | 1 | A |
| EED | 0.016585 | −1.06699 | 14 | 2 | A |
| MAP1LC3A | 0.037985 | 1.014367 | 7 | 10 | D |
| TAF15 | 0.037216 | 1.007017 | 7 | 10 | A |
| ANAPC2 | 0.010137 | 1.022059 | 6 | 12 | C |
| PRKCA | 0.010663 | −1.04022 | 6 | 12 | B |
| MTA3 | 0.035314 | −1.04998 | 5 | 15 | D |
| UPF2 | 0.002267 | −1.0723 | 5 | 15 | B |
| PHF20L1 | 0.030279 | −1.15276 | 4 | 21 | D |
| SCRIB | 0.030139 | −1.07045 | 4 | 21 | B |
| ANAPC10 | 0.022623 | 1.021597 | 3 | 43 | C |
| Table III.Functions enriched for the genes
involved in the 4 modules. |
Table III.
Functions enriched for the genes
involved in the 4 modules.
| Module | Adjusted
P-value | Gene number | Description | Gene symbol |
|---|
| Module A | 2.07E-02 | 2 |
GO:6511~ubiquitin-dependent protein
catabolic process | CUL4A, DDB1 |
|
| 2.07E-02 | 2 |
GO:19941~modification-dependent protein
catabolic process | CUL4A, DDB1 |
|
| 2.07E-02 | 2 | GO:6281~DNA
repair | CUL4A, DDB1 |
|
| 2.07E-02 | 2 | GO:44257~cellular
protein catabolic process | CUL4A, DDB1 |
|
| 2.93E-02 | 1 |
GO:718~nucleotide-excision repair, DNA
damage removal | DDB1 |
|
| 3.40E-02 | 2 | GO:33554~cellular
response to stress | CUL4A, DDB1 |
|
| 4.43E-02 | 2 |
GO:6508~proteolysis | CUL4A, DDB1 |
|
| 4.58E-02 | 2 | GO:44248~cellular
catabolic process | CUL4A, DDB1 |
|
| 4.58E-02 | 2 |
GO:51704~multi-organism process | CUL4A, DDB1 |
| Module B | 4.33E-02 | 1 | GO:35408~histone
H3-T6 phosphorylation | PRKCA |
|
| 4.33E-02 | 1 |
GO:35405~histone-threonine
phosphorylation | PRKCA |
|
| 4.33E-02 | 1 | GO:46325~negative
regulation of glucose import | PRKCA |
|
| 4.33E-02 | 1 | GO:51965~positive
regulation of synaptogenesis | PRKCA |
|
| 4.33E-02 | 2 | GO:42330~taxis | PRKCA, SCRIB |
|
| 4.33E-02 | 2 |
GO:6935~chemotaxis | PRKCA, SCRIB |
|
| 4.33E-02 | 1 | GO:32863~activation
of Rac GTPase activity | SCRIB |
|
| 4.33E-02 | 1 | GO:60561~apoptosis
involved in morphogenesis | SCRIB |
|
| 4.33E-02 | 1 | GO:1921~positive
regulation of receptor recycling | SCRIB |
|
| 4.33E-02 | 1 |
GO:35089~establishment of apical/basal
cell polarity | SCRIB |
| Module C | 2.52E-02 | 1 | GO:7088~regulation
of mitosis | ANAPC10 |
|
| 2.52E-02 | 1 | GO:51783~regulation
of nuclear division | ANAPC10 |
|
| 2.19E-03 | 1 | GO:8054~cyclin
catabolic process | ANAPC2 |
|
| 7.21E-03 | 1 | GO:45773~positive
regulation of axon extension | ANAPC2 |
|
| 8.55E-03 | 1 | GO:48814~regulation
of dendrite morphogenesis | ANAPC2 |
|
| 9.45E-03 | 1 | GO:48639~positive
regulation of developmental growth | ANAPC2 |
|
| 3.37E-02 | 1 | GO:10720~positive
regulation of cell development | ANAPC2 |
|
| 3.38E-02 | 1 | GO:45927~positive
regulation of growth | ANAPC2 |
|
| 4.13E-02 | 1 | GO:10975~regulation
of neuron projection development | ANAPC2 |
|
| 4.89E-02 | 1 | GO:31344~regulation
of cell projection organization | ANAPC2 |
|
| 9.69E-03 | 2 | GO:51726~regulation
of cell cycle | ANAPC2,
ANAPC10 |
|
| 1.33E-02 | 2 | GO:51128~regulation
of cellular component organization | ANAPC2,
ANAPC10 |
| Module D | 3.15E-02 | 1 | GO:45~autophagic
vacuole assembly | MAP1LC3A |
|
| 3.15E-02 | 1 |
GO:16236~macroautophagy | MAP1LC3A |
|
| 4.65E-02 | 1 |
GO:6914~autophagy | MAP1LC3A |
|
| 4.65E-02 | 1 | GO:9267~cellular
response to starvation | MAP1LC3A |
|
| 4.65E-02 | 1 | GO:7033~vacuole
organization | MAP1LC3A |
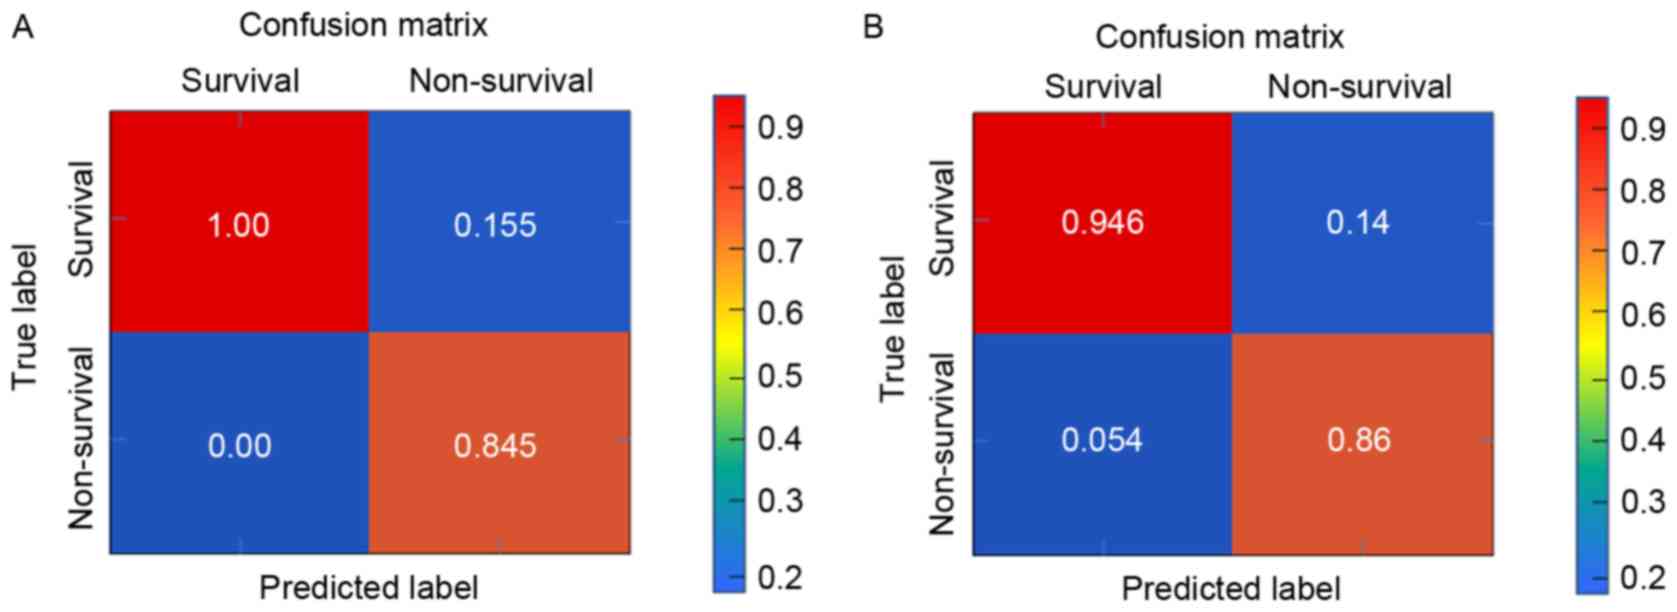
SVM classifier construction
To confirm whether there was a difference in the key
genes between the two groups of samples, the expression values of
the 11 DEGs involved in the modules were extracted from
E-MTAB-4421. Following this, an SVM classifier was constructed and
its recognition capability to samples was observed. The results of
the present study demonstrated that the SVM classifier could
identify the survival samples (207/207; accuracy, 100%) and the
non-survival samples (49/57; accuracy, 84.5%) with an overall
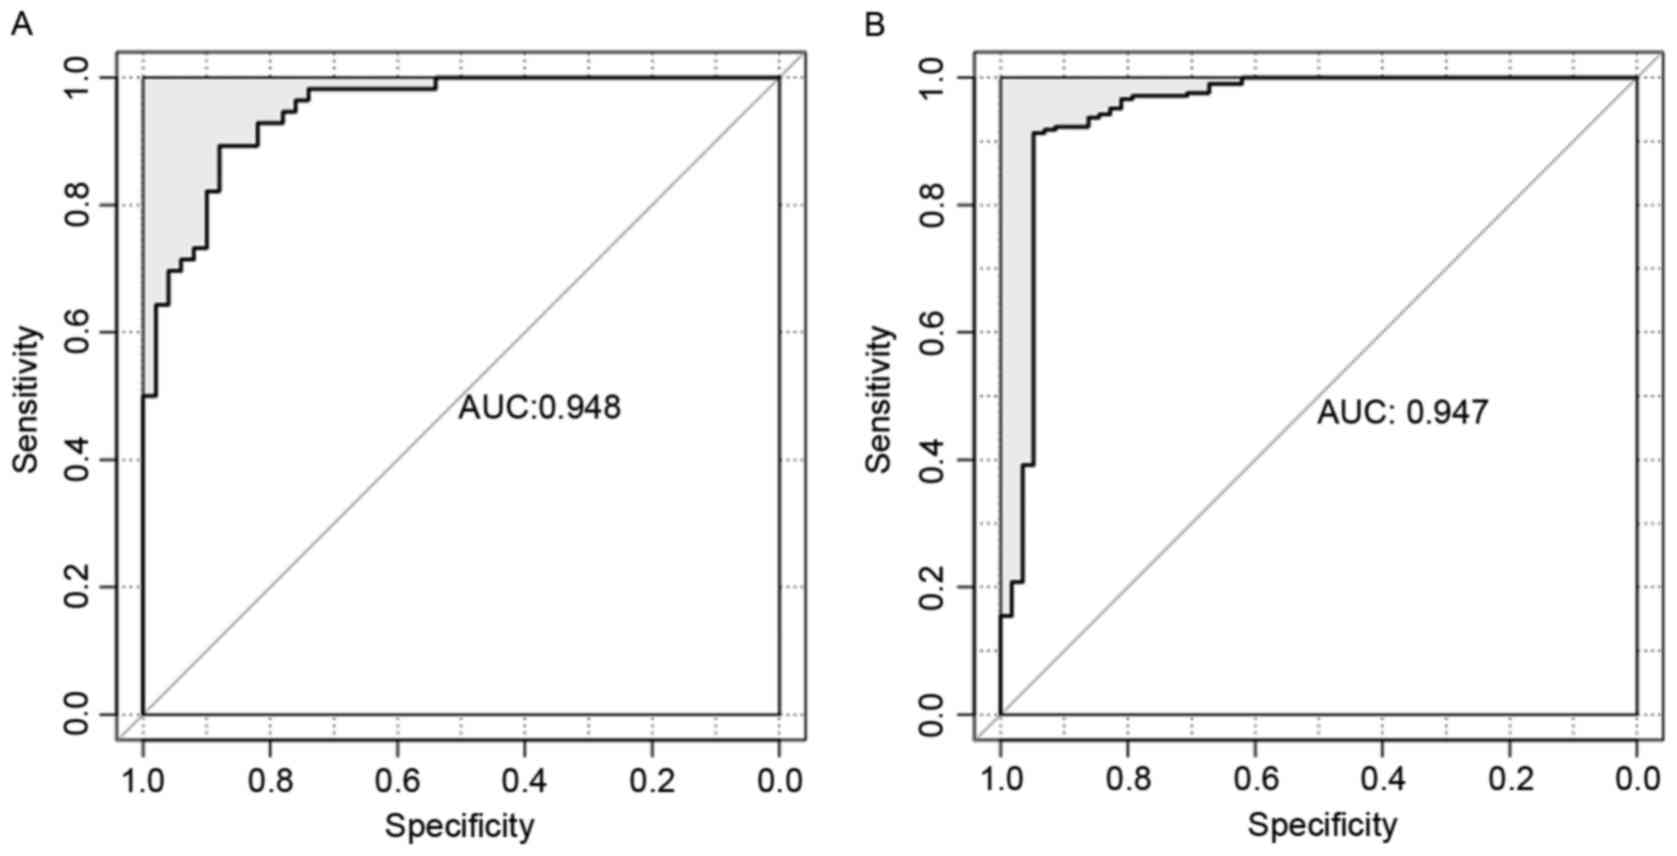
accuracy of 96.6% (256/265; Fig.
4A).
Verification and assessment of the
efficiency of the SVM classifier
E-MTAB-4451 was also downloaded from the EMBL-EBI
database, which included leukocytes isolated from 56 survivors and
50 non-survivors. The expression values for the 11 DEGs were
extracted from E-MTAB-4451 to further verify the SVM classifier. As
a result, the SVM classifier could correctly identify 53 survival
samples (53/56; accuracy, 94.6%) and 43 non-survival samples
(43/50; accuracy, 86%) with an overall accuracy of 90.57% (96/106;
Fig. 4B). Additionally, the
efficiency of SVM classifier was high according to sensitivity,
specificity, PPV, NPV and AUROC curve (Table IV and Fig. 5).
| Table IV.Efficiency of SVM classifier for
E-MTAB-4421 and E-MTAB-4451 according to sensitivity, specificity,
PPV, NPV and AUROC. |
Table IV.
Efficiency of SVM classifier for
E-MTAB-4421 and E-MTAB-4451 according to sensitivity, specificity,
PPV, NPV and AUROC.
| Datasets | Number of
samples | Accuracy | Sensitivity | Specificity | PPV | NPV | AUROC |
|---|
| E-MTAB-4421 | 265 | 0.966 | 1 | 0.845 | 0.963 | 1 | 0.948 |
| E-MTAB-4451 | 106 | 0.906 | 0.946 | 0.86 | 0.883 | 0.935 | 0.947 |
Discussion
In this study, a total of 384 DEGs (including 153
upregulated and 231 downregulated genes) were screened in the
survival group. The PPI network constructed for the DEGs was
divided into 4 modules, and they involved 11 DEGs (including
MAP1LC3A, PRKCA, MTA3 and SCRIB). Additionally, a SVM classifier
was constructed to investigate whether these 11 DEGs could
distinguish between the two groups of samples, confirming that it
could well recognize the survival from the non-survival samples
with an overall accuracy of 96.6%. Subsequently, the expression
profile of E-MTAB-4451 was applied to verify the SVM classifier.
The results illustrated that the SVM classifier could effectively
identify the 53 survival and the 43 non-survival samples with an
overall accuracy of 90.57%.
SCRIB, which is overexpressed in endothelial cells
and is essential for planar cell polarity and serves as a novel
proinflammatory regulator in endothelial cells (27). Altman and Kong (28) demonstrated that protein kinase C
proteins (PKCs) serve essential roles in human immune disorders,
and can be used as therapeutic targets in several immune disorders
including autoimmune diseases. For instance, PRKCA is the
nonredundant and physiological PKC isotype in signaling pathways
that are required for T cell-dependent interferon-γ production and
IgG2a/2b antibody responses (29).
Deficiency of PRKCB leads to defective B cell responses since B
cells with PRKCB deficiency cannot activate the nuclear factor
(NF)-κB signaling pathway for B cell receptor (BCR), indicating
that PRKCB has a critical role in BCR survival and may act as an
important target for the treatment of B-lineage malignancies
(30). In module B, SCRIB and
PRKCA could interact with each other, indicating that they might
hold roles in the progression of sepsis through this
interaction.
The results of functional enrichment indicated that
MAP1LC3A in module D was enriched in the autophagic vacuole
assembly. Deficiency of autophagy-associated protein MAP1LC3B
regulates the development of interleukin (IL)-17a-dependent lung
pathology in the process of respiratory viral infection through
endoplasmic reticulum stress-associated IL-1 (31). MTA3 is involved in the B lymphocyte
transcriptional program and is a component in the Mi2/nucleosome
remodeling and deacetylase (Mi2/NuRD) transcriptional corepressor
complex (32,33). In B cells, the complex can interact
with the middle domain of Bcl-6 via MTA3 and negatively regulate
several genes, including PR domain containing 1 with zinc finger
domain through histone deacetylation activity (34,35).
Exogenous expression of MTA3-dependent Bcl-6 in a plasma cell line
results in reprogramming of cell fate, reactivation of the
transcriptional program of B cell, suppression of the transcripts
that are specific in plasma cells, and expression of surface
markers of B lymphocyte cells (35). In module D, MAP1LC3A and MTA3 had
interaction with each other, suggesting that MAP1LC3A and MTA3
might also function in the pathogenesis of sepsis via
interaction.
In conclusion, based on the bioinformatics analysis
of E-MTAB-4421, 384 DEGs were identified in the survival group. In
addition, MAP1LC3A, PRKCA, MTA3 and SCRIB might act in the
progression of sepsis. However, further experimental investigation
is required for these predictive results.
References
|
1
|
Singer M, Deutschman CS, Seymour CW,
Shankar-Hari M, Annane D, Bauer M, Bellomo R, Bernard GR, Chiche
JD, Coopersmith CM, et al: The third international consensus
definitions for sepsis and septic shock (sepsis-3). JAMA.
315:801–810. 2016. View Article : Google Scholar : PubMed/NCBI
|
|
2
|
Hodgin KE and Moss M: The epidemiology of
sepsis. Curr Pharm Des. 14:1833–1839. 2008. View Article : Google Scholar : PubMed/NCBI
|
|
3
|
Munford RS and Suffredini AF: Sepsis,
severe sepsis and septic shockMandell, Douglas, and Bennett's
Principles and Practice of Infectious Diseases. Bennett JE, Dolin R
and Blaser MJ: Elsevier Saunders; Philadelphia, PA: pp. 914–934.
2014
|
|
4
|
Deutschman CS and Tracey KJ: Sepsis:
Current dogma and new perspectives. Immunity. 40:463–475. 2014.
View Article : Google Scholar : PubMed/NCBI
|
|
5
|
Lyle NH, Pena OM, Boyd JH and Hancock RE:
Barriers to the effective treatment of sepsis: Antimicrobial
agents, sepsis definitions, and host-directed therapies. Ann N Y
Acad Sci. 1323:101–114. 2014. View Article : Google Scholar : PubMed/NCBI
|
|
6
|
Soong J and Soni N: Sepsis: Recognition
and treatment. Clin Med (Lond). 12:276–280. 2012. View Article : Google Scholar : PubMed/NCBI
|
|
7
|
Munford RS: Severe sepsis and septic
shock. Harrisons Princip Int Med. 16:16062005.
|
|
8
|
Callahan LA and Supinski GS:
Downregulation of diaphragm electron transport chain and glycolytic
enzyme gene expression in sepsis. J Appl Physiol (1985).
99:1120–1126. 2005. View Article : Google Scholar : PubMed/NCBI
|
|
9
|
Thimmulappa RK, Lee H, Rangasamy T, Reddy
SP, Yamamoto M, Kensler TW and Biswal S: Nrf2 is a critical
regulator of the innate immune response and survival during
experimental sepsis. J Clin Invest. 116:984–995. 2006. View Article : Google Scholar : PubMed/NCBI
|
|
10
|
Kong X, Thimmulappa R, Craciun F, Harvey
C, Singh A, Kombairaju P, Reddy SP, Remick D and Biswal S:
Enhancing Nrf2 pathway by disruption of Keap1 in myeloid leukocytes
protects against sepsis. Am J Respir Crit Care Med. 184:928–938.
2011. View Article : Google Scholar : PubMed/NCBI
|
|
11
|
Thiel M, Caldwell CC, Kreth S, Kuboki S,
Chen P, Smith P, Ohta A, Lentsch AB, Lukashev D and Sitkovsky MV:
Targeted deletion of HIF-1alpha gene in T cells prevents their
inhibition in hypoxic inflamed tissues and improves septic mice
survival. PLoS One. 2:e8532007. View Article : Google Scholar : PubMed/NCBI
|
|
12
|
Cramer T, Yamanishi Y, Clausen BE, Förster
I, Pawlinski R, Mackman N, Haase VH, Jaenisch R, Corr M, Nizet V,
et al: HIF-1alpha is essential for myeloid cell-mediated
inflammation. Cell. 112:645–657. 2003. View Article : Google Scholar : PubMed/NCBI
|
|
13
|
Teoh H, Quan A, Creighton AK, Annie Bang
KA, Singh KK, Shukla PC, Gupta N, Pan Y, Lovren F, Leong-Poi H, et
al: BRCA1 gene therapy reduces systemic inflammatory response and
multiple organ failure and improves survival in experimental
sepsis. Gene Ther. 20:51–61. 2013. View Article : Google Scholar : PubMed/NCBI
|
|
14
|
Quan A, Creighton A, Bang K, Pan Y, Shukla
P, Singh K, Al-Omran M, Lovren F, Verma S and Teoh H: Brca1 gene
therapy improves survival in experimental sepsis. In: Canadian
Journal Of Cardiology. 26:1462010.
|
|
15
|
Ibrahim-Zada I, Lencinas A, Rhee PM,
Maskaykina I and Friese RS: BRCA1 as a novel biomarker of
Beta1-Blockade in sepsis. J Am Coll Surg. 221:S402015. View Article : Google Scholar
|
|
16
|
Iwata A, Stevenson VM, Minard A, Tasch M,
Tupper J, Lagasse E, Weissman I, Harlan JM and Winn RK:
Over-expression of Bcl-2 provides protection in septic mice by a
trans effect. J Immunol. 171:3136–3141. 2003. View Article : Google Scholar : PubMed/NCBI
|
|
17
|
Oberholzer C, Oberholzer A, Bahjat FR,
Minter RM, Tannahill CL, Abouhamze A, LaFace D, Hutchins B,
Clare-Salzler MJ and Moldawer LL: Targeted adenovirus-induced
expression of IL-10 decreases thymic apoptosis and improves
survival in murine sepsis. Proc Natl Acad Sci USA. 98:pp.
11503–11508. 2001; View Article : Google Scholar : PubMed/NCBI
|
|
18
|
Davenport EE, Burnham KL, Radhakrishnan J,
Humburg P, Hutton P, Mills TC, Rautanen A, Gordon AC, Garrard C,
Hill AV, et al: Genomic landscape of the individual host response
and outcomes in sepsis: A prospective cohort study. Lancet Respir
Med. 4:259–271. 2016. View Article : Google Scholar : PubMed/NCBI
|
|
19
|
Smyth GK: Limma: Linear models for
microarray dataBioinformatics and computational biology solutions
using R and Bioconductor. Springer; pp. 397–420. 2005, View Article : Google Scholar
|
|
20
|
Kolde R and Kolde MR: Package ‘pheatmap’.
2015.
|
|
21
|
Stark C, Breitkreutz BJ, Reguly T, Boucher
L, Breitkreutz A and Tyers M: BioGRID: A general repository for
interaction datasets. Nucleic Acids Res. 34(Database Issue):
D535–D539. 2006. View Article : Google Scholar : PubMed/NCBI
|
|
22
|
Kohl M, Wiese S and Warscheid B:
Cytoscape: Software for visualization and analysis of biological
networks. Data Mining in Proteomics Springer. 291–303. 2011.
View Article : Google Scholar
|
|
23
|
Bader GD and Hogue CW: An automated method
for finding molecular complexes in large protein interaction
networks. BMC Bioinformatics. 4:22003. View Article : Google Scholar : PubMed/NCBI
|
|
24
|
Maere S, Heymans K and Kuiper M: BiNGO: A
Cytoscape plugin to assess overrepresentation of gene ontology
categories in biological networks. Bioinformatics. 21:3448–3449.
2005. View Article : Google Scholar : PubMed/NCBI
|
|
25
|
Ma S, Lv M, Deng F, Zhang X, Zhai H and Lv
W: Predicting the ecotoxicity of ionic liquids towards Vibrio
fischeri using genetic function approximation and least squares
support vector machine. J Hazard Mater. 283:591–598. 2015.
View Article : Google Scholar : PubMed/NCBI
|
|
26
|
Dimitriadou E, Hornik K, Leisch F, Meyer D
and Weingessel A: Misc functions of the Department of Statistics
(e1071), TU Wien. R package. 1:5–24. 2008.
|
|
27
|
Kruse C, Kurz AR, Pálfi K, Humbert PO,
Sperandio M, Brandes RP, Fork C and Michaelis UR: Polarity protein
Scrib facilitates endothelial inflammatory signaling. Arterioscler
Thromb Vasc Biol. 35:1954–1962. 2015. View Article : Google Scholar : PubMed/NCBI
|
|
28
|
Altman A and Kong KF: Protein kinase C
inhibitors for immune disorders. Drug Discov Today. 19:1217–1221.
2014. View Article : Google Scholar : PubMed/NCBI
|
|
29
|
Pfeifhofer C, Gruber T, Letschka T,
Thuille N, Lutz-Nicoladoni C, Hermann-Kleiter N, Braun U, Leitges M
and Baier G: Defective IgG2a/2b class switching in PKC
alpha−/− mice. J Immunol. 176:6004–6011. 2006.
View Article : Google Scholar : PubMed/NCBI
|
|
30
|
Su TT, Guo B, Kawakami Y, Sommer K, Chae
K, Humphries LA, Kato RM, Kang S, Patrone L, Wall R, et al:
PKC-beta controls I kappa B kinase lipid raft recruitment and
activation in response to BCR signaling. Nat Immunol. 3:780–786.
2002. View Article : Google Scholar : PubMed/NCBI
|
|
31
|
Reed M, Morris SH, Owczarczyk AB and
Lukacs NW: Deficiency of autophagy protein Map1-LC3b mediates
IL-17-dependent lung pathology during respiratory viral infection
via ER stress-associated IL-1. Mucosal Immunol. 8:1118–1130. 2015.
View Article : Google Scholar : PubMed/NCBI
|
|
32
|
Bowen NJ, Fujita N, Kajita M and Wade PA:
Mi-2/NuRD: Multiple complexes for many purposes. Biochim Biophys
Acta. 1677:52–57. 2004. View Article : Google Scholar : PubMed/NCBI
|
|
33
|
Fujita N, Jaye DL, Kajita M, Geigerman CS,
Moreno CS and Wade PA: MTA3, a Mi-2/NuRD complex subunit, regulates
an invasive growth pathway in breast cancer. Cell. 113:207–219.
2003. View Article : Google Scholar : PubMed/NCBI
|
|
34
|
Jaye D, Iqbal J, Fujita N, Geigerman CM,
Li S, Karanam S, Fu K, Weisenburger DD, Chan WC, Moreno CS and Wade
PA: The BCL6-associated transcriptional co-repressor, MTA3, is
selectively expressed by germinal centre B cells and lymphomas of
putative germinal centre derivation. J Pathol. 213:106–115. 2007.
View Article : Google Scholar : PubMed/NCBI
|
|
35
|
Fujita N, Jaye DL, Geigerman C, Akyildiz
A, Mooney MR, Boss JM and Wade PA: MTA3 and the Mi-2/NuRD complex
regulate cell fate during B lymphocyte differentiation. Cell.
119:75–86. 2004. View Article : Google Scholar : PubMed/NCBI
|