Introduction
Drug-induced liver injury (DILI) is a common adverse
reaction caused by numerous drugs (1–3), and
being able to effectively predict and prevent DILI is a major focus
of pharmacological research. Non-steroidal anti-inflammatory drugs
(NSAIDs) are widely used to relieve pain and reduce inflammation
(4–5), and each year, >150 million
(6) prescriptions are generated in
the United States of America for the management of acute and
chronic pain, or rheumatic diseases. However, NSAIDs can cause
several types of adverse reaction (7,8); a
study investigating the incidence of liver disease in patients
demonstrated that the incidence of liver disease is 27 times higher
in those using NSAIDs than those who do not (9). There are >20 types of NSAIDs
currently in use, including aspirin, naproxen, ibuprofen, felbinac,
ketoprofen, flurbiprofen, ketorolac, diclofenac, mefenamic acid and
nimesulide, all of which have been reported to cause liver toxicity
(10,11). Therefore, it is necessary to
develop novel methods to detect and prevent DILI caused by NSAIDs.
Acetaminophen (APAP) is a common medication that has been
extensively studied, with ample literature detailing its side
effects and toxicity, particularly hepatotoxicity (12). In a recent study, it was confirmed
that APAP exerts liver toxicity on zebrafish and liver cells
(13). In the present study, APAP
was used as a standard against which the side effects and toxicity
of binaprofen were compared; binaprofen is currently being
developed as an NSAID.
In clinical medicine, a biomarker refers to a
reliable and measurable indicator that can be used to gauge the
severity or presence of a disease state; for example a naturally
occurring molecule or gene. Some serum biomarkers have proven to be
reliable tools for diagnosis, therapeutic decision-making and
prognosis in many disease states. There are several biomarkers that
are known to be important indicators of liver injury, and recently,
liver biomarkers have been identified that may be used to predict
liver tumors (14).
Binaprofen
(C18H23NO5) is a drug, currently
not in clinical use, which has been referred to as felbinac
trometamol in previous studies (15–17).
Binaprofen is classified as an NSAID, which exerts
anti-inflammatory, antipyretic and strong analgesic effects
(15–17). In the present study,
binaprofen-induced liver injury was investigated in vivo
using a zebrafish model and in vitro using a human liver
cell line.
Materials and methods
In vivo analyses
Zebrafish husbandry and treatment
Male and female AB-line adult zebrafish (Danio
rerio) were obtained from the Southern Medical University
(Guangzhou, China). Zebrafish were acclimated for 2 weeks prior to
experimentation. Fish were maintained in aerated water at 23±1°C,
7.8±1 pH and 0.25 g × l−1 CaCO3 hardness,
under a 12-h light/dark cycle. Animals were fed ad libitum.
Experiments were performed using a total of 600 healthy fish aged
4–5 months.
Following the 2-week acclimation period, the fish
were randomly allocated into experimental group tanks at a density
of 1 fish/l of water. To obtain the lethal concentration 50
(LC50), fish were treated with 1, 2, 4, 8 and 16 mM
APAP, and 0.40, 0.60, 0.90, 1.35 and 2.02 mM binaprofen. To measure
biomarkers, fish were treated with 4 mM APAP and 0.40 and 0.80 mM
binaprofen. The drugs were added directly into the water at the
appropriate concentrations; the tank water was changed daily and
drugs were replenished following every change. Non-treated fish
were used as a control group and tank water was also changed daily.
Following 48–96 h of exposure to the drugs, all fish were
euthanized by hypothermal shock (18).
The present study was approved by the Institutional
Animal Care and Use Committee of Guangzhou Pharmaceutical Research
Institute (protocol no. 2012005-01; Guangzhou, China) and the
experiments were conducted in accordance with international
guidelines for the care and use of laboratory animals.
Determination of LC50
The appearance, behavior and food consumption of
zebrafish was closely monitored during drug exposure. Rate of
mortality was measured following 96 h of drug exposure (n=20/group)
and LC50 was calculated using probit graphical analysis
(19).
Histological analysis of liver tissue
Zebrafish that were alive after 48 h of drug
exposure were sacrificed to obtain liver tissues. Liver tissues
were fixed in 10% formalin for 96 h at room temperature, embedded
in paraffin wax, cut into 5 µm sections and stained with 0.25%
hematoxylin and 0.33% eosin (H&E) for 1 h at room temperature.
Liver cell morphology was examined under a microscope (BX51;
Olympus Corporation, Tokyo, Japan). The sections were also examined
for signs of pathology and graded using a semi-quantitative method.
The grading system for liver cell pathology was as follows: i)
Normal liver cells with an intact structure: ‘−’, grade 0; ii) few
small vacuoles found in the cytoplasm of liver cells indicating
mild vacuolization: ‘+’, grade 1; iii) large vacuoles found in the
cytoplasm of liver cells with the cytoplasm compressed to one side
indicating moderate vacuolization: ‘++’, grade 2; iv) fused liver
cells with different sized vesicles indicating severe
vacuolization: ‘+++’, grade 3 and v) lysed liver cells lacking
discernible nuclei indicating necrosis: ‘++++’, grade 4.
Detection of serum biomarkers
Capillary blood was collected from tail cuttings
after 12, 48 and 96 h of drug exposure (n=100/group). Blood samples
obtained from 20 fish were pooled together and centrifuged for 10
min at 1,800 × g at 4°C. The resulting supernatant contained serum,
which was collected for biomarker analysis. Conventional biomarkers
that are widely used in clinical medicine for the diagnosis of
liver disease include alanine transaminase (ALT), aspartate
transaminase (AST), alkaline phosphatase (ALP) and lactate
dehydrogenase (LDH); these markers were detected using a Hitachi
7100 biochemical analyzer (Hitachi, Ltd., Tokyo, Japan).
Non-conventional biomarkers that have only recently been discovered
or used for diagnosis of liver disease include total bile acid
(TBA; cat. no. E003-2) purchased from Nanjing Jiancheng
Bioengineering Institute (Nanjing, China). ELISA kits for arginase
I (Arg-I; cat. no. CK-E11055H), argininosuccinate lyase (ASAL; cat.
no. CK-E92131H), ornithine carbamyl transferase (OCT; cat. no.
CK-E10835H), α-glutathione S-transferase (α-GST; cat. no.
CK-E10967H), prealbumin (PA; cat. no. CK-E11445H), xanthine oxidase
(XOD; cat. no. CK-E92132H), isocitrate dehydrogenase (ICD; cat. no.
CK-E10966H) and succinate dehydrogenase (SDH; cat. no. CK-E10965H)
were from Dalian Fanbang Bio-Technology Co., Ltd. (Dalian, China).
An ELX800 microplate reader (BioTek Instruments, Inc., Winooski,
VT, USA), was used for detection according to the manufacturer's
protocols.
In vitro analyses
Cell culture and treatment
L-02 liver cells (donated by Professor Chun Liang of
the Division of Life Science, Center for Cancer Research, State Key
Lab for Molecular Neural Science, Bioengineering Graduate Program,
Hong Kong University of Science and Technology's and obtained from
the Type Culture Collection of the Chinese Academy of Sciences,
Shanghai, China) were cultured to a density of 1×10⁵
cells/cm2 in Williams' medium E (WME; Sigma-Aldrich;
Merck KGaA, Darmstadt, Germany) supplemented with 10% fetal bovine
serum (FBS; Merck KGaA), 10 U/l insulin-transferrin-selenium
(Sigma-Aldrich; Merck KGaA), 10 U/l dexamethasone (Merck KGaA),
40×106 U/l penicillin and 0.1 g/l streptomycin
(Baiyunshan Pharmaceutical Co., Ltd., Guangzhou, China) at 37°C in
a humidified atmosphere containing 5% CO2.
To determine half maximal inhibitory concentration
(IC50), liver cell cultures were treated with 1, 2, 4,
8, 16 and 32 mM APAP or 0.8, 1.9, 4.8, 12 and 30 mM binaprofen.
Prior to biomarker measurement, cells were treated with 8 mM APAP
or 0.8 and 4.8 mM binaprofen. The drugs were added directly into
media at the appropriate concentrations. The media were changed
daily and the drugs were replenished following each change.
Non-treated liver cells were used as a control. IC50
values and biomarkers were measured after 6, 12 and 24 h of drug
exposure.
Determination of IC50
The IC50 of the control, APAP-treated and
binaprofen-treated cells were measured using MTT assays. Briefly,
100 µl MTT solution in WME supplemented with 10% FBS was added to
the cells, which were incubated for 4 h at 4°C. Subsequently, cells
were transferred to 150 µl dimethyl sulfoxide and incubated for 10
min with constant agitation. Readings were taken at 630 and 490 nm,
using an ELX800 microplate reader (BioTek Instruments, Inc.). The
percentage inhibition and IC50 were determined using the
curve-fitting method (20). The
percentage inhibition was calculated using the following formula:
[(D490drug-D630drug)/(D490control-D630control)]
×100%.
Histological analysis of the liver cell line
Following 24 h drug exposure, the cells were
cultured in RPMI1640 medium (including 10% FBS) at 37°C in 5%
CO2, and grew for 24 h before being washed twice with
PBS and fixed in 4% paraformaldehyde at room temperature for 96 h.
The cells were stained with H&E, and liver cell morphology was
examined under a light microscope (BX51; Olympus Corporation). The
sections were examined for signs of pathology using a
semi-quantitative method; the grading system for cellular pathology
was as follows: i) Normal intact cells: ‘−’, grade 0; ii) enlarged
round cells with normal cytoplasmic arrangement indicating mild
swelling: ‘+’, grade 1; iii) large round cells with slight
cytoplasmic staining exhibiting normal cytoplasmic arrangement
indicating moderate swelling: ‘++’, grade 2; iv) very large round
cells with many vacuoles and a disordered cytoplasm indicating
rupture and severe swelling: ‘+++’, grade 3 and v) lysed cells with
no visible nuclei indicating necrosis: ‘++++’, grade 4.
Biomarker detection
Media were collected from the cells and conventional
biomarkers (ALT, AST, ALP, and LDH) were detected using a Hitachi
7100 biochemical analyzer (Hitachi, Ltd.), whereas non-conventional
biomarkers (TBA and ASAL) were detected using ELISA kits (Dalian
Fanbang Chemical Technology Development Co., Ltd.), according to
the manufacturer's protocol.
Statistical analysis
Quantitative values are presented as the means ±
standard deviation of three experimental repeats, and were checked
for normality and equal variance. Normally distributed data were
analyzed using Student's t-test, or one-way analysis of variance
followed by Tukey's post hoc analysis. Non-normally distributed
data were analyzed using one-way analysis of variance followed by
Kruskal-Wallis test. Analysis of liver cell morphology was
conducted using the Ridit assay. P<0.05 was considered to
indicate a statistically significant difference. All analyses were
carried out using SPSS software (version 13.0; SPSS, Inc., Chicago,
IL, USA). Receiver operating characteristic (ROC) curve was used to
determine the sensitivity of a biomarker to accurately predict
DILI. ROC curves were generated using MedCalc software (version
11.4.2.0; MedCalc Software bvba, Ostend, Belgium).
Results
In vivo analyses
Determining LC50 in an in vivo model
of DILI
In the present study, the results indicated that
treatment with >2 mM APAP had obvious toxic effects on
zebrafish; causing impaired swimming and abnormal swimming
position. The LC50 for APAP was calculated to be 5.2 mM
with a 95% confidence interval (CI) of 4.6–7.2 mM. Treatment with
>0.40 mM binaprofen also caused obvious toxic effects. The
LC50 of binaprofen was calculated to be 1.2 mM with a
95% CI of 1.1–1.3 mM (data not shown).
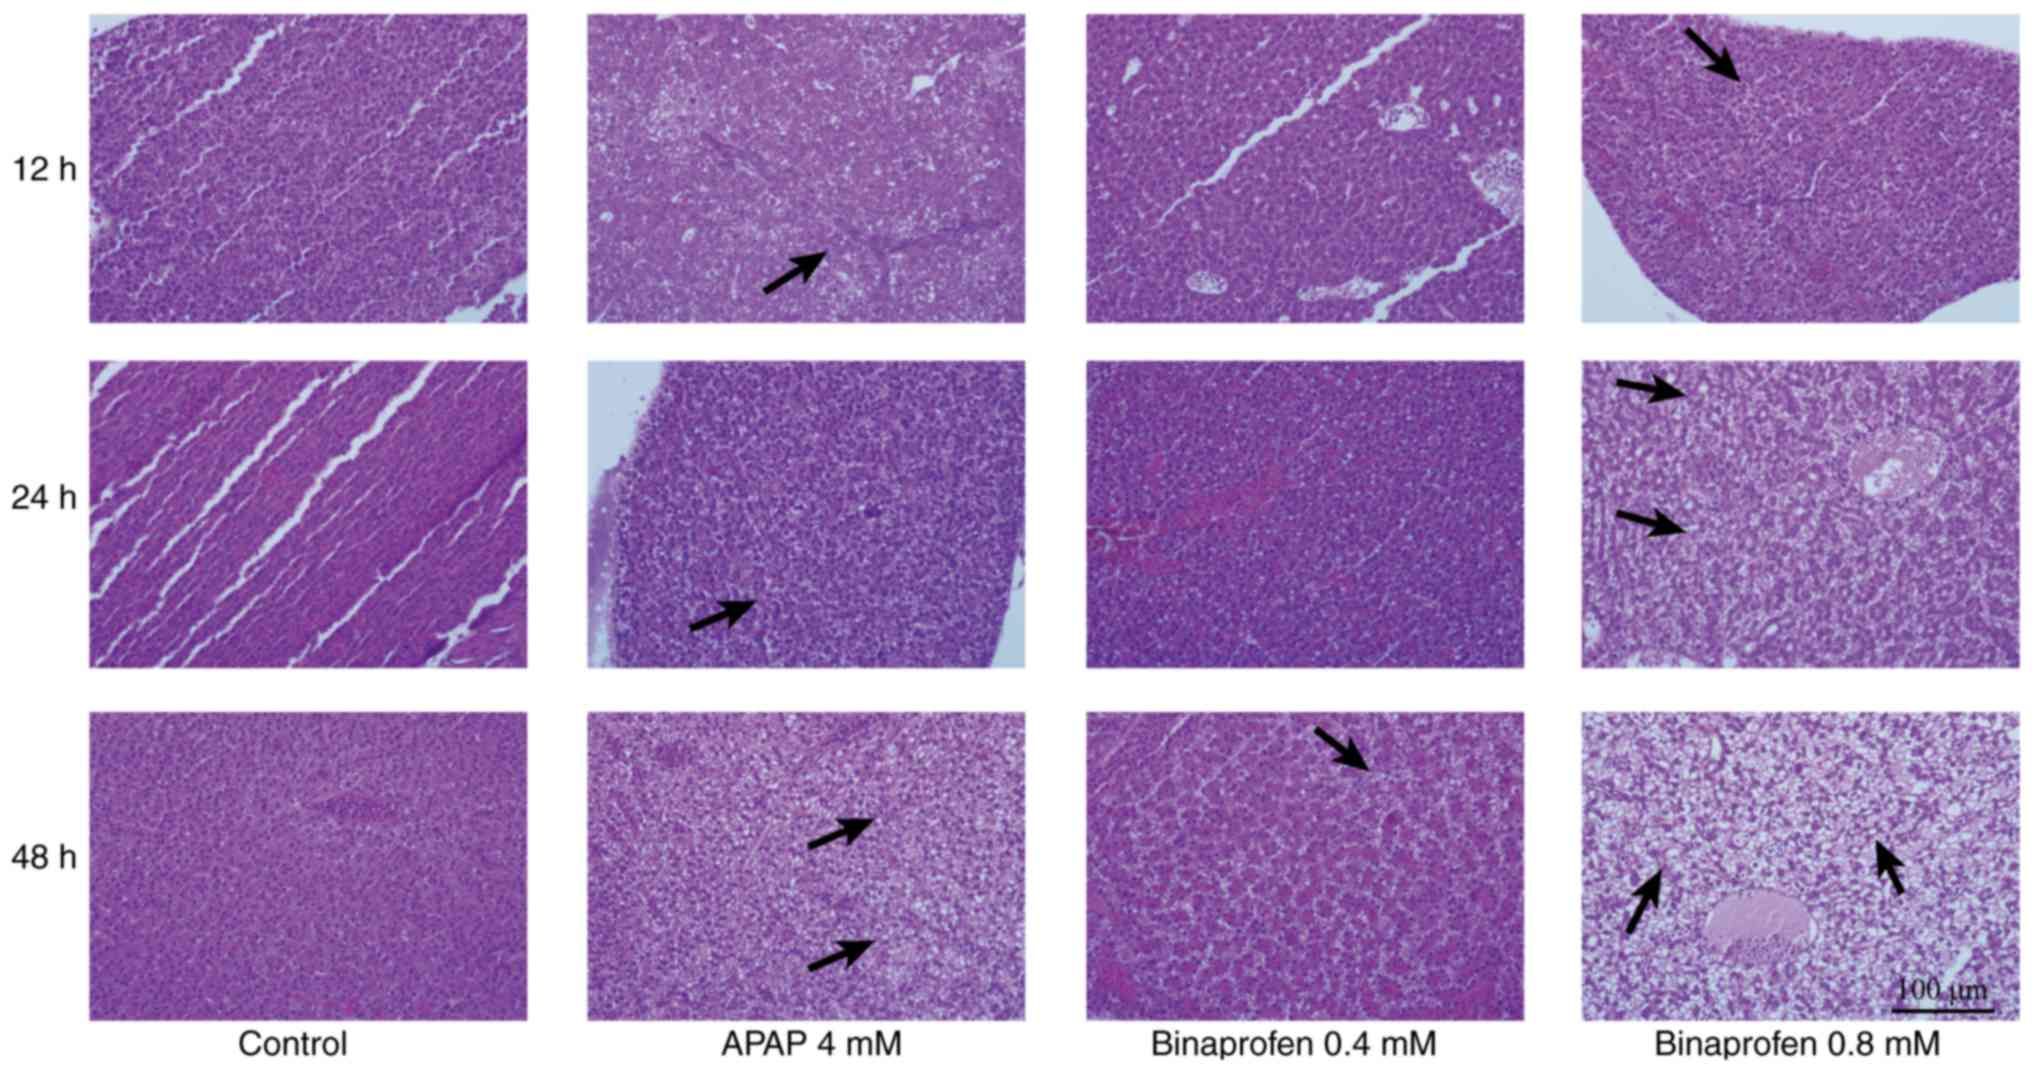
Histological analysis
Treatment with 4 mM APAP caused 10% mortality of
zebrafish after 48 h exposure to the drug. Treatment with 0.40 mM
binaprofen had no impact on mortality in zebrafish even following
48 h of exposure; however, increasing the concentration to 0.80 mM
binaprofen led to 10% mortality of zebrafish after 48 h of
exposure. At 12 or 24 h post-drug treatment, the rate of mortality
was equal or lower compared with at 48 h.
Compared with the control group, 4 mM APAP treatment
for 12 and 24 h resulted in mild vacuolization (+) in 2/10 liver
tissues; however, following 48 h of treatment all liver tissues
(10/10) had mild or moderate vacuolization (+/++; P<0.05).
Treatment with 0.40 mM binaprofen for 48 h resulted in no damage in
liver tissues; however, treatment with 0.80 mM resulted in mild
vacuolization (+) in 1/10 liver tissues after 12 h, mild
vacuolization (+) in 2/10 liver tissues after 24 h and mild or
moderate vacuolization (+/++) in 5/10 liver tissues (P<0.05)
after 48 h of treatment (Table I
and Fig. 1).
 | Table I.Histopathological scoring of liver
sections from APAP- and binaprofen-treated zebrafish. |
Table I.
Histopathological scoring of liver
sections from APAP- and binaprofen-treated zebrafish.
|
|
|
|
| Time |
|---|
|
|
|
|
|
|
|---|
| Group | Concentration
(mM) | n | Pathological
score | 12 h | 24 h | 48 h |
|---|
| Control | − | 10 | − | 10 | 10 | 10 |
|
|
|
| + | 0 | 0 | 0 |
|
|
|
| ++ | 0 | 0 | 0 |
|
|
|
| +++ | 0 | 0 | 0 |
|
|
|
| ++++ | 0 | 0 | 0 |
| APAP | 4 | 10 | − | 8 | 8 |
0a |
|
|
|
| + | 2 | 2 | 6 |
|
|
|
| ++ | 0 | 0 | 4 |
|
|
|
| +++ | 0 | 0 | 0 |
|
|
|
| ++++ | 0 | 0 | 0 |
| Binaprofen | 0.4 | 10 | − | 10 | 10 | 9 |
|
|
|
| + | 0 | 0 | 1 |
|
|
|
| ++ | 0 | 0 | 0 |
|
|
|
| +++ | 0 | 0 | 0 |
|
|
|
| ++++ | 0 | 0 | 0 |
| Binaprofen | 0.8 | 10 | − | 9 | 8 |
5a |
|
|
|
| + | 1 | 2 | 3 |
|
|
|
| ++ | 0 | 0 | 2 |
|
|
|
| +++ | 0 | 0 | 0 |
|
|
|
| ++++ | 0 | 0 | 0 |
Detection of serum biomarkers
Compared with in the control group, 4 mM APAP
treatment caused an increase in ALT levels at 24 and 48 h, an
increase in LDH levels at 48 h, a decrease in Arg-I levels at 12
and 24 h, and an increase in ASAL levels at 12, 24 and 48 h
post-drug exposure. The levels of α-GST were decreased at 24 h, OCT
levels increased at 48 h, TBA levels were increased at 12, 24 and
48 h, PA levels were increased at 48 h, XOD levels were increased
at 24 and 48 h, and ICD levels were increased at 12 h post-drug
exposure (Table II).
| Table II.Serum biomarker detection (U/l) of
APAP- and binaprofen-treated zebrafish. |
Table II.
Serum biomarker detection (U/l) of
APAP- and binaprofen-treated zebrafish.
|
|
|
|
| Time |
|---|
|
|
|
|
|
|
|---|
| Biomarker | Group | Concentration
(mM) | n | 12 h | 24 h | 48 h |
|---|
| ALT | Control | − | 5 | 9.2±4.9 | 9.0±5.5 | 9.6±7.2 |
|
| APAP | 4 | 5 | 11.0±5.1 |
18.2±2.7a |
54.4±31.1a |
|
| Binaprofen | 0.4 | 5 | 5.8±1.7 | 8.5±0.6 |
22.3±10.9a |
|
| Binaprofen | 0.8 | 5 | 10.5±0.6 |
26.8±17.6a |
60.3±9.7b |
| AST | Control | − | 5 | 1,145.2±522.6 | 1,101.2±304.0 | 1,043.6±399.2 |
|
| APAP4 | 4 | 5 | 1,365.0±774.0 | 1,296.0±267.9 | 1,605.4±655.7 |
|
| Binaprofen | 0.4 | 5 | 896.5±77.5 | 719.8±99.2 | 1,359.5±279.3 |
|
| Binaprofen | 0.8 | 5 | 1,074.8±328.3 | 1,587.8±453.9 |
2,172.5±37.9a |
| ALP | Control | − | 5 | 0.00±0.00 | 0.00±0.00 | 0.60±0.89 |
|
| APAP | 4 | 5 | 0.00±0.00 | 0.00±0.00 | 5.20±7.16 |
|
| Binaprofen | 0.4 | 5 |
0.50±0.57a | 0.00±0.00 | 2.25±4.50 |
|
| Binaprofen | 0.8 | 5 | 0.00±0.00 | 0.00±0.00 | 0.00±0.00 |
| LDH | Control | − | 5 | 1,478.2±901.9 | 1,457.4±574.3 | 706.2±209.5 |
|
| APAP | 4 | 5 | 1,441.0±793.4 | 1,251.0±591.7 |
1,957.8±955.2a |
|
| Binaprofen | 0.4 | 5 | 890.3±193.7 |
620.0±130.5a | 1,107.7±556.3 |
|
| Binaprofen | 0.8 | 5 | 1,040.5±356.9 | 1,350.5±612.9 |
2,003.5±158.1b |
| Arg-I (mg/l) | Control | − | 5 | 13.1±0.6 | 14.6±0.7 | 12.6±0.3 |
|
| APAP | 4 | 5 |
10.1±0.3b |
12.6±0.1b | 12.1±0.4 |
|
| Binaprofen | 0.4 | 5 |
11.7±0.6b |
11.7±0.6b | 12.4±0.7 |
|
| Binaprofen | 0.8 | 5 |
11.3±0.7b |
11.4±0.4b |
11.3±0.5b |
| ASAL | Control | − | 5 | 35.8±1.6 | 43.7±1.1 | 45.0±4.8 |
|
| APAP | 4 | 5 |
53.6±4.7b |
59.1±5.1b |
69.1±0.9b |
|
| Binaprofen | 0.4 | 5 |
44.3±4.4b |
50.0±2.8b |
52.5±4.2b |
|
| Binaprofen | 0.8 | 5 |
44.5±6.0b |
54.1±8.3b |
57.3±5.5b |
| α-GST (mg/l) | Control | − | 5 | 85.5±4.4 | 91.9±7.1 | 96.7±6.7 |
|
| APAP | 4 | 5 | 90.1±22.7 |
82.8±4.5a | 92.3±24.1 |
|
| Binaprofen | 0.4 | 5 | 91.9±9.3 | 97.0±6.5 | 93.7±5.2 |
|
| Binaprofen | 0.8 | 5 |
73.7±4.3b | 94.1±20.1 | 85.3±19.1 |
| OCT | Control | − | 5 | 8.9±0.5 | 9.9±1.2 | 8.7±0.1 |
|
| APAP | 4 | 5 | 8.8±0.5 | 9.1±0.2 |
10.2±1.2a |
|
| Binaprofen | 0.4 | 5 | 9.3±0.5 | 9.6±0.7 |
9.5±0.2b |
|
| Binaprofen | 0.8 | 5 | 8.5±0.7 | 8.5±0.6 | 8.7±1.8 |
| TBA (µM/l) | Control | − | 5 | 2.6±1.1 | 3.2±0.3 | 2.8±1.1 |
|
| APAP | 4 | 5 |
6.6±2.1a |
7.6±1.3b |
10.1±0.3b |
|
| Binaprofen | 0.4 | 5 | 3.6±1.8 |
6.0±1.8a |
7.8±1.3b |
|
| Binaprofen | 0.8 | 5 |
5.5±1.9a |
6.0±2.2b |
8.3±1.5b |
| PA (mg/l) | Control | − | 5 | 44.33±18.38 | 52.25±20.47 | 56.00±22.83 |
|
| APAP | 4 | 5 | 81.50±44.55 | 95.83±38.52 |
136.16±46.01a |
|
| Binaprofen | 0.4 | 5 | 51.16±21.23 | 62.50±37.18 | 86.50±30.78 |
|
| Binaprofen | 0.8 | 5 | 52.50±16.69 | 109.83±44.77 |
122.83±39.62a |
| XOD | Control | − | 5 | 0.71±0.12 | 0.68±0.17 | 0.73±0.13 |
|
| APAP | 4 | 5 | 0.67±0.29 |
1.23±0.17a |
2.01±0.52b |
|
| Binaprofen | 0.4 | 5 | 0.77±0.15 | 0.74±0.35 | 0.67±0.29 |
|
| Binaprofen | 0.8 | 5 | 0.76±0.53 | 0.64±40 | 1.28±0.32 |
| ICD | Control | − | 5 | 2.03±0.27 | 2.32±0.45 | 2.06±0.32 |
|
| APAP | 4 | 5 |
2.66±0.28a | 2.40±0.18 | 2.26±0.54 |
|
| Binaprofen | 0.4 | 5 | 2.22±0.50 | 1.80±0.18 | 1.88±0.15 |
|
| Binaprofen | 0.8 | 5 | 2.23±0.50 |
1.48±0.62a | 1.89±0.65 |
| SDH | Control | − | 5 | 1.02±0.39 | 0.94±0.17 | 1.03±0.34 |
|
| APAP | 4 | 5 | 1.49±1.02 | 1.03±0.56 | 1.45±0.58 |
|
| Binaprofen | 0.4 | 5 | 1.10±0.34 | 1.51±0.90 | 2.01±0.99 |
|
| Binaprofen | 0.8 | 5 | 1.03±0.82 | 1.83±0.91 | 2.23±1.05 |
Treatment with 0.4 mM binaprofen resulted in a
decrease in LDH levels at 24 h, a decrease in Arg-I levels at 12
and 24 h, an increase in ASAL levels at 12, 24 and 48 h, an
increase in OCT levels at 48 h, and an increase in TBA levels at 24
and 48 h post-drug exposure. Treatment with 0.8 mM binaprofen
resulted in an increase in ALT levels at 48 h, an increase in AST
levels at 48 h, an increase in LDH levels at 48 h, a decrease in
Arg-I levels at 12, 24 and 48 h, an increase in ASAL levels at 12,
24 and 48 h, a decrease in α-GST levels at 12 h, an increase in TBA
levels at 12, 24 and 48 h, an increase in PA levels at 48 h, an
increase in XOD levels at 24 and 48 h, and a decrease in ICD levels
at 24 h post-drug exposure (Table
II).
Overall, ALT, LDH, ASAL, TBA and PA levels in
response to binaprofen were altered in a concentration- and
time-dependent manner.
ROC curve analysis
Alterations in ASAL and TBA levels were most
sensitive at predicting DILI following 12 h binaprofen exposure
compared with in the control group. The sensitivity of the
biomarkers at 12 h was ranked as follows:
TBA>ASAL>ALT>LDH>AST. Following 24 h of drug exposure,
ASAL, TBA and ALT were identified to be the most sensitive. The
sensitivity of biomarkers at 24 h was ranked as follows:
ALT>TBA>ASAL>LDH=AST. The biomarkers ASAL, TBA, ALT, AST
and LDH were identified to be sensitive biomarkers at 48 h; the
relative ranking was as follows: TBA=ALT=AST=LDH>ASAL (Table III).
| Table III.Biomarker sensitivity analysis in
zebrafish serum. |
Table III.
Biomarker sensitivity analysis in
zebrafish serum.
|
| Time |
|---|
|
|
|
|---|
| Biomarker | 12 h | 24 h | 48 h |
|---|
| ASAL | 0.81a | 0.80a | 0.90a |
| TBA | 0.93a | 1.00a | 1.00a |
| ALT | 0.75 | 0.93a | 1.00a |
| AST | 0.50 | 0.50 | 1.00a |
| LDH | 0.56 | 0.50 | 1.00a |
As shown in Table
III, after 48 h of drug exposure the levels of non-conventional
biomarkers (TBA and ASAL) and conventional biomarkers (ALT, AST and
LDH) were significantly altered in line with DILI.
In vitro analyses
Determining IC50 in an in
vitro model of DILI
The results demonstrated that treatment of liver
cell lines with >8 mM APAP significantly inhibited cell growth.
The IC50 for APAP was calculated to be 16.2 mM with a
95% CI of 11.4–21.2 mM. Treatment with >4.8 mM binaprofen also
had a significant inhibitory effect on liver cells. The
IC50 for binaprofen was calculated to be 5.3 mM with a
95% CI of 4.5–6.2 mM (data not shown).
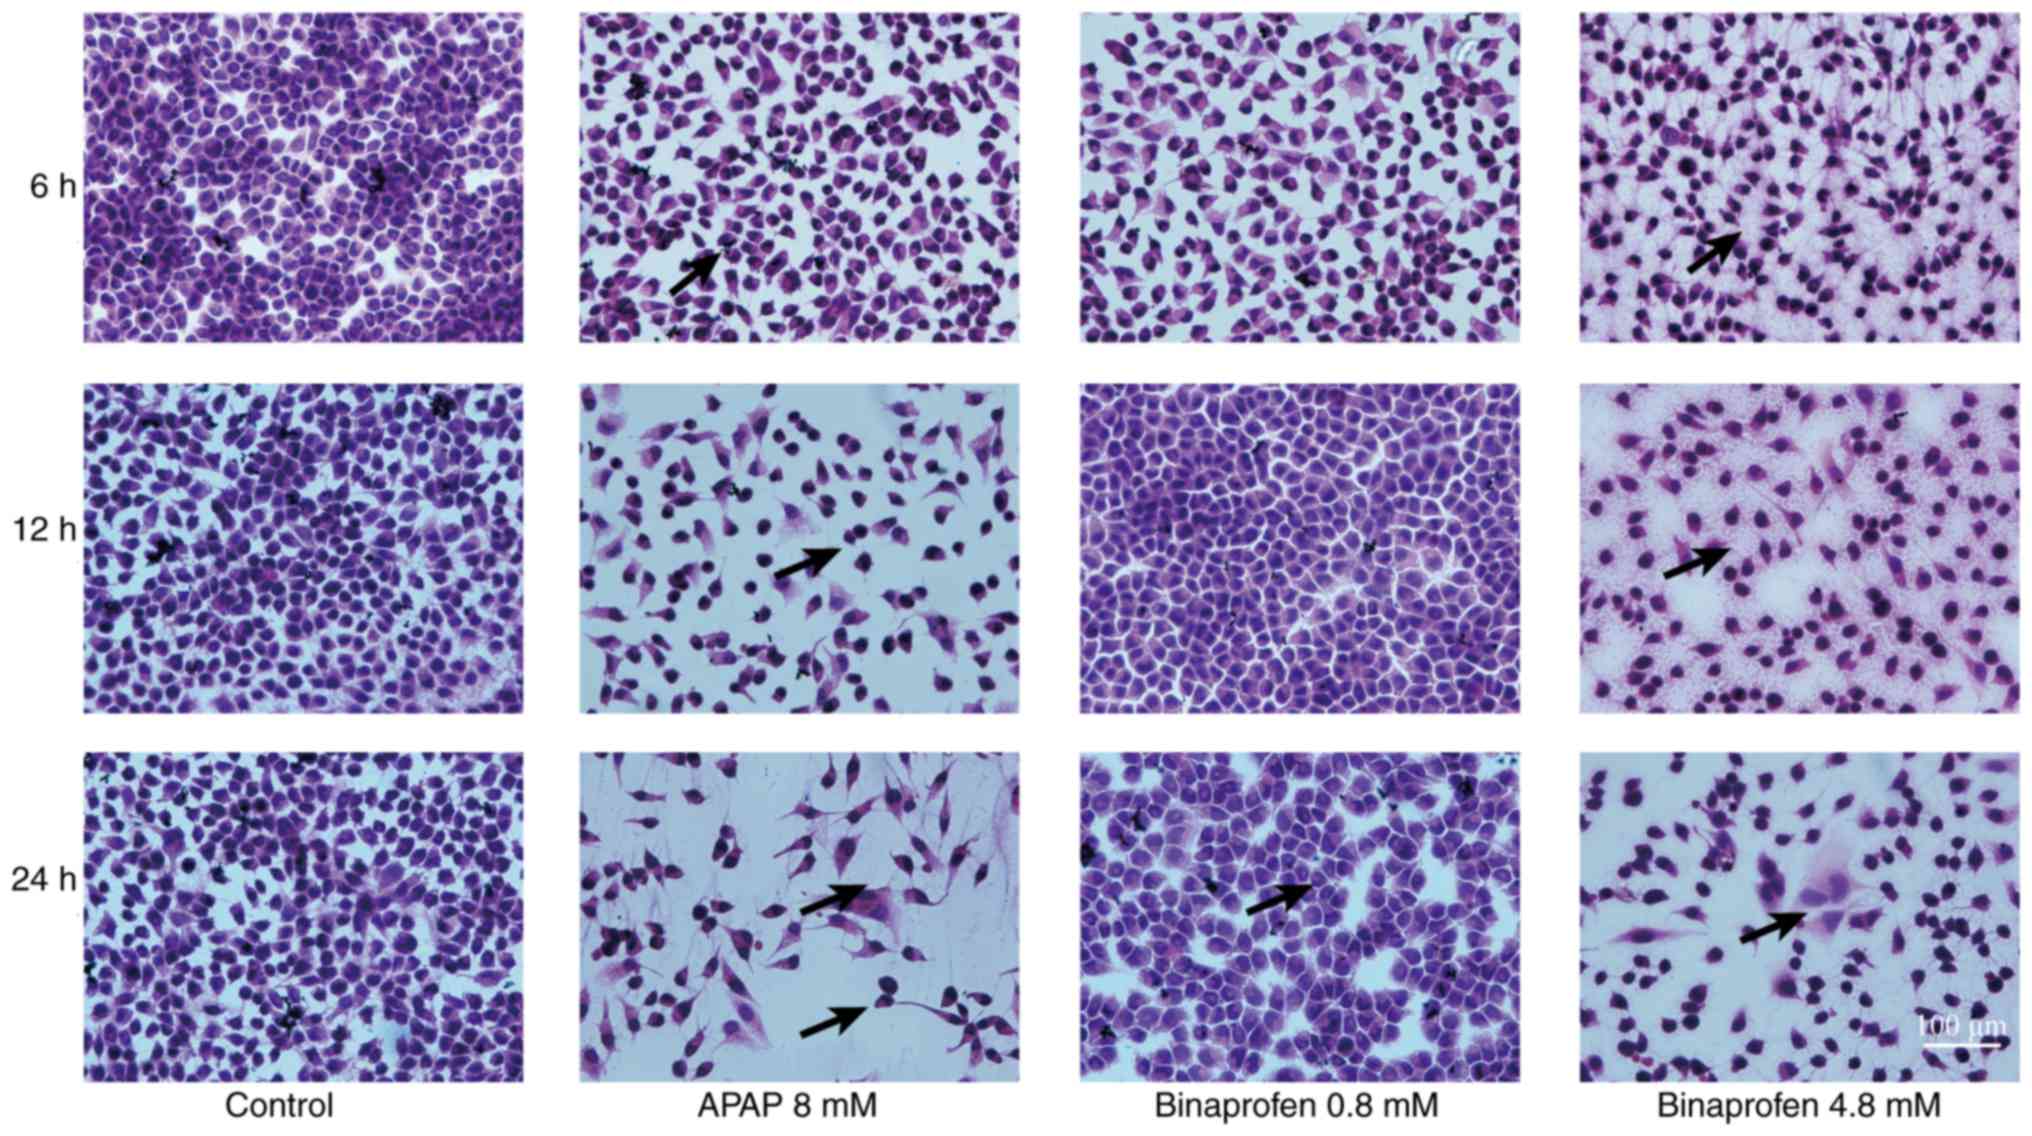
Histological analysis
The survival of cultured liver cells decreased in a
time-dependent manner following treatment with 8 mM APAP; the
percentage of viable cells at different time points were as
follows: 87.5% at 6 h, 65.3% at 12 h and 61.2% at 24 h. The
survival of cultured liver cells also decreased in a time-dependent
manner with 0.8 mM binaprofen treatment; the percentage of viable
cells at the different time points were as follows: 98.5% at 6 h,
94.6% at 12 h and 91.0% at 24 h. Increasing the concentration of
binaprofen to 4.8 mM resulted in the following percentages of
viable cells at the various time points: 83.5% at 6 h, 63.7% at 12
h and 54.2% at 24 h. The percentage of viable cells in the 0.8 mM
binaprofen-treated group was higher compared with in the 4.8 mM
binaprofen-treated group (data not shown).
Treatment with 8 mM APAP caused 1/5 liver cell
cultures to exhibit mild swelling (+) at 6 and 12 h, and 5/5 liver
cells to exhibit mild or moderate (+/++) swelling at 24 h post-drug
exposure (Table IV; Fig. 2); however, 0.8 mM binaprofen
treatment resulted in no abnormalities in the liver cells at 6, 12
or 24 h post-drug exposure. Treatment with 4.8 mM binaprofen caused
no liver cell abnormalities at 6 h, although 1/5 liver cell
cultures exhibited mild swelling (+) at 12 h and 4/5 liver cells
exhibited mild to moderate swelling (+/++) 24 h post-drug
exposure.
| Table IV.Histopathological scoring of APAP-
and binaprofen-treated L-02 liver cell line cultures. |
Table IV.
Histopathological scoring of APAP-
and binaprofen-treated L-02 liver cell line cultures.
|
|
|
|
| Time |
|---|
|
|
|
|
|
|
|---|
| Group | Concentration
(mM) | n | Pathological
score | 6 h | 12 h | 24 h |
|---|
| Control | − | 5 | − | 5 | 5 | 5 |
|
|
|
| + | 0 | 0 | 0 |
|
|
|
| ++ | 0 | 0 | 0 |
|
|
|
| +++ | 0 | 0 | 0 |
|
|
|
| ++++ | 0 | 0 | 0 |
| APAP | 8 | 5 | − | 4 | 4 |
0a |
|
|
|
| + | 1 | 1 | 4 |
|
|
|
| ++ | 0 | 0 | 1 |
|
|
|
| +++ | 0 | 0 | 0 |
|
|
|
| ++++ | 0 | 0 | 0 |
| Binaprofen | 0.8 | 5 | − | 5 | 5 | 5 |
|
|
|
| + | 0 | 0 | 0 |
|
|
|
| ++ | 0 | 0 | 0 |
|
|
|
| +++ | 0 | 0 | 0 |
|
|
|
| ++++ | 0 | 0 | 0 |
| Binaprofen | 4.8 | 5 | − | 5 | 4 |
1a |
|
|
|
| + | 0 | 1 | 3 |
|
|
|
| ++ | 0 | 0 | 1 |
|
|
|
| +++ | 0 | 0 | 0 |
|
|
|
| ++++ | 0 | 0 | 0 |
Detection of biomarkers
Treatment with 8 mM APAP caused ALT and LDH levels
to increase at 24 h, ASAL levels to increase at 12 and 24 h and TBA
levels to increase at 6, 12 and 24 h post-drug exposure (P<0.05;
Table V).
| Table V.Secreted biomarker detection (U/l) in
APAP- and binaprofen-treated liver cell culture supernatant. |
Table V.
Secreted biomarker detection (U/l) in
APAP- and binaprofen-treated liver cell culture supernatant.
|
|
|
|
| Time |
|---|
|
|
|
|
|
|
|---|
| Biomarker | Group | Concentration
(mM) | n | 6 h | 12 h | 24 h |
|---|
| ALT | Control | − | 5 | 3.3±1.4 | 2.5±0.0 | 3.3±1.4 |
|
| APAP | 8 | 5 | 5.0±0.0 | 5.0±2.5 |
8.3±1.4a |
|
| Binaprofen | 0.8 | 5 | 5.8±2.9 | 5.0±0.0 | 4.2±1.4 |
|
| Binaprofen | 4.8 | 5 | 4.2±2.9 | 4.2±1.4 |
7.5±2.5a |
| AST | Control | − | 5 | 10.0±4.3 | 11.7±2.9 | 6.7±2.9 |
|
| APAP | 8 | 5 | 8.3±3.8 | 14.2±3.8 | 20.8±11.8 |
|
| Binaprofen | 0.8 | 5 | 10.0±4.3 | 10.0±2.5 |
14.2±2.9a |
|
| Binaprofen | 4.8 | 5 | 10.8±3.8 | 11.7±1.4 |
16.7±3.8a |
| ALP | Control | − | 5 | 31.7±10.1 | 27.5±2.5 | 25.0±5.0 |
|
| APAP | 8 | 5 | 40.8±5.2 | 34.2±6.3 | 35.0±4.3 |
|
| Binaprofen | 0.8 | 5 | 42.5±15.2 | 29.2±3.8 | 33.3±1.4 |
|
| Binaprofen | 4.8 | 5 | 35.0±8.7 | 32.5±5.0 | 33.3±3.8 |
| LDH | Control | − | 5 | 87.5±16.4 | 88.3±51.9 | 80.0±7.3 |
|
| APAP | 8 | 5 | 76.7±6.3 | 73.3±22.7 |
172.5±39.7a |
|
| Binaprofen | 0.8 | 5 | 105.8±31.6 | 73.3±31.2 |
105.0±51.9a |
|
| Binaprofen | 4.8 | 5 | 84.0±13.8 | 73.3±64.3 |
191.7±53.4a |
| ASAL | Control | − | 5 | 25.4±11.5 | 27.3±2.0 | 25.9±5.3 |
|
| APAP | 8 | 5 | 32.9±3.0 |
35.9±1.3a |
38.6±2.5a |
|
| Binaprofen | 0.8 | 5 |
36.6±6.1a |
41.3±6.0a |
41.8±1.3a |
|
| Binaprofen | 4.8 | 5 |
38.1±1.2a |
42.2±3.0a |
45.0±2.5a |
| TBA (µM·L-1) | Control | − | 5 | 2.4±0.2 | 1.9±0.8 | 2.1±0.2 |
|
| APAP | 8 | 5 |
3.0±0.3a |
3.0±0.3a |
3.6±0.9a |
|
| Binaprofen | 0.8 | 5 | 2.3±1.1 |
2.9±0.2a |
3.2±0.6a |
|
| Binaprofen | 4.8 | 5 |
2.9±0.4a |
3.0±0.2a |
3.2±0.8a |
Treatment with 0.8 mM binaprofen treatment caused
LDH levels to increase at 24 h, ASAL levels to increase at 6, 12
and 24 h, and TBA levels to increase at 12 and 24 h. At a
concentration of 4.8 mM, binaprofen treatment caused ALT and AST
levels to increase at 24 h, LDH levels to increase at 24 h, and
ASAL and TBA levels to increase at 6, 12 and 24 h post-drug
exposure (P<0.05; Table V).
The alterations in ALT, AST, LDH, ASAL and TBA
levels in response to binaprofen occurred in a concentration- and
time-dependent manner.
ROC curve analysis
Compared with in the control group, alterations in
ASAL levels were most sensitive in predicting DILI following 6 h of
binaprofen exposure; the sensitivity of the various biomarkers at 6
h was ranked as follows: ASAL>TBA>ALT=AST=ALP=LDH. Following
12 h of drug exposure, ASAL and TBA were identified as the most
sensitive biomarkers; the sensitivity ranking was as follows:
ASAL=TBA>ALT=ALP>LDH>AST. Following 24 h of drug exposure,
ASAL, TBA, ALT, ALP, AST and LDH were all sensitive biomarkers and
the relative sensitivities were as follows:
ASAL=TBA=AST=LDH>ALT=ALP (Table
VI).
| Table VI.Biomarker sensitivity analysis in
liver cell culture supernatants. |
Table VI.
Biomarker sensitivity analysis in
liver cell culture supernatants.
|
| Time |
|---|
|
|
|
|---|
| Biomarker | 6 h | 12 h | 24 h |
|---|
| ASAL | 1.00a | 1.00a | 1.00a |
| TBA | 0.83 | 1.00a | 1.00a |
| ALT | 0.56 | 0.83 | 0.94a |
| AST | 0.56 | 0.56 | 1.00a |
| ALP | 0.56 | 0.83 | 0.94 |
| LDH | 0.56 | 0.72 | 1.00a |
Following 24 h of drug exposure, the levels of the
non-conventional biomarkers (TBA and ASAL), and the conventional
biomarkers (ALT, AST, and LDH) were significantly altered in line
with DILI.
Discussion
The most commonly recommended dose for APAP in a
clinical setting is <2 g/day. Toxicity studies have indicated
that an APAP intake of >4 g/day can cause liver injury (21) and that doses >10 g/day may cause
mortality. Most drugs are toxic at high doses; therefore, the
United States Food and Drug Administration (FDA) requires drug
manufacturers to indicate the lowest drug dose that is likely to
cause harm. In March 2011, the FDA limited the amount of APAP in
tablets or capsules to 325 mg, in order to reduce the risk of
serious liver injury and allergic reactions. The daily dose
allowance for APAP was not to exceed 504 mg/day, which translates
to an intake of ~3.3 mM. In the present study, the LC50
of APAP in a zebrafish model of DILI was 5.2 mM, which is 1.6×
higher than the current recommended clinical dose; the
IC50 of APAP was 16.2 mM in cultured liver cells, which
is 4.9× higher than the current recommended clinical dose.
Binaprofen is a drug currently under investigation
with a recommended clinical dose of 188 mg/day, which is equivalent
to 0.6 mM (unpublished data from manufacturer). In the present
study, it was revealed that the LC50 of binaprofen in
zebrafish was 1.2 mM, which is 2× higher than the current
recommended clinical dose; the IC50 of binaprofen in
cultured liver cells was found to be 5.3 mM, which is 8.8× higher
than the current recommended clinical dose. The results
demonstrated that binaprofen is unlikely to be more toxic than
APAP; however, clinical trials are required to understand
binaprofen toxicity in humans.
Both APAP and binaprofen treatment led to impaired
swimming and coordination in zebrafish, which are signs of
cytotoxicity in these animals. However, since the main aim of this
study was to investigate liver injury, histological evaluation and
biomarker analysis were used as key indicators of liver health.
DILI is one of the main adverse reactions caused by
NSAIDs. The clinical characteristics of DILI lack specificity, and
biochemical indicators may exhibit only slight abnormality or may
even be normal in early stages of the disease. The clinical
assessment of liver injury still largely relies on
histopathological evaluation, as outlined in the Knodell and
Chevallier semi-quantitative scoring systems (22,23).
Liver biopsy procedures are extremely traumatic for patients;
therefore, sensitive biomarkers, including serum levels of enzymes,
molecules or proteins offer an alternative method for monitoring
DILI.
Conventional clinical biomarkers, including ALT,
AST, ALP and LDH, are currently being used to monitor DILI, and are
fairly accurate in predicting liver injury. ALT is considered a
gold standard for monitoring liver function in the clinic. As this
enzyme occurs at very high levels in the liver, particularly in the
cytoplasm of liver cells, an increase in its serum levels is a good
predictor of liver injury. However, serum ALT levels in patients
with chronic liver fibrosis are often normal, whereas serum ALT
levels of patients with burns are high, indicating that ALT levels
may not always accurately predict liver injury (24). AST, another sensitive indicator of
liver function (25), is an
important aminotransferase enzyme that is found in cardiac muscle,
liver, skeletal muscle, kidney and other tissues. In patients with
chronic liver diseases, due to reduced synthesis of the enzyme, AST
levels appear normal, whereas strenuous exercise can often increase
serum AST levels (26).
Additionally, AST levels are known to be highest in heart tissues
(27); therefore, serum AST levels
may not be very specific in predicting impaired liver function. ALP
is a non-specific hydrolase that is widely distributed in the
liver, bile duct, intestine, bone and kidney tissues (28); and increases in serum ALP levels
may indicate biliary obstruction, cholestasis, gastrointestinal
obstruction, or even bone and intestinal injuries. LDH is one of
the most important glycolytic enzymes involved in respiration
(29). It is mainly found in
skeletal muscles, liver, heart, kidney and several other tissues.
Although alterations in LDH levels can indicate liver injury, it is
not useful in detecting problems at early stages. Studies have
demonstrated that in rat models, liver damage can be detected by
electron microscopy 5 h after injury, whereas serum LDH levels are
only increased 20 h after injury (30). Therefore, early diagnosis of DILI
with current clinical biomarkers is not very accurate or reliable.
However, there are numerous non-conventional biomarkers of liver
injury, whose changes in response to liver injury occur earlier and
are more sensitive than conventional biomarkers.
In the present study, the ability of
non-conventional biomarkers, including α-GST, Arg-I, ASAL, TBA, PA,
ICD, SDH and OCT, to predict DILI was investigated. ASAL has an
important role in the ornithine cycle and is mainly found in the
liver (31); serum ASAL levels are
significantly increased in patients with hepatitis. Although this
enzyme is also found in kidneys, serum ASAL does not increase in
patients with kidney disease; therefore, ASAL may specifically
predict liver injury (32). Arg-I
is mainly found in the nuclei of liver cells, although it is
present at low amounts in the kidney, heart, spleen, brain and
muscle tissues (33,34). In acute and chronic liver injury,
serum Arg-I levels have been reported to increase at an earlier
time point compared with serum ALT and AST levels, particularly in
injuries caused by liver transplantation. α-GST is a low molecular
weight enzyme with a short half-life that is mainly found in the
liver, accounting for ~5% of soluble protein in liver cells
(35,36). A previous study suggested that
α-GST can act as a biomarker for liver injury in patients infected
with Schistosomiasis mansoni (37). TBA is mainly found in liver cells,
with only very low levels detected in the serum (38,39)
and is indicative of liver function, including protein synthesis,
metabolism and secretion. Liver injuries can cause a significant
increase in serum TBA levels; therefore, it is considered a
sensitive biomarker for predicting liver injury. Serum TBA levels
are particularly useful for diagnosing acute and chronic hepatitis,
liver fibrosis and cirrhosis; studies have revealed that increased
serum TBA levels are detected in 97.4% of patients with acute
hepatitis, in 84.3% of patients with chronic hepatitis and in 100%
of patients with cirrhosis (40).
PA is a transport protein that is synthesized by liver cells and
alterations in serum PA levels can be rapidly detected once its
synthesis is impaired (41,42).
Serum PA levels have been reported to change significantly in
patients with chronic hepatitis and liver cirrhosis after treatment
(43). There are two types of ICD
in the human body, one that utilizes NAD+ and another
that utilizes NADP+ (44,45).
The ICD, which utilizes NADP+ is present in large
amounts in the liver, cardiac/skeletal muscle and kidney tissues,
and alterations in its serum levels have been reported to be both
sensitive and specific to injuries of hepatic parenchymal cells.
SDH is mainly found in the liver, though it is also present in low
levels in kidney, brain, heart and spleen tissues (46,47).
Therefore, serum SDH levels may serve as a sensitive and specific
biomarker for predicting liver injury. OCT is mainly found in liver
mitochondria where it is the key enzyme that metabolizes ammonia
into urea in the ornithine cycle (48). It is a liver-specific enzyme and
only very low amounts are found in other tissues; therefore, it may
function as a specific biomarker for liver disease. All of the
non-conventional biomarkers described here may reflect different
characteristics of liver injury due to their varying functions and
distributions.
The ROC curve is a graphical tool used to test the
accuracy of diagnostic tests. It evaluates the accuracy and
diagnostic value of a diagnostic test in an objective and
comprehensive manner, by calculating its sensitivity and
specificity in distinguishing between patients with disease
regardless of disease incidence.
ROC curve and area under the curve (AUC) are used to
assess the accuracy of a diagnostic test, and screen for the best
diagnostic test for a particular disease. If the AUC of an ROC
curve is ≤0.5 this indicates that a test has no diagnostic value,
whereas an AUC between 0.5 and 0.7 indicates low diagnostic value,
an AUC of 0.7–0.9 indicates medium diagnostic value and an AUC
>0.9 indicates high diagnostic value.
Overall, the results of the present study
demonstrated that ASAL and TBA levels are increased during the
early stages of DILI, and that this increase occurs earlier
compared with the conventional biomarker ALT. These two enzymes
were also more accurate in predicting liver injury compared with
ALT in both the in vivo zebrafish and in vitro liver
cell DILI model. According to these findings, ASAL and TBA may be
the most sensitive biomarkers in predicting DILI caused by
binaprofen. However, there are limitations to using model systems
and further research is required to confirm the results. It is
recommended that ASAL and TBA are tested as biomarkers in future
clinical trials to obtain more accurate conclusions. TBA can be
detected using a biochemical analyzer, which makes it an easy
biomarker to measure in a clinical setting. TBA, ASAL, ALT and AST
could also be detected in combination to predict DILI caused by
binaprofen, as this may improve the efficiency and accuracy of
early diagnosis.
In conclusion, the NSAID binaprofen induced similar
liver toxicity in vitro and in vivo compared with
APAP. The non-conventional biomarkers TBA and ASAL were identified
as the most sensitive early biomarkers for predicting DILI caused
by binaprofen and may serve as novel DILI biomarkers in the
future.
Acknowledgements
Not applicable.
Funding
The present study was financially supported by the
Foundation of Ministry of Education and Science of Guangdong
Province, P.R. China (grant no. 2012B090600020), the Ministry of
Science and Technology of Guangzhou City, P.R. China (grant no.
2011070), the Science and Technology Plan Projects of Guangdong
Province, P.R. China (grant no. 2016A010119136) and the High-Level
Leading Talent Introduction Program of Guangdong Academic of
Sciences, P.R. China (grant no. 2016GDASRC-0104).
Availability of data and materials
All data generated or analyzed during this study are
included in this published article.
Authors' contributions
QG, JG, RJ, WY and CL conceived and designed the
study. QG, GC, JG, ZH and BX performed the experiments, and
completed the acquisition of data, QG, JG, WY and CL completed the
analysis and interpretation of data for the study. QG and JG wrote
the paper. All authors read and approved the manuscript.
Ethics approval and consent to
participate
The present study was approved by the Institutional
Animal Care and Use Committee of Guangzhou Pharmaceutical Research
Institute (protocol no. 2012005-01) and were conducted in
accordance with international guidelines for the care and use of
laboratory animals.
Patient consent for publication
Not applicable.
Competing interests
The authors declare that they have no competing
interests.
References
|
1
|
Koller T, Galambosova M, Filakovska S,
Kubincova M, Hlavaty T, Toth J, Krajcovicova A and Payer J:
Drug-induced liver injury in inflammatory bowel disease: 1-year
prospective observational study. World J Gastroenterol.
23:4102–4111. 2017. View Article : Google Scholar : PubMed/NCBI
|
|
2
|
Kotsampasakou E, Montanari F and Ecker GF:
Predicting drug-induced liver injury: The importance of data
curation. Toxicology. 389:139–145. 2017. View Article : Google Scholar : PubMed/NCBI
|
|
3
|
McEuen K, Borlak J, Tong W and Chen M:
Associations of drug lipophilicity and extent of metabolism with
drug-induced liver injury. Int J Mol Sci. 18:E13352017. View Article : Google Scholar : PubMed/NCBI
|
|
4
|
Juthani VV, Clearfield E and Chuck RS:
Non-steroidal anti-inflammatory drugs versus corticosteroids for
controlling inflammation after uncomplicated cataract surgery.
Cochrane Database Syst Rev. 7:CD0105162017.PubMed/NCBI
|
|
5
|
Mishra A, Amalakara J, Avula H and Reddy
K: Effect of diclofenac mouthwash on postoperative pain after
periodontal surgery. J Clin Diagn Res. 11:ZC24–ZC26.
2017.PubMed/NCBI
|
|
6
|
Zamir Q and Nadeem A: Non-steroidal
anti-inflammatory drugs vs. Paracetamol: Drug availability,
patients' preference and knowledge of toxicity. J Ayub Med Coll
Abbottabad. 28:746–749. 2016.PubMed/NCBI
|
|
7
|
Savjani JK, Mulamkattil S, Variya B and
Patel S: Molecular docking, synthesis and biological screening of
mefenamic acid derivatives as anti-inflammatory agents. Eur J
Pharmacol. 801:28–34. 2017. View Article : Google Scholar : PubMed/NCBI
|
|
8
|
Shin JY, Song I, Lee JH, Yoon JL, Kwon JS
and Park BJ: Differential risk of peptic ulcer among users of
antidepressants combined with nonsteroidal anti-inflammatory drugs.
J Clin Psychopharmacol. 37:239–245. 2017. View Article : Google Scholar : PubMed/NCBI
|
|
9
|
Rostom A, Goldkind L and Laine L:
Nonsteroidal anti-inflammatory drugs and hepatic toxicity: A
systematic review of randomized controlled trials in arthritis
patients. Clin Gastroenterol Hepatol. 3:489–498. 2005. View Article : Google Scholar : PubMed/NCBI
|
|
10
|
Rathi C, Pipaliya N, Patel R, Ingle M,
Phadke A and Sawant P: Drug induced liver injury at a tertiary
hospital in India: Etiology, clinical features and predictors of
mortality. Ann Hepatol. 16:442–450. 2017. View Article : Google Scholar : PubMed/NCBI
|
|
11
|
Soleimanpour M, Imani F, Safari S, Sanaie
S, Soleimanpour H, Ameli H and Alavian SM: The role of
non-steroidal anti-inflammatory drugs (NSAIDs) in the treatment of
patients with hepatic disease: A review article. Anesth Pain Med.
6:e378222016. View Article : Google Scholar : PubMed/NCBI
|
|
12
|
Bunchorntavakul C and Reddy KR:
Acetaminophen (APAP or N-Acetyl-p-Aminophenol) and acute liver
failure. Clin Liver Dis. 22:325–346. 2018. View Article : Google Scholar : PubMed/NCBI
|
|
13
|
Guo Q, Chen G, Zhou Q and Jin R:
Comparison of hepatotoxicity and toxic mechanisms of matrine and
oxymatrine using in vivo and in vitro models. Chinese J Comparative
Med. 28:44–50. 2018.(In Chinese).
|
|
14
|
Xiao Y, Lin M, Jiang X, Ye J, Guo T, Shi Y
and Bian X: The recent advance on liver cancer stem cells:
Biomarkers, separation, and therapy. Anal Cell Pathol (Amst).
2017:51086532017.PubMed/NCBI
|
|
15
|
Wang W, Ou HY, Xiao BQ, Huang YJ, Yang W
and Wang QS: The study of abirritation of a first type of new drug,
felbinac trometamol injection. Chin J Med Guide. 11:1327–1332.
2009.
|
|
16
|
Wang W, Ou H and Liang H: Preliminary
pharmacodynamics and safety studies of a first type of new drug,
felbinac trometamol injection. Chin J Ethnomedicine Ethnopharmacy.
12:3–4. 2009.(In Chinese).
|
|
17
|
Zhang C, Cui X, Yang Y, Gao F, Sun Y, Gu
J, Fawcett JP, Yang W and Wang W: Pharmacokinetics of felbinac
after intravenous administration of felbinac trometamol in rats.
Xenobiotica. 41:340–348. 2011. View Article : Google Scholar : PubMed/NCBI
|
|
18
|
AVMA Guidelines for the Euthanasia of
Animals: 2013 Edition. Version 2013.0.1. American Veterinary
Medical Association; Schaumburg, IL: 2013
|
|
19
|
Riera TV, Wigle TJ and Copeland RA:
Characterization of inhibitor binding through multiple inhibitor
analysis: A novel local fitting method. Methods Mol Biol.
1439:33–45. 2016. View Article : Google Scholar : PubMed/NCBI
|
|
20
|
Nagendra S, Vanlalhmuaka, Verma S, Tuteja
U and Thavachelvam K: Recombinant expression of bacillus
anthracis lethal toxin components of indian isolate in
escherichia coli and determination of its acute toxicity
level in mouse model. Toxicon. 108:108–114. 2015. View Article : Google Scholar : PubMed/NCBI
|
|
21
|
Liao CC, Day YJ, Lee HC, Liou JT, Chou AH
and Liu FC: ERK signaling pathway plays a key role in baicalin
protection against acetaminophen-induced liver injury. Am J Chin
Med. 45:105–121. 2017. View Article : Google Scholar : PubMed/NCBI
|
|
22
|
Knodell RG, Ishak KG, Black WC, Chen TS,
Craig R, Kaplowitz N, Kiernan TW and Wollman J: Formulation and
application of a numerical scoring system for assessing
histological activity in asymptomatic chronic active hepatitis.
Hepatology. 1:431–435. 1981. View Article : Google Scholar : PubMed/NCBI
|
|
23
|
Chevallier M, Guerret S, Chossegros P,
Gerard F and Grimaud JA: A histological semiqunatitative scoring
system for evaluation of hepatic fibrosis in needle liver biopsy
specimens: Comparison with morphometric studies. Hepatology.
20:349–355. 1994. View Article : Google Scholar : PubMed/NCBI
|
|
24
|
Kumar M, Sarin SK, Hissar S, Pande C,
Sakhuja P, Sharma BC, Chauhan R and Bose S: Virologic and
histologic features of chronic hepatitis B virus-infected
asymptomatic patients with persistently normal ALT.
Gastroenterology. 134:1376–1384. 2008. View Article : Google Scholar : PubMed/NCBI
|
|
25
|
Malinoski FJ: Strenuous exercise
simulating hepatic injury during vaccine trials. Vaccine. 10:39–42.
1992. View Article : Google Scholar : PubMed/NCBI
|
|
26
|
Smith JE, Garbutt G, Lopes P and Pedoe
Tunstall D: Effects of prolonged strenuous exercise (marathon
running) on biochemical and haematological markers used in the
investigation of patients in the emergency department. Br J Sports
Med. 38:292–294. 2004. View Article : Google Scholar : PubMed/NCBI
|
|
27
|
Shen J, Zhang J, Wen J, Ming Q, Zhang J
and Xu Y: Correlation of serum alanine aminotransferase and
aspartate aminotransferase with coronary heart disease. Int J Clin
Exp Med. 8:4399–4404. 2015.PubMed/NCBI
|
|
28
|
Halkes S, van den Berg A, Hoekstra M, du
Pont J and Kreis R: Transaminase and alkaline phosphatase activity
in the serum of burn patients treated with highly purified tannic
acid. Burns. 28:449–453. 2002. View Article : Google Scholar : PubMed/NCBI
|
|
29
|
Moss DW and Henderson AR: EnzymesTietz
Fundamentals of Clinical Chemistry. Burtis CA and Ashwood ER: 5th
edition. WB Saunders; Philadelphia, PA: pp. 735–896. 1999
|
|
30
|
Hu GH and Lü XS: Effect of normothermic
liver ischemic preconditioning on the expression of
apoptosis-regulating genes C-jun and Bcl-XL in rats. World J
Gastroenterol. 11:2579–2582. 2005. View Article : Google Scholar : PubMed/NCBI
|
|
31
|
Ashamiss F, Wierzbicki Z, Chrzanowska A,
Scibior D, Pacholczyk M, Kosieradzki M, Lagiewska B, Porembska Z
and Rowiński W: Clinical significance of arginase after liver
transplantation. Ann Transplant. 9:58–60. 2004.PubMed/NCBI
|
|
32
|
Chen GF and Baylis C: In vivo renal
arginine release is impaired throughout development of chronic
kidney disease. Am J Physiol Renal Physiol. 298:F95–F102. 2010.
View Article : Google Scholar : PubMed/NCBI
|
|
33
|
Stéphenne X, Najimi M, Sibille C, Nassogne
MC, Smets F and Sokal EM: Sustained engraftment and tissue enzyme
activity after liver cell transplantation for argininosuccinate
lyase deficiency. Gastroenterology. 130:1317–1323. 2006. View Article : Google Scholar : PubMed/NCBI
|
|
34
|
Murayama H, Ikemoto M, Fukuda Y, Tsunekawa
S and Nagata A: Advantage of serum type-I arginase and ornithine
carbamoyltransferase in the evaluation of acute and chronic liver
damage induced by thioacetamide in rats. Clin Chim Acta. 375:63–68.
2007. View Article : Google Scholar : PubMed/NCBI
|
|
35
|
Ray DC, Robbins AG, Howie AF, Beckett GJ
and Drummond GB: Effect of spinal anaesthesia on plasma
concentrations of glutathione S-transferase. Br J Anaesth.
88:285–287. 2002. View Article : Google Scholar : PubMed/NCBI
|
|
36
|
Ahmed AM, Abdel-Tawab AH and Morsy AT:
Alpha-Glutathione S-transferase and serum aminotransferases in
schistosomiasis mansoni patients with or without hepatitis C
virus. J Egypt Soc Parasitol. 38:561–572. 2008.PubMed/NCBI
|
|
37
|
Ouaissi A, Ouaissi M and Sereno D:
Glutathione S-transferases and related proteins from pathogenic
human parasites behave as immunomodulatory factors. Immunol Lett.
81:159–164. 2002. View Article : Google Scholar : PubMed/NCBI
|
|
38
|
Yang X, Lei J, Zhang Y, Tang X, Zheng Y
and Chen J: The diagnostic value and limitation of total serum bile
acid determined enzymatically. Zhonghua Nei Ke Za Zhi. 40:16–18.
2001.(In Chinese). PubMed/NCBI
|
|
39
|
Negoro S, Tanaka A and Takikawa H: Urinary
bile acid sulfate levels in patients with hepatitis C virus related
chronic liver diseases. Hepatol Res. 39:760–765. 2009. View Article : Google Scholar : PubMed/NCBI
|
|
40
|
Neale G, Lewis B, Weaver V and
Panveliwalla D: Serum total bile acids in liver diseases. Gut.
12:145–152. 1971. View Article : Google Scholar : PubMed/NCBI
|
|
41
|
Caccialanza R, Palladini G, Klersy C,
Cereda E, Bonardi C, Quarleri L, Vadacca G, Albertini R and Merlini
G: Serum prealbumin: An independent marker of short-term energy
intake in the presence of multiple-organ disease involvement.
Nutrition. 29:580–582. 2013. View Article : Google Scholar : PubMed/NCBI
|
|
42
|
Aliyazicioglu Y, Dagdemir A, Dilber C and
Albayrak D: Serum prealbumin levels in hepatotoxicity of
chemotherapy in children with cancer. Bratisl Lek Listy.
113:368–371. 2012.PubMed/NCBI
|
|
43
|
Saito M, Seo Y, Yano Y, Miki A, Yoshida M
and Azuma T: Short-term reductions in non-protein respiratory
quotient and prealbumin can be associated with the long-term
deterioration of liver function after transcatheter arterial
chemoembolization in patients with hepatocellular carcinoma. J
Gastroenterol. 47:704–714. 2012. View Article : Google Scholar : PubMed/NCBI
|
|
44
|
Chung YH, Kim JA, Song BC, Song IH, Koh
MS, Lee HC, Yu E, Lee YS and Suh DJ: Isocitrate dehydrogenase as a
marker of centrilobular hepatic necrosis in the experimental model
of rats. J Gastroenterol Hepatol. 16:328–332. 2001. View Article : Google Scholar : PubMed/NCBI
|
|
45
|
Racine-Samson L, Scoazec JY, D'Errico A,
Fiorentino M, Christa L, Moreau A, Roda C, Grigioni WF and Feldman
G: The metabolic organization of the adult human liver: A
comparative tudy of normal, fibrotic, and cirrhotic liver tissue.
Hepatology. 24:104–113. 1996. View Article : Google Scholar : PubMed/NCBI
|
|
46
|
Pathiratne A, Pathiratne KA and De Seram
PK: Assessment of biological effects of pollutants in a hyper
eutrophic tropical water body, Lake Beira, Sri Lanka using multiple
biomarker responses of resident fish, Nile tilapia (Oreochromis
niloticus). Ecotoxicology. 19:1019–1026. 2010. View Article : Google Scholar : PubMed/NCBI
|
|
47
|
Harrill AH, Roach J, Fier I, Eaddy JS,
Kurtz CL, Antoine DJ, Spencer DM, Kishimoto TK, Pisetsky DS, Park
BK and Watkins PB: The effects of heparins on the liver:
Application of mechanistic serum biomarkers in a randomized study
in healthy volunteers. Clin Pharmacol Ther. 92:214–220. 2012.
View Article : Google Scholar : PubMed/NCBI
|
|
48
|
Murayama H, Ikemoto M and Hamaoki M:
Ornithine carbamyltransferase is a sensitive marker for
alcohol-induced liver injury. Clin Chim Acta. 401:100–104. 2009.
View Article : Google Scholar : PubMed/NCBI
|