Introduction
Globally, gastric cancer is the fifth leading cause
of cancer and the third leading cause of death from cancer
(1,2). In 2015, 679,100 new cases of gastric
cancer were diagnosed in China, accounting for 15.8% of the total
number of newly occurred cancer cases. In addition, gastric cancer
resulted in 498,000 deaths, 17.7% of all cancer-related deaths, and
the incidence of gastric cancer has been steadily increasing
(3). Among these cases, gastric
adenocarcinoma (GAC) accounts for 95% of all gastric cancer cases.
Research indicates that, even after surgery, the outcome of GAC
patients remains dim (4–6). Therefore, other novel treatments for
GAC should be developed. The study of small-molecule drugs aiming
at multiple protein pathways modulating tumor progression,
invasion, and metastasis formation, has received much interest in
recent years (7–9). The purpose of this study was to
discover new, potential small-molecule drugs by using multiple
online databases.
Connectivity Map (CMap) is one of the gene
expression profile databases used to process the genetic data. CMap
was developed by Lamb and his colleagues from Broad Institute of
MIT, Whitehead Institute and Harvard Medical School, (Boston, MA,
USA) (10). CMap utilizes the
differential gene expression of human cells which are treated with
small-molecule drugs, to construct a biological application
database based on connection of small-molecule drugs, gene
expression and different diseases. CMap allows scholars of drug
development to take advantage of gene expression profiling data
and, therefore, identify the drugs highly correlated with disease,
infer the main chemical structure of most drug molecules, and
summarize the mechanism of possible action of drug molecules.
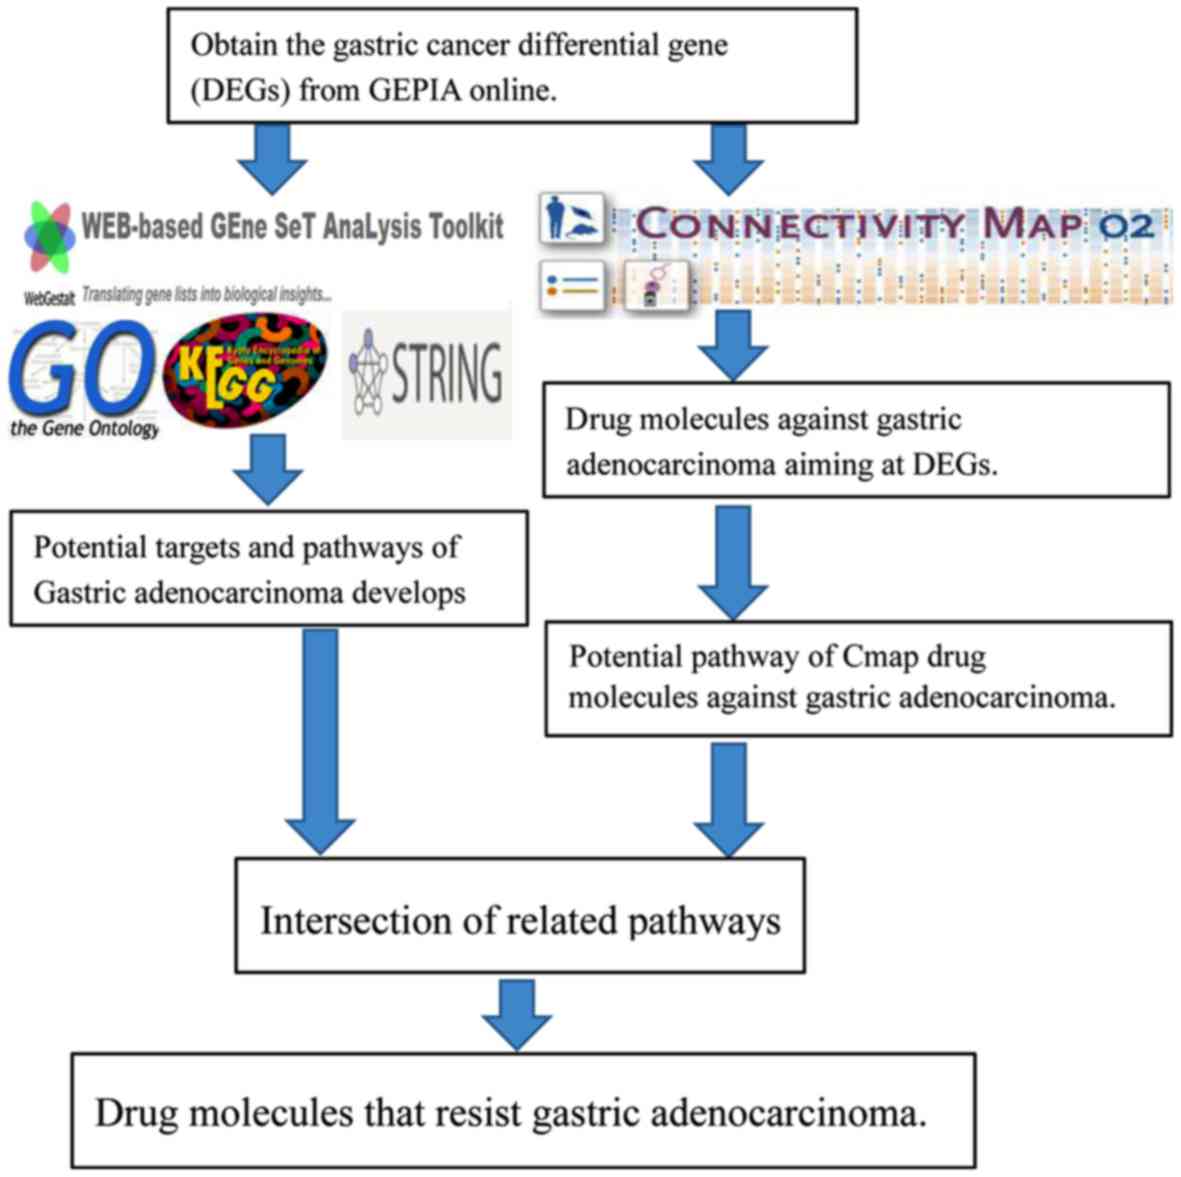
To explore new drugs for GAC, based on the
integrated subpathway analysis, we implemented an in silico
method for the reuse of GAC drugs. First, we identified the
differentially expressed genes (DEGs) between GAC and non-tumor
tissues identified in The Cancer Genome Atlas (TCGA) and
Genotype-Tissue Expression (GTEx) databases, and then determined
the potential pathways affecting the progression of GAC. Next, CMap
was used to verify the pathways of GAC affected by small-molecule
treatment. Finally, small-molecule drugs that can target
subpathways related to GAC were considered as potential new agents
in the treatment of GAC (Fig. 1).
The candidate drugs identified in our approach may provide a new
direction for improving the treatment of patients with GAC.
Materials and methods
DEG analysis of GAC
Using the GEPIA online analysis website (http://gepia.cancer-pku.cn/), the expression data of
mRNA of GAC in TCGA and GTEx databases were performed with the
value of fold change (FC). Among these data, only the genes with
logFC >2 and logFC <-2 were defined as DEGs, including
upregulated and downregulated ones.
Enrichment analysis of DEGs
DEGs were performed with Gene Ontology (GO) and the
Kyoto Encyclopedia of Genes and Genomes (KEGG) pathway analysis
with the WebGestalt database (http://www.webgestalt.org/). Also, pathway analysis
was conducted by Gene List Analysis (http://www.pantherdb.org/) to obtain possible pathways
during the development of GAC. Finally, we used the STRING database
(https://string-db.org/) to analyze the
protein-protein interaction (PPI) of the ultimate DEGs as
previously reported (11–16). In this study, GO outcomes were
analyzed visibly with Cytoscape software (version 3.7.0, U.S.
National Institute of General Medical Sciences (NIGMS), http://cytoscape.org/).
CMap for DEG analysis of drug molecule
cures for GAC
The CMap database (https://portals.broadinstitute.org/CMap/) (build 02)
contains over 7,000 gene expression profiles and 1,309 chemicals.
To analyze this potential mechanism for the development of GAC, we
first set up the files in query signature format for DEGs obtained
from the TCGA (https://cancergenome.nih.gov/) and GTEx databases
(https://gtexportal.org/home/). We then
entered the CMap quick query interface to import the files of
upregulated and downregulated genes and ran them with CMap
analysis. In this way, we analyzed the drug molecules for the DEGs
of GAC (17). The negatively
related drugs (P<0.05 and Enrichment <0) for anti-GAC were
then screened.
Correlation data between drug
molecules and subpathways
The chip expression profiles of 1,309 drugs and the
genes affected by the drugs using the CMap database were
downloaded. Furthermore, we identified the subpathways that obtain
significant enrichment for each small-molecule drug with the
affected genes according to the method reported by a previous
publication (18). Consistent with
the reference, 196 small-molecular drugs and 104 subpathways were
also achieved. The overlapped pathways between those from CMap and
those enriched by DEGs were determined, which were identified as
potential pathways related to both the treatment and pathogenesis
of GAC. Finally, the drug-pathway network was constructed for
GAC.
Results
Screening results of DEGs
Altogether, 843 DEGs in mRNA expression of GAC were
obtained, which included 638 upregulated genes and 205
downregulated ones. The next analysis was based on this screening
result.
Functional annotation, pathway
enrichment and PPI network analysis
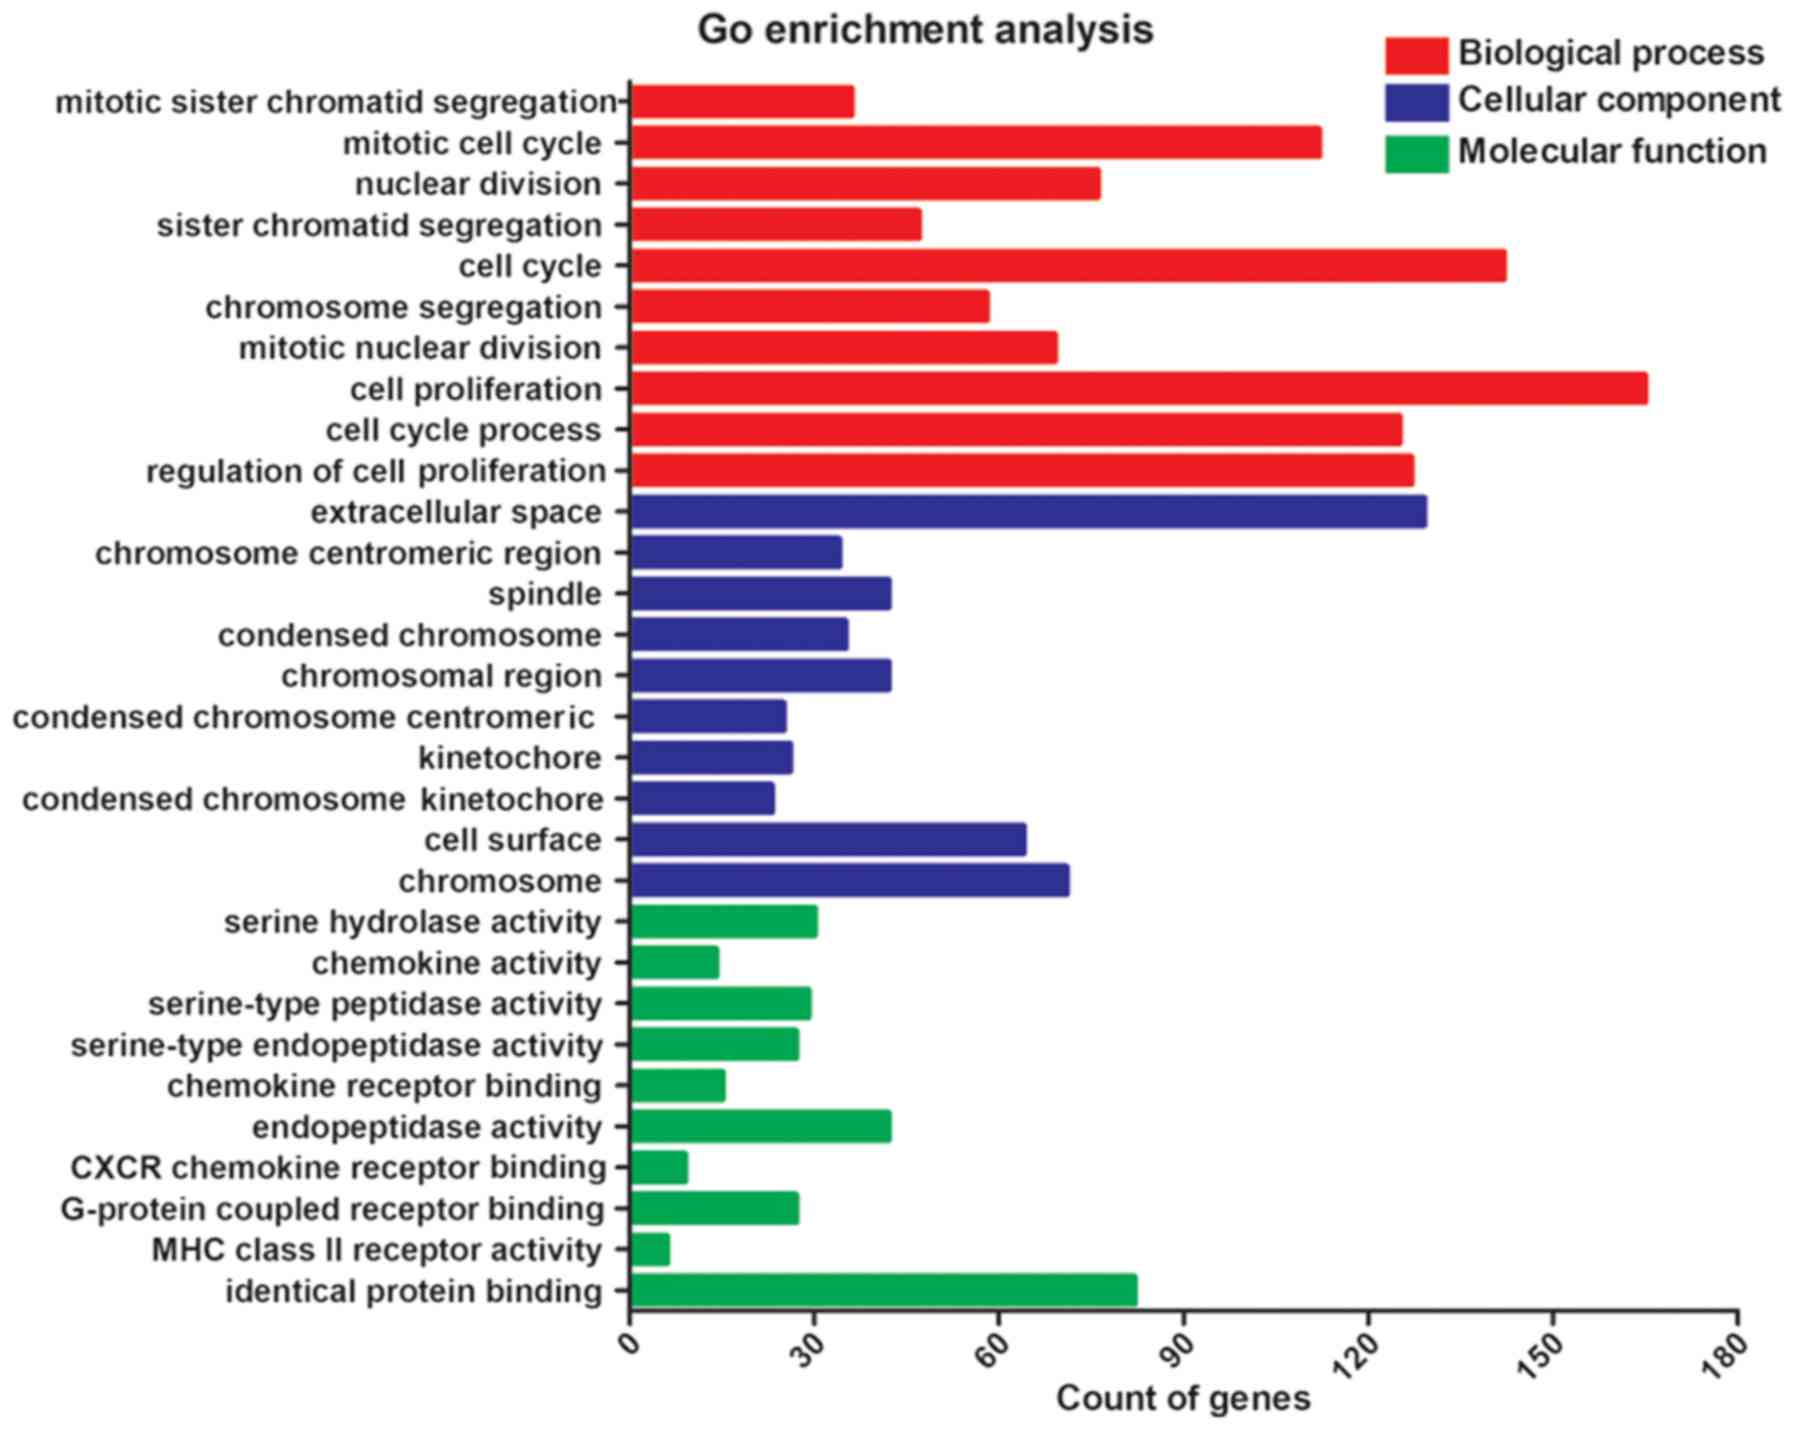
Through GO analysis, in the annotations of
biological progress, the top three most significant processes were
mitotic sister chromatid segregation, mitotic cell cycle and
nuclear division. In the terms of cellular component, the top most
significant annotations were extracellular space, chromosome,
centromeric region and spindle. As for analysis of molecular
function, the top three most significant functions were serine
hydrolase activity, chemokine activity and serine-type peptidase
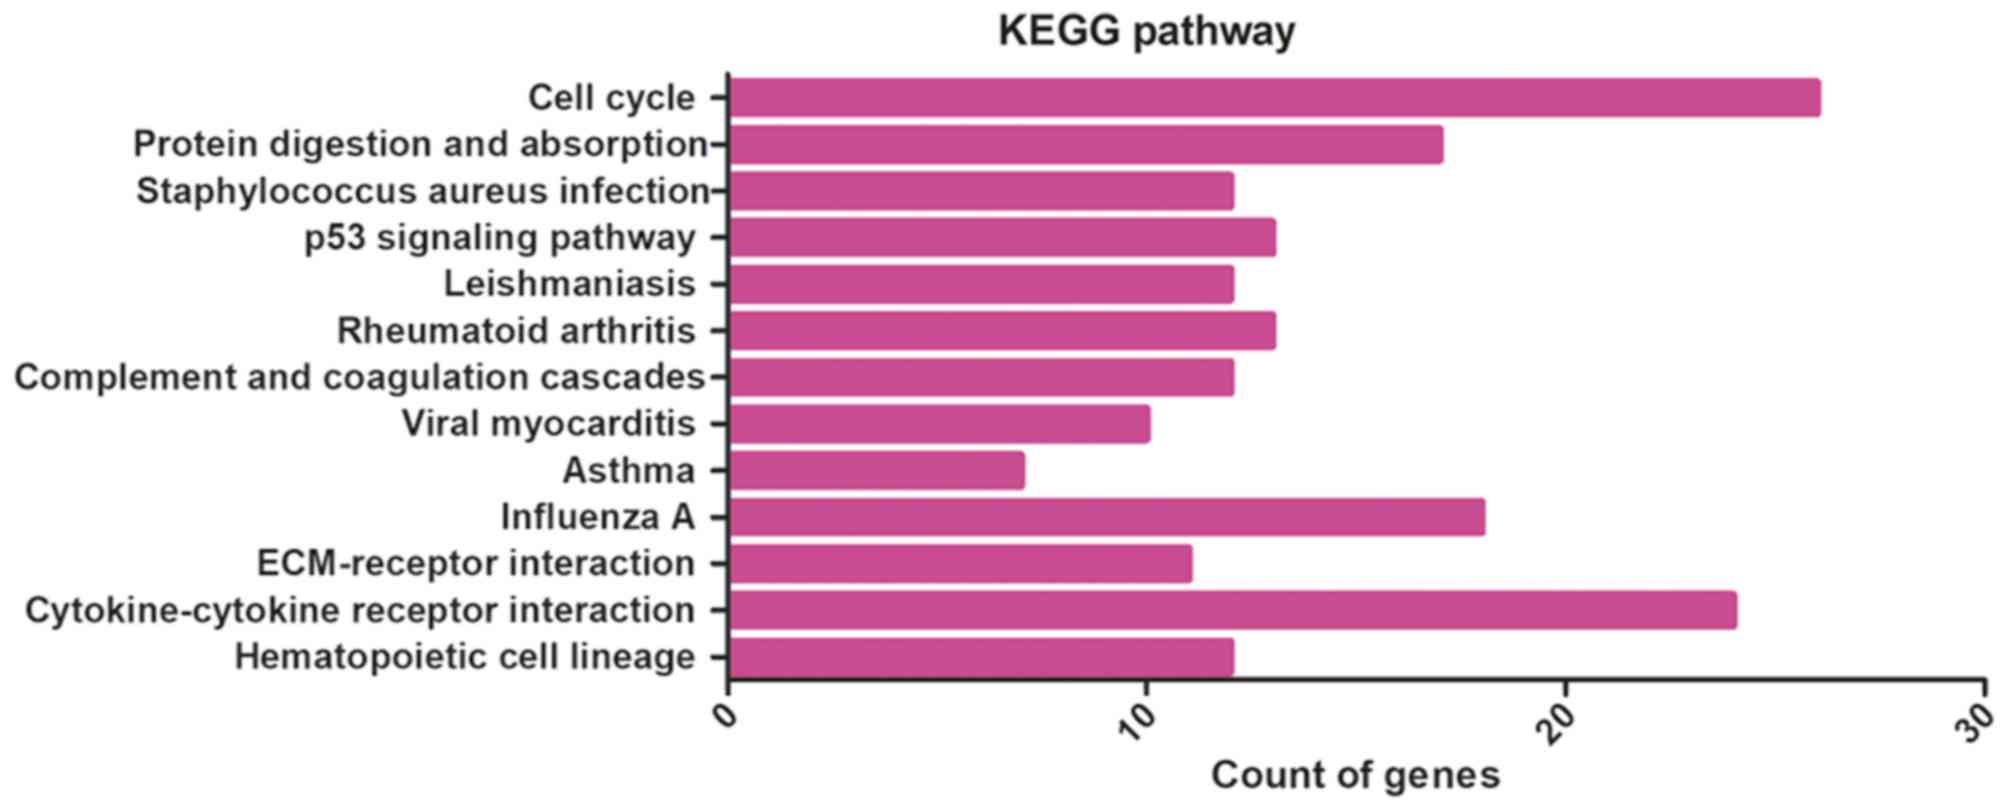
activity (Table I and Fig. 2). KEGG pathway analysis indicated
that DEGs were obviously centralized in 13 pathways, including cell
cycle, protein digestion and absorption, Staphylococcus
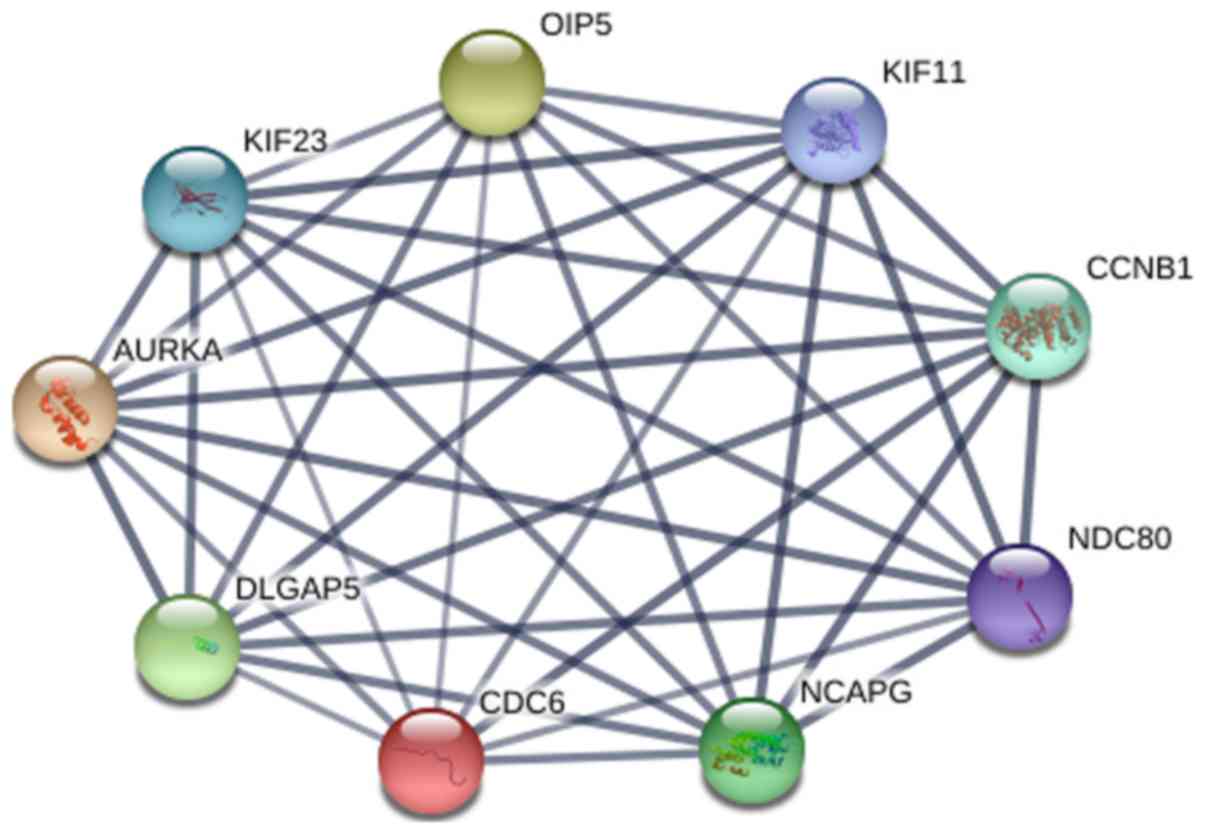
aureus infection, and the p53 signaling pathway (Table II and Fig. 3). From the PPI network analysis, we
acquired the following hub genes: CCNB1, AURKA, CDC6, KIF11,
OIP5, NCAPG, KIF23, DLGAP5 and NDC80 (nodes ≥100) (Fig. 4).
 | Table I.Top 10 of the most significantly
enriched GO terms. |
Table I.
Top 10 of the most significantly
enriched GO terms.
| Pathway ID | Terms | Gene count | FDR | P-value |
|---|
| BP |
|
GO:0000070 | Mitotic sister
chromatid segregation | 36 | 0 | 0 |
|
GO:0000278 | Mitotic cell
cycle | 112 | 0 | 0 |
|
GO:0000280 | Nuclear
division | 76 | 0 | 0 |
|
GO:0000819 | Sister chromatid
segregation | 47 | 0 | 0 |
|
GO:0007049 | Cell cycle | 142 | 0 | 0 |
|
GO:0007059 | Chromosome
segregation | 58 | 0 | 0 |
|
GO:0007067 | Mitotic nuclear
division | 69 | 0 | 0 |
|
GO:0008283 | Cell
proliferation | 165 | 0 | 0 |
|
GO:0022402 | Cell cycle
process | 125 | 0 | 0 |
|
GO:0042127 | Regulation of cell
proliferation | 127 | 0 | 0 |
| CC |
|
GO:0005615 | Extracellular
space | 129 | 0 | 0 |
|
GO:0000775 | Chromosome,
centromeric region | 34 | 1.14E-13 | 2.22E-16 |
|
GO:0005819 | Spindle | 42 | 1.52E-13 | 4.44E-16 |
|
GO:0000793 | Condensed
chromosome | 35 | 2.86E-13 | 1.11E-15 |
|
GO:0098687 | Chromosomal
region | 42 | 2.54E-12 | 1.23E-14 |
|
GO:0000779 | Condensed
chromosome, centromeric region | 25 | 2.88E-12 | 1.68E-14 |
|
GO:0000776 | Kinetochore | 26 | 1.18E-11 | 8.04E-14 |
|
GO:0000777 | Condensed
chromosome kinetochore | 23 | 1.39E-11 | 1.20E-13 |
|
GO:0009986 | Cell surface | 64 | 1.39E-11 | 1.21E-13 |
|
GO:0005694 | Chromosome | 71 | 1.40E-10 | 1.36E-12 |
| MF |
|
GO:0017171 | Serine hydrolase
activity | 30 | 2.76E-07 | 1.77E-10 |
|
GO:0008009 | Chemokine
activity | 14 | 2.76E-07 | 3.88E-10 |
|
GO:0008236 | Serine-type
peptidase activity | 29 | 2.76E-07 | 5.77E-10 |
|
GO:0004252 | Serine-type
endopeptidase activity | 27 | 2.76E-07 | 6.04E-10 |
|
GO:0042379 | Chemokine receptor
binding | 15 | 3.08E-07 | 8.91E-10 |
|
GO:0004175 | Endopeptidase
activity | 42 | 3.08E-07 | 1.01E-09 |
|
GO:0045236 | CXCR chemokine
receptor binding | 9 | 4.33E-07 | 1.66E-09 |
|
GO:0001664 | G-protein coupled
receptor binding | 27 | 6.08E-05 | 2.66E-07 |
|
GO:0032395 | MHC class II
receptor activity | 6 | 7.59E-05 | 3.74E-07 |
|
GO:0042802 | Identical protein
binding | 82 | 1.18E-04 | 6.44E-07 |
| Table II.Significantly enriched KEGG
pathway. |
Table II.
Significantly enriched KEGG
pathway.
| Pathway ID | Terms | Gene count | FDR | P-value |
|---|
| hsa04110 | Cell cycle | 26 | 2.83E-08 | 9.34E-11 |
| hsa04974 | Protein digestion
and absorption | 17 | 1.33E-04 | 8.80E-07 |
| hsa05150 | Staphylococcus
aureus infection | 12 | 9.58E-04 | 9.49E-06 |
| hsa04115 | p53 signaling
pathway | 13 | 1.35E-03 | 1.79E-05 |
| hsa05140 | Leishmaniasis | 12 | 9.11E-03 | 1.50E-04 |
| hsa05323 | Rheumatoid
arthritis | 13 | 1.40E-02 | 3.07E-04 |
| hsa04610 | Complement and
coagulation cascades | 12 | 1.40E-02 | 3.24E-04 |
| hsa05416 | Viral
myocarditis | 10 | 1.56E-02 | 4.13E-04 |
| hsa05310 | Asthma | 7 | 1.73E-02 | 5.12E-04 |
| hsa05164 | Influenza A | 18 | 4.47E-02 | 1.63E-03 |
| hsa04512 | ECM-receptor
interaction | 11 | 4.47E-02 | 1.64E-03 |
| hsa04060 | Cytokine-cytokine
receptor interaction | 24 | 4.47E-02 | 1.77E-03 |
| hsa04640 | Hematopoietic cell
lineage | 12 | 4.86E-02 | 2.09E-03 |
CMap analysis to achieve potential
compounds for GAC
The 843 DEGs of GAC mentioned above led to 78
compounds by CMap (Table III)
when P<0.05 and Enrichment <0.
| Table III.CMap compounds matched by the DEGs of
gastric adenocarcinoma. |
Table III.
CMap compounds matched by the DEGs of
gastric adenocarcinoma.
| Rank | CMap name | Cell line | N | Enrichment | P-value | Specificity | Percent
non-null |
|---|
| 1 |
Phenoxybenzamine | MCF7 | 3 | −0.984 | 0 | 0 | 100 |
| 2 | Vorinostat | MCF7 | 7 | −0.844 | 0 | 0.1262 | 100 |
| 3 | Trichostatin A | PC3 | 55 | −0.705 | 0 | 0.1149 | 96 |
| 4 | Trichostatin A | MCF7 | 92 | −0.59 | 0 | 0.1881 | 88 |
| 5 | Trichostatin A | HL60 | 34 | −0.465 | 0 | 0.1946 | 52 |
| 6 | LY-294002 | MCF7 | 34 | −0.454 | 0 | 0.1625 | 70 |
| 7 | Resveratrol | MCF7 | 6 | −0.865 | 0.00002 | 0.0082 | 100 |
| 8 | Alexidine | PC3 | 2 | −0.996 | 0.00004 | 0 | 100 |
| 9 | 15-Delta
prostaglandin J2 | MCF7 | 8 | −0.695 | 0.00018 | 0.0414 | 87 |
| 10 | Meticrane | PC3 | 2 | −0.991 | 0.00026 | 0 | 100 |
| 11 | Astemizole | PC3 | 2 | −0.99 | 0.00026 | 0.0192 | 100 |
| 12 | Thiostrepton | MCF7 | 2 | −0.973 | 0.00141 | 0.0283 | 100 |
| 13 | Clemizole | PC3 | 2 | −0.973 | 0.00141 | 0 | 100 |
| 14 | Sulconazole | MCF7 | 2 | −0.973 | 0.00157 | 0 | 100 |
| 15 | Mefloquine | PC3 | 2 | −0.971 | 0.00167 | 0.0431 | 100 |
| 16 | MG-262 | PC3 | 2 | −0.968 | 0.00223 | 0.0738 | 100 |
| 17 | Cloperastine | PC3 | 2 | −0.968 | 0.00223 | 0.0149 | 100 |
| 18 | Thioridazine | PC3 | 5 | −0.736 | 0.0027 | 0.102 | 100 |
| 19 | Methotrexate | MCF7 | 3 | −0.877 | 0.00379 | 0.0853 | 100 |
| 20 | Valproic acid | HL60 | 14 | −0.448 | 0.00403 | 0.2883 | 64 |
| 21 | Cloperastine | MCF7 | 3 | −0.873 | 0.00415 | 0.0196 | 100 |
| 22 |
Fludroxycortide | PC3 | 2 | −0.954 | 0.00453 | 0.0171 | 100 |
| 23 | Pyrantel | PC3 | 2 | −0.946 | 0.00644 | 0.0144 | 100 |
| 24 | Thioguanosine | MCF7 | 2 | −0.945 | 0.00658 | 0.0455 | 100 |
| 25 |
6-Bromoindirubin-3′-oxime
methylbenzethonium | PC3 | 4 | −0.755 | 0.00732 | 0.0498 | 100 |
| 26 | Chloride | PC3 | 2 | −0.939 | 0.00767 | 0.0598 | 100 |
| 27 | Chlorpromazine | PC3 | 4 | −0.749 | 0.0079 | 0.0168 | 100 |
| 28 | Vorinostat | HL60 | 3 | −0.839 | 0.00837 | 0.1705 | 100 |
| 29 | Vitexin | MCF7 | 2 | −0.936 | 0.00861 | 0.0051 | 100 |
| 30 | Acetazolamide | MCF7 | 2 | −0.931 | 0.00984 | 0 | 100 |
| 31 | Pyrvinium | MCF7 | 4 | −0.731 | 0.0105 | 0.1304 | 100 |
| 32 | 5224221 | MCF7 | 2 | −0.927 | 0.01097 | 0.1429 | 100 |
| 33 | Methacholine
chloride | MCF7 | 2 | −0.924 | 0.01181 | 0.0278 | 100 |
| 34 | Cortisone | MCF7 | 2 | −0.921 | 0.01262 | 0.0117 | 100 |
| 35 | Carbachol | MCF7 | 2 | −0.919 | 0.01318 | 0.0058 | 100 |
| 36 | Clotrimazole | MCF7 | 3 | −0.807 | 0.01444 | 0.0556 | 100 |
| 37 | Dipyridamole | MCF7 | 3 | −0.799 | 0.01671 | 0.04 | 100 |
| 38 | Abamectin | MCF7 | 2 | −0.907 | 0.01746 | 0.05 | 100 |
| 39 | LY-294002 | PC3 | 12 | −0.423 | 0.01802 | 0.3669 | 66 |
| 40 | Troglitazone | PC3 | 4 | −0.696 | 0.01804 | 0.1159 | 100 |
| 41 | Luteolin | MCF7 | 2 | −0.904 | 0.01839 | 0.0476 | 100 |
| 42 |
Hydroflumethiazide | MCF7 | 2 | −0.902 | 0.01913 | 0.0601 | 100 |
| 43 |
Homochlorcyclizine | MCF7 | 2 | −0.898 | 0.02066 | 0.0968 | 100 |
| 44 | Gemfibrozil | PC3 | 2 | −0.896 | 0.02167 | 0.0208 | 100 |
| 45 | Withaferin A | PC3 | 2 | −0.894 | 0.02223 | 0.0917 | 100 |
| 46 | Tanespimycin | PC3 | 12 | −0.414 | 0.02239 | 0.3382 | 58 |
| 47 |
Prochlorperazine | MCF7 | 9 | −0.472 | 0.0231 | 0.1892 | 66 |
| 48 | Ciclosporin | MCF7 | 4 | −0.679 | 0.02349 | 0.0576 | 75 |
| 49 | Disulfiram | PC3 | 2 | −0.891 | 0.02382 | 0.0667 | 100 |
| 50 | Procaine | PC3 | 2 | −0.89 | 0.024 | 0.0294 | 100 |
| 51 | 0173570-0000 | PC3 | 4 | −0.677 | 0.02407 | 0.1349 | 75 |
| 52 | Tretinoin | MCF7 | 13 | −0.395 | 0.02531 | 0.3655 | 61 |
| 53 | Fluphenazine | PC3 | 3 | −0.769 | 0.02534 | 0.1026 | 100 |
| 54 | Loperamide | MCF7 | 3 | −0.767 | 0.026 | 0.087 | 100 |
| 55 | Dilazep | PC3 | 2 | −0.886 | 0.02612 | 0.0784 | 100 |
| 56 |
Trifluoperazine | PC3 | 3 | −0.765 | 0.02656 | 0.1379 | 100 |
| 57 |
3-Acetylcoumarin | MCF7 | 3 | −0.764 | 0.02692 | 0.022 | 100 |
| 58 | Flunarizine | MCF7 | 2 | −0.884 | 0.02712 | 0.068 | 100 |
| 59 | Sulfaguanidine | PC3 | 2 | −0.878 | 0.02972 | 0.0202 | 100 |
| 60 | Ethaverine | MCF7 | 2 | −0.878 | 0.03004 | 0.0133 | 100 |
| 61 | Amiodarone | MCF7 | 3 | −0.754 | 0.03043 | 0.1039 | 100 |
| 62 | Picotamide | PC3 | 2 | −0.875 | 0.03127 | 0.0162 | 100 |
| 63 | Felodipine | MCF7 | 5 | −0.594 | 0.0318 | 0.1376 | 80 |
| 64 | Prestwick-1084 | MCF7 | 2 | −0.873 | 0.03201 | 0.0545 | 100 |
| 65 | Monobenzone | MCF7 | 2 | −0.871 | 0.03306 | 0.0548 | 100 |
| 66 | Pioglitazone | PC3 | 5 | −0.586 | 0.03585 | 0.3436 | 60 |
| 67 | Levocabastine | MCF7 | 2 | −0.866 | 0.03626 | 0.0615 | 100 |
| 68 | Noretynodrel | MCF7 | 2 | −0.865 | 0.03628 | 0.0822 | 100 |
| 69 |
Trifluoperazine | MCF7 | 9 | −0.448 | 0.03655 | 0.2308 | 55 |
| 70 | 15-Delta
prostaglandin J2 | HL60 | 3 | −0.738 | 0.03684 | 0.1429 | 100 |
| 71 | Etoposide | MCF7 | 2 | −0.864 | 0.03712 | 0.1 | 100 |
| 72 | Bufexamac | MCF7 | 2 | −0.863 | 0.0376 | 0.0556 | 100 |
| 73 | 0179445-0000 | PC3 | 4 | −0.644 | 0.03853 | 0.0685 | 75 |
| 74 | 15-Delta
prostaglandin J2 | PC3 | 3 | −0.734 | 0.03856 | 0.1507 | 100 |
| 75 | Minaprine | PC3 | 2 | −0.858 | 0.04008 | 0.031 | 100 |
| 76 | Oxymetazoline | PC3 | 2 | −0.855 | 0.04181 | 0.0345 | 100 |
| 77 | Nortriptyline | MCF7 | 2 | −0.852 | 0.04338 | 0.0901 | 100 |
| 78 | CP-690334-01 | MCF7 | 4 | −0.633 | 0.04418 | 0.1027 | 50 |
| 79 | SB-203580 | PC3 | 2 | −0.85 | 0.04515 | 0.0464 | 100 |
| 80 | Scriptaid | PC3 | 2 | −0.849 | 0.04537 | 0.1596 | 100 |
| 81 | Esculetin | MCF7 | 2 | −0.848 | 0.04609 | 0.0671 | 100 |
| 82 | Fluspirilene | MCF7 | 2 | −0.848 | 0.0464 | 0.1748 | 100 |
| 83 | Sulfadoxine | MCF7 | 2 | −0.845 | 0.04829 | 0.0481 | 100 |
| 84 | Monorden | PC3 | 5 | −0.562 | 0.04932 | 0.106 | 60 |
| 85 | Ivermectin | MCF7 | 2 | −0.843 | 0.04937 | 0.1404 | 100 |
| 86 | Norethisterone | MCF7 | 2 | −0.842 | 0.04994 | 0.0263 | 100 |
Intersection of small-molecule drug
correlative pathways and KEGG pathways
According to a previous method (18), we performed subpathway analysis and
obtained 104 subpathways. After integrating these 104 subpathways
with 13 KEGG pathways generated by the DEGs, two pathways related
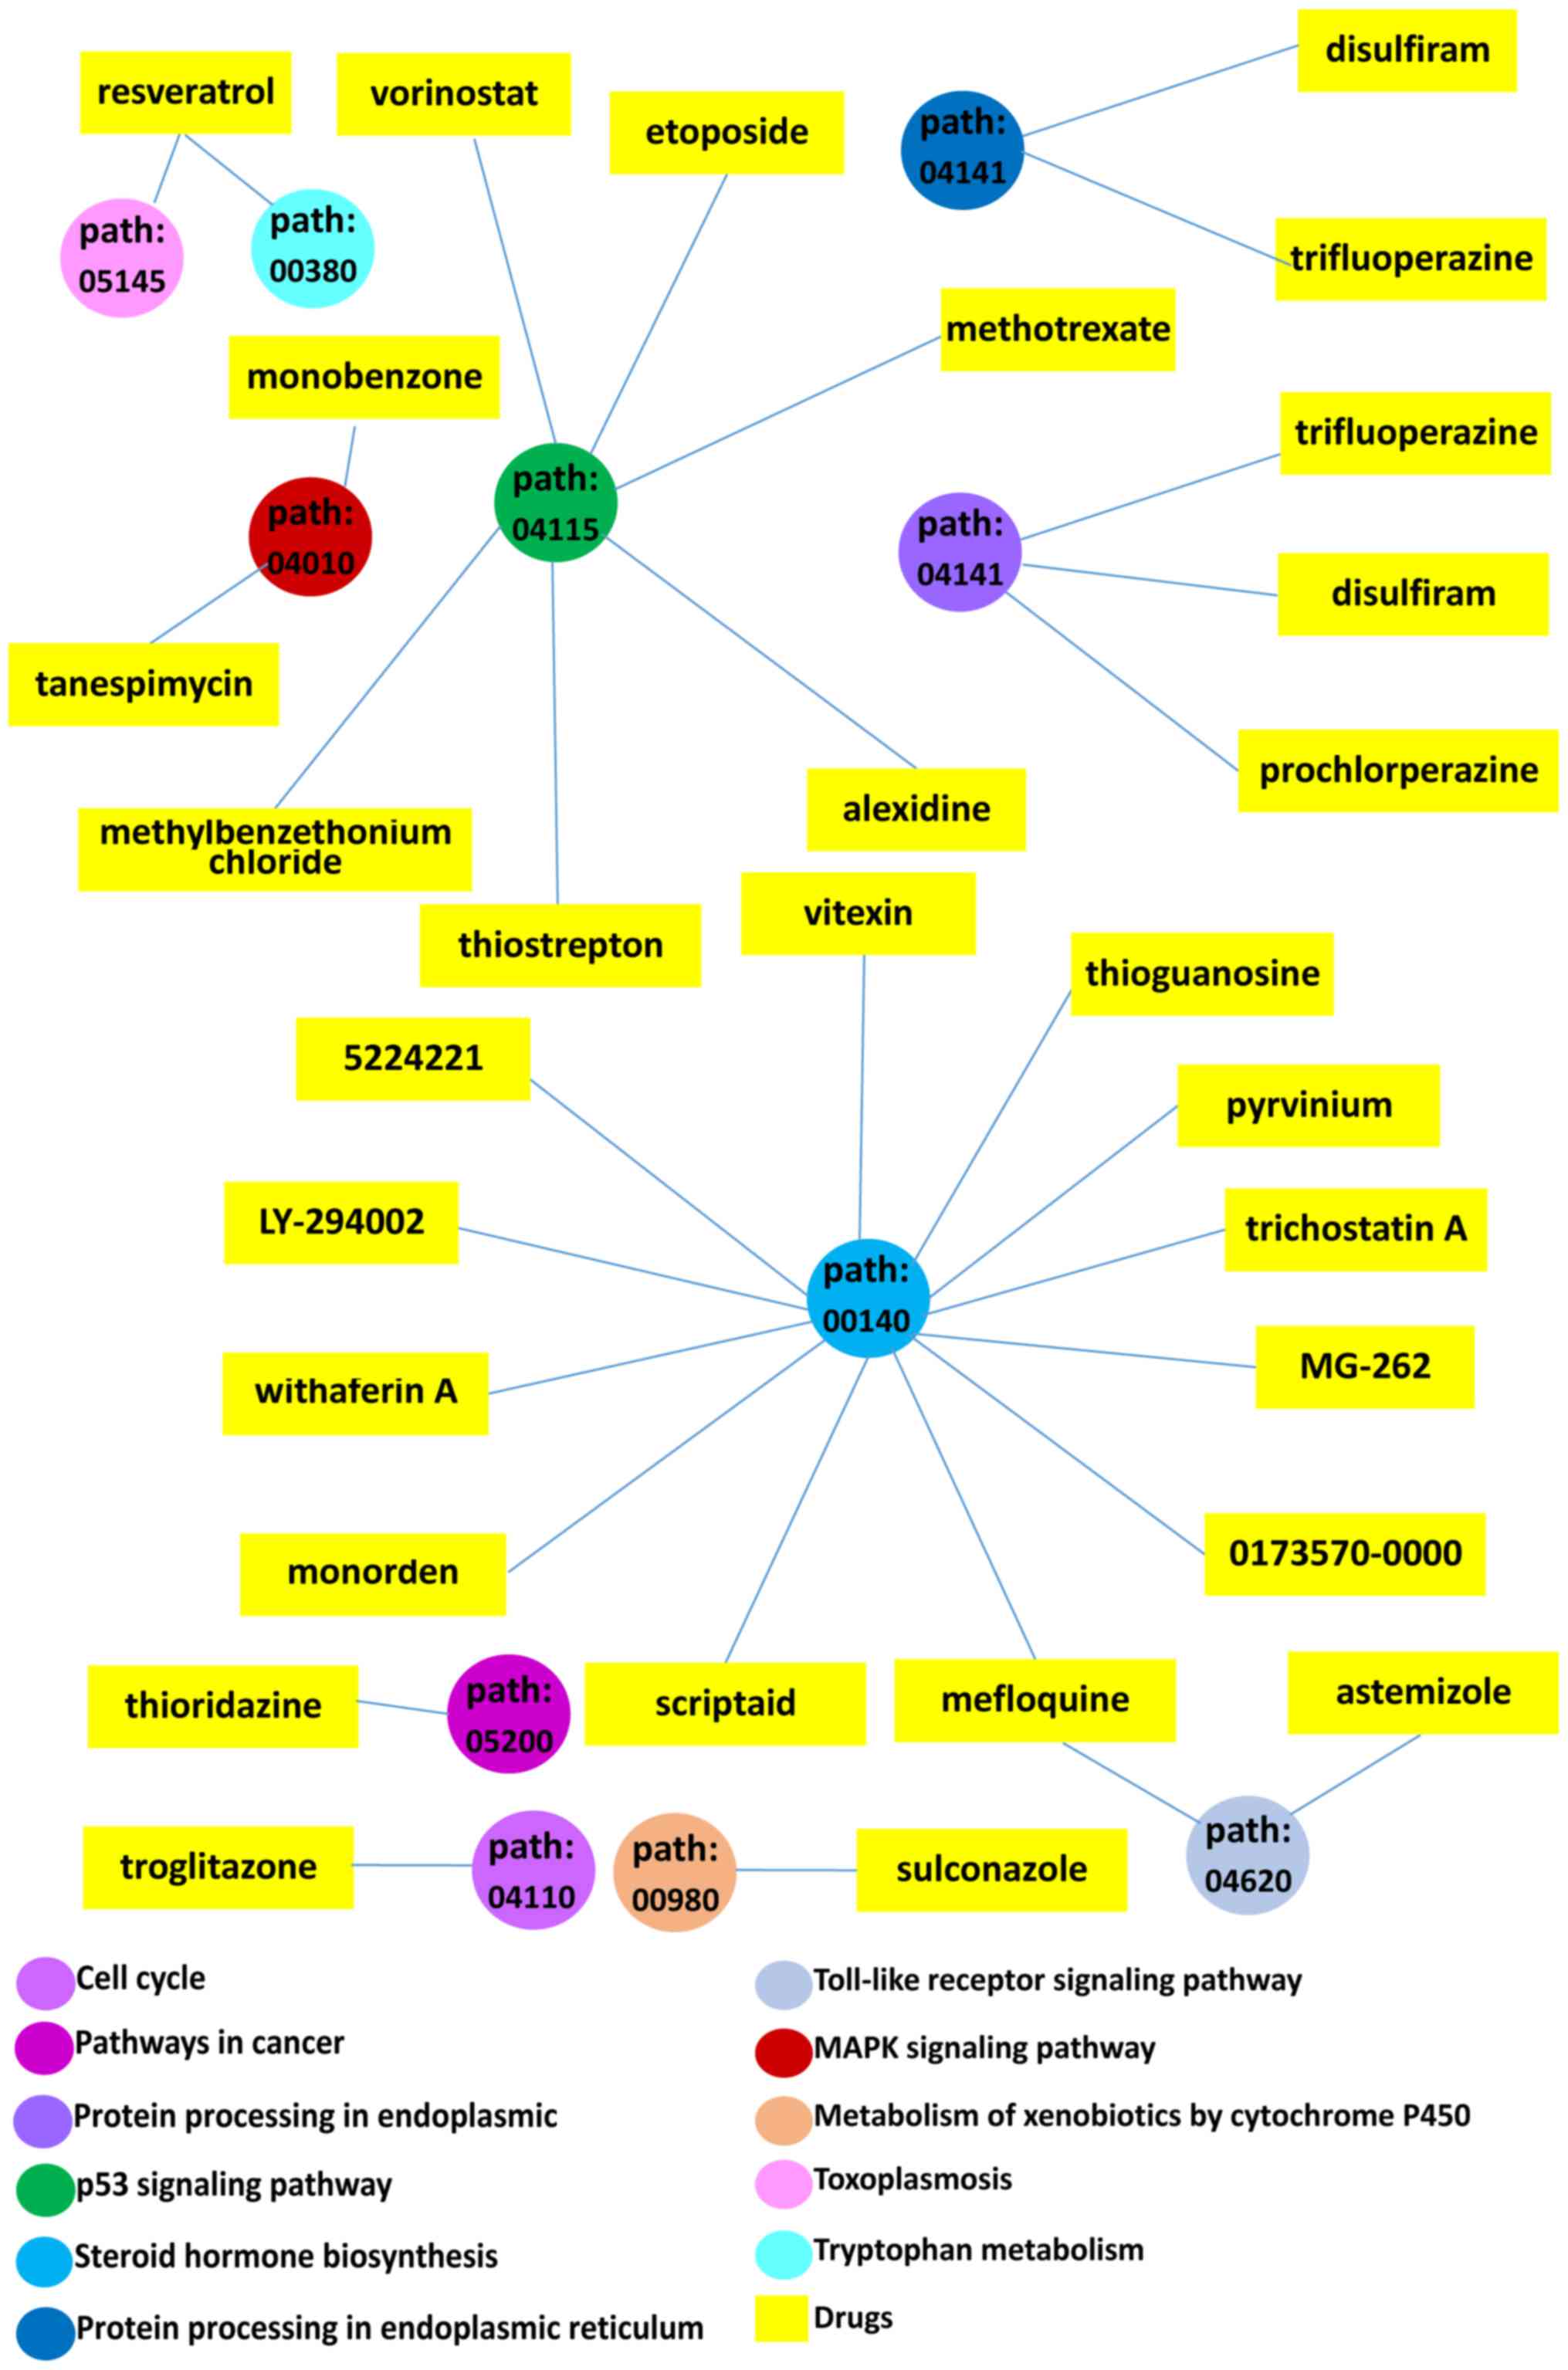
to anti-GAC drug molecules were finally achieved (Table IV and Fig. 5), including cell cycle and p53
signaling pathways. These two pathways were related to 32 genes and
seven CMap small-molecule drugs. The genes involved in these two
KEGG pathway were CDKN2A, DBF4, CHEK1, ORC6, SFN, MAD2L1, MCM2,
MCM4, MCM5, PCNA, PLK1, CCND1, BUB1, BUB1B, TTK, CDC45, CCNA2,
CCNB1, PKMYT1, CCNB2, PTTG1, ESPL1, CDK1, CDC6, CDC20, CDC25C,
IGFBP3, GTSE1, SERPINB5, RPRM, RRM2 and BID. The PPI analysis
with the above 32 genes demonstrated two hub genes (CCNB1 and
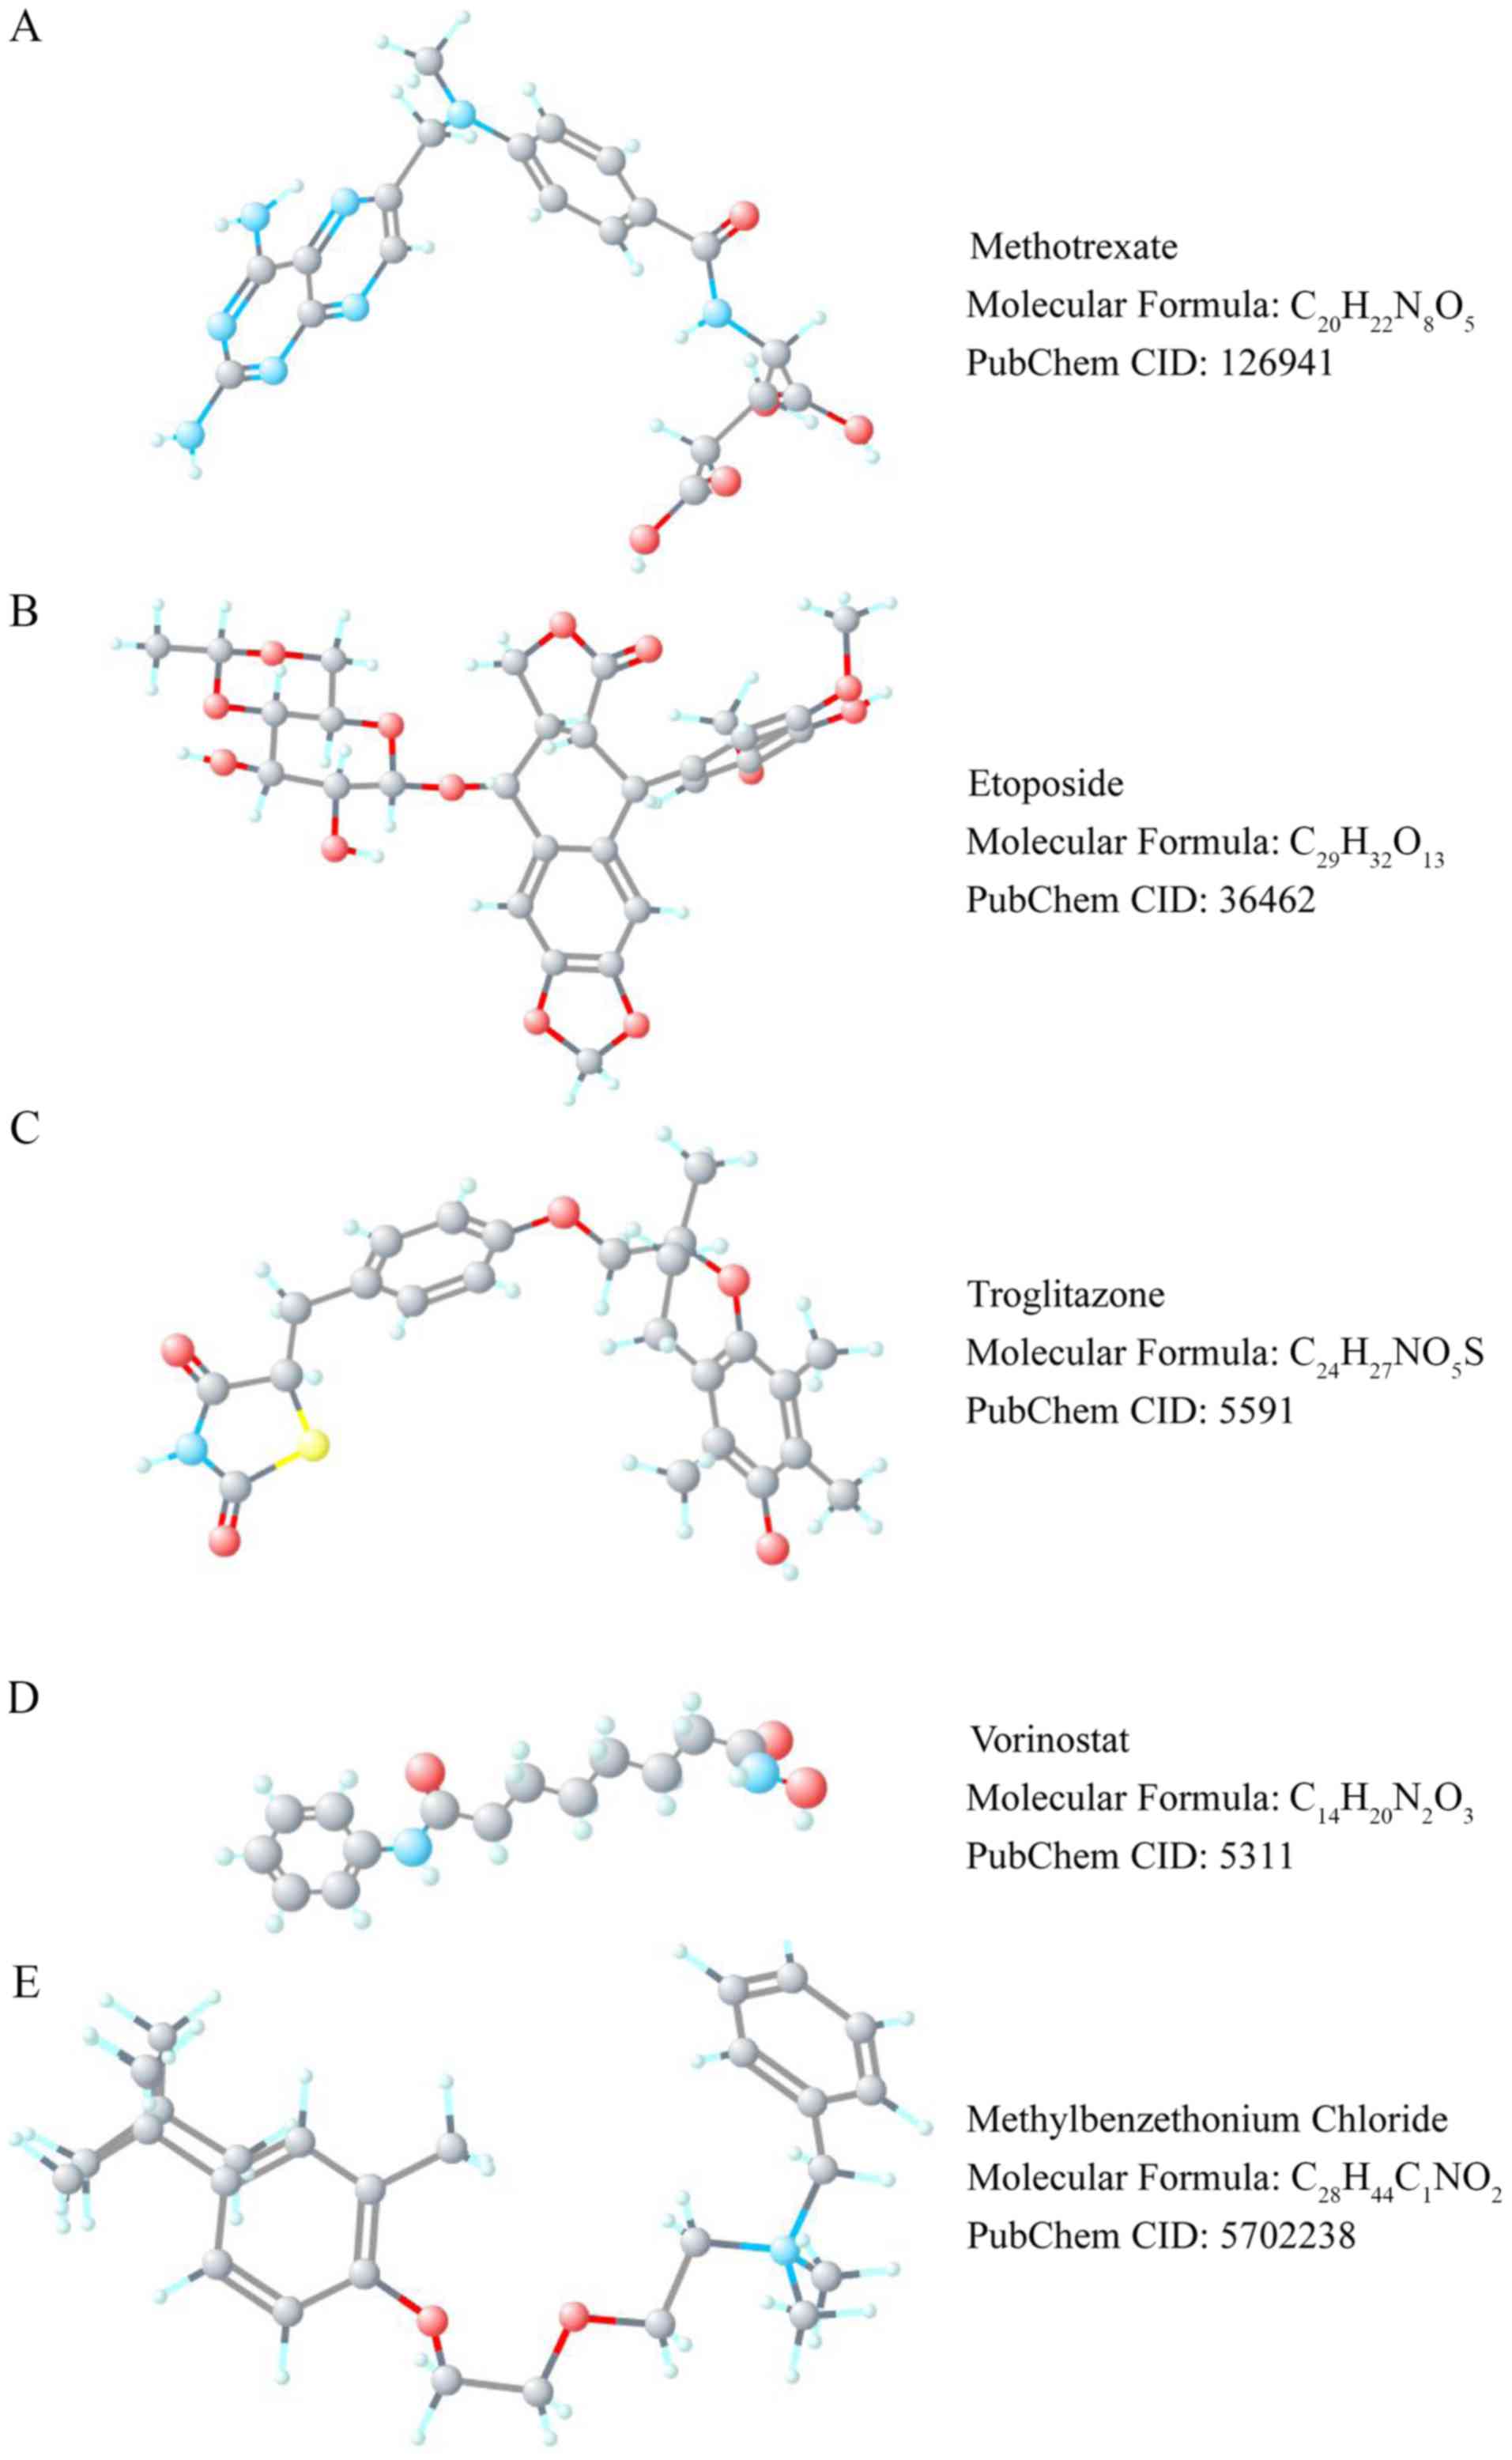
CDC6). The seven CMap small-molecule drugs were troglitazone,
methylbenzethonium chloride, thiostrepton, alexidine, vorinostat,
methotrexate and etoposide (Fig.
6).
| Table IV.CMap negatively correlated compounds
matched by pathway. |
Table IV.
CMap negatively correlated compounds
matched by pathway.
| Drug name | Pathway name | Subpathway ID |
|---|
| Alexidine | p53 signaling
pathway | path:04115_2;
path:04115_1; path:04115_7 |
| Mefloquine | Toll-like receptor
signaling pathway | path:04620_17;
path:04620_18; path:04620_22; path:04620_9 |
| Mefloquine | Steroid hormone
biosynthesis | path:00140_3;
path:00140_19; path:00140_16; path:00140_8 |
| Astemizole | Toll-like receptor
signaling pathway | path:04620_12;
path:04620_9; path:04620_18; path:04620_17 |
| Thiostrepton | p53 signaling
pathway | path:04115_1 |
| Methotrexate | p53 signaling
pathway | path:04115_7;
path:04115_1; path:04115_4; path:04115_3; path:04115_2 |
| Sulconazole | Metabolism of
xenobiotics by cytochrome P450 | path:00980_3 |
| Resveratrol | Tryptophan
metabolism | path:00380_5 |
| Resveratrol | Toxoplasmosis | path:05145_18 |
| Thioguanosine | Steroid hormone
biosynthesis | path:00140_7;
path:00140_8 |
| MG-262 | Steroid hormone
biosynthesis | path:00140_1;
path:00140_9; path:00140_8; path:00140_6; path:00140_5 |
| Methylbenzethonium
chloride | p53 signaling
pathway | path:04115_1 |
| Monobenzone | MAPK signaling
pathway | path:04010_30 |
|
Trifluoperazine | Protein processing
in endoplasmic reticulum | path:04141_18:
path:04141_1 |
| 5224221 | Steroid hormone
biosynthesis | path:00140_18;
path:00140_27; path:00140_9; path:00140_8; path:00140_4 |
| Vitexin | Steroid hormone
biosynthesis | path:00140_19 |
| Disulfiram | Protein processing
in endoplasmic reticulum | path:04141_1 |
| Thioridazine | Pathways in
cancer | path:05200_29;
path:05200_18; path:05200_11 |
| Vorinostat | p53 signaling
pathway | path:04115_1;
path:04115_2; path:04115_4; path:04115_3 |
| Etoposide | p53 signaling
pathway | path:04115_7;
path:04115_1; path:04115_3 |
| Withaferin A | Steroid hormone
biosynthesis | path:00140_25;
path:00140_5; path:00140_10; path:00140_4 |
| Pyrvinium | Steroid hormone
biosynthesis | path:00140_6;
path:00140_16; path:00140_19; path:00140_17; path:00140_18;
path:00140_4 |
| Scriptaid | Steroid hormone
biosynthesis | path:00140_9;
path:00140_6; path:00140_17; path:00140_16; path:00140_5;
path:00140_1 |
| Trichostatin A | Steroid hormone
biosynthesis | path:00140_10;
path:00140_19; path:00140_6; path:00140_8; path:00140_9 |
| 0173570-0000 | Steroid hormone
biosynthesis | path:00140_16;
path:00140_4; path:00140_17; path:00140_3; path:00140_6;
path:00140_10; path:00140_18; path:00140_13; path:00140_7;
path:00140_8 |
| Troglitazone | Cell cycle | path:04110_17 |
|
Prochlorperazine | Protein processing
in endoplasmic reticulum | path:04141_1 |
| LY-294002 | Steroid hormone
biosynthesis | path:00140_6;
path:00140_27 |
| Tanespimycin | MAPK signaling
pathway | path:04010_15 |
| Monorden | Steroid hormone
biosynthesis | path:00140_3;
path:00140_7; path:00140_18 |
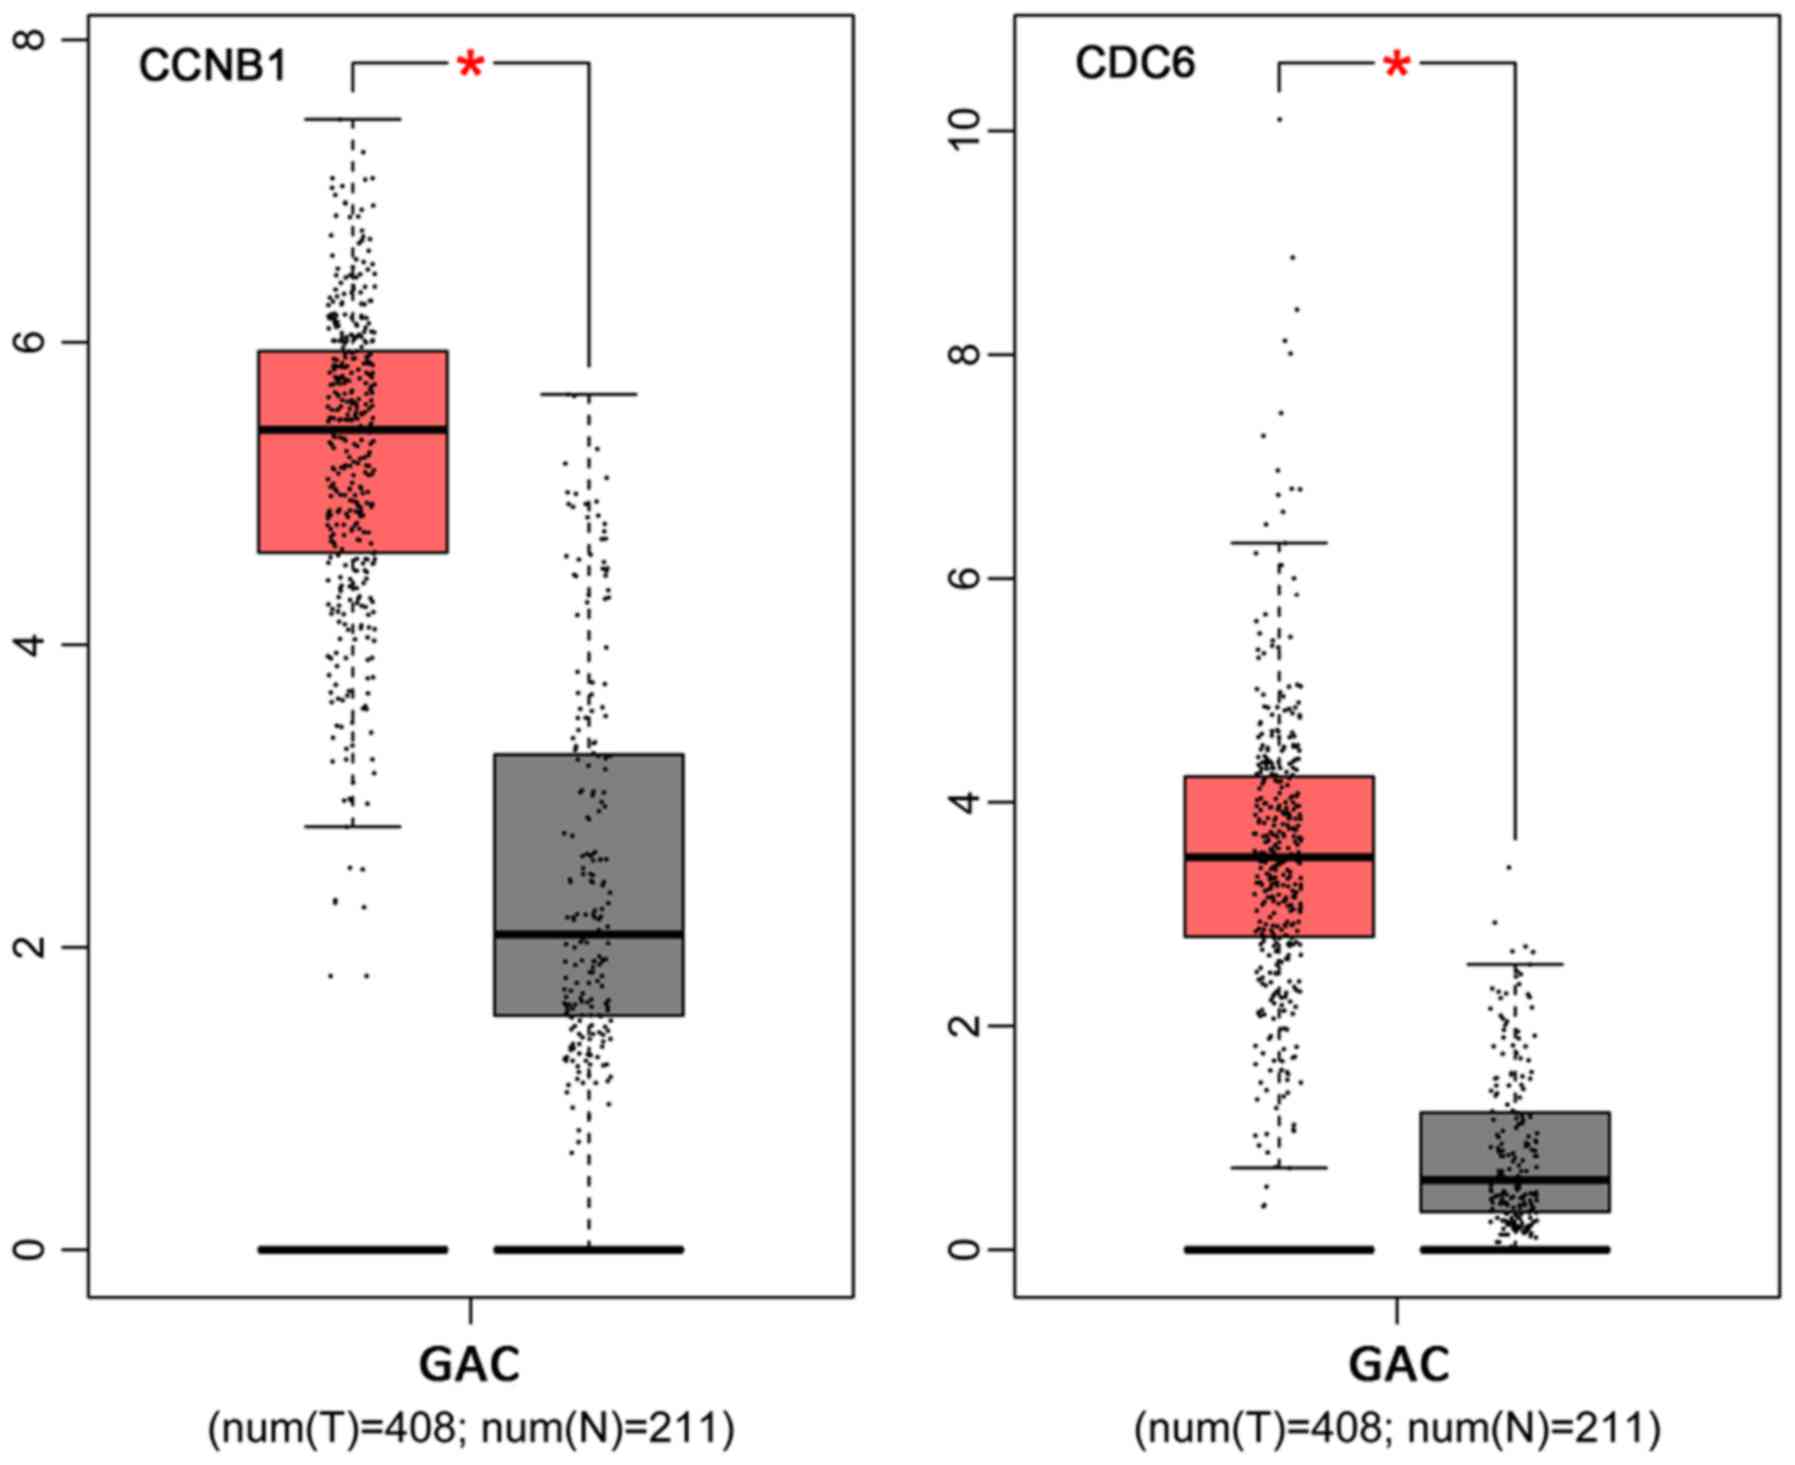
Expression levels of CCNB1 and CDC6
mRNA in GAC tissues
The expression levels of CCNB1 and
CDC6 mRNA in GACs were queried from GEPIA database
(http://gepia.cancer-pku.cn/). The
results showed that the two genes were both highly expressed in GAC
tissues compared to non-cancerous gastric tissues (Fig. 7).
Verification of predicting
small-molecule drugs of GAC with online literature retrieval
Using PubMed, we identified studies that
investigated the effect of relevant drugs on GAC. We found 268
articles related to the effect of methotrexate on GAC, 403 articles
related to etoposide, and 17 articles related to troglitazone,
which is a diabetes drug that may inhibit GAC. Nine studies
concerned vorinostat and three studies were related to
thiostrepton. Most importantly, methylbenzethonium chloride and
alexidine have never been addressed in the literature of GAC.
Discussion
In the present study, we identified DEGs of GAC and
found several pathways and hub genes that may play a critical role
in the pathogenesis and development of GAC. Also, through the
connectivity mapping approach, some known compounds were found to
share similar pathways of those generated from the DEGs of GAC,
including methotrexate, etoposide, troglitazone, thiostrepton,
vorinostat, methylbenzethonium chloride and alexidine. The findings
from the present study suggest that methylbenzethonium chloride and
alexidine could act as novel potential drugs for the treatment of
GAC and warrant further investigation, as they have never been
tested previously.
The CMap database reveals the connection between
disease, genes and drugs, using gene expression data and the
‘similarity’ concept with a small-molecular compound or the gene
expression spectrum of the drug as the core (19). CMap database provides a unique
method for drug development through comparison to filter candidate
compounds curing diseases, and it has been adopted by several
scholars (20,21). For instance, Xiao et al used
gene expression profile chip technology and the CMap database to
study molecular mechanisms of Hirschsprung disease (HD) and
potential drugs. They found differences in the neuronal
developmental disorders of HD genes and signaling pathways, and
discovered that some compounds may offset the damage of HD
development (22).
In this study, the DEGs between GAC and adjacent
tissues were compared with the expression profiles in CMap to
identify negatively correlative compounds that are potential
compounds for GAC. Among the candidate compounds determined in the
present study, two compounds (alexidine and methylbenzethonium) are
particularly important. Alexidine is an antimicrobial agent with
high affinity for bacteria, which can be used in the root canal
irrigation solution of oral treatment (23). Feng et al, using
high-throughput drug screening tests, identified that alexidine is
an antitumor drug that can inhibit cytokines and growth factors
necessary for multiple myeloma (24). Meanwhile, methylbenzethonium
chloride, a broad spectrum antibiotic, was found to be able to
specifically induce apoptosis in undifferentiated embryonic stem
cells of mice (25). The effect
could be applied to prevent reoccurrence of the tumor after stem
cell transplantation therapy. Methylbenzethonium chloride may
become another novel anticancer agent (25).
The present study showed that alexidine had the
lowest connectivity score (−0.996), indicating a highly negative
correlation with the DEGs of GAC. The connectivity score of
methylbenzethonium chloride also suggests that it has the capacity
to inhibit the growth of GAC. In addition, this study predicted
that both alexidine and methylbenzethonium chloride can play a
vital role in inhibiting GAC by regulating the p53 signaling
pathway. Previous studies have shown that the p53 signaling pathway
regulates various cellular functions, including apoptosis,
induction of aging, and inhibition of cell growth, migration and
invasion (26–28). However, the specific molecular
mechanisms of alexidine and methylbenzethonium chloride for
antitumor activity need to be further explored.
Five other compounds achieved in the present study
have been mentioned in other studies. Troglitazone hinders BGC-823
GAC cell proliferation and promotes its apoptosis by inducing
expression of the non-steroidal anti-inflammatory drug-activated
gene (NAG) (29). In addition,
thiostrepton was found to reverse drug resistance in GAC by
inhibiting the forkhead box transcription factor 1 (FOXM1)
(30). Vorinostat (31), methotrexate (32) and etoposide (33) are proven to inhibit the
proliferation of GAC cells. This evidence indicates that the
predictive method in this study is convincing and worth being used
for drug exploration.
In this study, we used bioinformatic methods to
screen differentially expressing potential genetic biomarkers based
on RNA-seq data. The results of pathway enrichment analysis
indicated 13 pathways which were evidently enriched with DEGs,
including the cell cycle, protein digestion and absorption,
Staphylococcus aureus infection and the p53 signaling
pathway. In addition, these DEGs were analyzed with CMap and
subpathways, and two (cell cycle and p53 signaling pathway) were
found to be closely related to the treatment potential and
occurrence of GAC. CCNB1 and CDC6 in these pathways
were also hub genes in the PPI network.
The clinical role of these hub genes was analyzed
also based on publicly available RNA-seq data, and it was found
that CCNB1 was upregulated in patients with GAC. CCNB1 is a member
of the cell cycle protein B family; it is a regulatory protein
involved in mitosis, mostly expressed in the G2/M period, and plays
a significant role in the S-to-G2/M phases (34). Therefore, overexpression of CCNB1
in GAC leads to chaos in the cell cycle, mitosis promotion and cell
proliferation. Previous research has shown that silencing of CDKN3
stimulates cell cycle arrest by reducing the expression of CDK2,
CDC25, CCNB1 and CCNB2 in human GAC cells, thus, inhibits the
proliferation of tumor cells (35). It was found in vivo that
dipalmitoyl phosphatidic acid could dramatically inhibit the growth
of tumors in a mouse subcutaneous tumor model, and suppress cell
proliferation and angiogenesis in triple-negative breast cancer.
The suppressing effect was mediated partly due to reduction in the
expression of CCNB1 (36).
Therefore, CCNB1 may be an important target gene in the treatment
of GAC, and the present study predicted that compounds aimed at
this target gene may be reasonable and effective in treating GAC.
Recent studies have shown that knockdown of CDC6 expression levels
can interfere with the cell cycle and inhibit the proliferation of
prostate and ovarian cancer cells (37,38).
This evidence suggests that CDC6 may also be a potential biomarker
for GAC therapy.
The present study comprehensively analyzed the
possible mechanism of treating GAC by data mining in the public
gene chip databases and bioinformatic analyses. We discovered cell
cycle and p53 signaling pathways and key gene targets CCNB1 and
CDC6 as potential targets of GAC treatment. We further predicted
that seven known compounds may be effective in curing GAC,
including methylbenzethonium chloride and alexidine, which have
never been previously reported to treat GAC. However, several
limitations should be admitted. Firstly, the current findings were
based on in silico methods and validations are certainly
needed. Secondly, CMap did not cover GAC cell lines and only
provided general DEGs post treatment of existing drugs. The
overlapping pathways of DEGs from TCGA and pathways from Cmap also
need to be confirmed. Thirdly, the precise mechanism of the drugs
we recommended remains to be investigated. Hence, further clinical,
in vitro and in vivo experiments are needed to verify
the definite effects and molecular mechanism of the potential drugs
on GAC.
Acknowledgements
Not applicable.
Funding
The present study was supported by a fund from the
Promoting Project of Basic Capacity for Young and Middle-Aged
University Teachers in Guangxi, China (KY2016YB077).
Availability of data and materials
The datasets used during the present study are
available from the corresponding author upon reasonable
request.
Authors' contributions
ZXC, XPZ, HQY, RZ and JSP analyzed and interpreted
the data and wrote the draft of the manuscript. XGQ, RQH, JM, ZBF,
GC and TQG conceived and designed the study, supervised the data
mining, corrected and revised the draft. All authors read and
approved the manuscript and agree to be accountable for all aspects
of the research in ensuring that the accuracy or integrity of any
part of the work are appropriately investigated and resolved.
Ethics approval and consent to
participate
Not applicable.
Patient consent for publication
Not applicable.
Competing interests
The authors declare that they have no competing
interests.
Glossary
Abbreviations
Abbreviations:
|
GAC
|
gastric adenocarcinoma
|
|
CMap
|
connectivity map
|
|
TCGA
|
The Cancer Genome Atlas
|
|
DEGs
|
differentially expressed genes
|
|
KEGG
|
Kyoto Encyclopedia of Genes and
Genomes
|
|
FC
|
fold change
|
|
GO
|
Gene Ontology
|
|
PPI
|
protein-protein interaction
|
|
HD
|
Hirschsprung disease
|
|
NAG
|
non-steroidal anti-inflammatory
drug-activated gene
|
|
FOXM1
|
forkhead box transcription factor
1
|
References
|
1
|
Wippel HH, Santos MDM, Clasen MA, Kurt LU,
Nogueira FCS, Carvalho CE, McCormick TM, Neto GPB, Alves LR, da
Gloria da Costa Carvalho M, et al: Comparing intestinal versus
diffuse gastric cancer using a PEFF-oriented proteomic pipeline. J
Proteomics. 171:63–72. 2018. View Article : Google Scholar : PubMed/NCBI
|
|
2
|
Li W, Song D, Li H, Liang L, Zhao N and
Liu T: Reduction in peripheral CD19+CD24hCD27+ B cell frequency
predicts favourable clinical course in XELOX-treated patients with
advanced gastric cancer. Cell Physiol Biochem. 41:2045–2052. 2017.
View Article : Google Scholar : PubMed/NCBI
|
|
3
|
Chen W, Zheng R, Baade PD, Zhang S, Zeng
H, Bray F, Jemal A, Yu XQ and He J: Cancer statistics in China,
2015. CA Cancer J Clin. 66:115–132. 2016. View Article : Google Scholar : PubMed/NCBI
|
|
4
|
Costa NR, Gil da Costa RM and Medeiros R:
A viral map of gastrointestinal cancers. Life Sci. 199:188–200.
2018. View Article : Google Scholar : PubMed/NCBI
|
|
5
|
Coburn N, Cosby R, Klein L, Knight G,
Malthaner R, Mamazza J, Mercer CD and Ringash J: Staging and
surgical approaches in gastric cancer: A systematic review. Cancer
Treat Rev. 63:104–115. 2018. View Article : Google Scholar : PubMed/NCBI
|
|
6
|
Chen W, Zhou H, Ye L and Zhan B:
Overexpression of SULT2B1b promotes angiogenesis in human gastric
cancer. Cell Physiol Biochem. 38:1040–1054. 2016. View Article : Google Scholar : PubMed/NCBI
|
|
7
|
Van Cutsem E, Sagaert X, Topal B,
Haustermans K and Prenen H: Gastric cancer. Lancet. 388:2654–2664.
2016. View Article : Google Scholar : PubMed/NCBI
|
|
8
|
Zheng H, Hong H, Zhang L, Cai X, Hu M, Cai
Y, Zhou B, Lin J, Zhao C and Hu W: Nifuratel, a novel STAT3
inhibitor with potent activity against human gastric cancer cells.
Cancer Manag Res. 9:565–572. 2017. View Article : Google Scholar : PubMed/NCBI
|
|
9
|
Pavlakis N, Sjoquist KM, Martin AJ,
Tsobanis E, Yip S, Kang YK, Bang YJ, Alcindor T, O'Callaghan CJ,
Burnell MJ, et al: Regorafenib for the treatment of advanced
gastric cancer (INTEGRATE): A multinational placebo-controlled
phase II trial. J Clin Oncol. 34:2728–2735. 2016. View Article : Google Scholar : PubMed/NCBI
|
|
10
|
Belizário JE, Sangiuliano BA, Perez-Sosa
M, Neyra JM and Moreira DF: Using pharmacogenomic databases for
discovering patient-target genes and small molecule candidates to
cancer therapy. Front Pharmacol. 7:3122016. View Article : Google Scholar : PubMed/NCBI
|
|
11
|
Liang L, Zeng JH, Wang JY, He RQ, Ma J,
Chen G, Cai XY and Hu XH: Down-regulation of miR-26a-5p in
hepatocellular carcinoma: A qRT-PCR and bioinformatics study.
Pathol Res Pract. 213:1494–1509. 2017. View Article : Google Scholar : PubMed/NCBI
|
|
12
|
Xiong DD, Lv J, Wei KL, Feng ZB, Chen JT,
Liu KC, Chen G and Luo DZ: A nine-miRNA signature as a potential
diagnostic marker for breast carcinoma: An integrated study of
1,110 cases. Oncol Rep. 37:3297–3304. 2017. View Article : Google Scholar : PubMed/NCBI
|
|
13
|
Zhang Y, Huang JC, Cai KT, Yu XB, Chen YR,
Pan WY, He ZL, Lv J, Feng ZB and Chen G: Long non-coding RNA HOTTIP
promotes hepatocellular carcinoma tumorigenesis and development: A
comprehensive investigation based on bioinformatics, qRT-PCR and
meta-analysis of 393 cases. Int J Oncol. 51:1705–1721. 2017.
View Article : Google Scholar : PubMed/NCBI
|
|
14
|
Zhang Y, Dang YW, Wang X, Yang X, Zhang R,
Lv ZL and Chen G: Comprehensive analysis of long non-coding RNA
PVT1 gene interaction regulatory network in hepatocellular
carcinoma using gene microarray and bioinformatics. Am J Transl
Res. 9:3904–3917. 2017.PubMed/NCBI
|
|
15
|
He RQ, Li XJ, Liang L, Xie Y, Luo DZ, Ma
J, Peng ZG, Hu XH and Chen G: The suppressive role of miR-542-5p in
NSCLC: The evidence from clinical data and in vivo
validation using a chick chorioallantoic membrane model. BMC
Cancer. 17:6552017. View Article : Google Scholar : PubMed/NCBI
|
|
16
|
Gao L, Li SH, Tian YX, Zhu QQ, Chen G,
Pang YY and Hu XH: Role of downregulated miR-133a-3p expression in
bladder cancer: A bioinformatics study. Onco Targets Ther.
10:3667–3683. 2017. View Article : Google Scholar : PubMed/NCBI
|
|
17
|
Dang YW, Lin P, Liu LM, He RQ, Zhang LJ,
Peng ZG, Li XJ and Chen G: In silico analysis of the potential
mechanism of telocinobufagin on breast cancer MCF-7 cells. Pathol
Res Pract. 214:631–643. 2018. View Article : Google Scholar : PubMed/NCBI
|
|
18
|
Wang J, Li M, Wang Y and Liu X:
Integrating subpathway analysis to identify candidate agents for
hepatocellular carcinoma. Onco Targets Ther. 9:1221–1230. 2016.
View Article : Google Scholar : PubMed/NCBI
|
|
19
|
Musa A, Ghoraie LS, Zhang SD, Glazko G,
Yli-Harja O, Dehmer M, Haibe-Kains B and Emmert-Streib F: A review
of connectivity map and computational approaches in
pharmacogenomics. Brief Bioinform. 19:506–523. 2018.PubMed/NCBI
|
|
20
|
Brum AM, van de Peppel J, Nguyen L, Aliev
A, Schreuders-Koedam M, Gajadien T, van der Leije CS, van Kerkwijk
A, Eijken M, van Leeuwen JPTM and van der Eerden BCJ: Using the
connectivity map to discover compounds influencing human osteoblast
differentiation. J Cell Physiol. 233:4895–4906. 2018. View Article : Google Scholar : PubMed/NCBI
|
|
21
|
Busby J, Murray L, Mills K, Zhang SD,
Liberante F and Cardwell CR: A combined connectivity mapping and
pharmacoepidemiology approach to identify existing medications with
breast cancer causing or preventing properties. Pharmacoepidemiol
Drug Saf. 27:78–86. 2018. View
Article : Google Scholar : PubMed/NCBI
|
|
22
|
Xiao SJ, Zhu XC, Deng H, Zhou WP, Yang WY,
Yuan LK, Zhang JY, Tian S, Xu L, Zhang L and Xia HM: Gene
expression profiling coupled with connectivity map database mining
reveals potential therapeutic drugs for Hirschsprung disease. J
Pediatr Surg. 53:1716–1721. 2018. View Article : Google Scholar : PubMed/NCBI
|
|
23
|
Varadan P, Ganesh A, Konindala R,
Nagendrababu V, Ashok R and Deivanayagam K: Comparison of the
antibacterial efficacy of alexidine and chlorhexidine against
enterococcus faecalis: An in vitro study. Cureus.
9:e18052017.PubMed/NCBI
|
|
24
|
Feng R, Rios JA, Onishi T, Lokshin A,
Gorelik E and Lentzsch S: Cell-based and cytokine-directed chemical
screen to identify potential anti-multiple myeloma agents. Leuk
Res. 34:917–924. 2010. View Article : Google Scholar : PubMed/NCBI
|
|
25
|
Conesa C, Doss MX, Antzelevitch C,
Sachinidis A, Sancho J and Carrodeguas JA: Identification of
specific pluripotent stem cell death-inducing small molecules by
chemical screening. Stem Cell Rev. 8:116–127. 2012. View Article : Google Scholar : PubMed/NCBI
|
|
26
|
Huang H, Han Y, Yang X, Li M, Zhu R, Hu J,
Zhang X, Wei R, Li K and Gao R: HNRNPK inhibits gastric cancer cell
proliferation through p53/p21/CCND1 pathway. Oncotarget.
8:103364–103374. 2017. View Article : Google Scholar : PubMed/NCBI
|
|
27
|
Fu H, Wang C, Yang D, Wei Z, Xu J, Hu Z,
Zhang Y, Wang W, Yan R and Cai Q: Curcumin regulates proliferation,
autophagy, and apoptosis in gastric cancer cells by affecting PI3K
and P53 signaling. J Cell Physiol. 233:4634–4642. 2018. View Article : Google Scholar : PubMed/NCBI
|
|
28
|
Sun M, Si G, Sun HS and Si FC: Inhibition
of CREPT restrains gastric cancer growth by regulation of cycle
arrest, migration and apoptosis via ROS-regulated p53 pathway.
Biochem Biophys Res Commun. 496:1183–1190. 2018. View Article : Google Scholar : PubMed/NCBI
|
|
29
|
Wang C, Wang J and Bai P: Troglitazone
induces apoptosis in gastric cancer cells through the NAG-1
pathway. Mol Med Rep. 4:93–97. 2011.PubMed/NCBI
|
|
30
|
Li X, Qiu W, Liu B, Yao R, Liu S, Yao Y
and Liang J: Forkhead box transcription factor 1 expression in
gastric cancer: FOXM1 is a poor prognostic factor and mediates
resistance to docetaxel. J Transl Med. 11:2042013. View Article : Google Scholar : PubMed/NCBI
|
|
31
|
Yoo C, Ryu MH, Na YS, Ryoo BY, Lee CW,
Maeng J, Kim SY, Koo DH, Park I and Kang YK: Phase I and
pharmacodynamic study of vorinostat combined with capecitabine and
cisplatin as first-line chemotherapy in advanced gastric cancer.
Invest New Drugs. 32:271–278. 2014. View Article : Google Scholar : PubMed/NCBI
|
|
32
|
Ebrahimifar M, Hasanzadegan Roudsari M,
Kazemi SM, Ebrahimi Shahmabadi H, Kanaani L, Alavi SA and Izadi
Vasfi M: Enhancing effects of curcumin on cytotoxicity of
paclitaxel, methotrexate and vincristine in gastric cancer cells.
Asian Pac J Cancer Prev. 18:65–68. 2017.PubMed/NCBI
|
|
33
|
Duo-Ji MM, Ci-Ren BS, Long ZW, Zhang XH
and Luo DL: Short-term efficacy of different chemotherapy regimens
in the treatment of advanced gastric cancer: A network
meta-analysis. Oncotarget. 8:37896–37911. 2017. View Article : Google Scholar : PubMed/NCBI
|
|
34
|
Shi Q, Wang W, Jia Z, Chen P, Ma K and
Zhou C: ISL1, a novel regulator of CCNB1, CCNB2 and c-MYC genes,
promotes gastric cancer cell proliferation and tumor growth.
Oncotarget. 7:36489–36500. 2016. View Article : Google Scholar : PubMed/NCBI
|
|
35
|
Li Y, Ji S, Fu LY, Jiang T, Wu D and Meng
FD: Knockdown of cyclin-dependent kinase inhibitor 3 inhibits
proliferation and invasion in human gastric cancer cells. Oncol
Res. 25:721–731. 2017. View Article : Google Scholar : PubMed/NCBI
|
|
36
|
Zhang QQ, Chen J, Zhou DL, Duan YF, Qi CL,
Li JC, He XD, Zhang M, Yang YX and Wang L: Dipalmitoylphosphatidic
acid inhibits tumor growth in triple-negative breast cancer. Int J
Biol Sci. 13:471–479. 2017. View Article : Google Scholar : PubMed/NCBI
|
|
37
|
Karanika S, Karantanos T, Li L, Wang J,
Park S, Yang G, Zuo X, Song JH, Maity SN, Manyam GC, et al:
Targeting DNA damage response in prostate cancer by inhibiting
androgen receptor-CDC6-ATR-Chk1 signaling. Cell Rep. 18:1970–1981.
2017. View Article : Google Scholar : PubMed/NCBI
|
|
38
|
Deng Y, Jiang L, Wang Y, Xi Q, Zhong J,
Liu J, Yang S, Liu R, Wang J, Huang M, et al: High expression of
CDC6 is associated with accelerated cell proliferation and poor
prognosis of epithelial ovarian cancer. Pathol Res Pract.
212:239–246. 2016. View Article : Google Scholar : PubMed/NCBI
|