Introduction
Osteosarcoma is one of the most common types of
primary malignant bone cancer and is characterized by tumor cells
directly forming osteoid tissue or immature bone (1–3).
Epidemiological study has indicated a bimodal age distribution for
osteosarcoma, with pubescent adolescents undergoing a rapid growth
period at the greatest risk (4).
While effective methods, including primary tumor excision, adjuvant
radiotherapy and chemotherapy, have been widely adopted to improve
osteosarcoma survival, the prognosis remains poor (5). The 5-year survival rate is >20% in
high-risk patients treated with surgery alone (6), with an increase to a 30–40% survival
rate when surgery is combined with adjuvant therapies, radiation or
chemotherapy (7). Therefore, the
identification of an effective prognostic factor able to optimize
treatment and supply a novel therapeutic target to improve the
clinical outcome for patients with osteosarcoma is required.
Long non-coding RNAs (lncRNAs) are >200
nucleotides and lack an open reading frame, and therefore are
unable to be translated into a protein (8). With the expansion of gene research,
lncRNAs have been identified to serve critical roles in a variety
of cellular processes, including gene and protein regulation,
transcription and post-transcription (9–11).
The roles of lncRNAs in tumor-associated processes have also been
widely examined, with certain lncRNAs having been demonstrated to
be associated with histological grade in several tumor types
(9). Furthermore, increasing
evidence has suggested that lncRNAs may serve as useful prognostic
biomarkers for certain tumors, including non-small cell lung cancer
(12), metastatic breast cancer
(13) and hepatocellular
carcinomas (14). Previous studies
have focused on the roles of lncRNAs in osteosarcoma prognosis: A
specific lncRNA, taurine upregulated gene 1, was suggested to
contribute to human osteosarcoma tumorigenesis by regulating POU
domain class 2 transcription factor 1 expression (15). In addition, overexpression of the
lncRNA BRAF-activated noncoding RNA was observed in osteosarcomas,
with an increased expression associated with advanced clinical
stage, distant metastasis and large tumor size (16). However, a reliable and effective
risk assessment model for osteosarcoma prognosis is required.
In the present study, human osteosarcoma expression
profiles were downloaded to screen prognosis-associated lncRNAs.
Next, a risk assessment system was constructed based on the
expressions of prognosis-associated lncRNAs, with the associated
regression coefficients used as the weight. Survival analysis for
the risk assessment model was conducted using a training set and
validation set. Concomitantly, the risk value of each sample was
calculated based on the risk score equation. Independent
osteosarcoma prognostic factors and correlations between risk score
and clinical features were also examined. Additionally,
differentially expressed genes associated with the lncRNAs in the
risk assessment model were identified, and functional enrichment
was performed. The present study aimed to identify a novel risk
assessment model for osteosarcoma prognosis, and thereby aid in
patient drug selections and adjustments.
Materials and methods
Data and grouping
Human osteosarcoma-associated expression profiles
were downloaded from the NCBI Gene Expression Omnibus (GEO,
http://www.ncbi.nlm.nih.gov/geo/) and
EBI ArrayExpress (https://www.ebi.ac.uk/arrayexpress/) databases. The
expression data were included when meet the following criteria: i)
The osteosarcoma sample data must contain clinical information and
a survival prognosis; and ii) the annotation platform must contain
lncRNA annotation information or provide complete sequence
detection of the probe reporter. Ultimately, two data sets,
GSE21257 (n=53) and GSE39055 (n=37), were identified and obtained
using the GPL10295 human-6 v2.0 (using nuIDs as identifier;
Illumina, Inc., San Diego, CA, USA) and GPL14951 HumanHT-12 WG-DASL
v4.0 R2 expression beadchips (Illumina, Inc.), respectively. The
GSE21257 set was selected as the training set, and the GSE39055 was
set as the validation set. The clinical data for these two data
sets are summarized in Table I.
The lncRNAs in these two data sets were analyzed using Basic Local
Alignment Search Tool and a human genome reference sequence (UCSC
hg19; http://hgdownload.soe.ucsc.edu/downloads.html).
 | Table I.Clinical information for training and
validation sets. |
Table I.
Clinical information for training and
validation sets.
| Variable | GSE21257
(n=53) | GSE39055
(n=37) | P-value |
|---|
| Age (mean ±
SD) | 18.71±12.19 | 13.47±11.34 | 0.0402a |
| Sex
(male/female) | 34/19 | 20/17 | 0.4572b |
| Metastases
(yes/no) | 34/19 | – | – |
| Death
(dead/alive) | 23/30 | 10/27 | 0.1728b |
| Overall survival
time (mean ± SD) | 68.55±59.34 | 52.92±50.14 | 0.1813a |
Screening for significantly
differentially expressed lncRNAs
The 53 training set samples (GSE21257) were divided
into a bad prognosis group (survival time <36 months; n=17) or
good prognosis group (alive, survival time ≥60 months; n=21). The
expression levels of lncRNAs between these two groups were then
compared to identify significantly differentially expressed lncRNAs
by using a Student's t-test or Wilcoxon rank test in R v3.1.0 with
the thresholds of false discovery rate (FDR) <0.05 and
log2 fold change (FC) >0.263. LncRNAs revealed to be
significantly differentially expressed using these two cut-offs
were selected for two-way hierarchical clustering and subsequent
analysis.
Screening for prognosis-associated
lncRNAs
To screen prognosis-associated lncRNAs,
significantly differentially expressed lncRNAs selected from the
training set (53 osteosarcoma samples) were examined via Cox
regression analysis (univariate and multivariate) in R v3.1.0
(https://www.r-project.org/) as described
previously (17). P<0.05
obtained by log-rank test was set as the cut-off criterion.
Establishing a risk assessment
model
To establish a risk assessment system, the obtained
prognosis-associated lncRNAs were evaluated using a multivariate
Cox regression with the regression coefficients (β) used as the
weight. The risk value for each sample was obtained using the
following equation: Risk score=βlncRNA1
xexprlncRNA1+βlncRNA2xexprlncRNA2+···+βlncRNAnxexprlncRNAn.
The survival risk of cancer in the validation set was assessed
using the β-value acquired from the training set.
Evaluating the risk assessment
model
The samples in the validation set were divided into
high risk and low risk groups according to the median risk scores
calculated in the risk assessment model. The median value was
included in the low risk group. Kaplan-Meier survival curve
analysis was used to estimate the overall survival (OS) rates for
patients in the high risk and low risk groups, followed by a
log-rank test (18), which was
used to assess the survival differences between the high-risk and
the low-risk groups. P<0.05 was considered to indicate a
statistically significant difference. Furthermore, a ROC curve was
used to evaluate the classification efficiency of the obtained risk
assessment model. The expression distributions of the selected
lncRNAs were also analyzed in the training and validation sets.
Correlation between the risk
assessment model and clinical features
Associations between prognosis and clinical
features, which include risk score, age, sex, grade and tumor
metastasis, were evaluated using univariate and multivariate Cox
regression analyses. Furthermore, hierarchical analysis was also
performed using clinical features that were significantly
associated with the risk score. Associations between the different
risk groups and the survival prognosis were analyzed under the same
clinical condition.
Identifying prognosis-associated genes
and functional enrichment analysis
The genes regulated by the significantly
differentially expressed lncRNA were obtained using MEM software
(http://biit.cs.ut.ee/mem/) (19,20).
Subsequently, the differentially expressed genes between high-risk
group and low-risk group in the training set were identified with
the thresholds of |log FC|>0.5 and FDR<0.05 using Limma
(21,22). These differentially expressed were
considered prognosis-associated genes.
In order to identify the biological processes and
signaling pathways that involved these prognosis-associated genes,
the Database for Annotation, Visualization and Integrated Discovery
(https://david.ncifcrf.gov/) was used to
perform Gene Ontology (http://geneontology.org/) analysis, and the Kyoto
Encyclopedia of Genes and Genomes (KEGG; http://www.genome.jp/kegg/) database was utilized for
enrichment analysis with the cut-off of P<0.05.
Results
Screened differentially expressed
lncRNAs
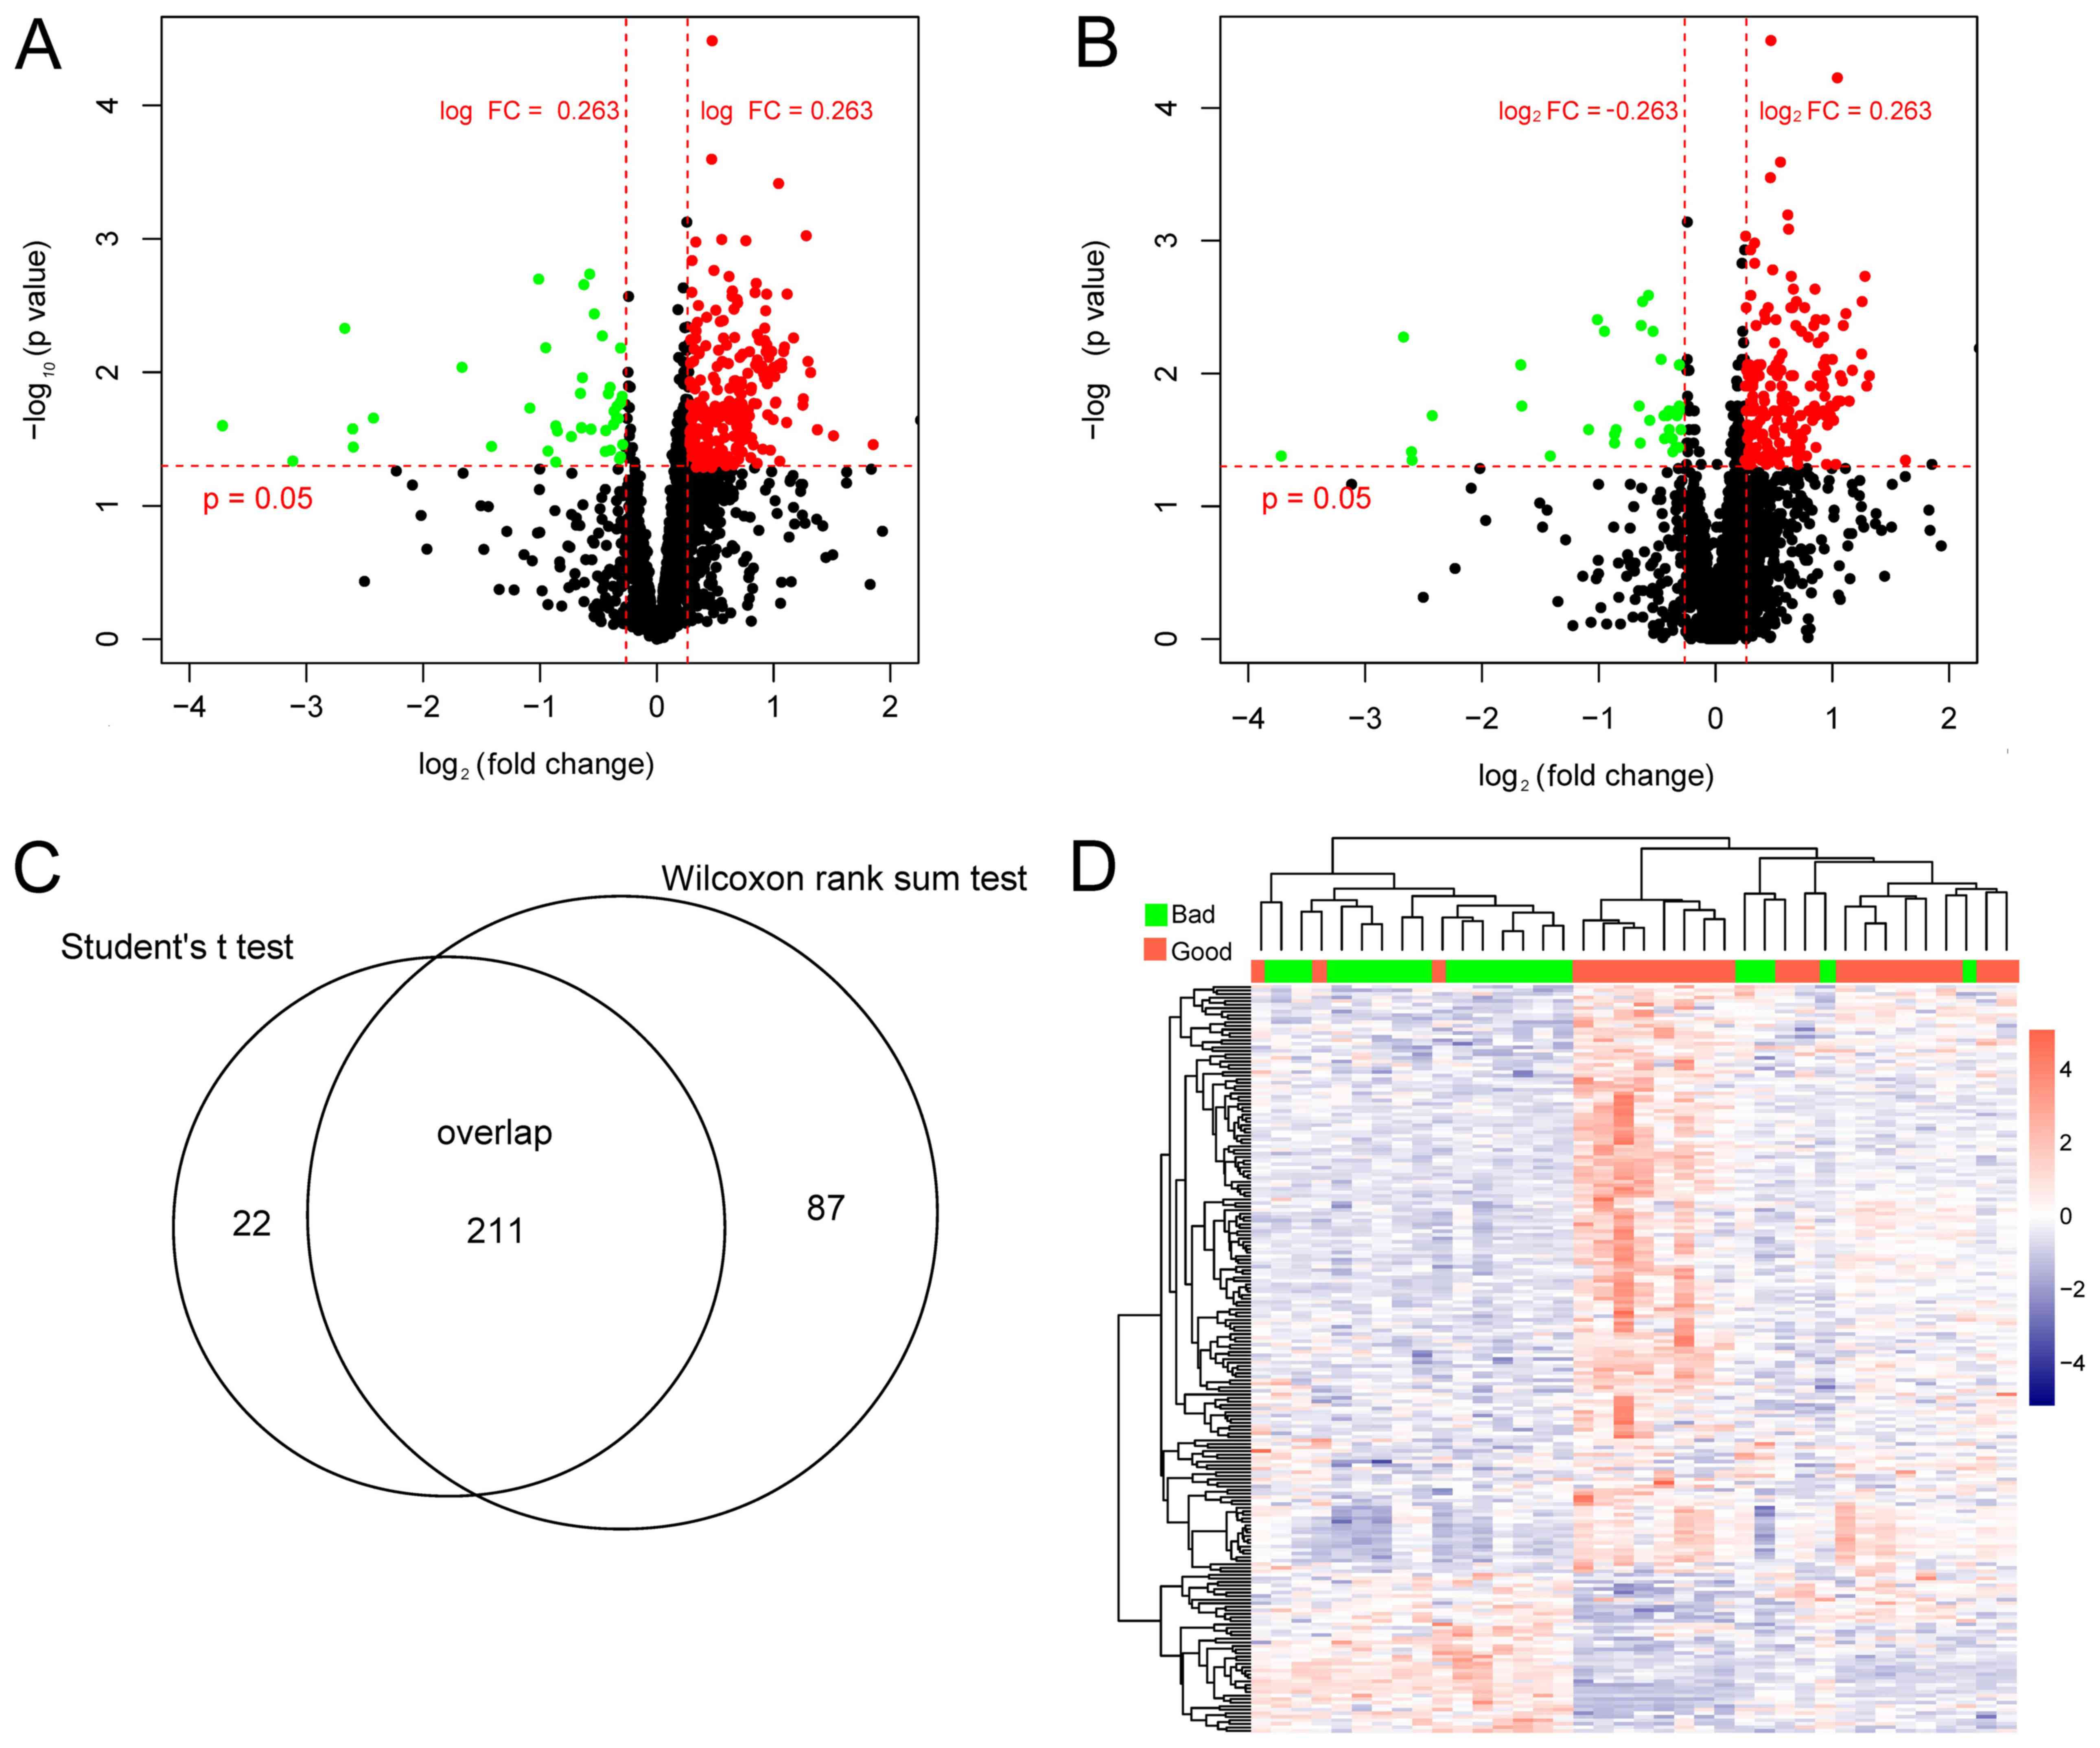
A total of 233 differentially expressed lncRNAs were
identified using the Student's t-test (Fig. 1A) and 298 were identified using the
Wilcoxon rank test (Fig. 1B). The
211 overlapping lncRNAs identified by Student's t-test and Wilcoxon
rank test were selected for subsequent analysis (Fig. 1C). The two-way hierarchical
clustering based on these 211 lncRNAs indicated significant
differences between the bad and good prognosis groups (Fig. 1D).
Construction of the lncRNA risk
assessment model
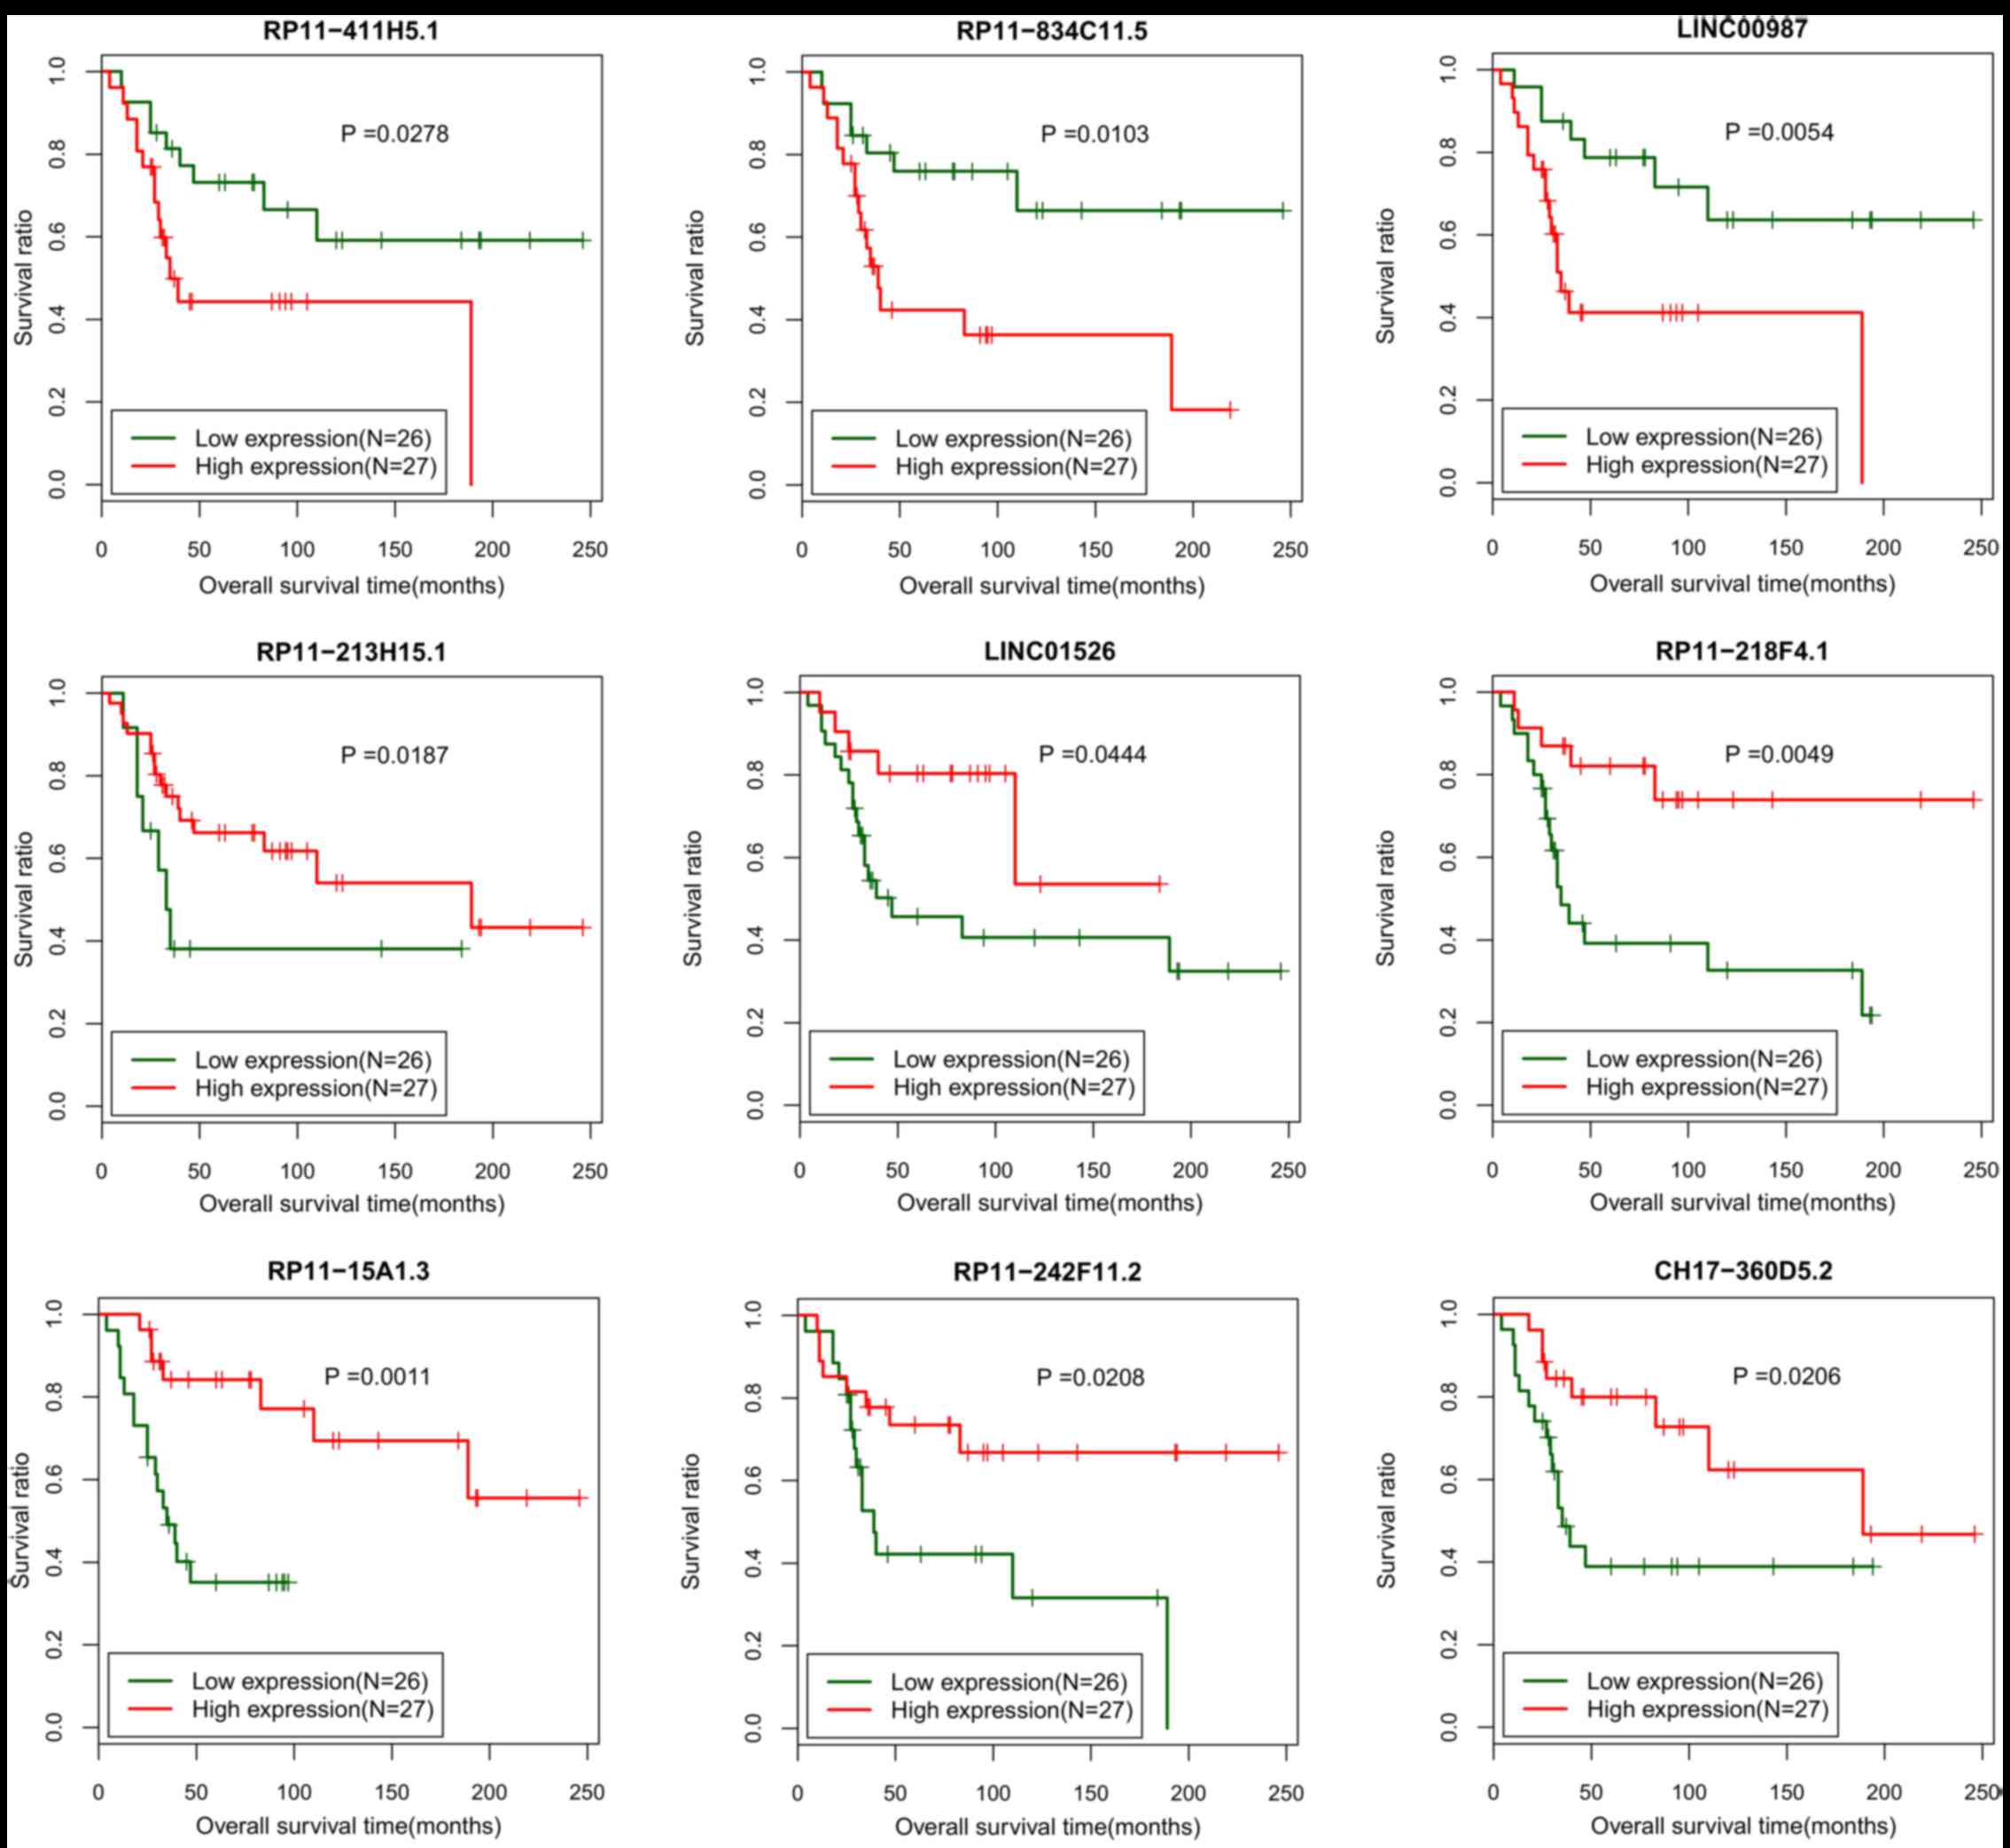
In the training set, 84 out of the 211
differentially expressed lncRNAs were identified to be associated
with the survival prognosis (P<0.05). Next, 9 lncRNAs
(CH17-360D5.2, LINC00987, LINC01526, RP11-15A1.3, RP11-213H15.1,
RP11-218F4.1, RP11-242F11.2, RP11-411H5.1 and RP11-834C11.5) from
the 84 prognosis-associated lncRNAs were additionally screened via
a multiple Cox regression analysis (P<0.05; Table II). All samples in training set
were divided into low expression group (£ median value) and high
expression group (> median value) based on the expression levels
of these 9 individual lncRNAs, separately. The Kaplan-Meier
survival curve analysis revealed that the samples with low
expression of RP11-411H5.1, RP11-834C11.5 or LINC00987 had
significantly increased survival ratio (Fig. 2). Samples with increased expression
of LINC01526, RP11-15A1.3, RP11-213H15.1, RP11-218F4.1,
RP11-242F11.2 or CH17-360D5.2 exhibited markedly increased survival
ratios (Fig. 2).
| Table II.Information of 9 lncRNAs screened
from the 53 osteosarcoma samples in GSE21257 to build the risk
assessment model. |
Table II.
Information of 9 lncRNAs screened
from the 53 osteosarcoma samples in GSE21257 to build the risk
assessment model.
| Long non-coding
RNA | Coefficient | Hazard ratio | 95% confidence
interval | P-value |
|---|
| CH17-360D5.2 | −2.037 | 0.112 | 0.042–0.301 | 0.005 |
| LINC00987 | −0.068 | 0.111 | 0.067–0.186 | 0.037 |
| LINC01526 | −6.092 | 0.160 | 0.023–0.213 | 0.016 |
| RP11-15A1.3 | −3.673 | 0.107 | 0.092–0.125 | 0.024 |
| RP11-213H15.1 | −4.925 | 0.163 | 0.035–0.752 | 0.034 |
| RP11-218F4.1 | −0.160 | 0.607 | 0.301–0.802 | 0.028 |
| RP11-242F11.2 | −3.758 | 0.781 | 0.296–0.964 | 0.013 |
| RP11-411H5.1 | −0.009 | 0.243 | 0.219–0.629 | 0.028 |
| RP11-834C11.5 |
7.861 | 3.510 | 1.090–4.113 | 0.016 |
A risk assessment model was established based on
these 9 lncRNAs according to the following formula: Risk score=
(−2.0368)xExpCH17-360D5.2+(−0.0683)xExpLINC00987+(−6.0924)
xExpLINC01526+(−3.6727)xExpRP11-15A1.3+(−4.9249)xExpRP11-213H15.1
+(−0.1602)xExpRP11-218F4.1+(−3.7582)xExpRP11-242F11.2+(−0.0093)
xExpRP11-411H5.1+(7.8606)xExpRP11-834C11.5.
Verification of the lncRNA risk
assessment model
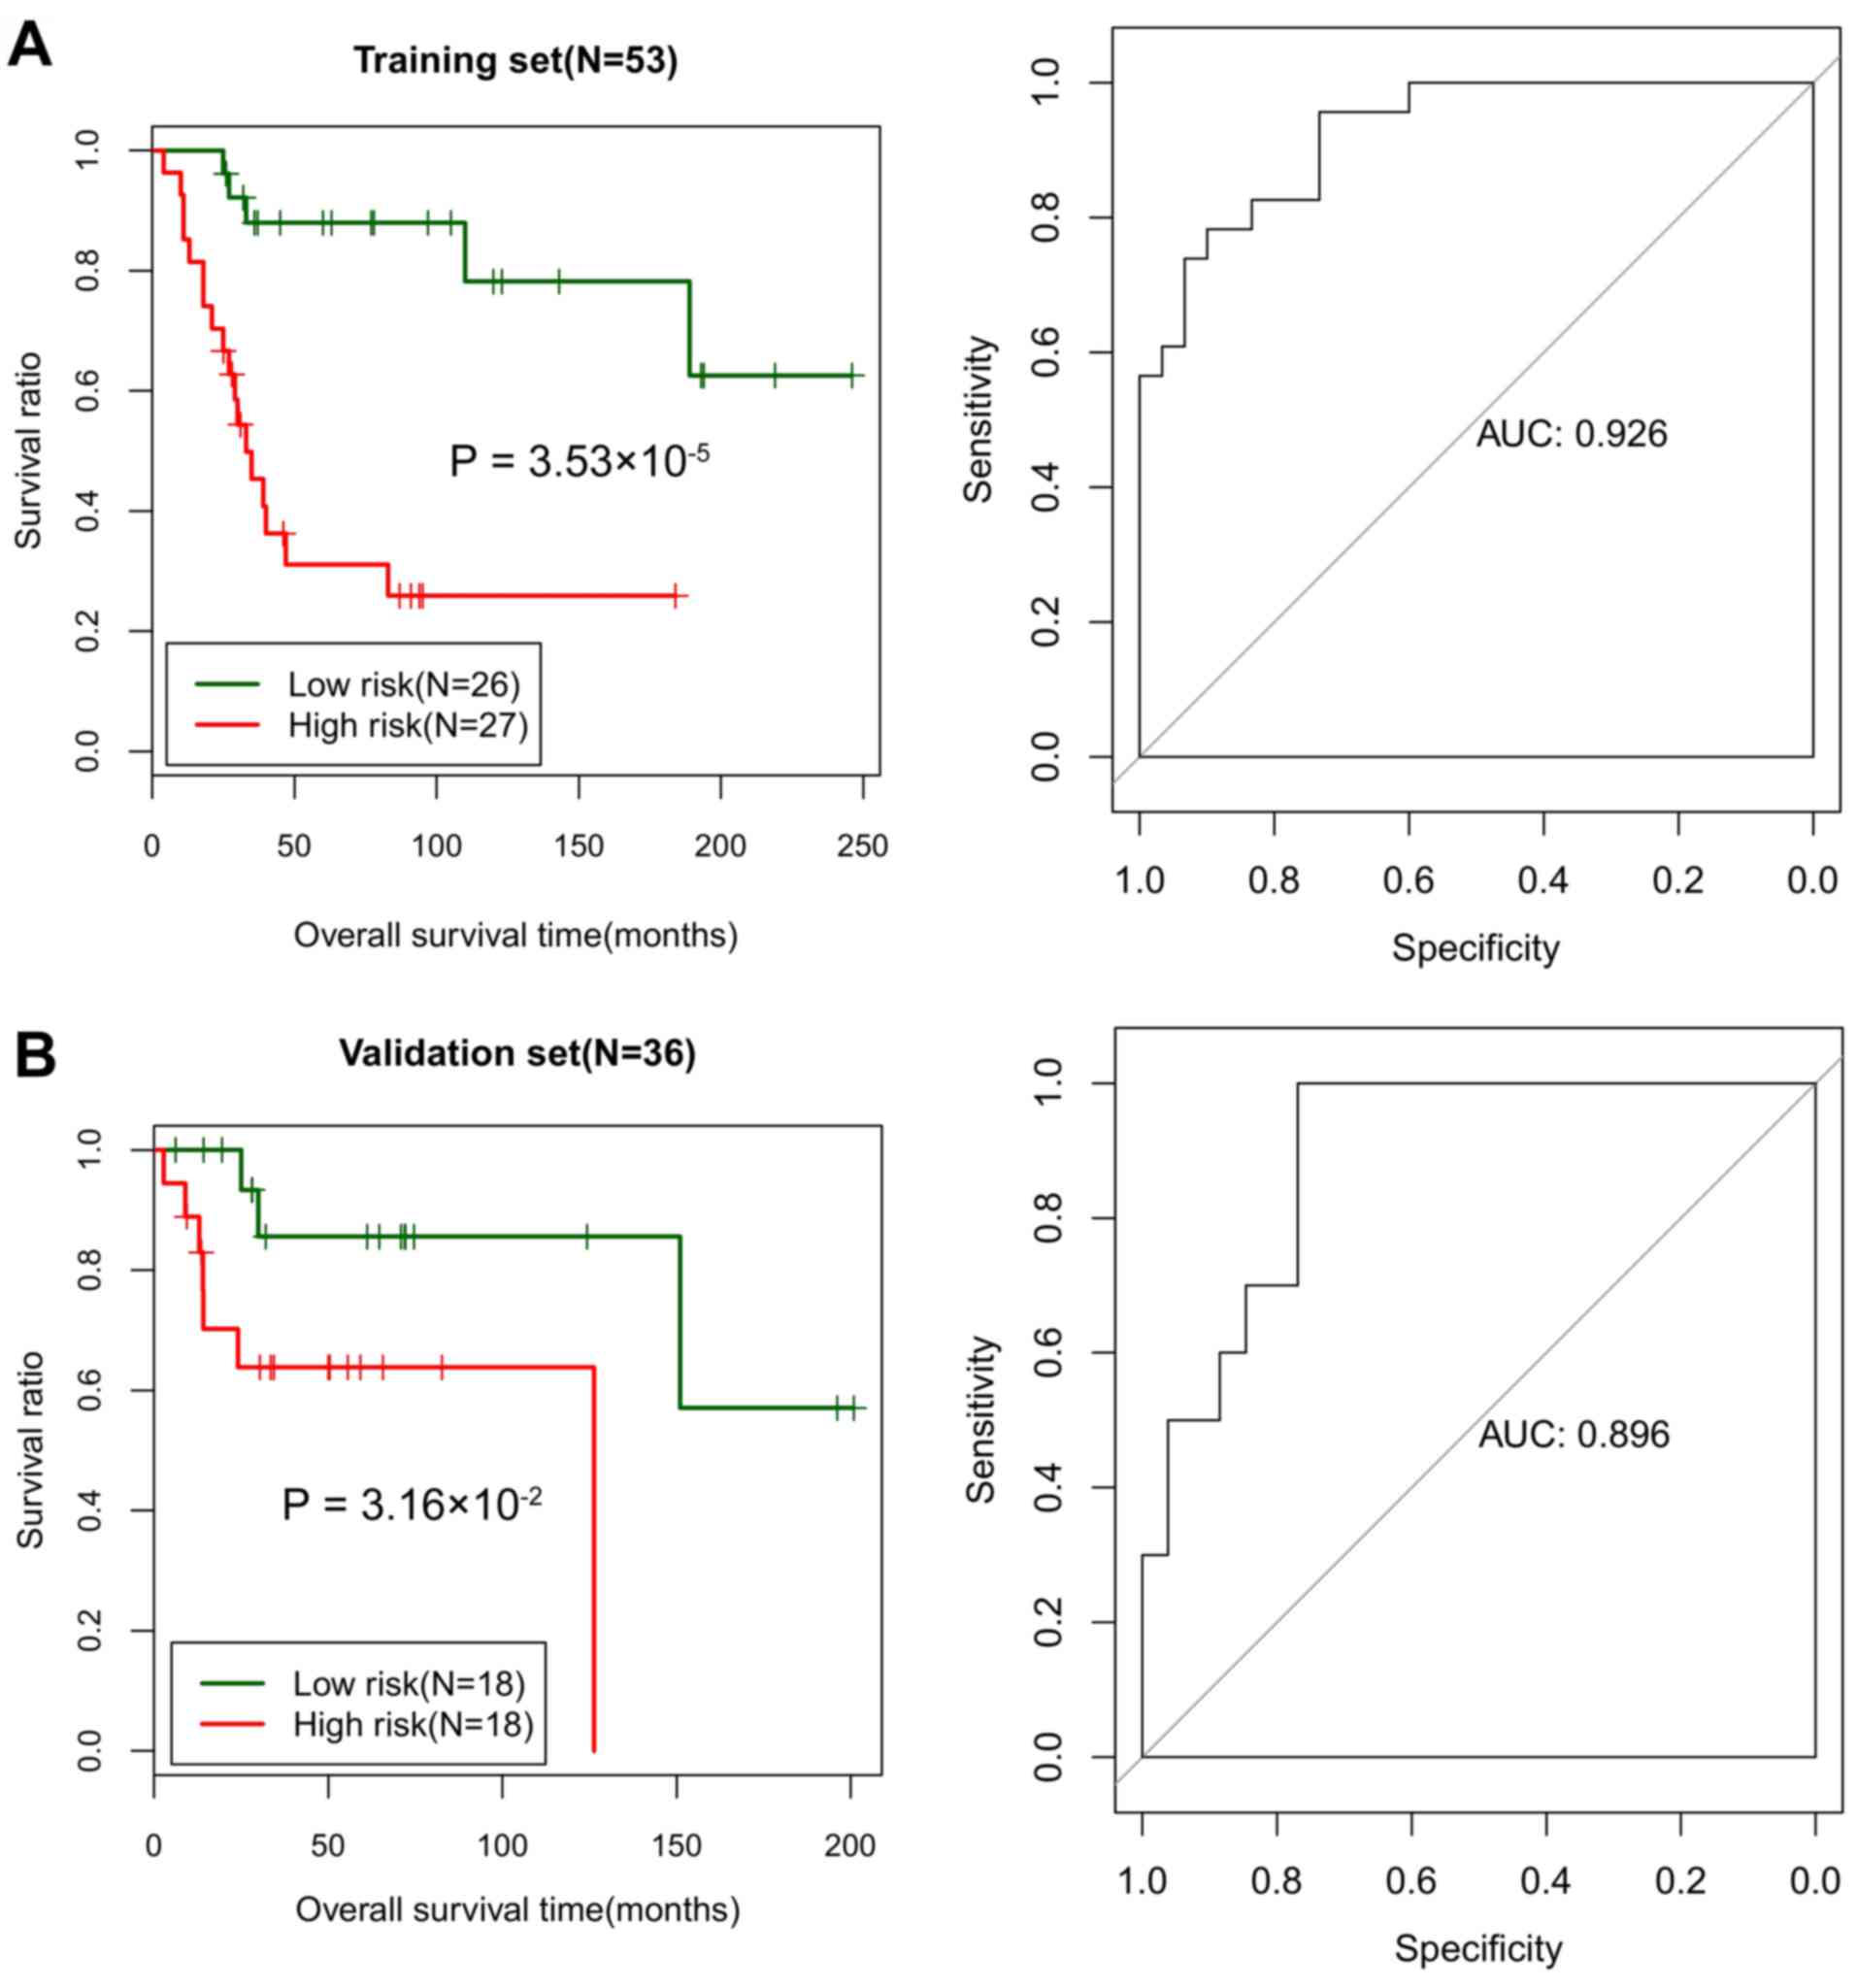
All samples in the training set were divided into
high-risk (n=26) and low-risk (n=27) groups based on the median
risk score. The log-rank test indicated that the survival ratio of
the high-risk group was significantly increased compared with that
of the low-risk group (P=3.532×10⁻⁵; Fig. 3A). The area under the curve (AUC)
was 0.926, suggesting a good prognosis prediction ability of the
risk assessment system (Fig.
3A).
In the validation set, the samples were divided into
high-risk (n=18) and low-risk (n=18) groups based on the median
risk score. The log-rank test also indicated a markedly increased
survival ratio of the high-risk group compared with the low-risk
group (P=0.032; Fig. 3B). The AUC
for the ROC curve based on the risk assessment system was 0.896
(Fig. 3B). In the validation set,
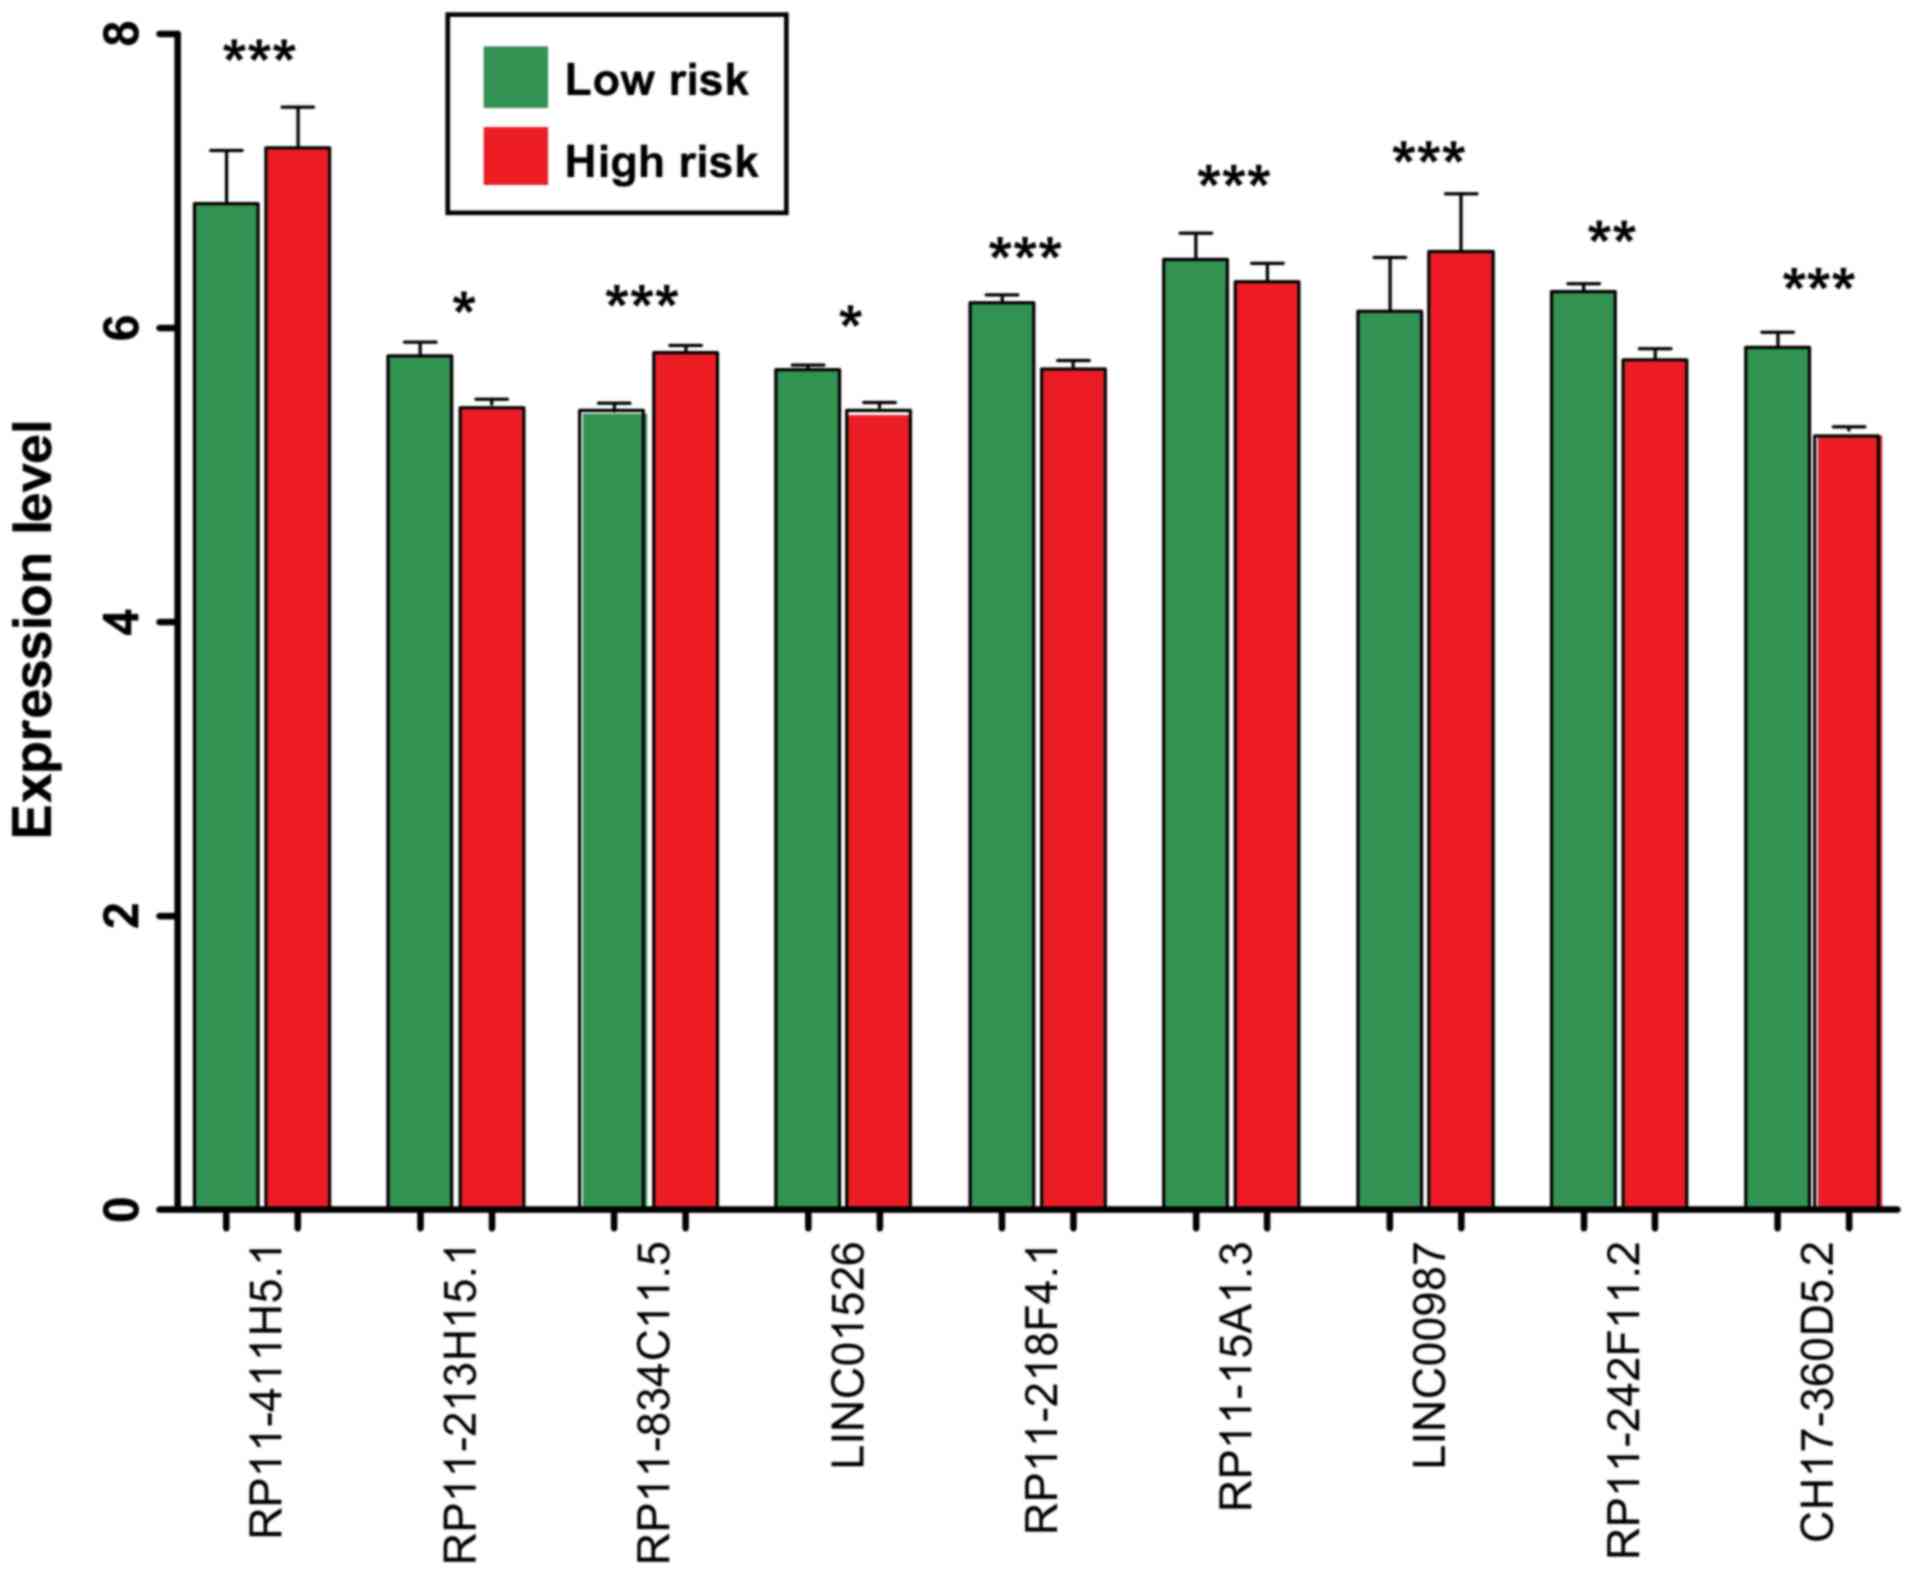
the RP11-411H5.1, RP11-834C11.5 and LINC00987 were significantly
upregulated in the samples belonging to the high-risk group
(P<0.005; Fig. 4). The other 6
lncRNAs (LINC01526, RP11-15A1.3, RP11-213H15.1, RP11-218F4.1,
RP11-242F11.2 and CH17-360D5.2) were significantly downregulated in
the samples belonging to the high-risk group (P<0.05; Fig. 4).
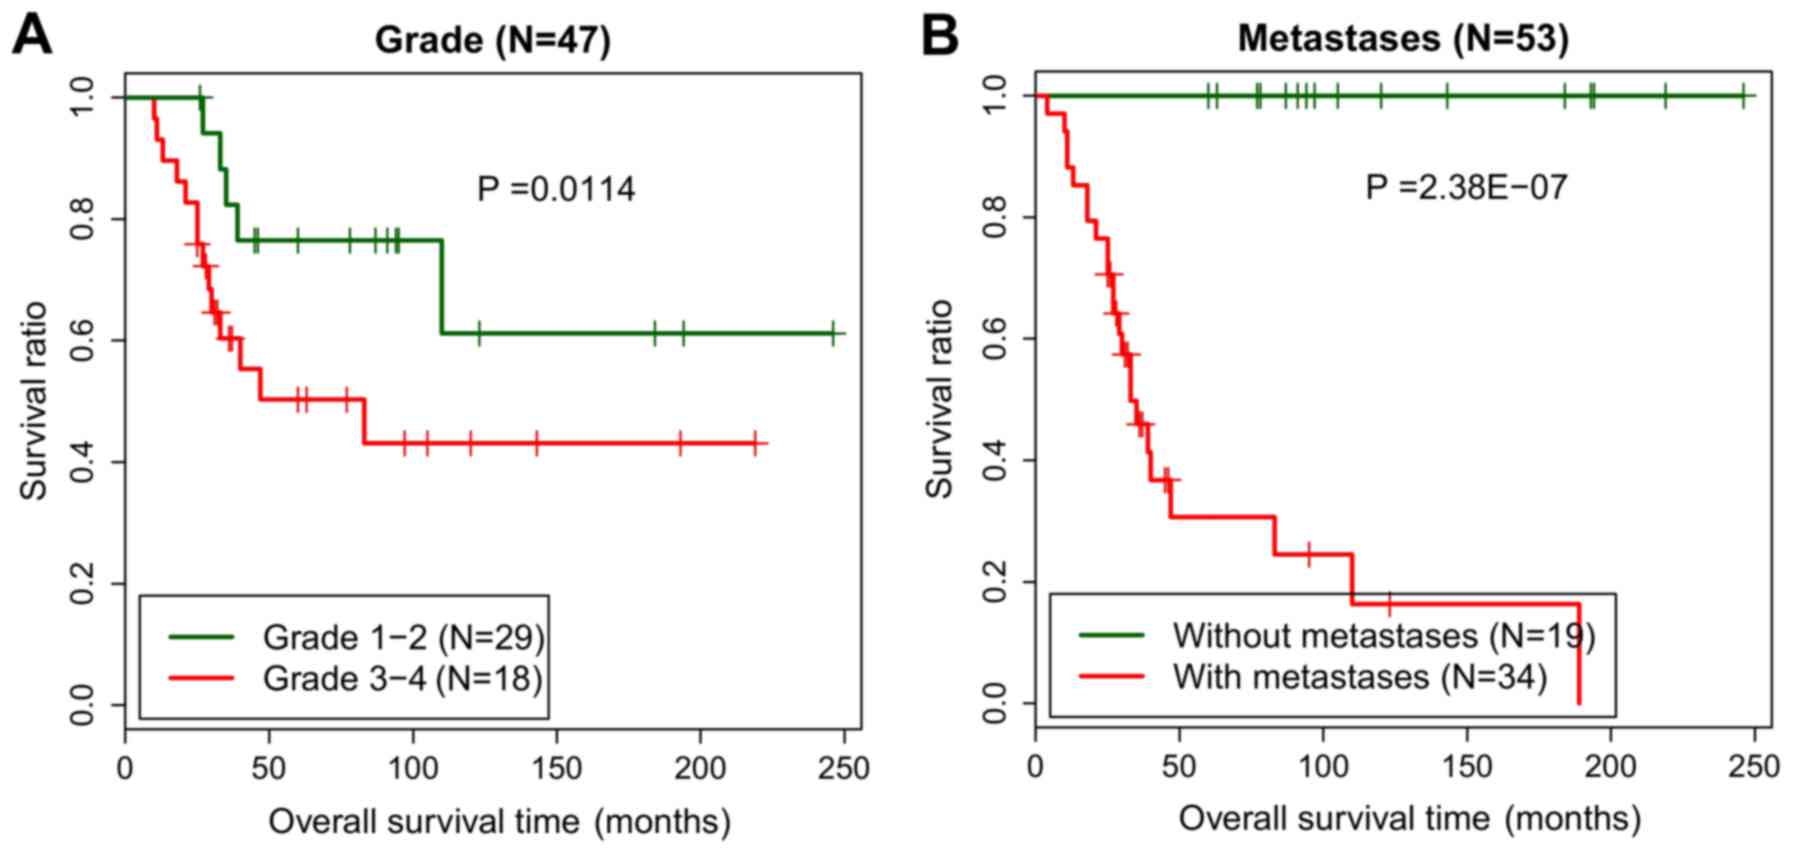
Risk score is an independent
prognostic factor for osteosarcoma
Univariate and multivariate Cox regression analyses
were conducted to investigate potential associations between the
independent prognostic factors and prognosis. In the training set,
risk score [P=3.530×10⁻⁵; 95% confidence interval (CI),
2.492–13.030]; age (P=0.038; 95% CI, 0.134–0.985), grade (P=0.011;
95% CI, 1.284–1.867) and tumor metastasis (P=2.380×10⁻⁷;
95% CI, 1.963–3.649) were identified to be significantly associated
with the prognosis according to the univariate Cox regression
analysis. In addition, the multivariate Cox regression analysis
demonstrated that risk score (P=0.028; 95% CI, 1.563–5.785), grade
(P=0.01; 95% CI, 1.291–1.872) and tumor metastasis (P<0.001; 95%
CI, 1.694–5.312) were identified as independent prognostic factors
for osteosarcoma (Table III).
The effect of risk score on prognosis was then analyzed using a
hierarchical analysis, and it was indicated that patients without
tumor metastasis in the low-risk group (P=1.249×10⁻³)
and high-risk group (P=0.005) exhibited significantly improved
prognoses (Fig. 5).
| Table III.Univariate and multivariate Cox
regression analysis for independent prognostic factors of
osteosarcoma according to the 53 osteosarcoma samples in the
GSE21257 data set. |
Table III.
Univariate and multivariate Cox
regression analysis for independent prognostic factors of
osteosarcoma according to the 53 osteosarcoma samples in the
GSE21257 data set.
|
| Univariate
analysis | Multivariate
analysis |
|---|
|
|
|
|
|---|
| Variables | HR | 95% CI | P-value | HR | 95% CI | P-value |
|---|
| Risk score
(high/low) | 7.574 | 2.492–13.030 |
3.53×10⁻⁵ | 1.868 | 1.563–5.785 | 0.028 |
| Age
(<18/≥18) | 0.363 | 0.134–0.985 | 0.038 | 0.738 | 0.228–2.386 | 0.814 |
| Sex
(male/female) | 1.403 | 0.588–3.348 | 0.444 | – | – | – |
| Grade
(G1+G2/G3+G4) | 1.496 | 1.284–1.867 | 0.011 | 1.504 | 1.291–1.872 | 0.014 |
| Tumor metastases
(yes/no) | 2.218 | 1.963–3.649 |
2.38×10⁻⁷ | 1.211 | 1.037–2.759 |
2.71×10⁻³ |
Functional enrichment of
prognosis-associated genes
A total of 250 differentially expressed genes,
including 232 upregulated and 18 downregulated, were identified
among the genes that were associated with the 9 lncRNAs identified
using the risk assessment model. The top 10s upregulated [ribosomal
protein lateral stalk subunit P1 (RPLP1),
ubiquinol-cytochrome c reductase hinge protein (UQCRH),
prothymosin alpha (PTMA), ribosomal protein L23
(RPL23), small ubiquitin-like modifier 2, prostaglandin E
synthase 3, NADH:ubiquinone oxidoreductase subunit B9
(NDUFB9), ribosomal protein L27a (RPL27A),
karyopherin subunit alpha 2 (KPNA2) and ARP3 actin related
protein 3 homolog] and downregulated [complement C1s (C1S),
interferon induced protein 44 like, fibroblast activation protein
alpha, cytochrome P450 family 27 subfamily A member 1
(CYP27A1), CD163 molecule (CD163), ETS variant 5,
syndecan 1 (SDC1), major histocompatibility complex, class
II, DM alpha (HLA-DMA), C-C motif chemokine ligand 8
(CCL8) and monooxygenase DBH like 1] differentially
expressed genes are listed in Table
IV.
| Table IV.Top 10 upregulated and downregulated
differentially expressed genes associated with the 9 lncRNAs in the
risk assessment model. |
Table IV.
Top 10 upregulated and downregulated
differentially expressed genes associated with the 9 lncRNAs in the
risk assessment model.
| A, Upregulated
genes |
|---|
|
|---|
|
| Log FC | P-value | FDR |
|---|
| RPLP1 | 1.331 |
1.860×10⁻⁶ |
1.305×10⁻⁴ |
| UQCRH | 1.298 |
7.820×10⁻⁷ |
5.480×10⁻⁵ |
| PTMA | 1.293 |
6.750×10⁻⁶ |
4.734×10⁻⁴ |
| RPL23 | 1.237 |
4.850×10⁻⁶ |
3.399×10⁻⁴ |
| SUMO2 | 1.209 |
6.110×10⁻⁶ |
4.281×10⁻⁴ |
| PTGES3 | 1.165 |
6.770×10⁻⁶ |
4.743×10⁻⁴ |
| NDUFB9 | 1.133 |
1.110×10⁻⁶ |
7.790×10⁻⁵ |
| RPL27A | 1.131 |
1.520×10⁻⁶ |
1.068×10⁻⁴ |
| KPNA2 | 1.108 |
3.180×10⁻⁶ |
2.228×10⁻⁴ |
| ACTR3 | 1.061 |
4.780×10⁻⁶ |
3.348×10⁻⁴ |
|
| B,
Downregulated. genes |
|
|
| Log FC | P-value | FDR |
|
| C1S | −0.501 |
6.443×10⁻⁴ |
4.517×10⁻² |
| IFI44L | −0.503 |
4.218×10⁻⁴ |
2.957×10⁻² |
| FAP | −0.506 |
4.576×10⁻⁴ |
3.208×10⁻² |
| CYP27A1 | −0.513 |
4.440×10⁻⁶ |
3.110×10⁻⁴ |
| CD163 | −0.526 |
1.821×10⁻⁴ |
1.277×10⁻² |
| ETV5 | −0.526 |
3.940×10⁻⁶ |
2.759×10⁻⁴ |
| SDC1 | −0.528 |
1.390×10⁻⁵ |
9.719×10⁻⁴ |
| HLA-DMA | −0.535 |
3.650×10⁻⁵ |
2.559×10⁻³ |
| CCL8 | −0.537 |
4.822×10⁻⁴ |
3.380×10⁻² |
| MOXD1 | −0.574 |
5.927×10⁻⁴ |
4.155×10⁻² |
Furthermore, biological processes and signaling
pathways were enriched for these 250 prognosis-associated genes.
For the biological process (BP) terms, genes were primarily
enriched in the translation (including RPLP1, RPL23 and
RPL27A; P=2.080×10⁻⁴), protein transport
(including RPL23 and HLA-DMA;
P=7.654×10⁻³), inflammatory response (including
C1S and CD163; P=1.26×10⁻²), oxidation
reduction (including UQCRH, NDUFB9 and CYP27A1;
P=2.148×10⁻²). KEGG pathway enrichment analysis
suggested that these genes were primarily enriched in Ribosome
(including RPLP1, RPL23 and RPL27A;
P=6.270×10⁻⁷), Oxidative phosphorylation (including
UQCRH and NDUFB9; P=1.355×10⁻³),
Glycolysis/Gluconeogenesis [lactate dehydrogenase B (LDHB),
phosphoglycerate mutase family member 4 (PGAM4), aldolase,
fructose-biphosphate C (ALDOC), dihydrolipoamide
dehydrogenase (DLD) and dihydrolipoamide S-acetyltransferase
(DLAT); P=2.965×10⁻³) and Cell adhesion molecules
(CAMs) (including SDC1 and HLA-DMA;
P=4.839×10⁻²). The functional and pathway enrichment
analyses indicated that TTK protein kinase (TTK), cyclin B1
(CCNB1) and BUB1 mitotic checkpoint serine/threonine kinase
(BUB1) were markedly implicated in the cell cycle (Table V).
| Table V.Significantly enriched functions and
pathways for the identified prognosis-associated genes. |
Table V.
Significantly enriched functions and
pathways for the identified prognosis-associated genes.
| Category | Term | Count | P-value | Genes |
|---|
| BP | GO:0006414;
translational elongation | 11 |
3.690×10⁻⁶ | RPS28, RPL23,
RPL14, RPL7, RPS3A, RPLP1, RPS15, RPL27A, RPL23A, RPL7A,
RPL10A |
| BP | GO:0006412;
translation | 16 |
2.080×10⁻⁴ | MRPL51, CARS,
RPL14, NARS, RPL27A, RPL23A, RPS28, RPL7, RPL23, RPS3A, EIF1AX,
RPS15, RPLP1, MRPL19, RPL10A, RPL7A |
| BP | GO:0006091;
generation of precursor metabolites and energy | 14 |
1.223×10⁻³ | UQCRC2, TXNL1,
LDHB, NDUFB10, ALDOC, NDUFB9, DLAT, SLC25A13, UQCRH, PGAM4, SDHD,
DLD, UQCRB, FH |
| BP | GO:0008283; cell
proliferation | 16 |
3.357×10⁻³ | MORF4L1, COPS2,
STIL, PDPN, VTI1B, IFI16, RBBP7, GAS6, LGR4, SBDS, GOLPH3, PCNA,
CKS2, BUB1, RAP1B, ASPM |
| BP | GO:0070271; protein
complex biogenesis | 17 |
5.484×10⁻³ | TCP1, MSTO1,
ALDOC, CAPZA1, GJA1, ANLN, CDH2, CENPJ, HLA-DMA, PICALM, UQCRH,
GOPC, NPM1, PDGFC, ANGPT1, KPNA3, KPNB1 |
| BP | GO:0006461; protein
complex assembly | 17 |
5.484×10⁻³ | TCP1, MSTO1,
ALDOC, CAPZA1, GJA1, ANLN, CDH2, CENPJ, HLA-DMA, PICALM, UQCRH,
GOPC, NPM1, PDGFC, ANGPT1, KPNA3, KPNB1 |
| BP | GO:0015031; protein
transport | 22 |
7.654×10⁻³ | GDI2, GOLT1B,
VTI1B, PPT1, CLTC, HLA-DMA, TIMM8B, RAB33B, NXT2, YWHAG, RPL23,
RAB18, GOPC, NPM1, PCNA, YIPF5, KPNA3, KPNA2, SAR1A, SEC24D, KPNB1,
NMD3 |
| BP | GO:0045184;
establishment of protein localization | 22 |
8.450×10⁻³ | GDI2, GOLT1B,
VTI1B, PPT1, CLTC, HLA-DMA, TIMM8B, RAB33B, NXT2, YWHAG, RPL23,
RAB18, GOPC, NPM1, PCNA, YIPF5, KPNA3, KPNA2, SAR1A, SEC24D, KPNB1,
NMD3 |
| BP | GO:0009611;
response to wounding | 17 |
8.564×10⁻³ | A2M, NMI, PDPN,
CCL8, C1S, CD163, CCNB1, HDAC4, PLSCR1, CD55, SDC1, STAB1, MTPN,
SERPINE1, VSIG4, CD14, NFX1 |
| BP | GO:0006954;
inflammatory response | 12 |
1.264×10⁻² | HDAC4, A2M,
CD55, NMI, PDPN, STAB1, CCL8, C1S, VSIG4, CD14, CD163,
NFX1 |
| BP | GO:0065003;
macromolecular complex assembly | 19 |
1.558×10⁻² | TCP1, MSTO1,
ALDOC, CAPZA1, GJA1, ANLN, CDH2, CENPJ, HLA-DMA, SMNDC1, PICALM,
UQCRH, GOPC, RPS15, NPM1, PDGFC, ANGPT1, KPNA3, KPNB1 |
| BP | GO:0007049; cell
cycle | 21 |
1.796×10⁻² | PDPN, GMNN, TTK,
ANLN, RBM7, CDC5L, UBE2C, CENPJ, MLF1, CCNB1, SBDS, GADD45GIP1,
PSMA6, FANCD2, NPM1, CKS2, BUB1, KPNA2, MCTS1, ASPM, CDCA3 |
| BP | GO:0055114;
oxidation reduction | 18 |
2.148×10⁻² | UQCRC2, TXNL1,
LDHB, NDUFB10, CYP51A1, NDUFB9, UGDH, MOXD1, MTRR, FDFT1, MTHFD2,
SLC25A13, CYP27A1, P4HA1, UQCRH, DLD, SDHD, UQCRB |
| BP | GO:0043933;
macromolecular complex subunit organization | 19 |
2.790×10⁻² | TCP1, MSTO1,
ALDOC, CAPZA1, GJA1, ANLN, CDH2, CENPJ, HLA-DMA, SMNDC1, PICALM,
UQCRH, GOPC, RPS15, NPM1, PDGFC, ANGPT1, KPNA3, KPNB1 |
| BP | GO:0022402; cell
cycle process | 16 |
3.030×10⁻² | TTK, ANLN, RBM7,
UBE2C, CENPJ, MLF1, CCNB1, SBDS, PSMA6, FANCD2, NPM1, CKS2, BUB1,
KPNA2, ASPM, CDCA3 |
| BP | GO:0006886;
intracellular protein transport | 12 |
3.190×10⁻² | YWHAG, RPL23,
NPM1, PCNA, VTI1B, CLTC, KPNA3, KPNA2, SAR1A, KPNB1, SEC24D,
TIMM8B |
| BP | GO:0000279; M
phase | 11 |
3.283×10⁻² | CCNB1, FANCD2,
BUB1, CKS2, TTK, RBM7, ANLN, UBE2C, KPNA2, ASPM, CDCA3 |
| BP | GO:0008104; protein
localization | 22 |
3.337×10⁻² | GDI2, GOLT1B,
VTI1B, PPT1, CLTC, HLA-DMA, TIMM8B, RAB33B, NXT2, YWHAG, RPL23,
RAB18, GOPC, NPM1, PCNA, YIPF5, KPNA3, KPNA2, SAR1A, SEC24D, KPNB1,
NMD3 |
| BP | GO:0010605;
negative regulation of macromolecule metabolic process | 19 |
3.693×10⁻² | IBTK, COPS2,
BTAF1, A2M, MTDH, GMNN, FZD1, HAT1, RBBP7, UBE2C, HDAC4, SAP30,
HDAC2, PSMA6, HEY1, PRKRA, NPM1, DNAJC1, NFX1 |
| PATHWAY | hsa03010;
ribosome | 11 |
6.270×10⁻⁷ | RPS28, RPL23,
RPL14, RPL7, RPS3A, RPLP1, RPS15, RPL27A, RPL23A, RPL7A,
RPL10A |
| PATHWAY | hsa00190; oxidative
phosphorylation | 8 |
1.355×10⁻³ | UQCRC2, NDUFB10,
UQCRH, NDUFB9, SDHD, COX7B, PPA2, UQCRB |
| PATHWAY | hsa04260; cardiac
muscle contraction | 6 |
1.810×10⁻³ | UQCRC2, ATP1B3,
UQCRH, TNNC1, COX7B, UQCRB |
| PATHWAY | hsa00010;
glycolysis/Gluconeogenesis | 5 |
2.965×10⁻³ | LDHB, PGAM4,
ALDOC, DLD, DLAT |
| PATHWAY | hsa04110; cell
cycle | 7 |
3.570×10⁻³ | CCNB1, YWHAG,
HDAC2, BUB1, PCNA, TTK, RBX1 |
| PATHWAY | hsa04610;
complement andcoagulation cascades | 4 |
1.536×10⁻² | A2M, CD55,
SERPINE1, C1S |
| PATHWAY | hsa04142;
lysosome | 4 |
4.059×10⁻² | CTSO, PPT1,
CD164, CLTC |
| PATHWAY | hsa03040;
spliceosome | 4 |
4.532×10⁻² | HSPA1A, CDC5L,
PRPF18, SMNDC1 |
| PATHWAY | hsa04514; cell
adhesion molecules | 4 |
4.839×10⁻² | ALCAM, SDC1,
CDH2, HLA-DMA |
Discussion
A total of 211 differentially expressed lncRNAs were
identified, and 9 of them (CH17-360D5.2, LINC00987, LINC01526,
RP11-15A1.3, RP11-213H15.1, RP11-218F4.1, RP11-242F11.2,
RP11-411H5.1 and RP11-834C11.5) were selected to establish a risk
assessment model for evaluating the prognosis of patients with
osteosarcoma. In the training and validation sets selected, samples
with low expression of RP11-411H5.1, RP11-834C11.5 or LINC00987
exhibited significantly increased survival ratios, and samples with
increased expression levels of LINC01526, RP11-15A1.3,
RP11-213H15.1, RP11-218F4.1, RP11-242F11.2 or CH17-360D5.2
exhibited significantly higher survival ratios.
The ROC curves revealed that this risk assessment
model may serve as a good prognostic prediction system in the
training (AUC=0.926) and validation sets (AUC 0.896). Furthermore,
the risk score calculated based on the expression levels of these 9
lncRNAs was revealed to be an independent prognostic factor for
osteosarcoma. Additionally, 250 differentially expressed genes
associated with the 9 lncRNAs in the risk assessment model were
identified. Functional enrichment analysis for these differentially
expressed genes revealed that UQCRH and NDUFB9 were
significantly associated with oxidation reduction and oxidative
phosphorylation. The gene product of UQCRH is a subunit of
the respiratory chain protein ubiquinol cytochrome c reductase.
NDUFB9 (22 kDa) is an accessory subunit of the mitochondrial
complex I NADH dehydrogenase in the membrane respiratory chain
(23). Mutations in mitochondrial
DNA or nuclear genes encoding mitochondrial proteins may lead to
mitochondrial dysfunctions, which are essential for the respiratory
chain/oxidative phosphorylation system (24). It has been suggested that
aberrations in mitochondrial complex I NADH dehydrogenase activity
may markedly promote breast cancer progression (25). Normal differentiated cells
primarily use mitochondrial oxidative phosphorylation to generate
energy for cellular processes, whereas cancer cells rely on aerobic
glycolysis to generate energy for enhanced growth (26,27).
In the present study, the pathway enrichment analysis revealed that
LDHB, PGAM4, ALDOC, DLD and DLAT were involved in the
glycolysis/gluconeogenesis pathway. Therefore, the lncRNAs in the
risk assessment model may target the UQCRH and NDUFB9
to regulate the oxidation reduction, oxidative phosphorylation and
glycolysis/gluconeogenesis which are important for the improved
growth of osteosarcoma cells.
The functional and pathway enrichment analyses
indicated that TTK, CCNB1 and BUB1 were markedly
implicated in the cell cycle. Huang et al (28) demonstrated that FKBP14
overexpression may promote osteosarcoma carcinogenesis and be
associated with poor prognosis. Threonine and tyrosine protein
kinase (TTK), also known as the human monopolar spindle 1, is a
dual serine/ threonine and tyrosine protein kinase (29). It has been revealed that the
suppressed TTK expression identified in osteosarcoma cell lines may
significantly decrease the cell proliferation and migration
(30). In the study of Huang et
al (28), FKBP14
knockdown markedly decreased cell cycle associated CCNB1 protein
expression. An additional study indicated that the abundance of
CCNB1 mRNA and protein is increased normally from G1 to G2 phase
(31). Budding uninhibited by
benzimidazoles 1, the product of BUB1, is required for
accurate chromosome segregation during mitosis. Upregulation and
hyper-phosphorylation of BUB1 may promote malignant
transformation in SV40 Tag-induced transgenic mouse models
(32). Therefore, the lncRNAs in
the risk assessment model may promote progression of osteosarcoma
by targeting TTK, CCNB1 and BUB1 to affect cell
cycle.
In patients with cancer, complex signaling pathways
affect survival and prognosis, with metastasis being the major
cause of morbidity and mortality and accounting for ~90% of cancer
mortalities (33). Metastasis
includes an essential step of adhesion and it is affected by the
surrounding extracellular matrix (ECM) (34). Focal adhesion is a prerequisite for
cellular motility, which is essential to cancer metastasis, and is
also involved in the settling of metastatic cancer cells at a
distal site (35). Focal adhesion
is commonly achieved by connecting the cellular cytoskeleton with
ECM components or by connecting adjoining intracellular
cytoskeletons (34). Focal
adhesion expression has been suggested to be associated with cell
migration and normally indicates a poor prognosis (36). Focal adhesion and the ECM have been
commonly associated in osteosarcomas, with these factors
investigated as potential antitumor targets (37,38).
In the present study, 4 differentially expressed genes (ALCAM,
SDC1, CDH2 and HLA-DMA) associated with the 9 lncRNAs in
the risk assessment model were significantly involved in CAMs.
Therefore, the lncRNAs in the risk assessment model may have
important roles in the progression of osteosarcoma by targeting
ALCAM, SDC1, CDH2 and HLA-DMA to regulate the cell
adhesion molecules.
In the present study, a risk assessment model was
established based on 9 differently expressed lncRNAs and exhibited
the potential to be used for assessing prognosis in patients with
osteosarcoma. The differentially expressed genes associated with
the 9 lncRNAs in this risk assessment model were identified to be
associated with oxidation reduction, oxidative phosphorylation,
glycolysis/gluconeogenesis, cell cycle and cell adhesion molecules.
The results presented in the present study may provide additional
insight into the mechanisms of osteosarcoma tumorigenesis. However,
certain limitations in the present study remain, including sample
size. In addition, the 9 identified potential prognostic lncRNAs
require additional experimental validation to fully assess their
predictive prognosis abilities in an independent cohort of patients
with osteosarcoma.
Acknowledgements
Not applicable.
Funding
No funding was received.
Availability of data and materials
The datasets analyzed during the current study are
available in the Gene Expression Omnibus repository (accession nos.
GSE21257 and GSE39055).
Authors' contributions
KS and JZ analyzed and interpreted the gene
expression data and wrote the manuscript. Both authors read and
approved the final manuscript
Ethics approval and consent to
participate
Not applicable.
Patient consent for publication
Not applicable.
Competing interests
The authors declare that they have no competing
interests
References
|
1
|
Duchman KR, Gao Y and Miller BJ:
Prognostic factors for survival in patients with high-grade
osteosarcoma using the Surveillance, Epidemiology, and End Results
(SEER) program database. Cancer Epidemiol. 39:593–599. 2015.
View Article : Google Scholar : PubMed/NCBI
|
|
2
|
Mirabello L, Troisi RJ and Savage SA:
Osteosarcoma incidence and survival rates from 1973 to 2004: Data
from the surveillance, epidemiology, and end results Program.
Cancer. 115:1531–1543. 2009. View Article : Google Scholar : PubMed/NCBI
|
|
3
|
Wang W, Li X, Meng FB, Wang ZX, Zhao RT
and Yang CY: Effects of the long non-coding RNA HOST2 on the
proliferation, migration, invasion and apoptosis of human
osteosarcoma cells. Cellular Physiol Biochem. 43:320–330. 2017.
View Article : Google Scholar
|
|
4
|
Whelan J, McTiernan A, Cooper N, Wong YK,
Francis M, Vernon S and Strauss SJ: Incidence and survival of
malignant bone sarcomas in England 1979–2007. Int J Cancer.
131:E508–E517. 2012. View Article : Google Scholar : PubMed/NCBI
|
|
5
|
Ottaviani G and Jaffe N: The epidemiology
of osteosarcoma. Cancer Treat Res. 152:3–13. 2009. View Article : Google Scholar : PubMed/NCBI
|
|
6
|
Fellenberg J, Bernd L, Delling G, Witte D
and Zahlten-Hinguranage A: Prognostic significance of
drug-regulated genes in high-grade osteosarcoma. Mod Pathol.
20:1085–1094. 2007. View Article : Google Scholar : PubMed/NCBI
|
|
7
|
Allison DC, Carney SC, Ahlmann ER,
Hendifar A, Chawla S, Fedenko A, Angeles C and Menendez LR: A
meta-analysis of osteosarcoma outcomes in the modern medical era.
Sarcoma. 2012:7048722012. View Article : Google Scholar : PubMed/NCBI
|
|
8
|
Jandura A and Krause HM: The new RNA
world: Growing evidence for long noncoding RNA functionality.
Trends Genet. 33:665–675. 2017. View Article : Google Scholar : PubMed/NCBI
|
|
9
|
Li X, Wu Z, Fu X and Han W: Long noncoding
RNAs: Insights from biological features and functions to diseases.
Med Res Rev. 33:517–553. 2013. View Article : Google Scholar : PubMed/NCBI
|
|
10
|
Guttman M and Rinn JL: Modular regulatory
principles of large non-coding RNAs. Nature. 482:339–346. 2012.
View Article : Google Scholar : PubMed/NCBI
|
|
11
|
Cheetham SW, Gruhl F, Mattick JS and
Dinger ME: Long noncoding RNAs and the genetics of cancer. Br J
Cancer. 108:2419–2425. 2013. View Article : Google Scholar : PubMed/NCBI
|
|
12
|
Ji P, Diederichs S, Wang W, Böing S,
Metzger R, Schneider PM, Tidow N, Brandt B, Buerger H, Bulk E, et
al: MALAT-1, a novel noncoding RNA, and thymosin beta4 predict
metastasis and survival in early-stage non-small cell lung cancer.
Oncogene. 22:8031–8041. 2003. View Article : Google Scholar : PubMed/NCBI
|
|
13
|
Gupta RA, Shah N, Wang KC, Kim J, Horlings
HM, Wong DJ, Tsai MC, Hung T, Argani P, Rinn JL, et al: Long
non-coding RNA HOTAIR reprograms chromatin state to promote cancer
metastasis. Nature. 464:1071–1076. 2010. View Article : Google Scholar : PubMed/NCBI
|
|
14
|
Yang Z, Zhou L, Wu LM, Lai MC, Xie HY,
Zhang F and Zheng SS: Overexpression of long non-coding RNA HOTAIR
predicts tumor recurrence in hepatocellular carcinoma patients
following liver transplantation. Ann Surg Oncol. 18:1243–1250.
2011. View Article : Google Scholar : PubMed/NCBI
|
|
15
|
Xie CH, Cao YM, Huang Y, Shi QW, Guo JH,
Fan ZW, Li JG, Chen BW and Wu BY: Long non-coding RNA TUG1
contributes to tumorigenesis of human osteosarcoma by sponging
miR-9-5p and regulating POU2F1 expression. Tumour Biol.
37:15031–15041. 2016. View Article : Google Scholar : PubMed/NCBI
|
|
16
|
Peng ZQ, Lu RB, Xiao DM and Xiao ZM:
Increased expression of the lncRNA BANCR and its prognostic
significance in human osteosarcoma. Genet Mol Res. 15:2016.
View Article : Google Scholar :
|
|
17
|
Wang P, Wang Y, Hang B, Zou X and Mao JH:
A novel gene expression-based prognostic scoring system to predict
survival in gastric cancer. Oncotarget. 7:55343–55351.
2016.PubMed/NCBI
|
|
18
|
Bland JM and Altman DG: The logrank test.
BMJ. 328:10732004. View Article : Google Scholar : PubMed/NCBI
|
|
19
|
Adler P, Kolde R, Kull M, Tkachenko A,
Peterson H, Reimand J and Vilo J: Mining for coexpression across
hundreds of datasets using novel rank aggregation and visualization
methods. Genome Biol. 10:R1392009. View Article : Google Scholar : PubMed/NCBI
|
|
20
|
Kolde R, Laur S, Adler P and Vilo J:
Robust rank aggregation for gene list integration and
meta-analysis. Bioinformatics. 28:573–580. 2012. View Article : Google Scholar : PubMed/NCBI
|
|
21
|
Ritchie ME, Phipson B, Wu D, Hu Y, Law CW,
Shi W and Smyth GK: Limma powers differential expression analyses
for RNA-sequencing and microarray studies. Nucleic Acids Res.
43:e472015. View Article : Google Scholar : PubMed/NCBI
|
|
22
|
Phipson B, Lee S, Majewski IJ, Alexander
WS and Smyth GK: Robust hyperparameter estimation protects against
hypervariable genes and improves power to detect differential
expression. Ann Appl Stat. 10:946–963. 2016. View Article : Google Scholar : PubMed/NCBI
|
|
23
|
Lin X, Wells DE, Kimberling WJ and Kumar
S: Human NDUFB9 gene: Genomic organization and a possible candidate
gene associated with deafness disorder mapped to chromosome 8q13.
Hum Hered. 49:75–80. 1999. View Article : Google Scholar : PubMed/NCBI
|
|
24
|
Ishikawa K, Takenaga K, Akimoto M,
Koshikawa N, Yamaguchi A, Imanishi H, Nakada K, Honma Y and Hayashi
J: ROS-generating mitochondrial DNA mutations can regulate tumor
cell metastasis. Science. 320:661–664. 2008. View Article : Google Scholar : PubMed/NCBI
|
|
25
|
Santidrian AF, Matsunoyagi A, Ritland M,
Seo BB, LeBoeuf SE, Gay LJ, Yagi T and Felding-Habermann B:
Mitochondrial complex I activity and NAD+/NADH balance
regulate breast cancer progression. J Clin Invest. 123:1068–1081.
2013. View Article : Google Scholar : PubMed/NCBI
|
|
26
|
Burk D and Schade AL: On respiratory
impairment in cancer cells. Science. 124:267–272. 1956. View Article : Google Scholar : PubMed/NCBI
|
|
27
|
Heiden MGV and Thompson CB: Understanding
the warburg effect: The metabolic requirements of cell
proliferation. Science. 324:1029–1033. 2009. View Article : Google Scholar : PubMed/NCBI
|
|
28
|
Huang Z, Li J, Du S, Tang Y, Huang L, Xiao
L and Tong P: FKBP14 overexpression contributes to osteosarcoma
carcinogenesis and indicates poor survival outcome. Oncotarget.
7:39872–39884. 2016.PubMed/NCBI
|
|
29
|
Liu X, Liao W, Yuan Q, Ou Y and Huang J:
TTK activates Akt and promotes proliferation and migration of
hepatocellular carcinoma cells. Oncotarget. 6:34309–34320.
2015.PubMed/NCBI
|
|
30
|
Dong Z, Sun K, Luan Y, Chen Y, Wang W, Liu
D, Cheng C, Xiong F and Xi Y: Expression and clinical significance
of threonine and tyrosine protein kinase (TTK) in osteosarcoma.
Translational Cancer Res. 6:285–292. 2017. View Article : Google Scholar
|
|
31
|
Gentric G, Maillet V, Paradis V, Couton D,
L'Hermitte A, Panasyuk G, Fromenty B, Celton-Morizur S and
Desdouets C: Oxidative stress promotes pathologic polyploidization
in nonalcoholic fatty liver disease. J Clin Invest. 125:981–992.
2015. View Article : Google Scholar : PubMed/NCBI
|
|
32
|
Guo C, Wu G, Chin JL, Bauman G, Moussa M,
Wang F, Greenberg NM, Taylor SS and Xuan JW: Bub1 up-regulation and
hyperphosphorylation promote malignant transformation in SV40
Tag–Induced transgenic mouse models. Cancer Res.
66:7132006.PubMed/NCBI
|
|
33
|
Seyfried TN and Huysentruyt LC: On the
origin of cancer metastasis. Crit Rev Oncog. 18:43–73. 2013.
View Article : Google Scholar : PubMed/NCBI
|
|
34
|
Guan X: Cancer metastases: Challenges and
opportunities. Acta Pharm Sin B. 5:402–418. 2015. View Article : Google Scholar : PubMed/NCBI
|
|
35
|
Wells A, Grahovac J, Wheeler S, Ma B and
Lauffenburger D: Targeting tumor cell motility as a strategy
against invasion and metastasis. Trends Pharmacol Sci. 34:283–289.
2013. View Article : Google Scholar : PubMed/NCBI
|
|
36
|
Recher C, Ysebaert L, Beyne-Rauzy O,
Mansat-De Mas V, Ruidavets JB, Cariven P, Demur C, Payrastre B,
Laurent G, et al: Expression of focal adhesion kinase in acute
myeloid leukemia is associated with enhanced blast migration,
increased cellularity, and poor prognosis. Cancer Res.
64:3191–3197. 2004. View Article : Google Scholar : PubMed/NCBI
|
|
37
|
Hu C, Chen X, Wen J, Gong L, Liu Z, Wang
J, Liang J, Hu F, Zhou Q, Wei L, et al: Antitumor effect of focal
adhesion kinase inhibitor PF562271 against human osteosarcoma in
vitro and in vivo. Cancer Sci. 108:1347–1356. 2017. View Article : Google Scholar : PubMed/NCBI
|
|
38
|
Jiang WG, Ye L, Ji K, Ruge F, Wu Y, Gao Y,
Ji J and Mason MD: Antitumour effects of Yangzheng Xiaoji in human
osteosarcoma: The pivotal role of focal adhesion kinase signalling.
Oncol Rep. 30:1405–1413. 2013. View Article : Google Scholar : PubMed/NCBI
|