Introduction
Diabetes is an important risk factor for nosocomial
infections. It is difficult to control diabetes after a concurrent
infection. The two disorders influence each other and aggravate the
disease, leading to high mortality (1). The intestinal mucosal immune system
is the first line of defense against intestinal pathogens and
external antigen infections, and the system plays a key role in
establishing and maintaining homeostasis between the host and the
external environment (2). The
intestinal mucosal immune system has unique immune cells, including
regulatory T cells and tolerant dendritic cells (DCs), and the
expression of unique pattern recognition receptors plays a key role
in maintaining intestinal tolerance to oral antigens and intestinal
commensal bacteria (3).
Salmonella is one of the main pathogens that causes
diarrhea, and its pathogenicity is mainly through the invasion of
and replication in host cells (4).
Therefore, studying the mechanism of intestinal immune system
resistance to Salmonella under hyperglycemia may provide new
strategies for diabetic patients to resist intestinal pathogen
infection.
The main function of regulatory T cells (Tregs) is
to suppress or modulate the immune response, and these cells
constitute a key part of peripheral immunomodulation (5). Evidence has shown that a lack of Treg
regulation plays a role in many autoimmune diseases. One previous
study showed that patients with type 1 diabetes mellitus (T1DM)
have lower levels of FoxP3+ Tregs (labeled as
CD4+CD25+ T cells) than individuals without
diabetes (6). However, Tregs are
labeled based on low CD127 expression and positive FoxP3
expression. The total number of FoxP3+ Tregs in T1DM
patients is the same as in the general population (7). FoxP3+ Tregs are not a
simple cell population with common phenotypes but rather a
heterogeneous mixture of cell populations with different phenotypic
subtypes, which represent the maturation, differentiation, and
activation status of cells, or cells in an inhibited state due to
different methods or targeted effects. In this way, T1DM may
involve changes in the number and balance of Treg subpopulations.
One previous study showed that individuals with T1DM have fewer
FoxP3+ Tregs than individuals without diabetes (8).
A previous study showed that DC subpopulations are
involved in the pathogenesis of multiple autoimmune diseases,
including T1DM. In peripheral tissues, interactions between DCs and
self-reactive effector cells (Th0 cells) induce hyperglycemia in
T1DM patients (9). DCs induce the
differentiation of autoreactive T cells into pro-inflammatory
effector cells to cause the death of islet beta cells, thereby
preventing the biosynthesis of insulin. In general, DCs participate
in the maintenance of central and peripheral immune tolerance by
eliminating autoreactive T cells and inducing Treg production.
However, the changes in Tregs at the site of tissue injury and
kinetics and phenotypic changes of DCs that occur during the
induction of Treg changes have not been established (10).
In the present study, the elevation of the Treg
proportion in the intestinal lamina propria (LP) suggested that
Tregs play an important role in maintaining intestinal homeostasis
after infection in hyperglycemic mice. One possible reason was that
the uptake of antigens by CD103+CD11b+ DCs in
the LP stimulated the proliferation of antigen-specific
CD4+ T cells and induced differentiation into
FoxP3+ Tregs. These findings may aid in the development
of an in-depth understanding of the T1DM cytological basis, which
may provide a theoretical basis for developing systems of T1DM
immunotherapy and better clinical application of immune cells.
Materials and methods
Animals
A total of 20 female C57BL/6 (H-2 Kb) mice (6–8
weeks of age, weighing ~18–22 g) were purchased from Vital River
(Beijing, China). These animals were maintained in specific
pathogen-free conditions at a controlled temperature (18°C to 20°C)
and humidity (40–70%) with a 12 h light cycle, and access to
standard diet and tap water ad libitum. This study was
approved by the Laboratory Animal Care Committee of Taishan Medical
University (Taian, China), and all animal experiments were
conducted in accordance with the Guidelines of the Care and Use of
Laboratory Animals of Taishan Medical University. These mice were
allocated into 4 groups (5 mice in each group): naïve, without any
treatment; naïve+S.T., treated with only Salmonella
typhimurium; streptozotocin (STZ), treated with only STZ;
STZ+S.T., treated with STZ and Salmonella typhimurium.
Induction of diabetes
STZ-induced T1DM was established by subcutaneous
administration with STZ [freshly prepared in citrate buffer;
Sigma-Aldrich/Merck KGaA (Darmstadt, Germany)] at a dosage of 200
mg/kg body weight in 10 mice (11). Diabetes/hyperglycemia was confirmed
by testing the blood glucose level using a OneTouch®
glucose monitoring system (LifeScan Inc., Milpitas, CA, USA).
Infection with Salmonella
typhimurium
A single colony of Salmonella typhimurium
used for infecting the mouse model was inoculated onto an LB agar
plate with inoculum and incubated at 37°C for 12 h. A single colony
was then selected and further incubated in LB liquid medium at 37°C
for another 12 h. One hundred microliters of the bacterial broth
was transferred to a new test tube containing LB liquid medium and
further incubated at 37°C for 12 h. After diluting the bacterial
broth into multiple proportions and agar plate inoculation, the
bacterial cultures were incubated at 37°C for 12 h, followed by
calculating the number of bacteria (CFU). Five C57BL/6 mice in the
naïve and STZ groups were weighed and orally administered
1×10⁸ CFU Salmonella typhimurium (12).
Tissue sectioning and staining
Intestinal and pancreatic tissues were fixed with
10% formaldehyde for 12–24 h at room temperature. The tissues were
then paraffin-embedded and cut into 5 µm thick longitudinal
sections, and stained with hematoxylin solution for 3 min, eosin
solution for 2 min at room temperature, and observed under a light
microscope (magnification, ×200; Olympus Corporation, Tokyo
Japan).
Measurement of cytokines
A total of 0.3 ml blood was collected from the mouse
submandibular vein plexus without anticoagulation, and the serum
was isolated. In brief, blood samples were refrigerated at 4°C for
1 h, and centrifuged at 1,000 × g, at 4°C for 5 min to collect the
blood serum. Cytokines, including IL-6 (cat. no. ab100712, Abcam,
Cambridge, UK) and interferon γ (IFN-γ; cat. no. ab100689; Abcam)
in the serum, were assayed by standard sandwich ELISA in 96-well
plates using a capture and detection method, as per the
manufacturer's instructions.
Intestinal single cell
preparation
Each mouse was euthanized by cervical dislocation to
dissect the small intestine. The contents of the small intestine
were then flushed by enema and the lamina propria (LP) and
mesenteric lymph node (MLN) were removed. IEL medium and
ethylenediaminetetraacetic acid (EDTA) washing solution were used
for irrigation and rinsing on a shaker at 170 rpm at 37°C for 40
min. The suspension was filtered twice through a 30-mesh filter.
The small intestine was cut into small pieces and incubated with 5
ml type IV collagenase on a shaker at 150 rpm at 37°C for 40 min.
MACS buffer was then added to stop the digestion, and the mixture
was passed through an oversized sieve for filtering and
homogenization. MACS buffer was also used to rinse the filter to
prevent cells from drying out, followed by centrifugation in 45%
Percoll medium at 1,800 × g for 10 min at 23°C and the supernatant
was removed. MACS buffer was used to resuspend the tissue pellet,
which was filtered through a 40 µm filter and further centrifuged
at 1,800 × g for 5 min at 4°C to discard the supernatant and the
cell pellet was resuspended in a final volume of 100 µl RPMI-1640
medium (Gibco, Thermo Fisher Scientific, Inc., Waltham, MA,
USA).
Flow cytometry
For cell surface staining, after blocking with 2.4G2
(cat. no. sc-18867; Santa Cruz Biotechnology, Inc., Dallas, TX,
USA) at 37°C for 20 min, cells were stained with diluted (1:200)
anti-CD11c-percp-cy5.5 (cat. no. 03212-70; Biogems International,
Inc., Westlake Village, CA, USA), anti-MHC Class II IA + IE (cat.
no. ab93561; Abcam), anti-CD64-APC (cat. no. 139305; BioLegend,
Inc., San Diego, CA, USA), anti-F4/80-FITC (cat. no. 123108;
BioLegend, Inc.), anti-PD-L1-PE (cat. no. 124308; BioLegend, Inc.),
anti-CD8a (cat. no. 17-0081-82; eBioscience; Thermo Fisher
Scientific, Inc.), anti-CD11b-PE (cat. no. 101207; BioLegend,
Inc.), anti-Ly6C-e450 (cat. no. 48-5932-82; eBioscience; Thermo
Fisher Scientific, Inc.), anti-NK1.1-Biotin (cat. no.
85-13-5941-85; eBioscience; Thermo Fisher Scientific, Inc.), and
anti-CD3e-Biotin (cat. no. 13-0031-86; eBioscience; Thermo Fisher
Scientific, Inc.) monoclonal antibodies to analyze DCs,
macrophages, monocytes, and neutrophils. For cell counting, stained
cells were collected by centrifuging at 140 × g for 5 min at 4°C,
and then quantified by flow cytometry. Phenotypic analysis and cell
counts were performed on a BD FACS Aria II Flow Cytometer (BD
Bioscience, San Jose, CA, USA) and analyzed using FlowJo 7.6.1
(FlowJo LLC, Ashland, OR, USA).
Reverse transcription quantitative-PCR
(RT-qPCR)
First, RNA was extracted from the intestinal tissue
in mice using TRIzol® (cat. no. 15596-018; Invitrogen;
Thermo Fisher Scientific, Inc.). Next, aliquots of each RNA sample
(1 µg) were reverse transcribed to produce cDNA using a Quanti-Tect
Reverse Transcription kit (Qiagen GmbH, Hilden, Germany). RT-qPCR
was performed with a Rotor-Gene SYBR Green PCR Kit (Qiagen GmbH) on
a Rotor-Gene Q cycler (Qiagen GmbH). The reaction system (25 µl)
included 12.5 µl Rotor-Gene SYBR Green RT-PCR Master Mix (2X), 1
µmol/l PCR forward primers, 1 µmol/l PCR reverse primers, 0.25 µl
Rotor-Gene RT Mix, 1 µl RNA (50 ng) and nuclease-free water. A
Rotor Gene 6000 thermal circulator (Qiagen GmbH) was used to
reverse transcribe mRNA at 55°C for 10 min. For qPCR, the mixture
was then heated at 95°C for 5 min to activate the Hot Star Taq Plus
DNA polymerase. PCR was carried out by the two-step method
(denatured at 95°C for 5 sec, then annealed and extended at 60°C
for 10 sec). Samples were analyzed in triplicate, and experiments
were performed at least three times. FoxP3 used
glyceraldehyde-phosphate dehydrogenase (GAPDH) as the internal
reference. The 2−ΔΔCq method (13) was used to calculate the ratio of
gene expression in the experimental group relative to that in the
control group with the using the quantification cycles (Cq) as
presented in the following formula: ΔΔCq=ΔCqthe experimental
group-ΔCqthe control group, and ΔCq=Cq(target
gene)-Cq(internal reference). FoxP3 primer
sequences were as follows: forward sequence,
5′-CCTGGTTGTGAGAAGGTCTTCG-3′; reverse sequence,
5′-TGCTCCAGAGACTGCACCACTT-3′. GAPDH primer sequences were as
follows: forward sequence, 5′-AATGGATTTGGACGCATTGGT-3′; reverse
sequence, 5′-TTTGCACTGGTACGTGTTGAT-3′. GAPDH expression was used as
the internal reference gene.
Statistical analysis
Data are represented as the mean ± standard error of
the mean (SEM) or standard deviation (SD). Statistical analyses
were performed using GraphPad PRISM 8.0.2.263 (GraphPad Software,
La Jolla, CA, USA) by one-way analysis of variance (ANOVA) followed
by Dunnett's post hoc tests. Pearson correlation analysis was used
to analyze the relationship between
CD103+CD11b+ DC cells and
CD4+FoxP3+ Tregs. P<0.05 was considered to
indicate a statistically significant difference.
Results
Hyperglycemic mice infected with
Salmonella typhimurium display increased inflammatory progression
and mortality
After C57BL/6 inbred mice were fasted for 8 h, the
mice were weighed and intraperitoneally injected with 200 mg/kg STZ
solution. After 72 h, caudal vein blood was collected from each
mouse to measure the blood glucose concentration, which was
significantly higher in the experimental group (>20 mmol/) than
that noted in the control group (Fig.
1A). The body weights of all of the mice were continuously
monitored. The body weight of the mice after STZ injection was
significantly reduced (Fig. 1A).
After STZ injection, the mice showed symptoms, such as polydipsia
and polyuria, which were similar to the clinical symptoms of T1DM
patients.
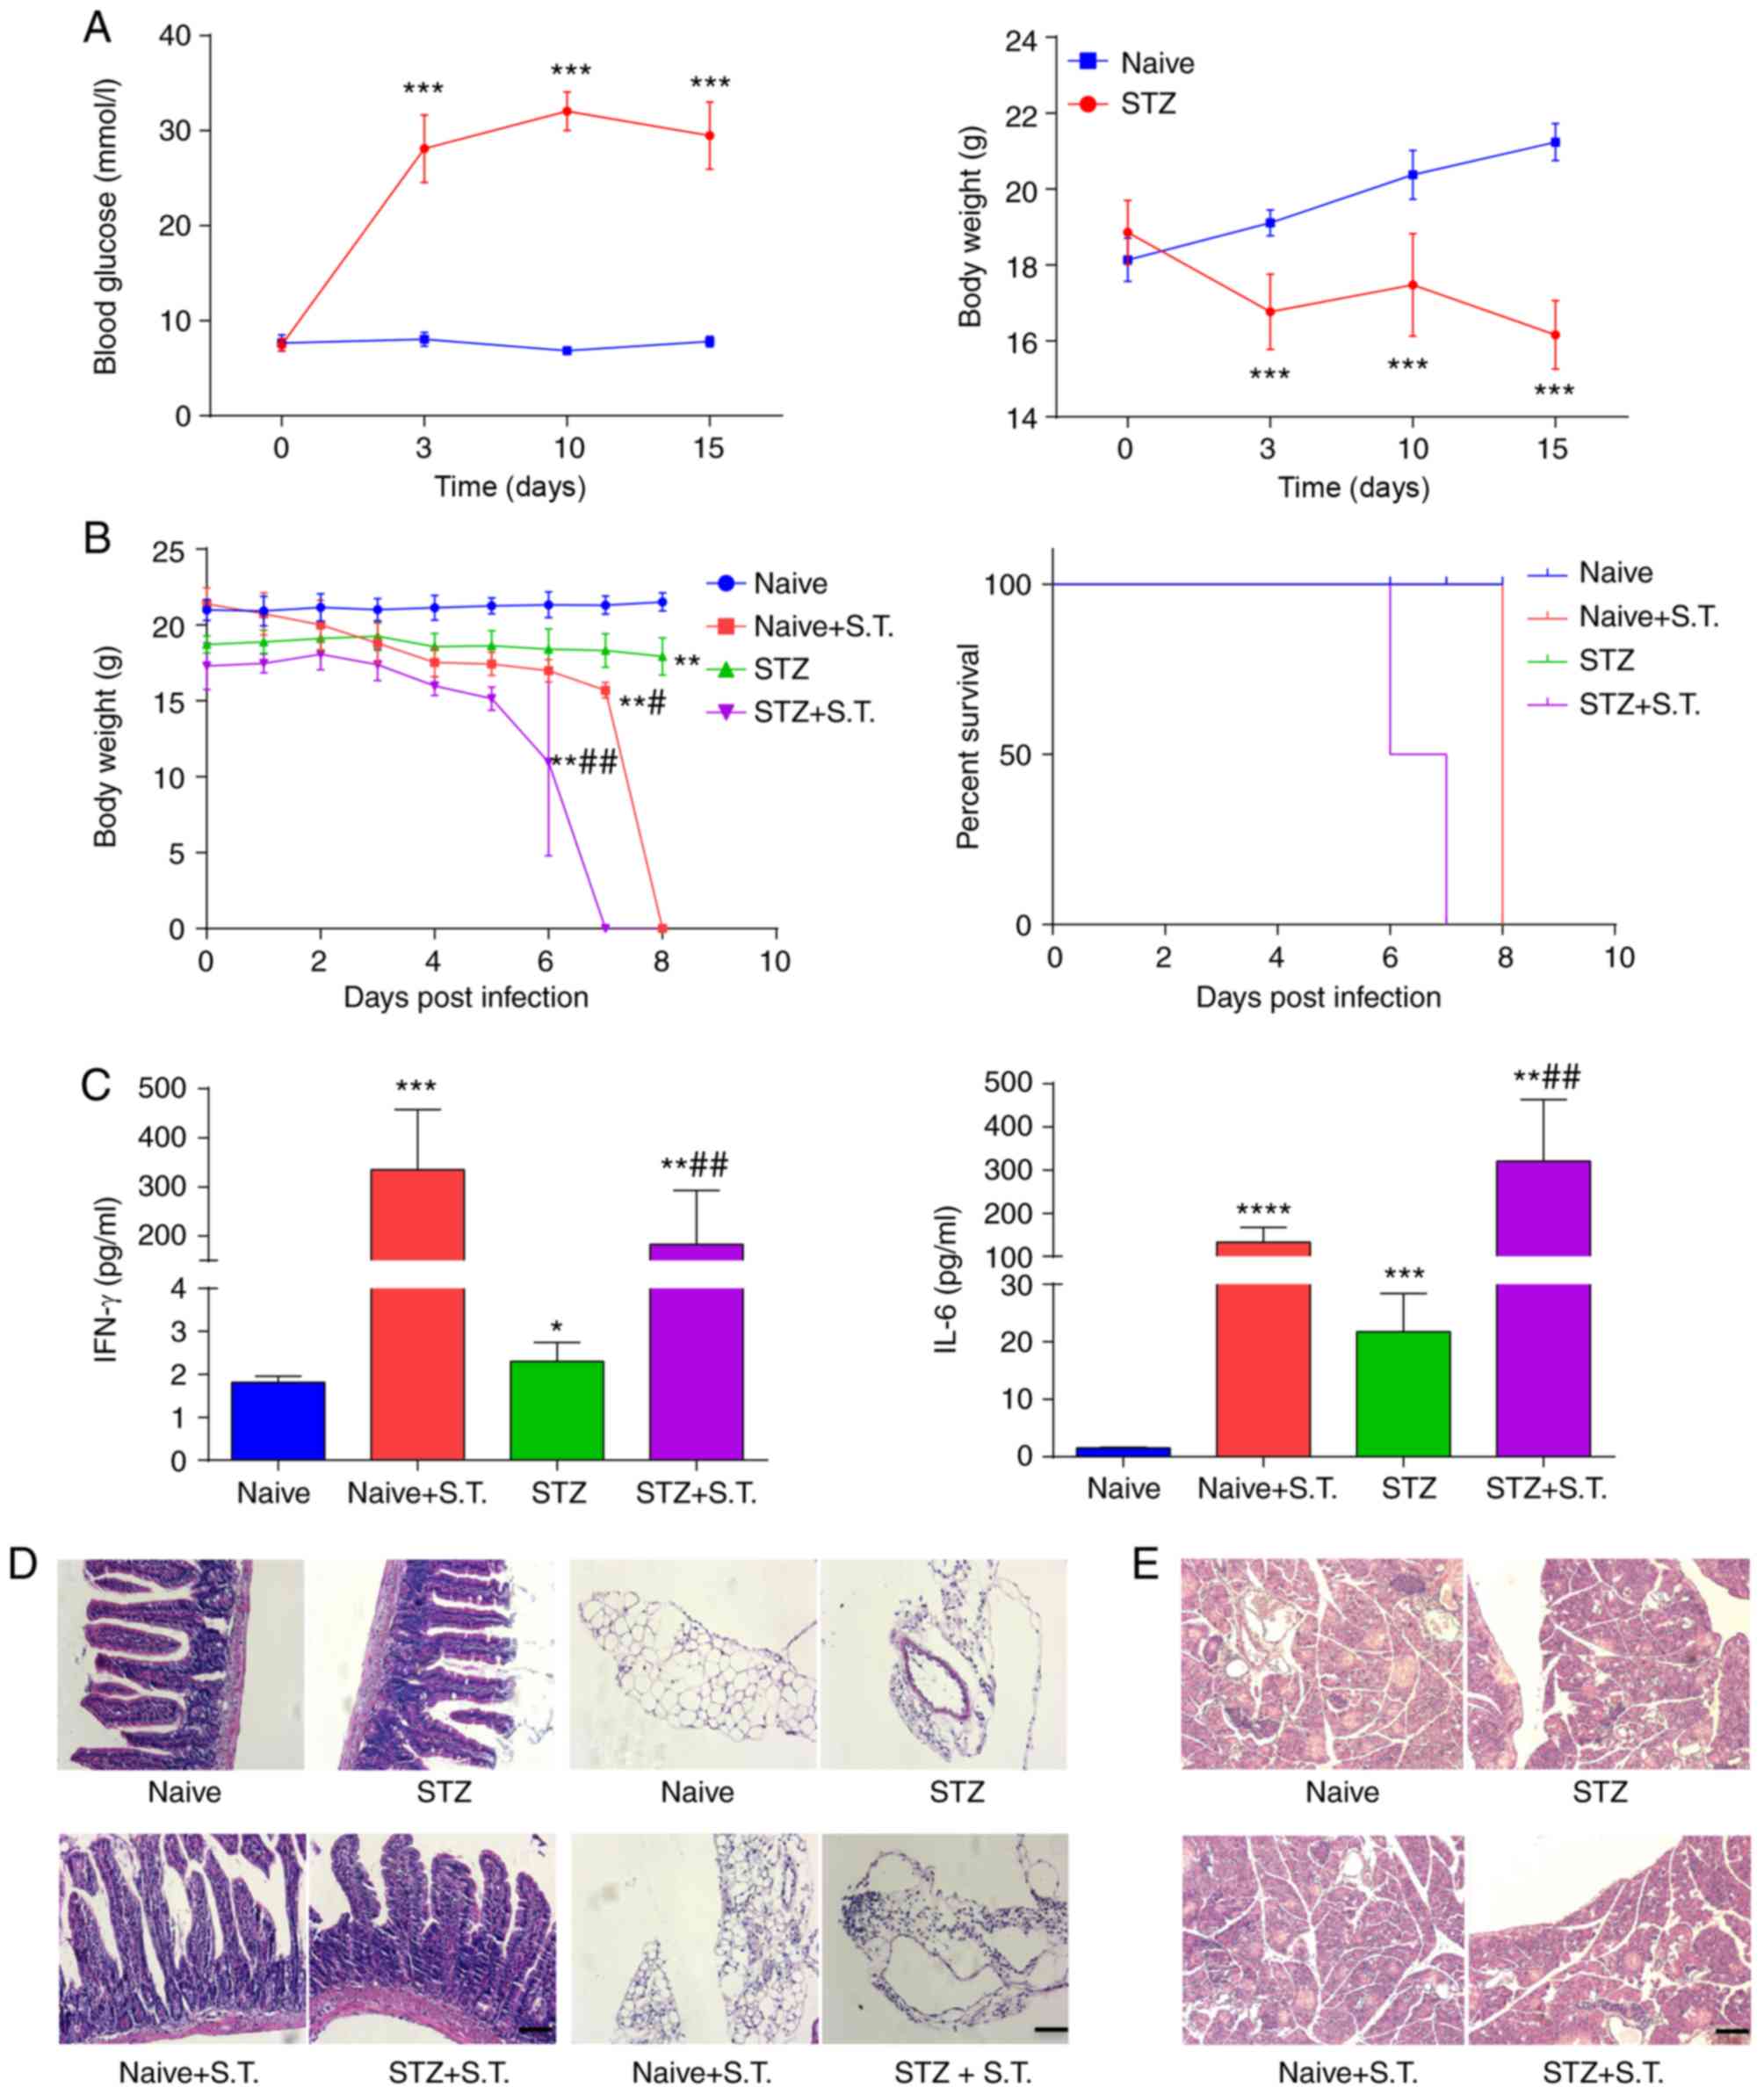 | Figure 1.Hyperglycemic mice infected with
Salmonella show enhanced inflammatory progression and
elevated mortality. (A) Continuous monitoring of blood glucose and
body weight of mice on days 0, 3, 10 and 15 after the
intraperitoneal injection of STZ. (B) Daily monitoring of the body
weight and the survival in the hyperglycemic mice 15 days after STZ
injection and the control mice after intragastric administration of
Salmonella typhimurium. (C) ELISA detection of serum IFN-γ
and IL-6 levels on day 3 after Salmonella infection. (D)
H&E staining showing the histology of paraffin-embedded small
intestine on day 3 after Salmonella infection (scale bar, 50
µm). Inflammatory changes in the intestinal lamina propria and
adipose tissue surrounding the intestinal wall were observed. (E)
H&E staining showing the histology of paraffin-embedded
pancreatic tissue on day 3 after Salmonella infection (scale
bar, 50 µm). *P<0.05, **P<0.01, ***P<0.001,
****P<0.0001, compared with the naïve group;
#P<0.05, ##P<0.01, compared with the
STZ group (ANOVA). Means ± standard deviation are shown (n=5). STZ,
streptozotocin; S.T., Salmonella typhimurium; IFN-γ,
interferon γ; IL-6, interleukin 6. |
Next, we randomly divided the C57BL/6 inbred mice
into two groups: the naïve group and the naïve+S.T. group. The
STZ-induced hyperglycemic mice were also randomly divided into two
groups: the STZ group and the STZ+S.T. group. Animals in the two
groups of mice with Salmonella infection were orally
administered and infected with 1×10⁸ CFU Salmonella
typhimurium according to the methods described in a previous
study (14). The results showed
that the two groups of mice infected with Salmonella
typhimurium (+S.T.) had significantly lower body weights than
the naïve group and the STZ group (Fig. 1B). In addition, comparing the
mortality between the mice in the naïve+S.T. group and the STZ+S.T.
group, hyperglycemic mice with Salmonella infection died
earlier than mice in the STZ group (Fig. 1B). The hyperglycemic mice with
Salmonella infection began to die on day 6 post infection
and all mice were dead on day 7 after Salmonella infection.
The C57BL/6 inbred mice with Salmonella infection (mice in
the naïve+S.T. group) were all dead on day 8 after
Salmonella infection (Fig.
1B), suggesting that hyperglycemia aggravated Salmonella
infection and promoted the progression of the disease. ELISA
assessment of IFN-γ concentration in mouse serum 3 days after
Salmonella infection showed significantly higher serum IFN-γ
concentrations in the naïve+S.T. group and the STZ+S.T. group than
in the two groups of mice without Salmonella infection
(Fig. 1C). The serum IFN-γ
concentration of the STZ+S.T. group was lower than the naïve+S.T.
group. In addition, the serum IL-6 concentration in the STZ+S.T.
group was significantly higher than that in the naïve+S.T. group
(Fig. 1C).
H&E staining for the detection of small
intestine histopathology 3 days after Salmonella infection
showed increased infiltration of lymphocytes and plasma cells in
the intestinal mucosa of the STZ+S.T. group compared to the
naïve+S.T. group, with irregular villi, interstitial edema,
vasodilation, and more lymphoplasmacytic infiltration in the small
intestine observed under light microscopy. In addition, changes in
the adipose tissue around the intestinal wall were observed in the
mice, showing more lymphocyte and plasma cell infiltration in the
STZ+S.T. group than the naïve-S.T. group (Fig. 1D).
Meanwhile, the results of H&E staining on
pancreatic tissue in mice showed that the pancreatic islets of
normal mice displayed a scattered distribution, round or oval
shape, regular morphology, round islet cells, abundant cytoplasm
and round and centered nuclei, while that of diabetic mice
presented decreased number, smaller volume, increased nuclear
density of islet cells and reduced cytoplasm. No obvious changes
were observed in mice with Salmonella infection (Fig. 1E). Taken together, the above
results demonstrated that accelerated inflammatory progression and
increased mortality were found in the hyperglycemic mice infected
with Salmonella.
Changes in DCs, macrophages, monocytes and
neutrophils in the intestinal LP of hyperglycemic mice after
Salmonella infection. Three days after Salmonella infection,
we collected the LP from all of the mice, performed collagenase
digestion, and prepared single-cell suspensions to stain with
fluorescent antibodies. For the LP, Alexa 430 was used to label the
dead cells, and single cells were gated for analysis. Cells with
double-positive staining of IA/IE and CD11c were defined as DCs.
Cells with Ly6C and CD11b expression were defined as
Ly6ChiCD11b+ monocytes and
Ly6CintCD11b+ neutrophils. Cells with F4/80
and CD64 expression were defined as
F4/80+CD64+ macrophages. The ratios of DCs
and monocytes in the LP of the STZ+S.T. group were significantly
lower, and the neutrophil ratio was significantly greater than in
the naïve group (Fig. 2A and
B).
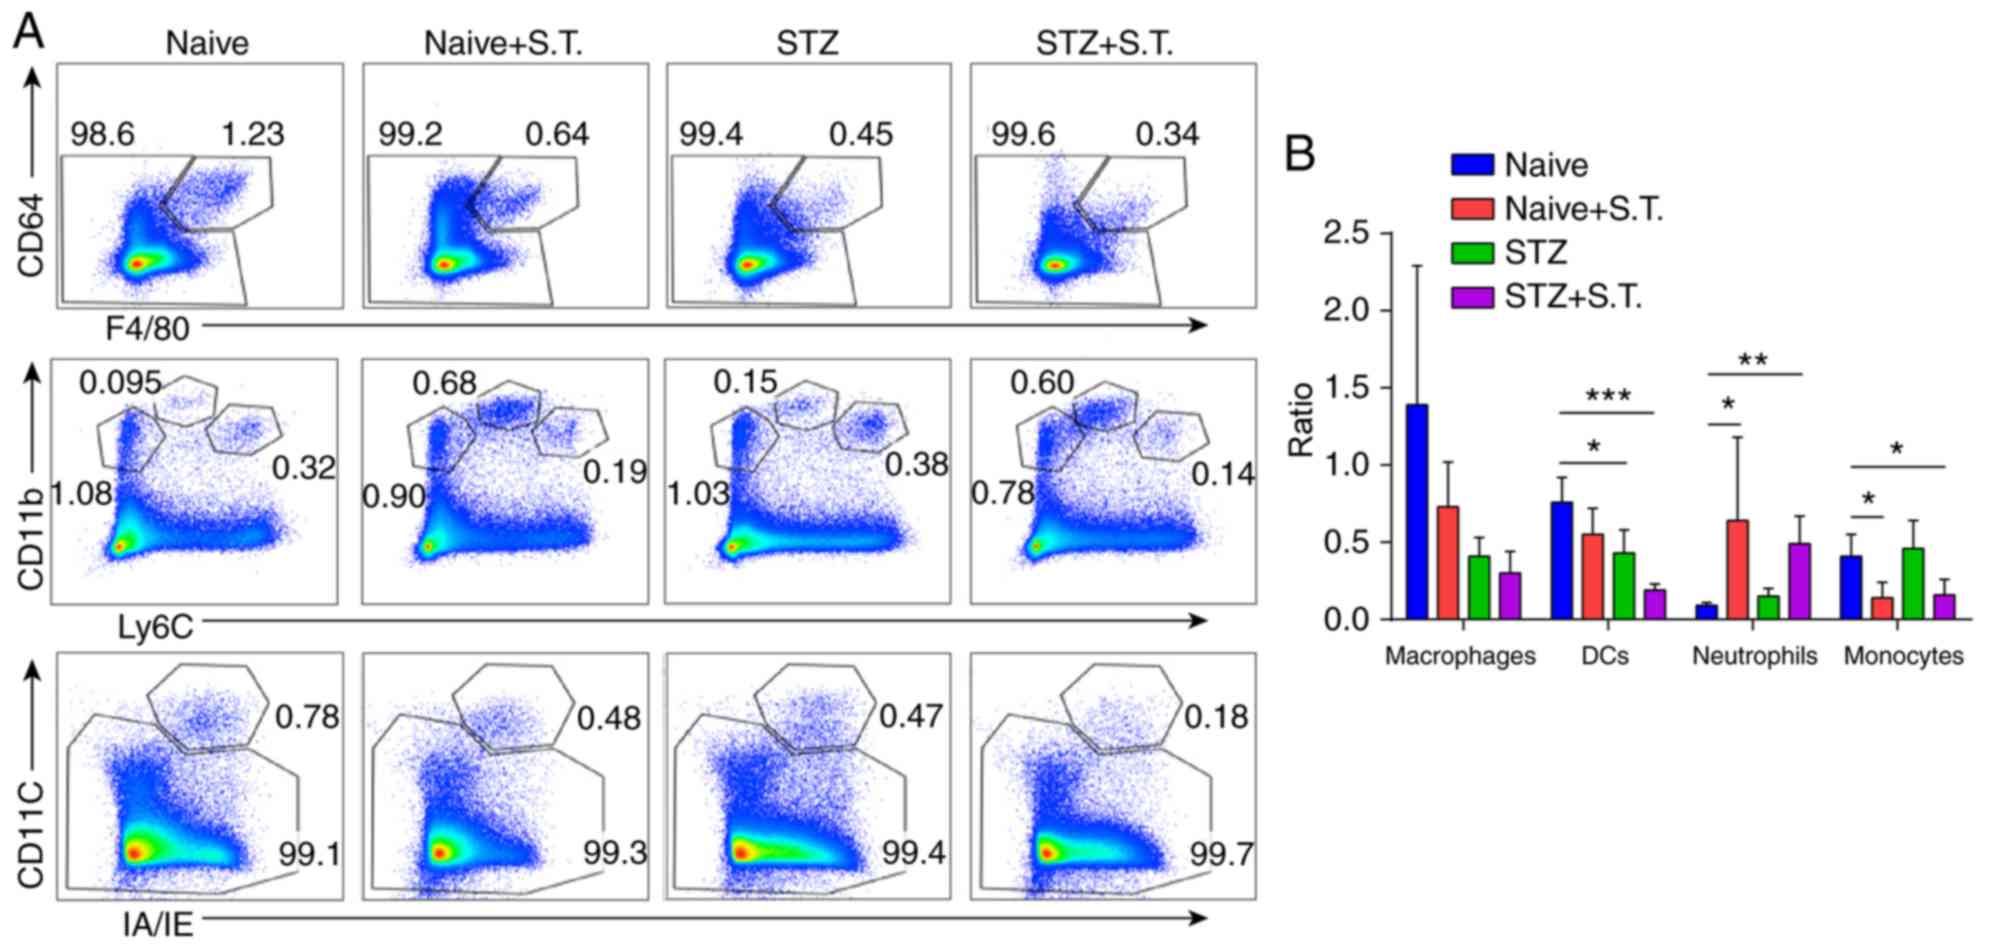 | Figure 2.Changes in DCs, macrophages,
monocytes and neutrophils in the LP of hyperglycemic mice after
Salmonella infection. (A) Flow cytometry analysis evaluating
the changes in IA/IE+CD11c+ double staining
in DCs, Ly6ChiCD11b+ in monocytes,
Ly6CintCD11b+ in neutrophils, and
F4/80+CD64+ in macrophages of the LP in
different groups of mice on day 3 after Salmonella
infection. (B) Graph constructed using GraphPad PRISM showing the
changes in DCs, monocytes, neutrophils, and macrophages in the LP.
*P<0.05, **P<0.01, ***P<0.001 (ANOVA). Means ± standard
deviation are shown (n=5). STZ, streptozotocin; S.T., Salmonella
typhimurium; DCs, dendritic cells; LP, intestinal lamina
propria. |
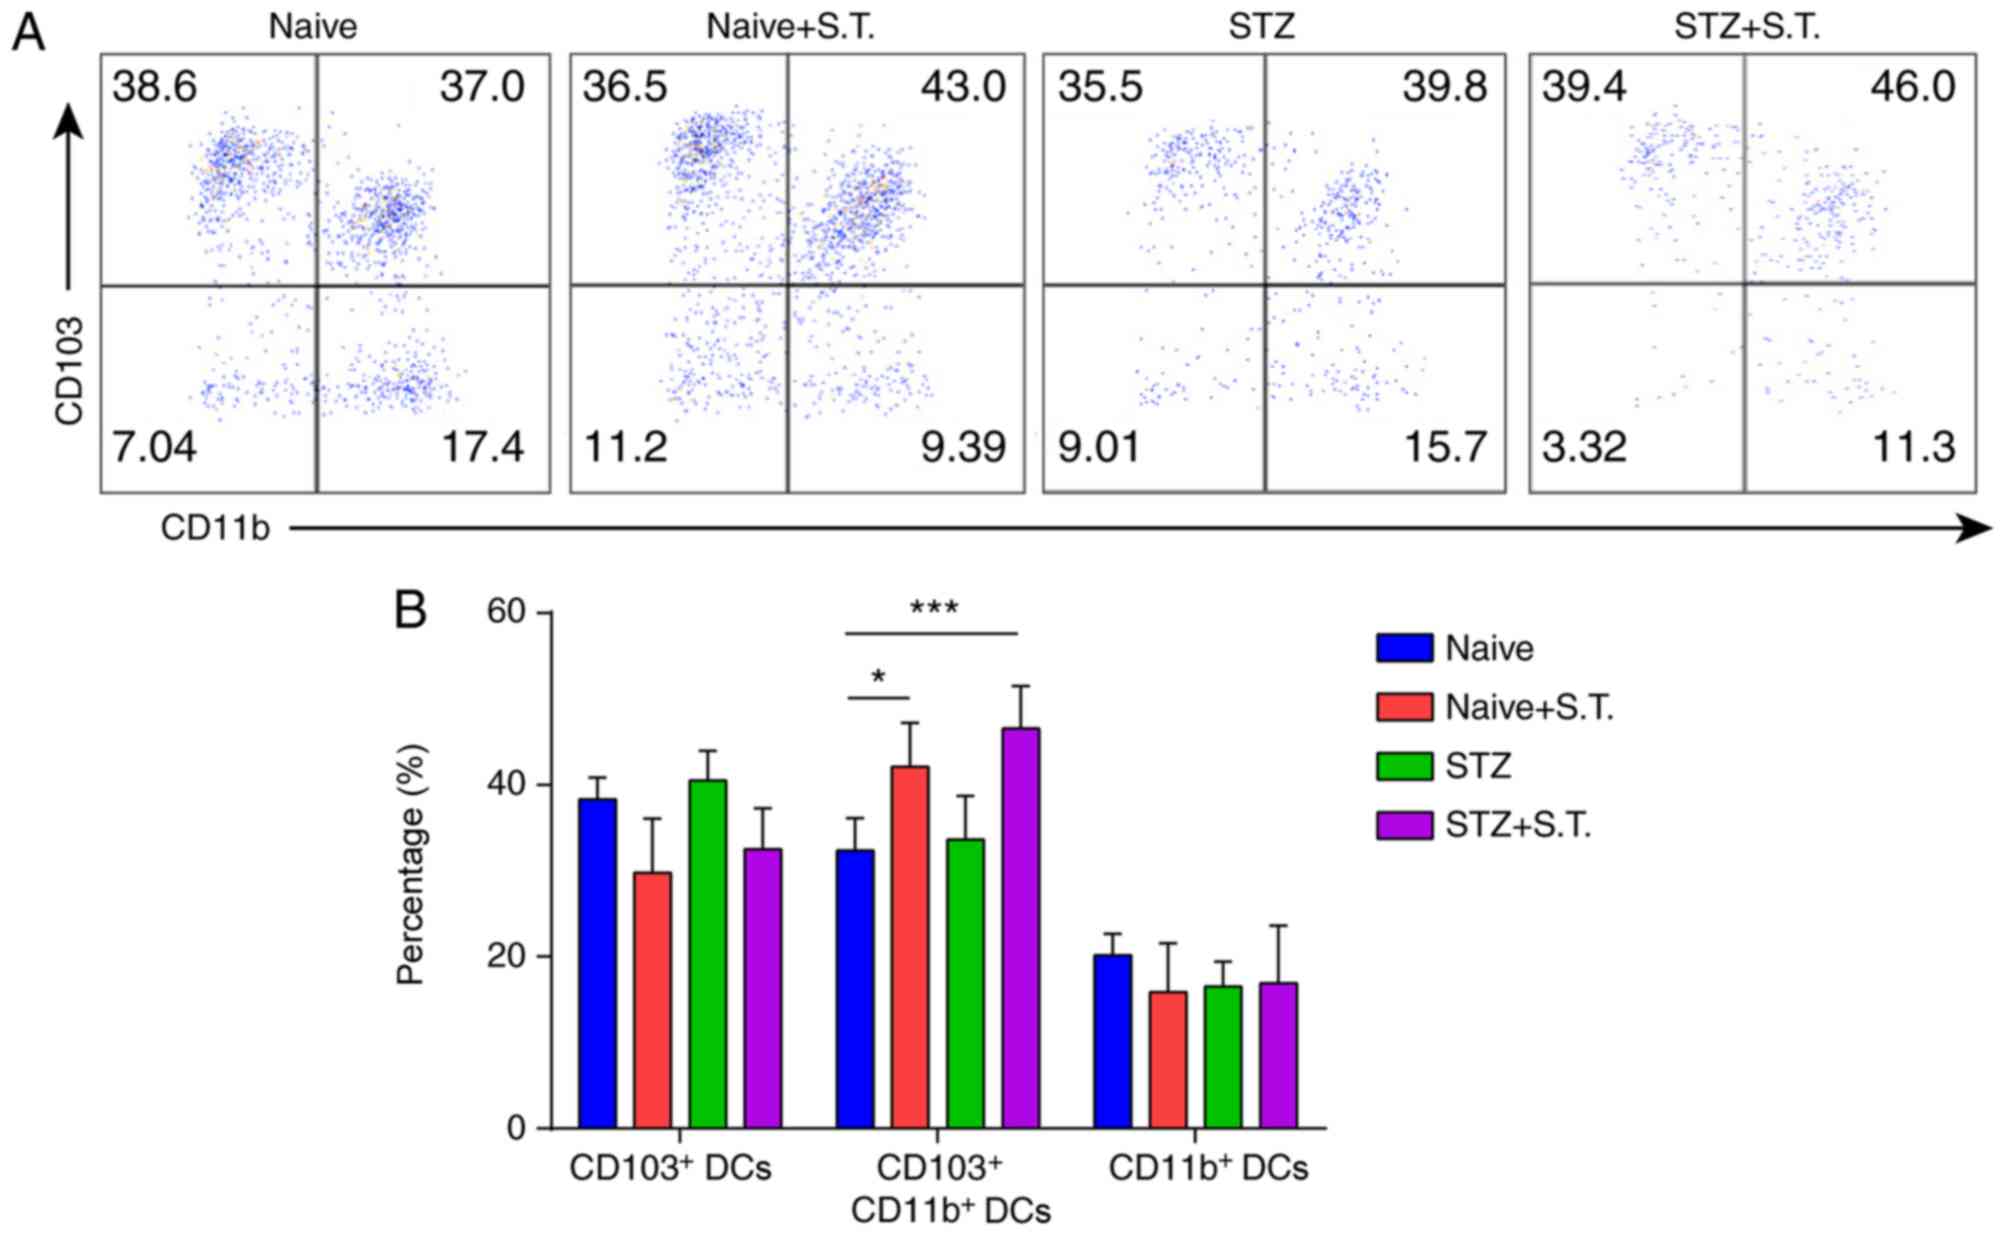
Changes in the DC subpopulations in
the LP of hyperglycemic mice after Salmonella infection
Given the significant reduction of DC ratios in the
LP of hyperglycemic mice on day 3 after Salmonella
infection, we further analyzed the changes in the DC subpopulations
and divided the DCs in the LP into
CD103+CD11b− DC,
CD103+CD11b+ DC and
CD103−CD11b+ DC subpopulations according to
their CD103 and CD11b expression. The proportion of
CD103+CD11b+ DCs was significantly increased
in the hyperglycemic mice after Salmonella infection,
compared with the normal control mice whereas no significant
changes in the other two DC subpopulations were observed in the LP
(Fig. 3A and B).
Changes in
CD4+FoxP3+ Tregs in the LP and MLN of mice
with STZ-induced diabetes after Salmonella infection
On day 3 after Salmonella infection, we
compared the percentage of CD4+FoxP3+ Tregs
in the LP between the STZ+S.T. group and the naïve group and
observed a significant increase in the percentage of
CD4+FoxP3+ Tregs in the LP of the
hyperglycemic mice after Salmonella infection. Subpopulation
analysis showed that the percentage of Helios+ Tregs was
increased, and the Rorgt+ Treg proportion was decreased
(Fig. 4A and B). In contrast, a
prominent decline in the CD4+FoxP3+ Treg
proportion in the MLN was detected in hyperglycemic mice infected
with Salmonella, which was caused by affected Treg
proliferation due to the decline in the percentage of
ki67+ Tregs (Fig. 4C and
D).
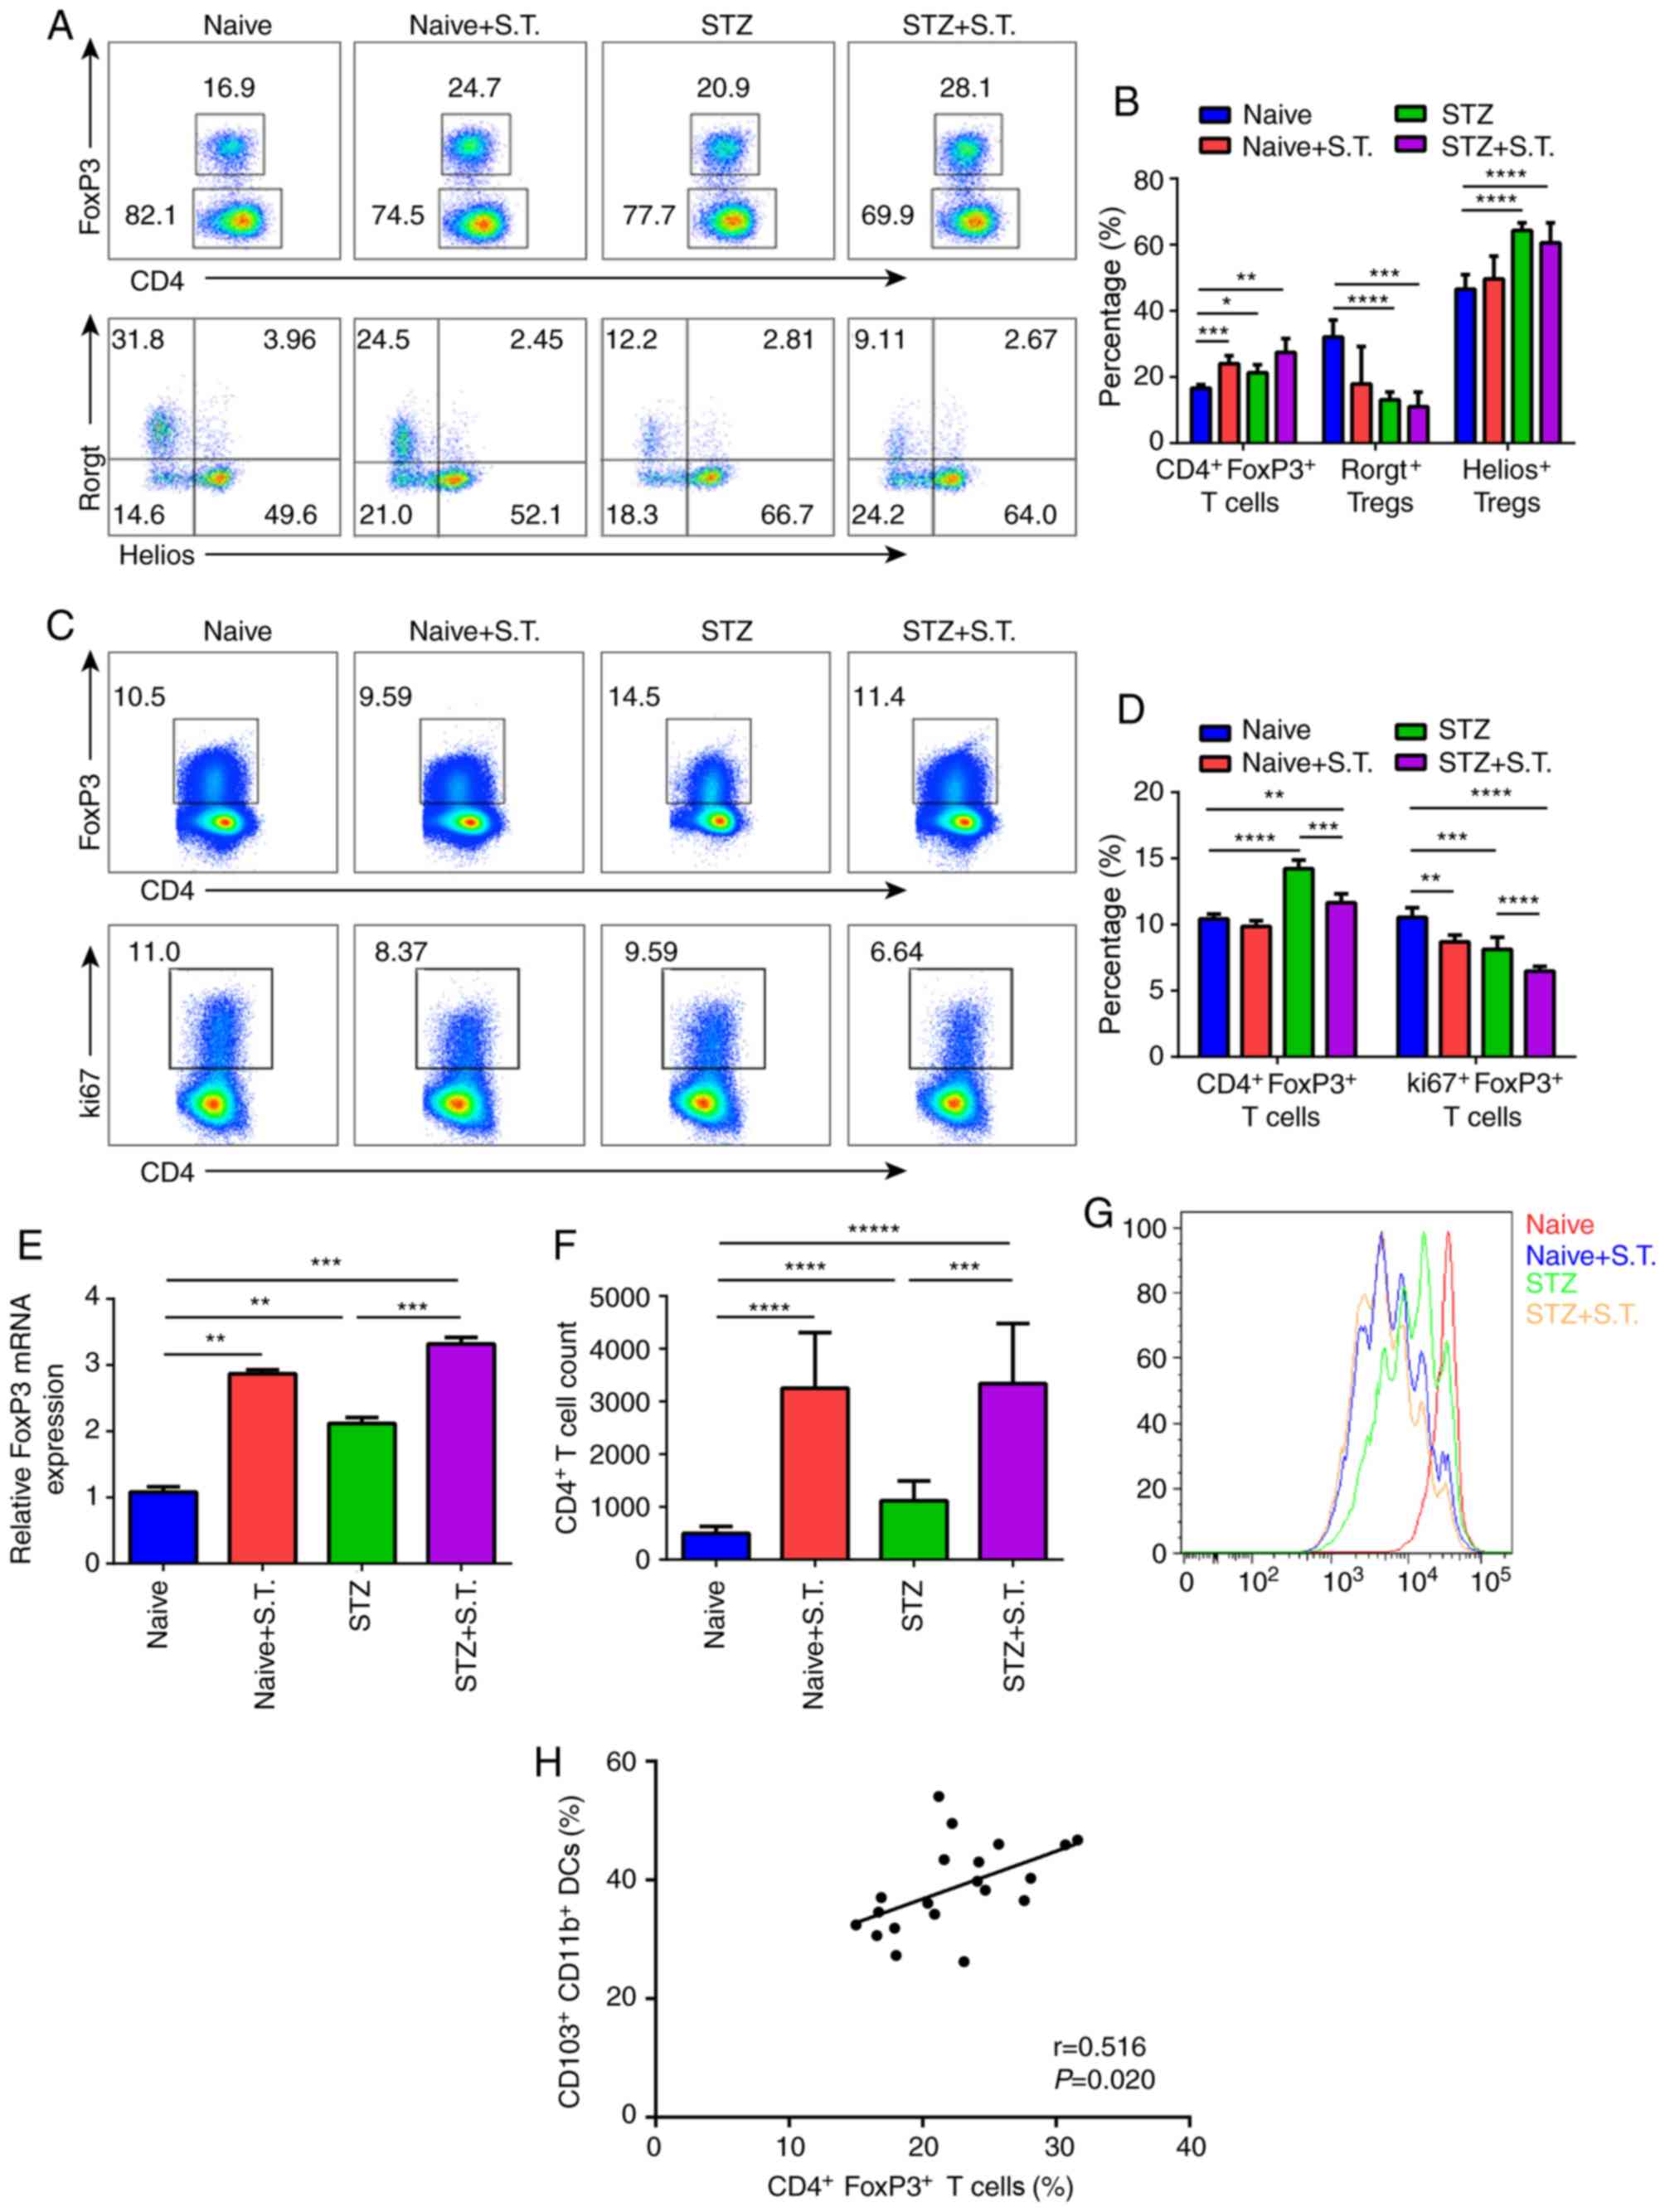 | Figure 4.Changes in
CD4+FoxP3+ Tregs in the LP and MLN of mice
with STZ-induced diabetes after Salmonella infection. (A)
Flow cytometric analysis showing the changes in
CD4+FoxP3+ Tregs in the LP of different
groups of mice on day 3 after Salmonella infection. The
cells were divided into Helios+ Tregs and
Rorgt+ Tregs based on their Helios and Rorgt expression.
(B) Graph constructed using GraphPad PRISM showing the changes in
CD4+FoxP3+ Tregs,
CD4+FoxP3+Helios+ Tregs, and
CD4+FoxP3+Rorgt+ Tregs in the LP.
(C) Flow cytometric analysis showing the changes in
CD4+FoxP3+ Tregs in the MLN of different
groups of mice on day 3 after Salmonella infection; the
analysis of Treg proliferation based on ki67 expression. (D) Graph
constructed using GraphPad PRISM showing the changes in
CD4+FoxP3+ Tregs and ki67+ Tregs
in the MLN. (E) mRNA expression of mouse intestinal FoxP3 on day 3
after Salmonella infection (n=5). The experiment was
repeated 3 times. Means ± standard error of the mean are shown. (F
and G) Three days after Salmonella infection, we sorted
CD103+CD11b+ DCs (5×10⁴
cells/well) from the LP and cocultured them with eFlur450-labeled
OT-II CD4+ T cells (1×10⁵ cells/well) in the
presence of OVA323-339 (10 µg/ml) for 96 h in
vitro. The dilution of eFlur-450 in CD4+ T cells was
analyzed. The histogram shows the number of CD4+ T cells
counted by flow cytometry. (H) Correlation of
CD103+CD11b+ DC cells and
CD4+FoxP3+ Treg cells. *P<0.05,
**P<0.01, ***P<0.001, ****P<0.0001 (ANOVA),
*****P<0.00001. Means ± standard deviation are shown (n=5).
Tregs, regulatory T cells; STZ, streptozotocin; S.T., Salmonella
typhimurium; DCs, dendritic cells; LP, intestinal lamina
propria; MLN, mesenteric lymph nodes. |
Consistent with the results of flow cytometry, mRNA
expression of FoxP3 (a typical transcription factor of Tregs) was
significantly increased in the hyperglycemic mice after
Salmonella infection (Fig.
4E). Meanwhile, we sorted the
CD103+CD11b− DCs,
CD103+CD11b+ DCs and
CD103−CD11b+ DCs from the LP and cocultured
them with CD4+ T cells from OT-II mice. After 4 days, we
found that when infected with Salmonella,
CD103+CD11b+ DCs from STZ-induced diabetic
mice could promote the expansion of CD4+ T cells with a
stronger efficiency (Fig. 4F and
G).
Furthermore, we sorted out
CD103+CD11b+ DC cells (Fig. 3) and
CD4+FoxP3+ Tregs (Fig. 4A and B), and conducted Pearson
correlation analysis on the known data, which showed a positive
correlation between the percentage of
CD103+CD11b+ DCs and
CD4+FoxP3+ Tregs (Fig. 4H; P<0.05).
Discussion
Diabetes is characterized by chronic hyperglycemia,
which is closely related to the environment of hyperglycemia in the
human body. Continuous high glucose increases plasma osmotic
pressure, resulting in chemotaxis, adhesion and phagocytosis of
immune cells, such as leukocytes and mononuclear macrophages
(15). The patient's humoral and
cellular immunity decline, and the body's resistance is reduced.
Hyperglycemia is also a good medium for bacterial growth and
reproduction (16). The chance of
infection is not only increased but also difficult to control. In
addition, infection puts the human body in a state of stress, and
blood glucose reactivity is increased and is difficult to control,
thereby aggravating the infection.
The present study evaluated the changes in different
immune cells and cell subpopulations in the intestinal LP of
hyperglycemic mice after Salmonella infection and showed
that Salmonella infection significantly increased the number
of neutrophils in the hyperglycemic mice, which had significant
inflammation. In addition, cytokine detection showed that the serum
IL-6 concentration was elevated in the hyperglycemic mice after
Salmonella infection, confirming the above finding. H&E
staining for the intestinal histopathology revealed a significant
infiltration of inflammatory cells in the intestinal tissues of
hyperglycemic mice after Salmonella infection. Combined with
the mortality data, hyperglycemic mice with Salmonella
infection died earlier than the C57BL/6 mice with Salmonella
infection, suggesting that hyperglycemia disrupted immune tolerance
and accelerated the occurrence and progression of the bacterial
infection.
In this process, we analyzed the changes in the DC
subpopulations in the LP and showed that the number of DCs in the
LP was reduced in the hyperglycemic mice after Salmonella
infection. In the LP, the CD103+CD11b+ DC
ratio was reduced in the hyperglycemic mice after infection. DCs
are a morphologically, structurally, and functionally heterogeneous
cell population and a key regulatory component that regulates both
intrinsic and adaptive immune responses. DCs are the most potent of
the antigen-presenting cells (APCs) (17). They stimulate initial T cell
proliferation and play an important role in inducing Treg
production (18). The
microenvironment of the intestine allows for the regulatory
function of DCs in the intestine (19). Experimental evidence has shown that
the maintenance of intestinal tolerance depends on DCs. Intestinal
DCs capture antigens in different ways (20). CD103− DCs are the major
DC subpopulation in the LP that engulf antigens. However, this
subpopulation does not stimulate the proliferation of
antigen-specific CD4+ T cells in vitro (21). The other DC subpopulation in the
LP, CD103+ DC, can induce CD4+ T cell
proliferation, although this subpopulation has a weaker ability to
engulf the antigen than the CD103− DC subpopulation
(22,23).
Studies have shown that FoxP3+ Treg
function is reduced in type 1 diabetes mellitus (T1DM), but their
conclusions are based on the Treg phenotypes found in the
peripheral circulation rather than the Treg phenotypes at the site
of tissue injury (8). To better
understand the loss of immune tolerance in T1DM, the key question
that needs to be answered is whether the reduction of the Treg
inhibitory effect is due to changes in the immune system caused by
the development of T1DM or if Treg dysfunction is involved in
disease onset. In this study, the CD4+FoxP3+
Treg ratio in the intestinal LP of the Salmonella-infected
hyperglycemic group was significantly higher than in the
Salmonella-infected control group on day 3 after
Salmonella infection. Additionally, the hyperglycemic mice
infected with Salmonella presented increased mRNA expression
of FoxP3 (a typical transcription factor of Tregs); while without
western blot analysis, we could not conclude that the hyperglycemic
mice infected with Salmonella had more FoxP3. Further
analysis of the changes in the subpopulations indicated an increase
in the Helios+ Treg ratio and decrease in the
Rorgt+ Treg ratio. The increase in the
Helios+ Treg ratio may be negative feedback from the
inflammatory response in the body while the decrease in the
Rorgt+ Treg ratio may lead to an aggravation of
intestinal inflammation. These two Treg changes might occur at
different times, with the Rorgt+ Treg reducing first to
aggravate the inflammation and the Helios+ Treg
increasing subsequently to prepare to suppress the aggravation of
the inflammation. Moreover, the CD4+FoxP3+
Treg ratio in the mesenteric lymph nodes (MLN) was significantly
decreased in hyperglycemic mice after Salmonella infection,
which was caused by decreased ki67 expression in Tregs after
Salmonella infection, suggesting a decreased number due to
altered Treg proliferation ability. In addition, Boehm et al
(24) showed that depletion of
FoxP3 could promote intestinal inflammatory responses, suggesting
that FoxP3 plays an important but complex function during this
progress.
We sorted the CD103+CD11b−
DCs, CD103+CD11b+ DCs and
CD103−CD11b+ DCs from the LP and cocultured
them with CD4+ T cells from OT-II mice. We found that
when infected with Salmonella,
CD103+CD11b+ DCs in STZ-induced diabetic mice
could promote the expansion of CD4+ T cells with a
stronger efficiency. This correlation analysis showed that the
elevation of CD4+FoxP3+ Tregs was correlated
with the increased number of CD103+CD11b+ DCs
in this model. As the only DC subset that presents food protein and
bacterial antigens to T cells, intestinal CD103+ DCs
have attracted the attention of immunologists due to their
functions in oral tolerance. Distinct from CD103− DCs,
these CD103+ DCs express high levels of CCR6, CCR7, TLR5
and TLR9, but low levels of costimulatory molecules and
inflammatory molecules (25).
Chemokines are important regulators in the maintenance of
intestinal immune tolerance. CD103+ DCs can migrate into
the MLN in a CCR7-dependent manner, where they present intestinal
antigens to T cells and induce the expression of homing-associated
molecules CCR9 and α4β7 on T cells (26). CD103+ DCs are the only
population that can induce the expression of homing-associated
molecules on T cells and B cells in the intestine. The expression
of homing-associated molecules CCR9 and α4β7 could help T cells and
B cells home back into the intestinal mucosa. Alternatively,
CD103+ DCs can function by inducing Tregs.
CD103+ DCs may promote the induction of
FoxP3+ Tregs by TGF-β and retinoic acid. They may also
help IDO catalyze tyrosine and then release hazardous metabolites,
thus inhibiting effector T cells and inducing Tregs (27). CD11b+ DC could induce
the differentiation of antigen-specific naive CD4+ T
cells into regulatory CD4+ T cells by secreting IL-10
and IL-27, which causes oral tolerance (28).
In summary, the Treg ratio in the intestinal LP was
elevated, which may be due to the stimulation of antigen-specific
CD4+ T cell proliferation and their differentiation into
FoxP3+ Tregs to maintain intestinal homeostasis after
CD103+CD11b+ DC capture of Salmonella
in the LP. With more in-depth studies on T1DM target organs,
Treg-mediated immune regulation in T1DM will be more clearly
revealed, providing a fundamental basis for establishing a
methodology to treat hyperglycemia-associated infectious diseases.
However, additional sample numbers are needed to verify the
relationship between CD4+FoxP3+ Tregs and
CD103+CD11b+ DCs.
Acknowledgements
Not applicable.
Funding
This work was supported by the National Natural
Science Foundation of China (grant no. 81172882).
Availability of data and materials
The datasets used and/or analyzed during the
current study are available from the corresponding author on
reasonable request.
Authors' contributions
SZ conceived and designed the study together with
MW and XW. HL and HT were involved in data collection. SZ, MW and
XL performed the statistical analysis and prepared the figures. XW
drafted the paper. HL and HT contributed substantially to its
revision. All authors read and approved the final manuscript.
Ethics approval and consent to
participate
This study was approved by the Laboratory Animal
Care Committee of Taishan Medical University (Taian, China), and
all animal experiments were conducted in accordance with the
Guidelines of the Care and Use of Laboratory Animals of Taishan
Medical University.
Patient consent for publication
Not applicable.
Competing interests
The authors declare that they have no competing
interests.
References
|
1
|
Cho NH, Shaw JE, Karuranga S, Huang Y, da
Rocha Fernandes JD, Ohlrogge AW and Malanda B: IDF Diabetes Atlas:
Global estimates of diabetes prevalence for 2017 and projections
for 2045. Diabetes Res Clin Pract. 138:271–281. 2018. View Article : Google Scholar : PubMed/NCBI
|
|
2
|
Hooper LV and Macpherson AJ: Immune
adaptations that maintain homeostasis with the intestinal
microbiota. Nat Rev Immunol. 10:159–169. 2010. View Article : Google Scholar : PubMed/NCBI
|
|
3
|
Vickery BP, Scurlock AM, Jones SM and Burk
AW: Mechanisms of immune tolerance relevant to food allergy. J
Allergy Clin Immunol. 127:576–586. 2011. View Article : Google Scholar : PubMed/NCBI
|
|
4
|
Steele-Mortimer O: The
Salmonella-containing vacuole: Moving with the times. Curr Opin
Microbiol. 11:38–45. 2008. View Article : Google Scholar : PubMed/NCBI
|
|
5
|
Ohkura N, Kitagawa Y and Sakaguchi S:
Development and maintenance of regulatory T cells. Immunity.
38:414–423. 2013. View Article : Google Scholar : PubMed/NCBI
|
|
6
|
Lindley S, Dayan CM, Bishop A, Roep BO,
Peakman M and Tree TI: Defective suppressor function in
CD4(+)CD25(+) T-cells from patients with type 1 diabetes. Diabetes.
54:92–99. 2005. View Article : Google Scholar : PubMed/NCBI
|
|
7
|
Putnam AL, Vendrame F, Dotta F and
Gottlieb PA: CD4+CD25high regulatory T cells
in human autoimmune diabetes. J Autoimmun. 24:55–62. 2005.
View Article : Google Scholar : PubMed/NCBI
|
|
8
|
Zhang XX, Qiao YC, Li W, Zou X, Chen YL,
Shen J, Liao QY, Zhang QJ, He L and Zhao HL: Human amylin induces
CD4+Foxp3+ regulatory T cells in the
protection from autoimmune diabetes. Immunol Res. 66:179–186. 2018.
View Article : Google Scholar : PubMed/NCBI
|
|
9
|
Eizirik DL and Mandrup-Poulsen T: A choice
of death-the signal-transduction of immune-mediated beta-cell
apoptosis. Diabetologia. 44:2115–2133. 2001. View Article : Google Scholar : PubMed/NCBI
|
|
10
|
Serreze DV, Chapman HD, Varnum DS, Hanson
MS, Reifsnyder PC, Richard SD, Fleming SA, Leiter EH and Shultz LD:
B lymphocytes are essential for the initiation of T cell-mediated
autoimmune diabetes: Analysis of a new ‘speed congenic’ stock of
NOD.Ig mu null mice. J Exp Med. 184:2049–2053. 1996. View Article : Google Scholar : PubMed/NCBI
|
|
11
|
Salahuddin M, Jalalpure SS and Gadge NB:
Antidiabetic activity of aqueous bark extract of Cassia glauca in
streptozotocin-induced diabetic rats. Can J Physiol Pharmacol.
88:153–160. 2010. View Article : Google Scholar : PubMed/NCBI
|
|
12
|
Zenk SF, Jantsch J and Hensel M: Role of
Salmonella enterica lipopolysaccharide in activation of dendritic
cell functions and bacterial containment. J Immunol. 183:2697–2707.
2009. View Article : Google Scholar : PubMed/NCBI
|
|
13
|
Livak KJ and Schmittgen TD: Analysis of
relative gene expression data using real-time quantitative PCR and
the 2(-Delta Delta C(T)) method. Methods. 25:402–408. 2001.
View Article : Google Scholar : PubMed/NCBI
|
|
14
|
Voedisch S, Koenecke C, David S, Herbrand
H, Förster R, Rhen M and Pabst O: Mesenteric lymph nodes confine
dendritic cell-mediated dissemination of Salmonella enterica
serovar Typhimurium and limit systemic disease in mice. Infect
Immun. 77:3170–3180. 2009. View Article : Google Scholar : PubMed/NCBI
|
|
15
|
Guariguata L, Whiting DR, Hambleton I,
Beagley J, Linnenkamp U and Shaw JE: Global estimates of diabetes
prevalence for 2013 and projections for 2035. Diabetes Res Clin
Pract. 103:137–149. 2014. View Article : Google Scholar : PubMed/NCBI
|
|
16
|
Bezuglova AM, Konenkova LP, Doronin BM,
Buneva VN and Nevinsky GA: Affinity and catalytic heterogeneity and
metal-dependence of polyclonal myelin basic protein-hydrolyzing
IgGs from sera of patients with systemic lupus erythematosus. J Mol
Recognit. 24:960–974. 2011. View Article : Google Scholar : PubMed/NCBI
|
|
17
|
Steinman RM: Dendritic cells in vivo: A
key target for a new vaccine science. Immunity. 29:319–324. 2008.
View Article : Google Scholar : PubMed/NCBI
|
|
18
|
Pulendran B, Tang H and Manicassamy S:
Programming dendritic cells to induce T(H)2 and tolerogenic
responses. Nat Immunol. 11:647–655. 2010. View Article : Google Scholar : PubMed/NCBI
|
|
19
|
Bekiaris V, Persson EK and Agace WW:
Intestinal dendritic cells in the regulation of mucosal immunity.
Immunol Rev. 260:86–101. 2014. View Article : Google Scholar : PubMed/NCBI
|
|
20
|
Ko HJ and Chang SY: Regulation of
intestinal immune system by dendritic cells. Immune Netw. 15:1–8.
2015. View Article : Google Scholar : PubMed/NCBI
|
|
21
|
Coombes JL and Powrie F: Dendritic cells
in intestinal immune regulation. Nat Rev Immunol. 8:435–446. 2008.
View Article : Google Scholar : PubMed/NCBI
|
|
22
|
Schulz O, Jaensson E, Persson EK, Liu X,
Worbs T, Agace WW and Pabst O: Intestinal CD103+, but
not CX3CR1+, antigen sampling cells migrate in lymph and
serve classical dendritic cell functions. J Exp Med. 206:3101–3114.
2009. View Article : Google Scholar : PubMed/NCBI
|
|
23
|
Jaensson E, Uronen-Hansson H, Pabst O,
Eksteen B, Tian J, Coombes JL, Berg PL, Davidsson T, Powrie F,
Johansson-Lindbom B and Agace WW: Small intestinal
CD103+ dendritic cells display unique functional
properties that are conserved between mice and humans. J Exp Med.
205:2139–2149. 2008. View Article : Google Scholar : PubMed/NCBI
|
|
24
|
Boehm F, Martin M, Kesselring R, Schiechl
G, Geissler EK, Schlitt HJ and Fichtner-Feigl S: Deletion of
Foxp3+ regulatory T cells in genetically targeted mice
supports development of intestinal inflammation. BMC Gastroenterol.
12:972012. View Article : Google Scholar : PubMed/NCBI
|
|
25
|
Jang MH, Sougawa N, Tanaka T, Hirata T,
Hiroi T, Tohya K, Guo Z, Umemoto E, Ebisuno Y, Yang BG, et al: CCR7
is critically important for migration of dendritic cells in
intestinal lamina propria to mesenteric lymph nodes. J Immunol.
176:803–810. 2006. View Article : Google Scholar : PubMed/NCBI
|
|
26
|
Correction to Lancet Diabetes Endocrinol
2018; 6, . 186-96. Lancet Diabetes Endocrinol. 6:e42018.PubMed/NCBI
|
|
27
|
Matteoli G, Mazzini E, Iliev ID, Mileti E,
Fallarino F and Puccetti P: Gut CD103+ dendritic cells
express indoleamine 2,3-dioxygenase which influences T regulatory/T
effector cell balance and oral tolerance induction. Gut.
59:595–604. 2010. View Article : Google Scholar : PubMed/NCBI
|
|
28
|
Shiokawa A, Tanabe K, Tsuji NM Sato R and
Hachimura S: Hachimura, IL-10 and IL-27 producing dendritic cells
capable of enhancing IL-10 production of T cells are induced in
oral tolerance. Immunol Lett. 125:7–14. 2009. View Article : Google Scholar : PubMed/NCBI
|