Introduction
Ossification of ligamentum flavum (OLF) is a
relatively common spinal disorder in Eastern Asian countries, with
an estimated prevalence of 63.9% in Chinese (1), 36% in Japanese (2) and 16.9% in Korean (3) populations. OLF is characterized by
ectopic bone formation in the spinal ligaments and ligamentous
tissue hyperplasia (4) that cause
spinal canal narrowing and result in the development of myelopathy
and radiculopathy (5,6). Surgery is the predominant treatment
option for OLF; however, the difficulty of surgery and a relatively
high risk of complications have to be taken into consideration
(7). Therefore, it is necessary to
develop more effective, convenient and safe approaches for the
treatment of OLF; an improved understanding of its molecular
mechanisms may provide insight.
Although the pathogenesis of OLF remains to be
elucidated, abnormal expression of osteogenic differentiation and
cell proliferation related genes in LF cells may serve important
roles (8). The mRNA levels of
osteogenic markers [alkaline phosphatase (ALP), runt-related
transcription factor 2, osterix and osteopontin)] in addition to
signaling pathway genes [bone morphogenetic proteins (BMPs),
Wnt/β-catenin and Notch] (9,10),
were identified to be higher in patients with OLF compared with
non-OLF subjects. Recombinant BMP2 or BMP14 [also known as
growth/differentiation factor (GDF) 5] modification induced the
osteoblastic differentiation of LF cells and promoted bone nodule
formation, finally triggering neurological impairment in rat models
(11,12), while downregulation of Notch2
ameliorated the processes (10).
In addition to accelerating osteoblast differentiation via osterix,
highly expressed pro-inflammatory cytokines [tumor necrosis factor
(TNF)-α, interleukin (IL)-1a and IL-6] appear to stimulate cell
proliferation and tissue hypertrophy by upregulating cyclin D1 and
c-Myc in OLF (13–15). Therefore, targeted regulation of
these genes may be potential strategies for the treatment of
OLF.
A potential way to endogenously regulate the
expression levels of target mRNAs is through microRNAs
(miRNAs/miRs) that bind to the 3′-untranslated regions of target
genes and subsequently mediate their degradation or translation
inhibition (16). Therefore,
researchers are exploring the crucial miRNAs that regulate the
expression of osteogenic differentiation related genes in OLF.
miR-132-3p and miR-615-3p have been demonstrated to be
downregulated during osteogenic differentiation of LF cells
(17,18). Overexpression of miR-615-3p by its
mimics suppressed the osteogenic differentiation of LF cells by
reducing the expression of GDF5 (17). miR-199b-5p and miR-487b-3p were
reported to inhibit osteogenic differentiation in LF cells by
downregulating Notch and Wnt signaling pathway genes, respectively
(19,20). However, the OLF-related miRNAs have
rarely been reported and the inflammation-associated miRNAs in OLF
have not been identified.
In addition to miRNAs, long non-coding RNAs
(lncRNAs) are considered to be crucial in regulating the expression
of genes. lncRNAs can competitively bind to miRNAs through their
miRNA response elements and influence the regulation of miRNAs for
mRNAs, which is called the competing endogenous RNA (ceRNA)
hypothesis (21). Therefore,
lncRNAs may also be important targets for the treatment of OLF.
However, OLF-related lncRNAs are rarely reported, with the
exception of the a previous study by Han et al (22).
The aim of the present study was to use the datasets
uploaded by Han et al (22)
to further identify novel miRNAs and crucial lncRNAs for OLF based
on the miRNA-mRNA and lncRNA-miRNA-mRNA ceRNA regulatory networks.
The findings may provide insight for underlying therapeutic
strategies for OLF by changing the expression levels of miRNAs and
lncRNAs, which could in turn regulate the target genes.
Materials and methods
Data sources
A total of two datasets under accession numbers
GSE106253 and GSE106256 (22) were
downloaded from the Gene Expression Omnibus (GEO) database
(http://www.ncbi.nlm.nih.gov/geo/) on
July 2018. The GSE106253 dataset was analyzed to examine the mRNA
and lncRNA expression profiles using the microarray technique
(platform: GPL21827, Agilent-079487 Arraystar Human LncRNA
microarray V4). Then, GSE106256 dataset was analyzed to detect the
miRNA expression profile using high throughput sequencing
(platform: GPL18573, Illumina NextSeq 500). These two datasets
contained the LF tissues from 4 patients with OLF and 4 healthy
volunteers.
Data preprocessing and differential
analysis
The raw TXT data were collected from the GEO
database and preprocessed using the Linear Models for Microarray
data (LIMMA) method (23) (version
3.34.0; http://www.bioconductor.org/packages/release/bioc/html/limma.html)
in the Bioconductor R package (version 3.4.1; http://www.R-project.org/), including base-2
logarithmic (log2) transformation to normalize the skewed
distribution, followed by quantile normalization. For the GSE106253
microarray data, all the probe sequences downloaded from the
annotation platform GPL21827 were aligned and compared with the
human genome using Clustal W program (version 2; http://www.clustal.org/) (24) to obtain the expression levels of
lncRNA and mRNAs.
The differentially expressed genes (DEGs),
differentially expressed lncRNAs (DELs) and differentially
expressed miRNAs (DEMs) between the patients with OLF and the
healthy controls were identified using the LIMMA method (23). DEGs, DELs and DEMs were screened
based on the statistical threshold of |logFC (fold change)| >1
and false discovery rates (FDR) <0.05. Two-way hierarchical
clustering was performed using pheatmap R package (version: 1.0.8;
http://cran.r-project.org/web/packages/pheatmap)
based on Euclidean distance to render a heatmap of DEGs, DELs and
DEMs.
Protein-protein interaction (PPI)
network of DEGs
The DEGs were mapped to the Search Tool for the
Retrieval of Interacting Genes (STRING; version 10.0; http://string db.org/) database (25) to acquire PPI pairs. Then, the PPI
network was constructed using these PPI pairs and visualized using
Cytoscape software (version 3.6.1; www.cytoscape.org/) (26). Topological features of each node
(protein) in the PPI network, including degree [the number of edges
(interactions) of a node] and betweenness (BC; the number of
shortest paths that run through a node), were used to screen hub
candidate markers that serve crucial roles in OLF using the CytoNCA
plugin in Cytoscape software (http://apps.cytoscape.org/apps/cytonca) (27). The Molecular Complex Detection
(MCODE; version:1.4.2, http://apps.cytoscape.org/apps/mcode) (28) plugin of the Cytoscape software was
applied to extract highly interconnected sub-modules from the
overall PPI network.
DEMs-regulated lncRNAs and genes
The DEMs regulated target genes were predicted using
the miRwalk database (version 2.0; http://www.zmf.umm.uni-heidelberg.de/apps/zmf/mirwalk2)
(29). The DEMs regulated lncRNAs
were predicted using the starBase database (version 2.0; http://starbase.sysu.edu.cn/index.php)
(30). The target genes and
lncRNAs of DEMs were respectively overlapped with the DEGs and DELs
to obtain the DEM-DEG and DEM-DEL interaction networks, which were
visualized using Cytoscape software (26). Based on the common miRNAs, the
DEM-DEG and DEM-DEL networks were integrated to form a DEL-DEM-DEG
ceRNA network, which was also visualized using Cytoscape software
(26).
Function enrichment analysis
Gene Ontology (GO; release 2018-10-01; http://www.geneontology.org) term and The Kyoto
Encyclopedia of Genes and Genomes (KEGG; release 88.0; http://www.kegg.jp) pathway enrichment analyses were
conducted for genes in each sub-module network and all regulatory
networks using the Biological Networks Gene Ontology (BINGO;
version 3.0.3; http://www.psb.ugent.be/cbd/papers/BiNGO/Home.html)
and the Database for Annotation, Visualization and Integrated
Discovery (DAVID; version 6.8; http://david.abcc.ncifcrf.gov) (31) tools. P<0.05 was considered to
indicate a statistically significant difference.
Results
Expression pattern of mRNA, lncRNAs
and miRNAs in OLF
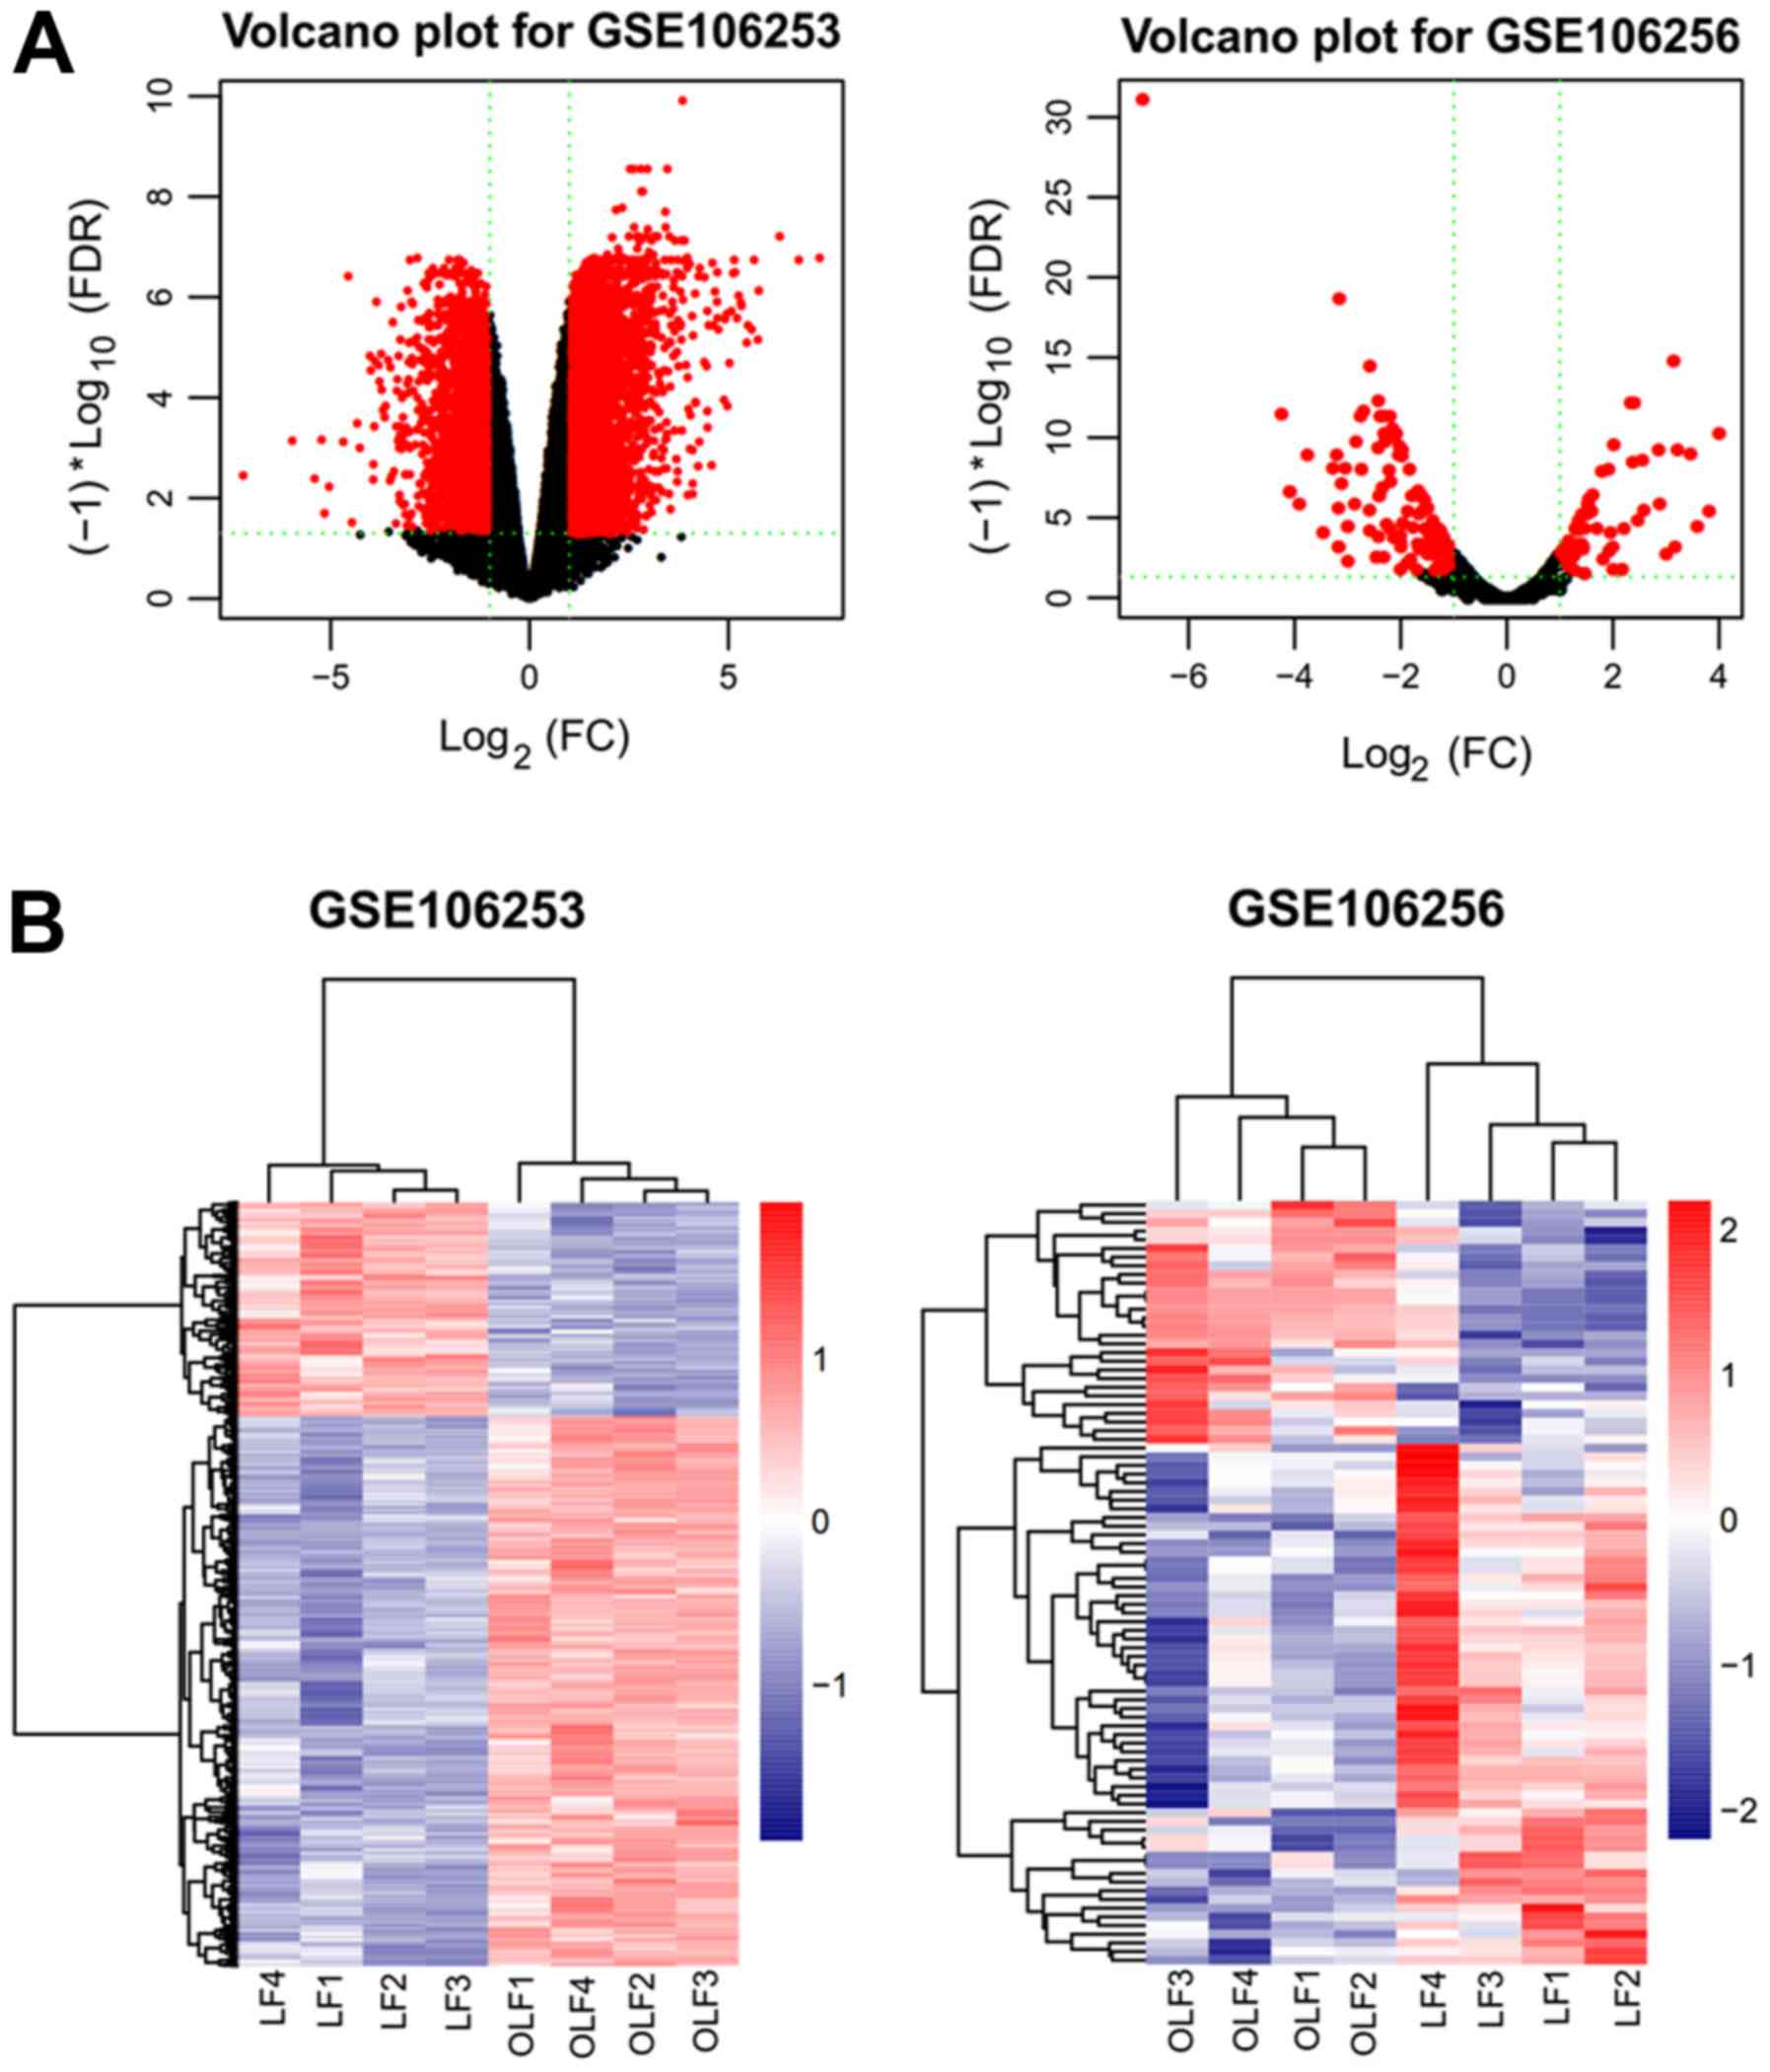
Based on the cut-off criteria (FDR <0.05 and
|logFC| >1), a total of 828 DEGs (434 upregulated and 394
downregulated) and 119 DELs (94 upregulated and 25 downregulated)
were identified in the gene chip GSE106253 (Fig. 1A); 81 DEMs, with 25 upregulated and
56 downregulated, were identified in the gene chip GSE106256
(Fig. 1A). The top 20
dys-regulated DEGs, DELs and DEMs are summarized in Table I. The hierarchically clustered heat
map indicated that the DEGs and DELs in GSE106253 (Fig. 1B), and DEMs in GSE106256 (Fig. 1B) were well categorized into OLF
and control groups.
 | Table I.Top 10 upregulated and downregulated
differentially expressed genes, lncRNAs and miRNAs. |
Table I.
Top 10 upregulated and downregulated
differentially expressed genes, lncRNAs and miRNAs.
| A, Upregulated |
|---|
|
|---|
| miRNA | FDR | logFC | lncRNA | FDR | logFC | mRNA | FDR | logFC |
|---|
| hsa-miR-653-3p |
8.30×10⁴ | 4.00 | LINC01549 |
2.31×10² | 5.50 | PKIB |
6.80×10³ | 6.29 |
| hsa-miR-489-3p |
2.33×10² | 3.81 | CLSTN2-AS1 |
1.45×10² | 4.678 | AMTN |
2.95×10² | 5.47 |
| hsa-miR-508-3p |
4.51×10² | 3.59 | LINC00347 |
2.04×10² | 4.09 | WISP3 |
1.77×10² | 5.34 |
| hsa-miR-4683 |
1.95×10³ | 3.46 | LINC02203 |
7.15×10³ | 3.84 | ADCYAP1 |
1.70×10² | 5.32 |
| hsa-miR-138-5p |
1.70×10³ | 3.22 | LINC01508 |
4.07×10² | 3.75 | COL9A1 |
1.11×10² | 5.17 |
| hsa-miR-653-5p |
3.54×10⁵ | 3.14 | WASIR2 |
1.07×10² | 3.22 | SERPINA11 | 1.13E-02 | 5.13 |
| hsa-miR-4473 |
1.72×10² | 2.88 | LINC01440 |
9.83×10³ | 3.18 | CLEC3A |
1.89×10² | 5.08 |
| hsa-miR-483-3p |
1.65×10³ | 2.86 | LINC02249 |
1.12×10² | 3.14 | SLITRK6 |
3.88×10² | 5.03 |
|
hsa-miR-181b-3p |
2.28×10² | 2.58 | DSG1-AS1 |
2.27×10² | 3.07 | ZMAT4 |
2.11×10² | 4.92 |
|
| B,
Downregulated |
|
| miRNA | FDR | logFC | lncRNA | FDR | logFC | mRNA | FDR | logFC |
|
| hsa-miR-495-3p |
2.41×10⁶ | −3.16 | LINC01706 |
2.24×10² | 3.06 | ITIH6 |
1.11×10² | 4.73 |
| hsa-miR-495-3p |
2.41×10⁶ | −3.16 | LINC00601 |
3.88×10² | −1.839 | FAM3B |
1.43×10² | −3.06 |
| hsa-miR-377-5p |
2.07×10² | −3.18 | LINC01730 |
4.24×10² | −1.85 | ZIC3 |
1.79×10² | −3.22 |
|
hsa-miR-551b-3p |
2.04×10³ | −3.21 | FAM230B |
2.48×10² | −1.88 | ANGPTL4 |
4.87×10² | −3.31 |
| hsa-miR-369-5p |
3.61×10³ | −3.28 | FLG-AS1 |
1.63×10² | −1.93 | SOCS3 |
2.20×10² | −3.43 |
|
hsa-miR-1185-1-3p |
2.11×10³ | 3.76 | SNHG16 |
2.56×10² | −2.06 | GPT |
4.11×10² | −3.49 |
| hsa-miR-539-3p |
1.72×10² | −3.91 | LINC01615 |
2.14×10² | −2.08 | ADAMTS4 |
3.43×10² | −3.73 |
| hsa-miR-222-5p |
1.02×10² | −4.09 | HIPK1-AS1 |
1.98×10² | −2.30 | GPD1 |
4.02×10² | −3.79 |
| hsa-miR-412-5p |
1.02×10² | −4.09 | LINC01485 |
3.95×10² | −2.53 | FAM71A |
1.67×10² | −3.84 |
| hsa-miR-4443 |
3.53×10⁴ | −4.25 | MEG3 |
2.80×10² | −2.53 | SAA1 |
3.77×10² | −3.89 |
| hsa-miR-122-5p |
4.40×10¹⁰ | −6.87 | VPS9D1-AS1 |
1.30×10² | −2.65 | CCL2 |
4.29×10² | −3.99 |
DEGs interaction network
construction
By searching the STRING database, 859 interaction
pairs between DEGs were collected, which were used to create a PPI
network, consisting of 372 nodes (168 upregulated and 204
downregulated; data not shown). A total of 14 nodes were identified
and the top 30 genes were ranked following the calculation of the
two topological features (the degree and BC), suggesting that 14
genes [vascular endothelial growth factor (VEGF) A, BMP4, catenin β
(CTNNB) 1, G protein subunit gamma (GNG) 4, AKT serine/threonine
kinase 1 (AKT1); POTE ankyrin domain family member (POTE) J, SH3
domain containing GRB2 like (SH3GL) 1, endophilin A2, IL10,
intercellular adhesion molecule (ICAM) 1, MYC proto-oncogene (MYC),
bHLH transcription factor, adenylate cyclase (ADCY) 5, suppressor
of cytokine signaling (SOCS) 3, C-C motif chemokine ligand (CCL) 5
and integrin subunit α (ITGA) 4] may be hub genes in the PPI
network (Table II). In addition,
several collagen genes, including collagen type II α 1 chain
(COL2A1) and collagen type XIII α 1 chain (COL13A1) may be also
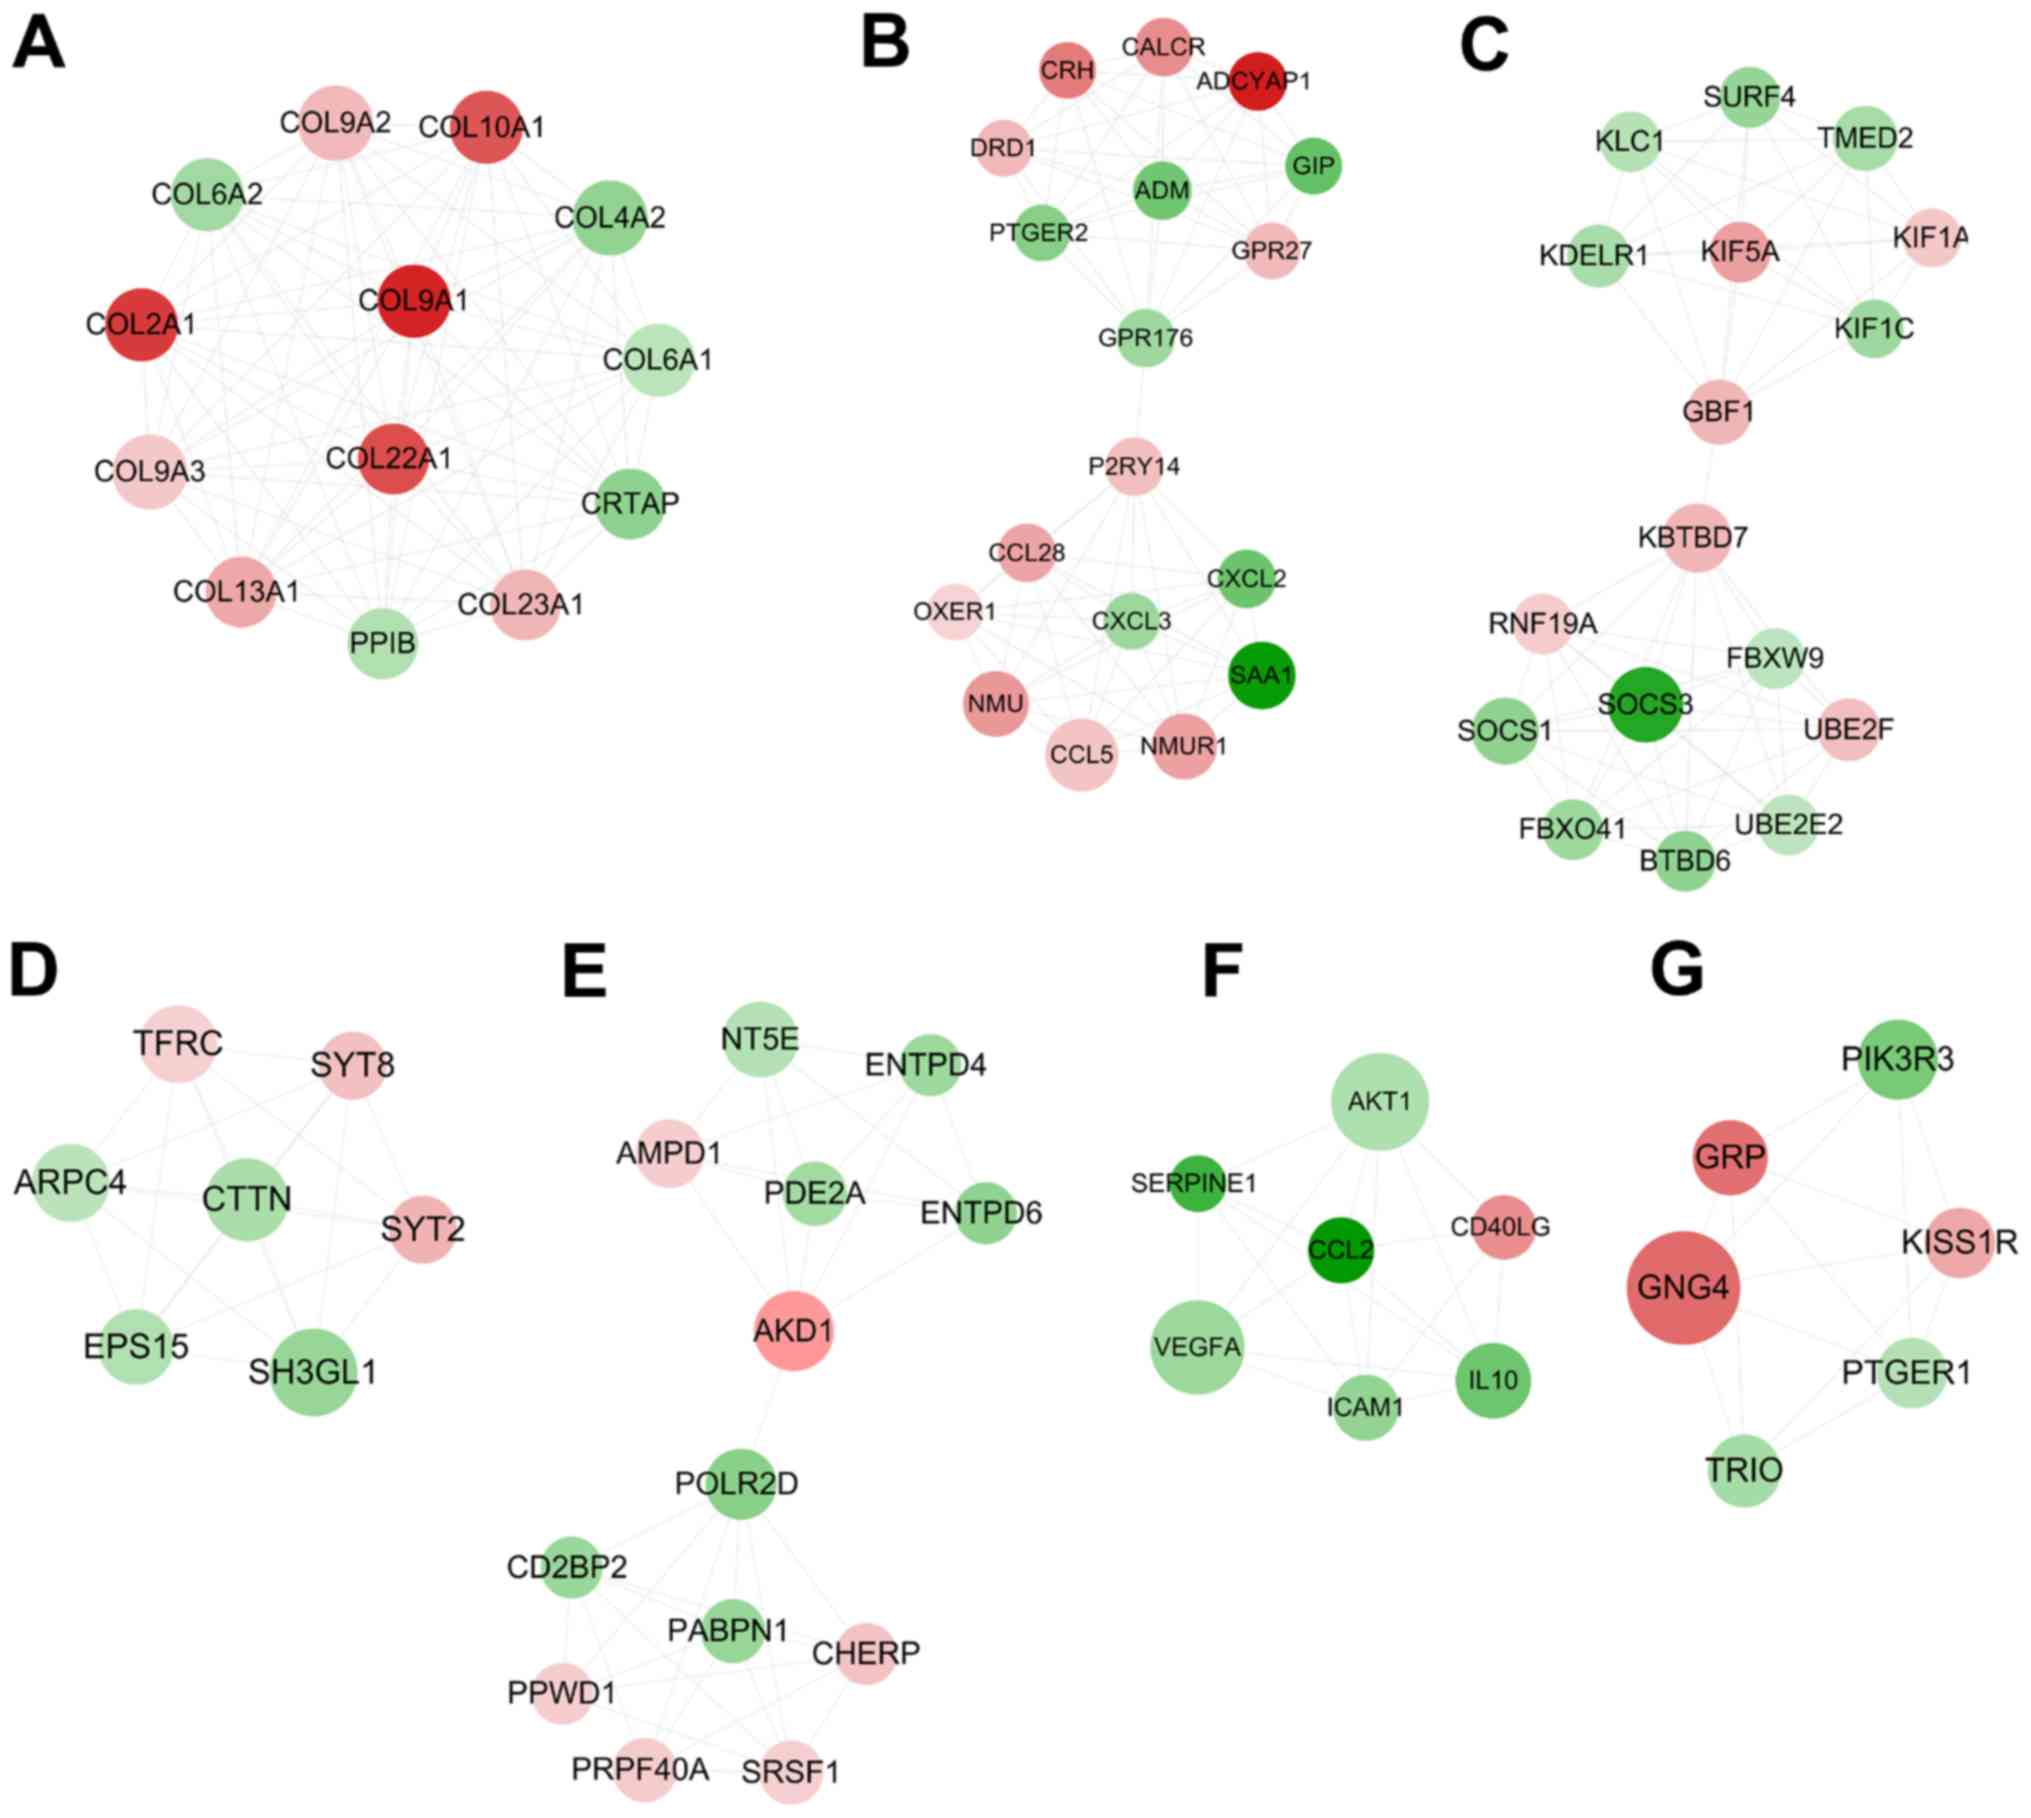
important for OLF, according to the degree ranking. A total of
seven highly interconnected sub-modules were extracted from the PPI
network using the MCODE algorithm (Fig. 2). Among them, eight of the hub
genes were included in module 1 (COL2A1 and COL13A1; Fig. 2A), module 3 (SOCS3; Fig. 2C), module 6 (IL10, AKT1, ICAM1 and
VEGFA; Fig. 2F) and module 7
(GNG4; Fig. 2G), suggesting that
these eight genes may be particularly crucial for OLF.
| Table II.Top 30 genes ranked by topological
characteristics. |
Table II.
Top 30 genes ranked by topological
characteristics.
| Genes | Degree | Genes | Betweenness
centrality | Overlap | LogFC |
|---|
| AKT1 | 31 | TBC1D10B | 1.0000 | VEGFA | −1.55 |
| CTNNB1 | 30 | GPR153 | 1.0000 | BMP4 | 2.26 |
| VEGFA | 29 | PLK3 | 1.0000 | CTNNB1 | −1.90 |
| GNG4 | 26 | POLQ | 0.8333 | GNG4 | 3.49 |
| ADCY5 | 26 | LMNA | 0.6667 | AKT1 | −1.27 |
| CCL5 | 19 | SUN2 | 0.6667 | POTEJ | −1.94 |
| IL10 | 19 | EXO1 | 0.5000 | SH3GL1 | −1.62 |
| POTEJ | 16 | CTNNB1 | 0.2625 | IL10 | −2.29 |
| SAA1 | 16 | AKT1 | 0.1816 | ICAM1 | 1.38 |
| SOCS3 | 15 | VEGFA | 0.1401 | MYC | −1.19 |
| NMU | 15 | GNA12 | 0.1294 | ADCY5 | −1.46 |
| NMUR1 | 15 | ADCY5 | 0.1213 | SOCS3 | −3.43 |
| ITGA4 | 15 | YWHAZ | 0.0964 | CCL5 | 1.38 |
| MYC | 15 | POLR2D | 0.0957 | ITGA4 | 1.64 |
| COL4A2 | 14 | IL10 | 0.0833 |
|
|
| COL9A2 | 14 | ITGA4 | 0.0756 |
|
|
| SH3GL1 | 14 | POTEJ | 0.0725 |
|
|
| COL9A3 | 14 | GBF1 | 0.0718 |
|
|
| CCL2 | 14 | MYC | 0.0693 |
|
|
| ICAM1 | 14 | PLA2G4F | 0.0665 |
|
|
| COL6A1 | 13 | SMG5 | 0.0639 |
|
|
| COL10A1 | 13 | CTTN | 0.0580 |
|
|
| BMP4 | 13 | PLD4 | 0.0550 |
|
|
| COL6A2 | 13 | ICAM1 | 0.0545 |
|
|
| COL9A1 | 13 | SOCS3 | 0.0539 |
|
|
| CD40LG | 13 | RPS18 | 0.0536 |
|
|
| COL2A1 | 13 | CCL5 | 0.0532 |
|
|
| CRTAP | 12 | RBBP4 | 0.0510 |
|
|
| KBTBD7 | 12 | GNG4 | 0.0492 |
|
|
| COL22A1 | 12 | FZD9 | 0.0475 |
|
|
| PPIB | 12 | BMP4 | 0.0457 |
|
|
| NT5E | 12 | SH3GL1 | 0.0448 |
|
|
| COL13A1 | 12 | FOXO3 | 0.0426 |
|
|
| PIK3R3 | 12 | TBL2 | 0.0424 |
|
|
Subsequently, BINGO was used to predict the function
of these genes in the sub-modules. The results demonstrated that
COL2A1 and COL13A1 in module 1 were involved in ‘anatomical
structure development’, ‘skeletal system development’ and ‘cell
adhesion’; SOCS3 in module 3 was involved in ‘negative regulation
of insulin receptor signaling pathway’, ‘JAK-STAT cascade’ and
‘regeneration’; IL10, AKT1, ICAM1 and VEGFA in module 6 were
involved in ‘negative regulation of apoptosis’ or ‘regulation of
immune system process’; and GNG4 in module 7 participated in
‘signaling pathway’ (Table
III).
| Table III.Function enrichment for genes in the
different modules. |
Table III.
Function enrichment for genes in the
different modules.
| A, M1 |
|---|
|
|---|
| GO-ID | P-value | Description | Genes in test
set |
|---|
| 48731 |
4.98×10³ | System
development | COL2A1, COL13A1,
COL9A1, COL10A1, COL9A3, COL9A2 |
| 48856 |
7.99×10³ | Anatomical
structure development | COL2A1, COL13A1,
COL9A1, COL10A1, COL9A3, COL9A2 |
| 1501 |
2.69×10⁶ | Skeletal system
development | COL2A1, COL13A1,
COL9A1, COL10A1, COL9A2 |
| 7155 |
1.08×10⁴ | Cell adhesion | COL2A1, COL13A1,
COL6A2, COL6A1, COL9A1 |
| 22610 |
1.08×10⁴ | Biological
adhesion | COL2A1, COL13A1,
COL6A2, COL6A1, COL9A1 |
| 30198 |
5.74×10⁵ | Extracellular
matrix organization | COL2A1, COL4A2,
COL6A2 |
| 43062 |
2.12×10⁴ | Extracellular
structure organization | COL2A1, COL4A2,
COL6A2 |
| 16337 |
1.22×10³ | Cell-cell
adhesion | COL2A1, COL13A1,
COL6A2 |
|
| B, M2 |
|
| GO-ID | P-value |
Description | Genes in test
set |
|
| 23052 |
6.96×10⁷ | Signaling | GPR27, P2RY14,
PTGER2, ADM, GIP, ADCYAP1, GPR176, CALCR, CCL5, NMU, CRH, OXER1,
NMUR1, DRD1 |
| 7166 |
7.13×10⁷ | Cell surface
receptor linked signaling pathway | ADCYAP1, GPR176,
CALCR, P2RY14, PTGER2, NMU, OXER1, NMUR1, DRD1, GIP |
| 23033 |
7.80×10⁶ | Signaling
pathway | ADCYAP1, GPR176,
CALCR, P2RY14, PTGER2, NMU, OXER1, ADM, NMUR1, DRD1, GIP |
| 23046 |
8.09×10⁵ | Signaling
process | GPR27, GPR176,
CALCR, CCL5, NMU, CRH, ADM, NMUR1, DRD1, GIP |
| 23060 |
8.09×10⁵ | Signal
transmission | GPR27, GPR176,
CALCR, CCL5, NMU, CRH, ADM, NMUR1, DRD1, GIP |
| 50896 |
2.69×10⁴ | Response to
stimulus | CALCR, P2RY14,
CCL5, NMU, SAA1, CRH, ADM, DRD1, CXCL3, CXCL2, CCL28, GIP |
| 65007 |
1.12×10² | Biological
regulation | GPR27, PTGER2, ADM,
GIP, ADCYAP1, CALCR, CCL5, NMU, SAA1, CRH, OXER1, NMUR1, DRD1,
CCL28 |
| 50794 |
1.32×10² | Regulation of
cellular process | GPR27, PTGER2, ADM,
GIP, ADCYAP1, CALCR, CCL5, NMU, SAA1, CRH, OXER1, NMUR1, DRD1 |
|
| C, M3 |
|
| GO-ID | P-value |
Description | Genes in test
set |
|
| 7017 |
5.49×10⁵ | Microtubule-based
process | RNF19A, KIF5A,
KIF1C, KIF1A |
| 46627 |
1.03×10⁴ | Negative regulation
of insulin receptor signaling pathway | SOCS3, SOCS1 |
| 7018 |
1.20×10⁴ | Microtubule-based
movement | KIF5A, KIF1C,
KIF1A |
| 46626 |
1.59×10⁴ | Regulation of
insulin receptor signaling pathway | SOCS3, SOCS1 |
| 6890 |
1.59×10⁴ | Retrograde
vesicle-mediated transport, Golgi to ER | GBF1, KIF1C |
| 32570 |
2.08×10⁴ | Response to
progesterone stimulus | SOCS3, SOCS1 |
| 7259 |
4.46×10⁴ | JAK-STAT
cascade | SOCS3, SOCS1 |
| 31100 |
4.72×10⁴ | Organ
regeneration | SOCS3, SOCS1 |
| 32355 |
1.44×10³ | Response to
estradiol stimulus | SOCS3, SOCS1 |
| 16192 |
1.52×10³ | Vesicle-mediated
transport | KDELR1, GBF1,
KIF1C, TMED2 |
| 51246 |
1.99×10³ | Regulation of
protein metabolic process | UBE2F, SOCS3,
SOCS1, UBE2E2 |
| 31099 |
2.26×10³ | Regeneration | SOCS3, SOCS1 |
| 46907 |
2.36×10³ | Intracellular
transport | KDELR1, GBF1,
KIF1C, KIF1A |
|
| D, M4 |
|
| GO-ID | P-value |
Description | Genes in test
set |
|
| 16043 |
1.03×10³ | Cellular component
organization | TFRC, ARPC4, EPS15,
SH3GL1 |
| 16044 |
7.41×10⁵ | Cellular membrane
organization | TFRC, EPS15,
SH3GL1 |
| 61024 |
7.47×10⁵ | Membrane
organization | TFRC, EPS15,
SH3GL1 |
| 16192 |
2.71×10⁴ | Vesicle-mediated
transport | TFRC, EPS15,
SH3GL1 |
| 43623 |
6.55×10⁴ | Cellular protein
complex assembly | ARPC4, EPS15 |
| 10324 |
1.41×10³ | Membrane
invagination | TFRC, SH3GL1 |
| 6897 |
1.41×10³ | Endocytosis | TFRC, SH3GL1 |
| 34622 |
2.83×10³ | Cellular
macromolecular complex assembly | ARPC4, EPS15 |
| 34621 |
3.58×10³ | Cellular
macromolecular complex subunit organization | ARPC4, EPS15 |
| 6461 |
7.17×10³ | Protein complex
assembly | ARPC4, EPS15 |
| 70271 |
7.17×10³ | Protein complex
biogenesis | ARPC4, EPS15 |
| 65003 |
1.26×10² | Macromolecular
complex assembly | ARPC4, EPS15 |
|
| E, M5 |
|
| GO-ID | P-value |
Description | Genes in test
set |
|
| 6139 |
6.85×10⁹ | Nucleobase,
nucleoside, nucleotide and nucleic acid metabolic process | NT5E, PABPN1,
ENTPD4, SRSF1, POLR2D, AMPD1, PPWD1, AKD1, CD2BP2, PRPF40A,
CHERP |
| 34641 |
3.49×10⁸ | Cellular nitrogen
compound metabolic process | NT5E, PABPN1,
ENTPD4, SRSF1, POLR2D, AMPD1, PPWD1, AKD1, CD2BP2, PRPF40A,
CHERP |
| 6807 |
6.30×10⁸ | Nitrogen compound
metabolic process | NT5E, PABPN1,
ENTPD4, SRSF1, POLR2D, AMPD1, PPWD1, AKD1, CD2BP2, PRPF40A,
CHERP |
| 44237 |
3.34×10⁴ | Cellular metabolic
process | NT5E, PABPN1,
ENTPD4, SRSF1, POLR2D, AMPD1, PPWD1, AKD1, CD2BP2, PRPF40A,
CHERP |
| 44238 |
5.98×10⁴ | Primary metabolic
process | NT5E, PABPN1,
ENTPD4, SRSF1, POLR2D, AMPD1, PPWD1, AKD1, CD2BP2, PRPF40A,
CHERP |
| 8152 |
1.95×10³ | Metabolic
process | NT5E, PABPN1,
ENTPD4, SRSF1, POLR2D, AMPD1, PPWD1, AKD1, CD2BP2, PRPF40A,
CHERP |
| 90304 |
9.29×10⁶ | Nucleic acid
metabolic process | NT5E, PABPN1,
SRSF1, POLR2D, PPWD1, CD2BP2, PRPF40A, CHERP |
| 44260 |
4.95×10³ | Cellular
macromolecule metabolic process | NT5E, PABPN1,
SRSF1, POLR2D, PPWD1, CD2BP2, PRPF40A, CHERP |
| 43170 |
1.20×10² | Macromolecule
metabolic process | NT5E, PABPN1,
SRSF1, POLR2D, PPWD1, CD2BP2, PRPF40A, CHERP |
| 6396 |
2.09×10⁷ | RNA processing | PABPN1, SRSF1,
POLR2D, PPWD1, CD2BP2, PRPF40A, CHERP |
| 16070 |
7.49×10⁶ | RNA metabolic
process | PABPN1, SRSF1,
POLR2D, PPWD1, CD2BP2, PRPF40A, CHERP |
| 10467 |
4.36×10⁵ | Gene
expression | PABPN1, SRSF1,
POLR2D, PPWD1, CD2BP2, PRPF40A, CHERP |
|
| F, M6 |
|
| GO-ID | P-value |
Description | Genes in test
set |
|
| 48583 |
8.51×10¹¹ | Regulation of
response to stimulus | IL10, CD40LG,
SERPINE1, CCL2, AKT1, VEGFA, ICAM1 |
| 32879 |
8.51×10¹⁰ | Regulation of
localization | IL10, CD40LG,
SERPINE1, CCL2, AKT1, VEGFA, ICAM1 |
| 48522 |
1.05×10⁶ | Positive regulation
of cellular process | IL10, CD40LG,
SERPINE1, CCL2, AKT1, VEGFA, ICAM1 |
| 48518 |
2.07×10⁶ | Positive regulation
of biological process | IL10, CD40LG,
SERPINE1, CCL2, AKT1, VEGFA, ICAM1 |
| 50896 |
6.78×10⁵ | Response to
stimulus | IL10, CD40LG,
SERPINE1, CCL2, AKT1, VEGFA, ICAM1 |
| 50794 |
2.94×10³ | Regulation of
cellular process | IL10, CD40LG,
SERPINE1, CCL2, AKT1, VEGFA, ICAM1 |
| 50789 |
4.23×10³ | Regulation of
biological process | IL10, CD40LG,
SERPINE1, CCL2, AKT1, VEGFA, ICAM1 |
| 65007 |
6.33×10³ | Biological
regulation | IL10, CD40LG,
SERPINE1, CCL2, AKT1, VEGFA, ICAM1 |
| 43066 |
2.17×10⁹ | Negative regulation
of apoptosis | IL10, CD40LG,
SERPINE1, CCL2, AKT1, VEGFA |
| 43069 |
2.35×10⁹ | Negative regulation
of programmed cell death | IL10, CD40LG,
SERPINE1, CCL2, AKT1, VEGFA |
| 60548 |
2.66×10⁹ | Negative regulation
of cell death | IL10, CD40LG,
SERPINE1, CCL2, AKT1, VEGFA |
| 2682 |
4.47×10⁹ | Regulation of
immune system process | IL10, CD40LG,
SERPINE1, CCL2, VEGFA, ICAM1 |
| 42981 |
2.92×10⁷ | Regulation of
apoptosis | IL10, CD40LG,
SERPINE1, CCL2, AKT1, VEGFA |
| 43067 |
3.08×10⁷ | Regulation of
programmed cell death | IL10, CD40LG,
SERPINE1, CCL2, AKT1, VEGFA |
| 10941 |
3.24×10⁷ | Regulation of cell
death | IL10, CD40LG,
SERPINE1, CCL2, AKT1, VEGFA |
| 2376 |
5.51×10⁷ | Immune system
process | IL10, CD40LG, CCL2,
AKT1, VEGFA, ICAM1 |
|
| G, M7 |
| GO-ID | P-value |
Description | Genes in test
set |
|
| 23033 |
9.95×10⁶ | Signaling
pathway | TRIO, GRP, PTGER1,
GNG4, KISS1R, PIK3R3 |
| 7166 |
3.16×10⁵ | Cell surface
receptor linked signaling pathway | TRIO, GRP, PTGER1,
KISS1R, PIK3R3 |
| 23052 |
1.10×10⁴ | Signaling | TRIO, GRP, PTGER1,
GNG4, KISS1R, PIK3R3 |
| 7186 |
7.80×10⁴ | G-protein coupled
receptor protein signaling pathway | GRP, PTGER1,
KISS1R |
miRNA-mRNA regulatory network
construction
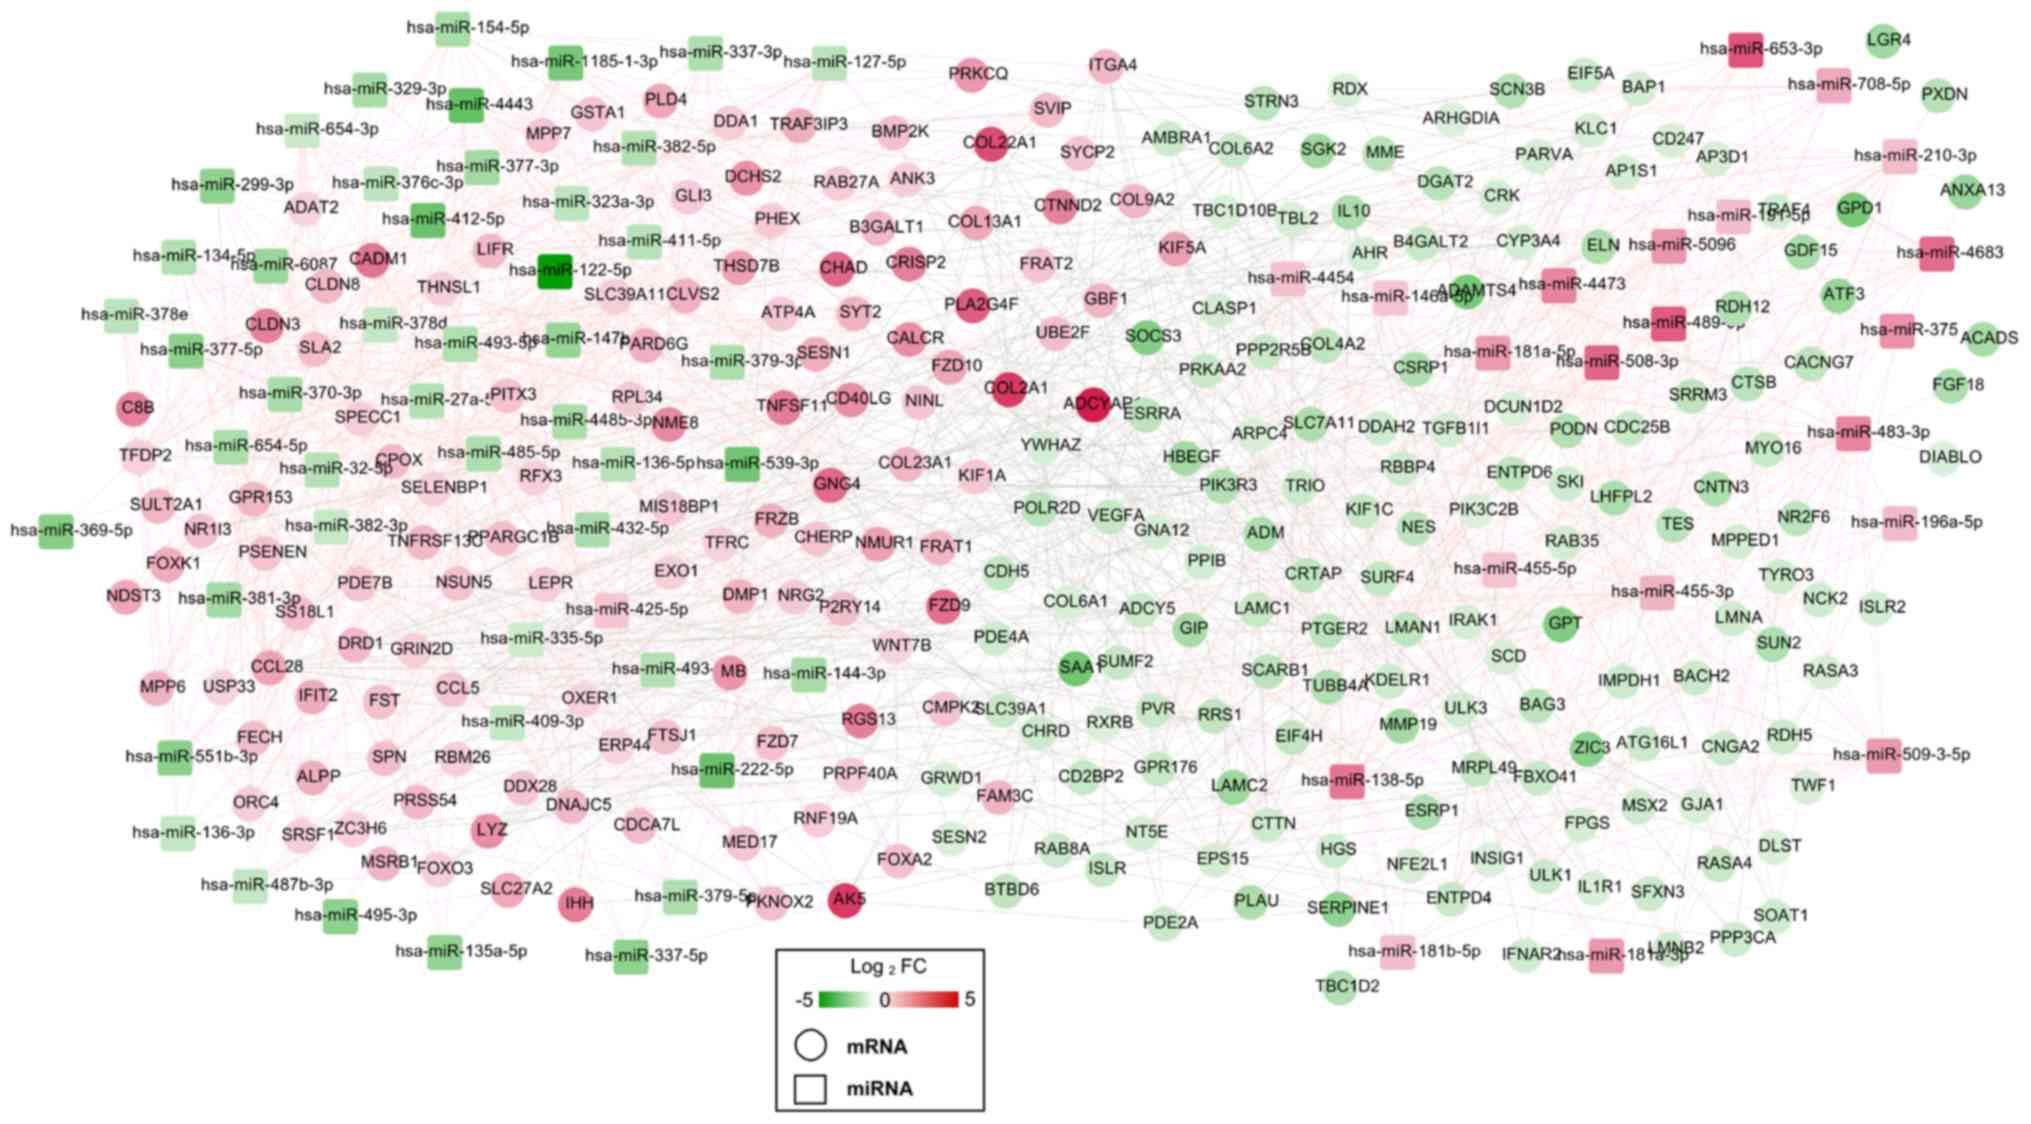
A total of 876 negative miRNA-mRNA regulatory pairs
(including miR-210-3p-IL10, hsa-miR-196a-5p-SOCS3,
hsa-miR-379-5p-GNG4, has-miR-181b-5p-ADCY5, hsa-miR-329-3p-COL13A1,
hsa-miR-222-5p-COL2A1 and hsa-miR-299-3p-WNT7B) were screened from
the miRwalk database, which were used to construct a DEM-DEG
network (Fig. 3). This constructed
DEM-DEG regulatory network included 344 nodes, comprising of 73
DEMs (23 upregulated; 50 downregulated) and 271 DEGs (122
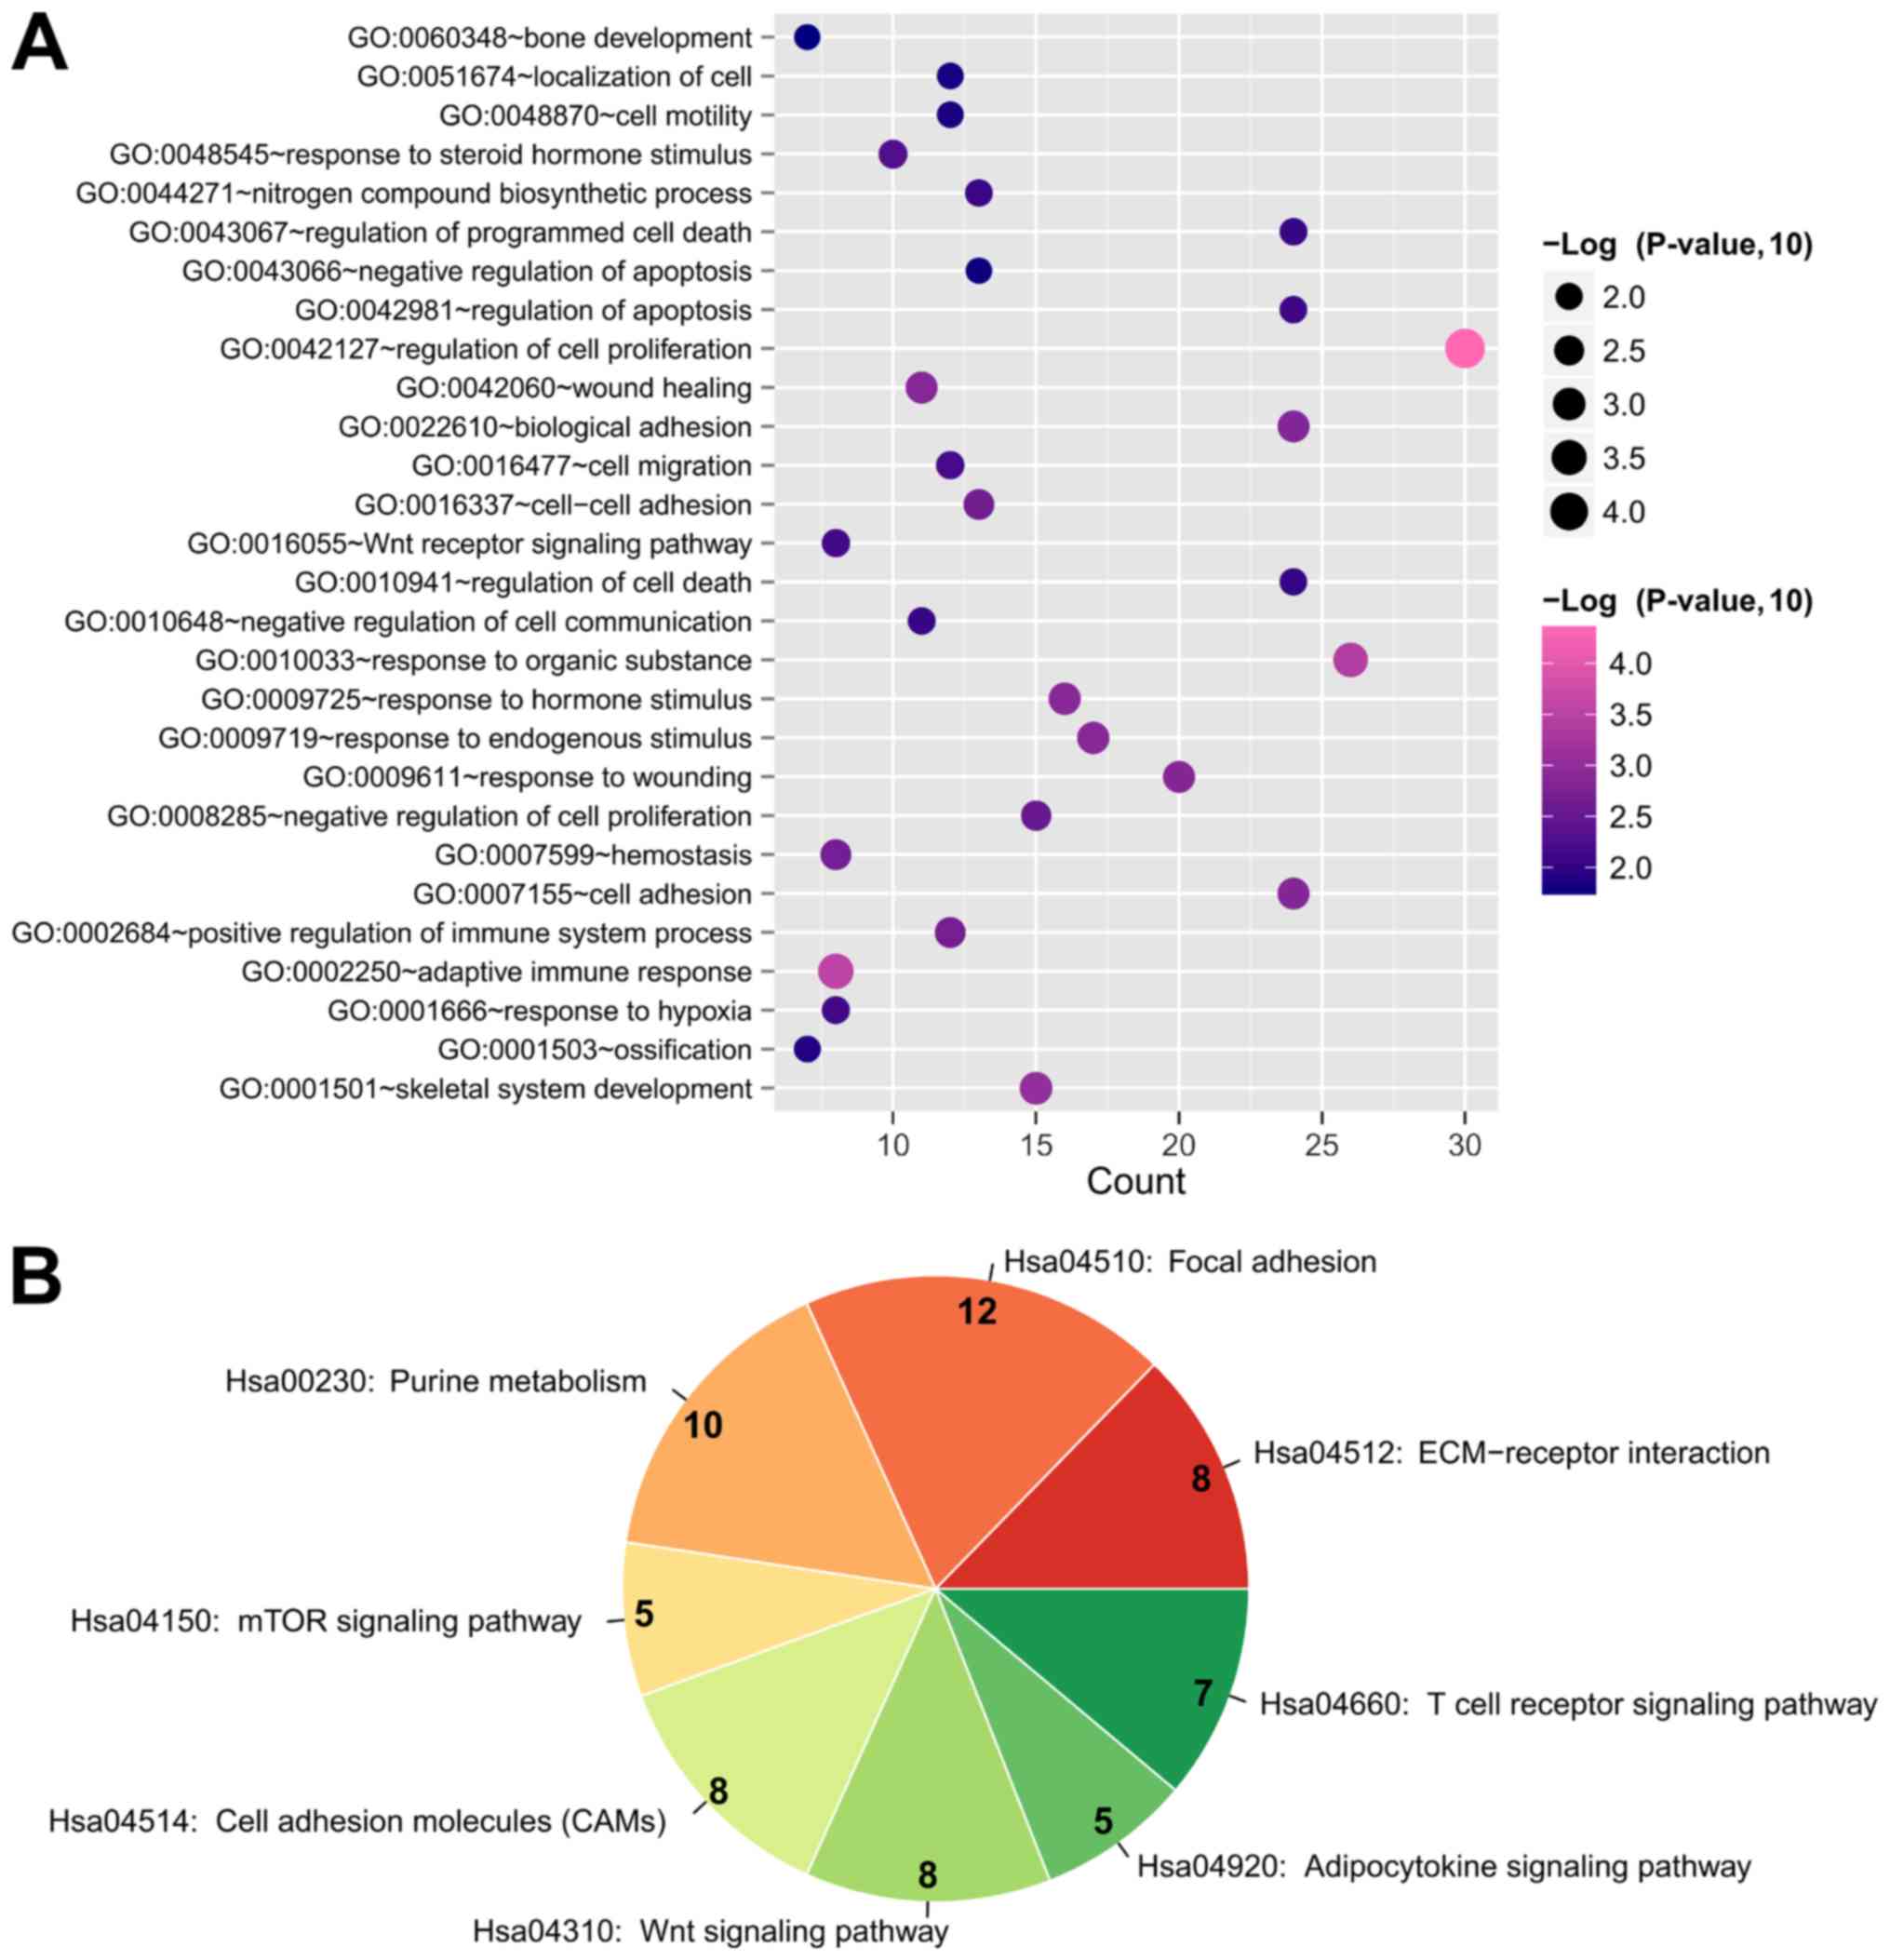
upregulated; 149 downregulated). GO biological process terms and
KEGG pathways were analyzed to predict the potential functions of
the DEGs in this DEM-DEG regulatory network using the DAVID
database. The results demonstrated that these DEGs were enriched in
28 GO biological processes, including ‘GO:0042127~regulation of
cell proliferation’ (IL10 and VEGFA), ‘GO:0002250~adaptive immune
response’ (IL10 and VEGFA), ‘GO:0001501~skeletal system
development’ (COL2A1 and COL13A1), ‘GO:0001503~ossification’
(COL2A1 and COL13A1), ‘GO:0060348~bone development’ (COL2A1 and
COL13A1), ‘GO:0009725~response to hormone stimulus’ (GNG4 and
ADCY5), ‘GO:0001666~response to hypoxia’ (SOCS3) and
‘GO:0042981~regulation of apoptosis’ (SOCS3; Table IV; Fig. 4). In addition, these DEGs were
enriched in eight KEGG pathways, including ‘Hsa04510: Focal
adhesion’ (COL2A1 and VEGFA), ‘Hsa00230: Purine metabolism’
(ADCY5), ‘Hsa04150: mTOR signaling pathway’ (VEGFA), ‘Hsa04310: Wnt
signaling pathway’ (WNT7B), ‘Hsa04920: Adipocytokine signaling
pathway’ (SOCS3) and ‘Hsa04660: T cell receptor signaling pathway’
(IL10; Table IV; Fig. 4).
| Table IV.Function enrichment for genes in
microRNA-mRNA network. |
Table IV.
Function enrichment for genes in
microRNA-mRNA network.
| A, Biological
process |
|---|
|
|---|
| Term | P-value | Genes |
|---|
|
GO:0042127~regulation of cell
proliferation |
4.65×10⁵ | FGF18, BAP1, EIF5A,
GJA1, SESN1, GLI3, IL10, CDH5, MSX2, SERPINE1, SPN, IHH, PTGER2,
ESRRA, RBBP4, TNFRSF13C, LIFR, SKI, CDC25B, NCK2, PRKCQ, ATF3, ADM,
VEGFA, MYO16, HBEGF, HGS, LAMC1, TGFB1I1, PLAU |
| GO:0002250~adaptive
immune response |
2.87×10⁴ | EXO1, C8B, CADM1,
CD40LG, SLA2, VEGFA, IL10, RAB27A |
| GO:0010033~response
to organic substance |
4.04×10⁴ | CALCR, IL1R1, DRD1,
LEPR, ADCY5, CCL5, IL10, MSX2, COL6A2, SCARB1, PPP3CA, PIK3R3,
GNG4, DDAH2, IHH, MB, IRAK1, ACADS, SOCS3, STRN3, LIFR, PPARGC1B,
ERP44, PRKCQ, ADM, TFRC |
| GO:0001501~skeletal
system development |
9.07×10⁴ | FGF18, ESRRA,
COL13A1, DMP1, COL2A1, FRZB, GLI3, CHAD, MSX2, COL9A2, TNFSF11,
PHEX, CHRD, ADAMTS4, IHH |
| GO:0009719~response
to endogenous stimulus |
1.23×10³ | CALCR, DRD1, ACADS,
SOCS3, STRN3, LEPR, ADCY5, CCL5, IL10, PPARGC1B, PRKCQ, ADM,
PPP3CA, PIK3R3, GNG4, IHH, MB |
| GO:0009725~response
to hormone stimulus |
1.24×10³ | CALCR, DRD1, ACADS,
SOCS3, STRN3, LEPR, ADCY5, CCL5, IL10, PPARGC1B, PRKCQ, ADM,
PIK3R3, GNG4, IHH, MB |
| GO:0042060~wound
healing |
1.36×10³ | PRKCQ, FOXA2,
CD40LG, SAA1, SERPINE1, GNA12, HBEGF, SCARB1, LMAN1, PLAU,
RAB27A |
| GO:0009611~response
to wounding |
1.37×10³ | YWHAZ, FOXA2,
GNA12, LYZ, LMAN1, CCL5, IL10, C8B, PRKCQ, ADM, TFRC, CD40LG, SAA1,
SERPINE1, HBEGF, NFE2L1, SCARB1, CTSB, PLAU, RAB27A |
| GO:0007155~cell
adhesion |
1.42×10³ | PVR, CLDN8, DCHS2,
TYRO3, CADM1, COL13A1, CLDN3, COL22A1, CTNND2, COL2A1, ITGA4, CCL5,
CDH5, CHAD, ISLR, CD40LG, COL6A2, COL6A1, LAMC2, SCARB1, CNTN3,
LAMC1, TGFB1I1, PARVA |
|
GO:0022610~biological adhesion |
1.45×10³ | PVR, CLDN8, DCHS2,
TYRO3, CADM1, COL13A1, CLDN3, COL22A1, CTNND2, COL2A1, ITGA4, CCL5,
CDH5, CHAD, ISLR, CD40LG, COL6A2, COL6A1, LAMC2, SCARB1, CNTN3,
LAMC1, TGFB1I1, PARVA |
| GO:0002684~positive
regulation of immune system process |
2.14×10³ | PVR, C8B, IRAK1,
PRKCQ, NCK2, CADM1, SLA2, VEGFA, CD247, TNFRSF13C, AP3D1, SPN |
|
GO:0007599~hemostasis |
2.16×10³ | FOXA2, CD40LG,
SAA1, SERPINE1, GNA12, LMAN1, PLAU, RAB27A |
|
GO:0016337~cell-cell adhesion |
2.28×10³ | PVR, CLDN8, DCHS2,
CADM1, COL13A1, CD40LG, CLDN3, CTNND2, COL6A2, COL2A1, ITGA4, CDH5,
CHAD |
| GO:0008285~negative
regulation of cell proliferation |
2.91×10³ | RBBP4, BAP1, GJA1,
SKI, SESN1, GLI3, IL10, CDH5, MSX2, NCK2, ADM, MYO16, HGS, TGFB1I1,
SPN |
| GO:0048545~response
to steroid hormone stimulus |
4.86×10³ | CALCR, ADM, SOCS3,
ACADS, STRN3, LEPR, CCL5, IL10, PPARGC1B, IHH |
| GO:0016477~cell
migration |
6.55×10³ | PVR, NCK2, DRD1,
ULK1, SAA1, HBEGF, SCARB1, LAMC1, ITGA4, CCL5, IL10, PLAU |
| GO:0016055~Wnt
receptor signaling pathway |
6.81×10³ | FZD9, WNT7B, FZD10,
FRAT1, FRAT2, TGFB1I1, FRZB, FZD7 |
| GO:0001666~response
to hypoxia |
7.08×10³ | PRKCQ, TFRC, ADM,
SOCS3, CLDN3, VEGFA, PLAU, MB |
|
GO:0042981~regulation of apoptosis |
7.81×10³ | IRAK1, YWHAZ,
CADM1, SOCS3, EIF5A, TRIO, COL2A1, FOXO3, GLI3, IL10, MSX2, CD40LG,
BAG3, VEGFA, DIABLO, PSENEN, DNAJC5, CTSB, DDAH2, ARHGDIA, TRAF4,
SPN, RAB27A, IHH |
| GO:0044271~nitrogen
compound biosynthetic process |
8.29×10³ | FECH, ATP4A, ADCY5,
AK5, CMPK2, ADM, CPOX, NFE2L1, THNSL1, FPGS, DDAH2, IMPDH1,
NT5E |
| GO:0010648~negative
regulation of cell communication |
8.62×10³ | DRD1, SOCS3, STRN3,
SLA2, HGS, SKI, TGFB1I1, FRZB, CHRD, IHH, RGS13 |
|
GO:0043067~regulation of programmed cell
death |
8.74×10³ | IRAK1, YWHAZ,
CADM1, SOCS3, EIF5A, TRIO, COL2A1, FOXO3, GLI3, IL10, MSX2, CD40LG,
BAG3, VEGFA, DIABLO, PSENEN, DNAJC5, CTSB, DDAH2, ARHGDIA, TRAF4,
SPN, RAB27A, IHH |
|
GO:0010941~regulation of cell death |
9.12×10³ | IRAK1, YWHAZ,
CADM1, SOCS3, EIF5A, TRIO, COL2A1, FOXO3, GLI3, IL10, MSX2, CD40LG,
BAG3, VEGFA, DIABLO, PSENEN, DNAJC5, CTSB, DDAH2, ARHGDIA, TRAF4,
SPN, RAB27A, IHH |
|
GO:0001503~ossification |
1.24×10² | FGF18, TNFSF11,
COL13A1, DMP1, COL2A1, CHRD, IHH |
| GO:0048870~cell
motility |
1.38×10² | PVR, NCK2, DRD1,
ULK1, SAA1, HBEGF, SCARB1, LAMC1, ITGA4, CCL5, IL10, PLAU |
|
GO:0051674~localization of cell |
1.38×10² | PVR, NCK2, DRD1,
ULK1, SAA1, HBEGF, SCARB1, LAMC1, ITGA4, CCL5, IL10, PLAU |
| GO:0043066~negative
regulation of apoptosis |
1.55×10² | MSX2, IRAK1, YWHAZ,
CD40LG, SOCS3, BAG3, VEGFA, DNAJC5, COL2A1, DDAH2, IL10, ARHGDIA,
IHH |
| GO:0060348~bone
development |
1.68×10² | FGF18, TNFSF11,
COL13A1, DMP1, COL2A1, CHRD, IHH |
|
| B, KEGG
pathway |
|
| Term | P-value | Genes |
|
|
hsa04512:ECM-receptor interaction |
4.33×10³ | COL4A2, COL6A2,
COL6A1, LAMC2, COL2A1, LAMC1, ITGA4, CHAD |
| hsa04510:Focal
adhesion |
1.00×10² | COL4A2, VEGFA,
COL6A2, COL6A1, LAMC2, COL2A1, LAMC1, ITGA4, PIK3R3, CRK, CHAD,
PARVA |
| hsa00230:Purine
metabolism |
1.25×10² | PDE7B, PDE2A,
ADCY5, PDE4A, ENTPD6, AK5, ENTPD4, POLR2D, NT5E, IMPDH1 |
| hsa04150:mTOR
signaling pathway |
3.80×10² | ULK1, VEGFA, ULK3,
PRKAA2, PIK3R3 |
| hsa04514:Cell
adhesion molecules (CAMs) |
4.30×10² | PVR, CLDN8, CADM1,
CD40LG, CLDN3, ITGA4, CDH5, SPN |
| hsa04310:Wnt
signaling pathway |
4.77×10² | FZD9, WNT7B, FZD10,
PPP2R5B, FRAT1, FRAT2, PPP3CA, FZD7 |
|
hsa04920:Adipocytokine signaling
pathway |
4.82×10² | PRKCQ, SOCS3, RXRB,
LEPR, PRKAA2 |
| hsa04660:T cell
receptor signaling pathway |
4.90×10² | PRKCQ, NCK2,
CD40LG, CD247, PPP3CA, PIK3R3, IL10 |
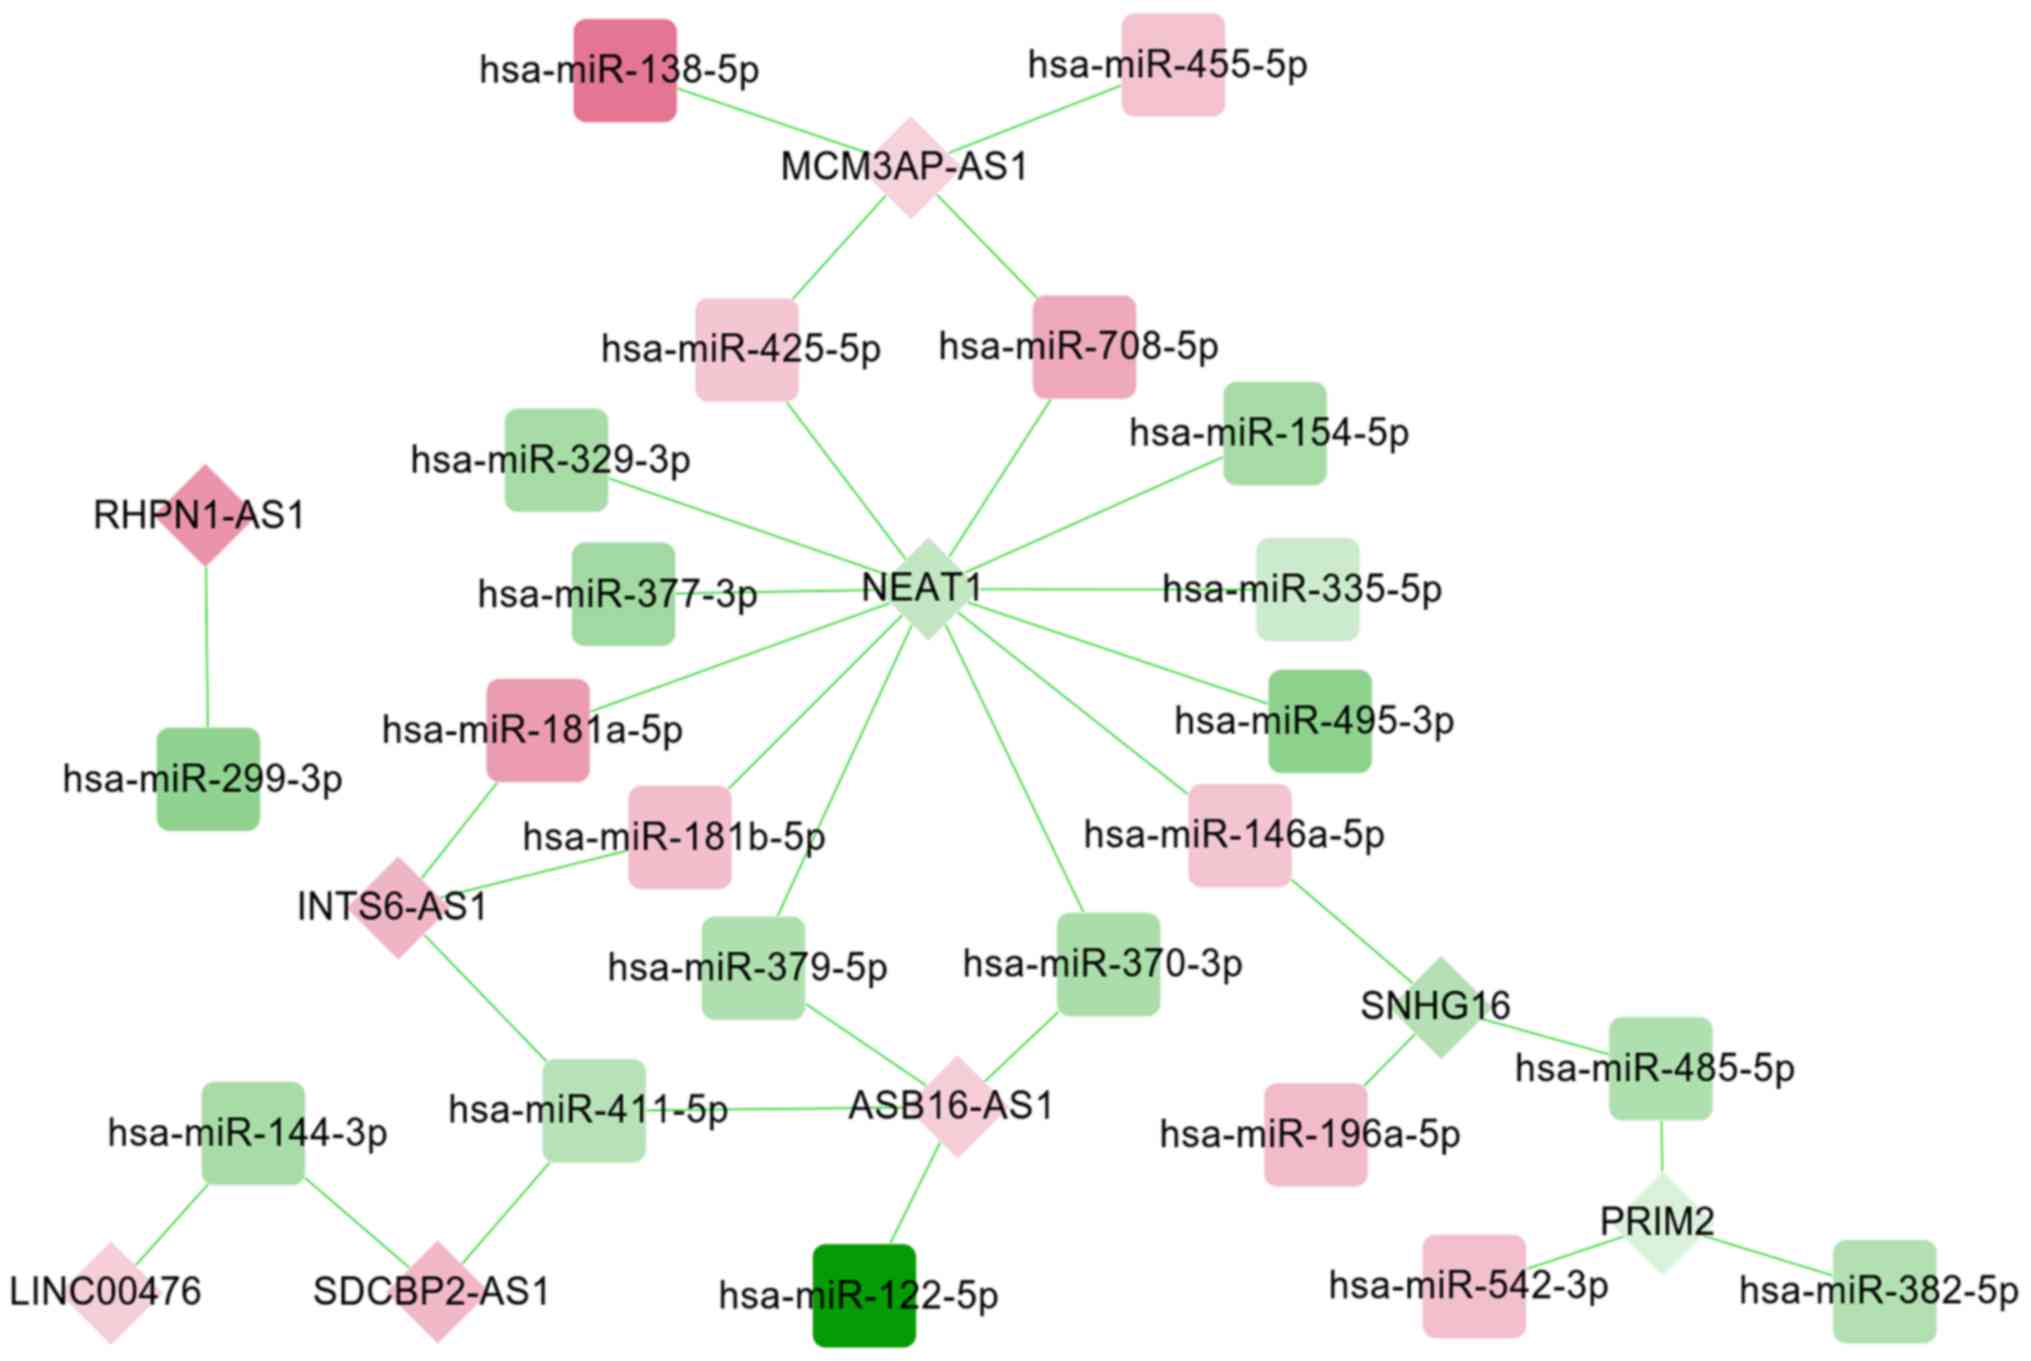
lncRNA-miRNA-mRNA ceRNA regulatory
network construction
A total of 33 miRNA-lncRNA regulatory pairs
[including small nucleolar RNA host gene (SNHG) 16-hsa-miR-196a-5p,
ankyrin repeat and SOCS box containing 16
(ASB16)-AS1-hsa-miR-379-5p, nuclear enriched abundant transcript
(NEAT) 1-has-miR-181b-5p and rhophilin (RHPN) 1-AS1-hsa-miR-299-3p]
were screened from the starBase database, which were used to
construct a DEM-DEL regulatory network (Fig. 5). This established DEM-DEL
regulatory network included 31 nodes, comprising of 22 DEMs (9
upregulated; 13 downregulated) and nine DELs (6 upregulated; 3
downregulated).
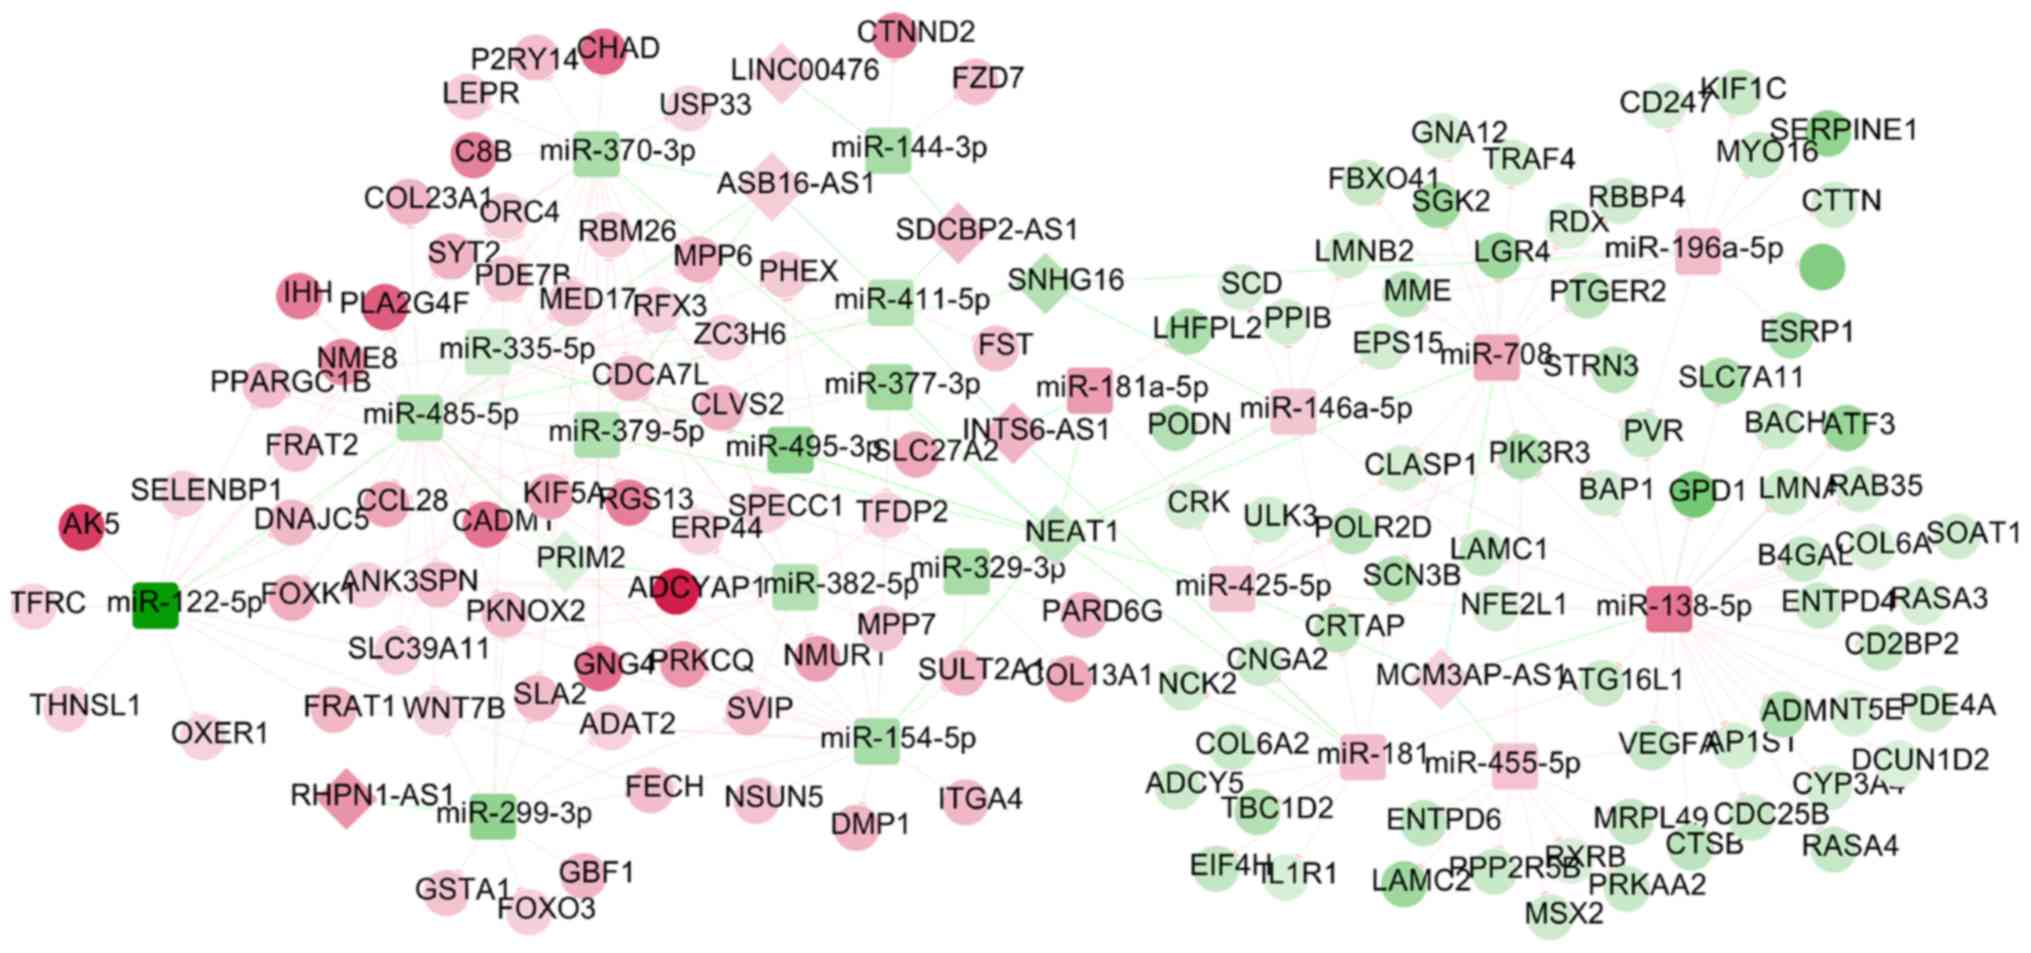
Following the integration of the DEM-DEG and DEM-DEL
regulatory networks, an lncRNA-miRNA-mRNA ceRNA network (including
SNHG16-hsa-miR-196a-5p-SOCS3, ASB16-AS1-hsa-miR-379-5p-GNG4,
NEAT1-has-miR- 181b-5p-ADCY5 and RHPN1-AS1-hsa-miR-299-3p-WNT7B)
was constructed (Fig. 6), in which
165 nodes (8 DELs; 21 DEMs; 136 DEGs) and 245 edges (32 DEL-DEM and
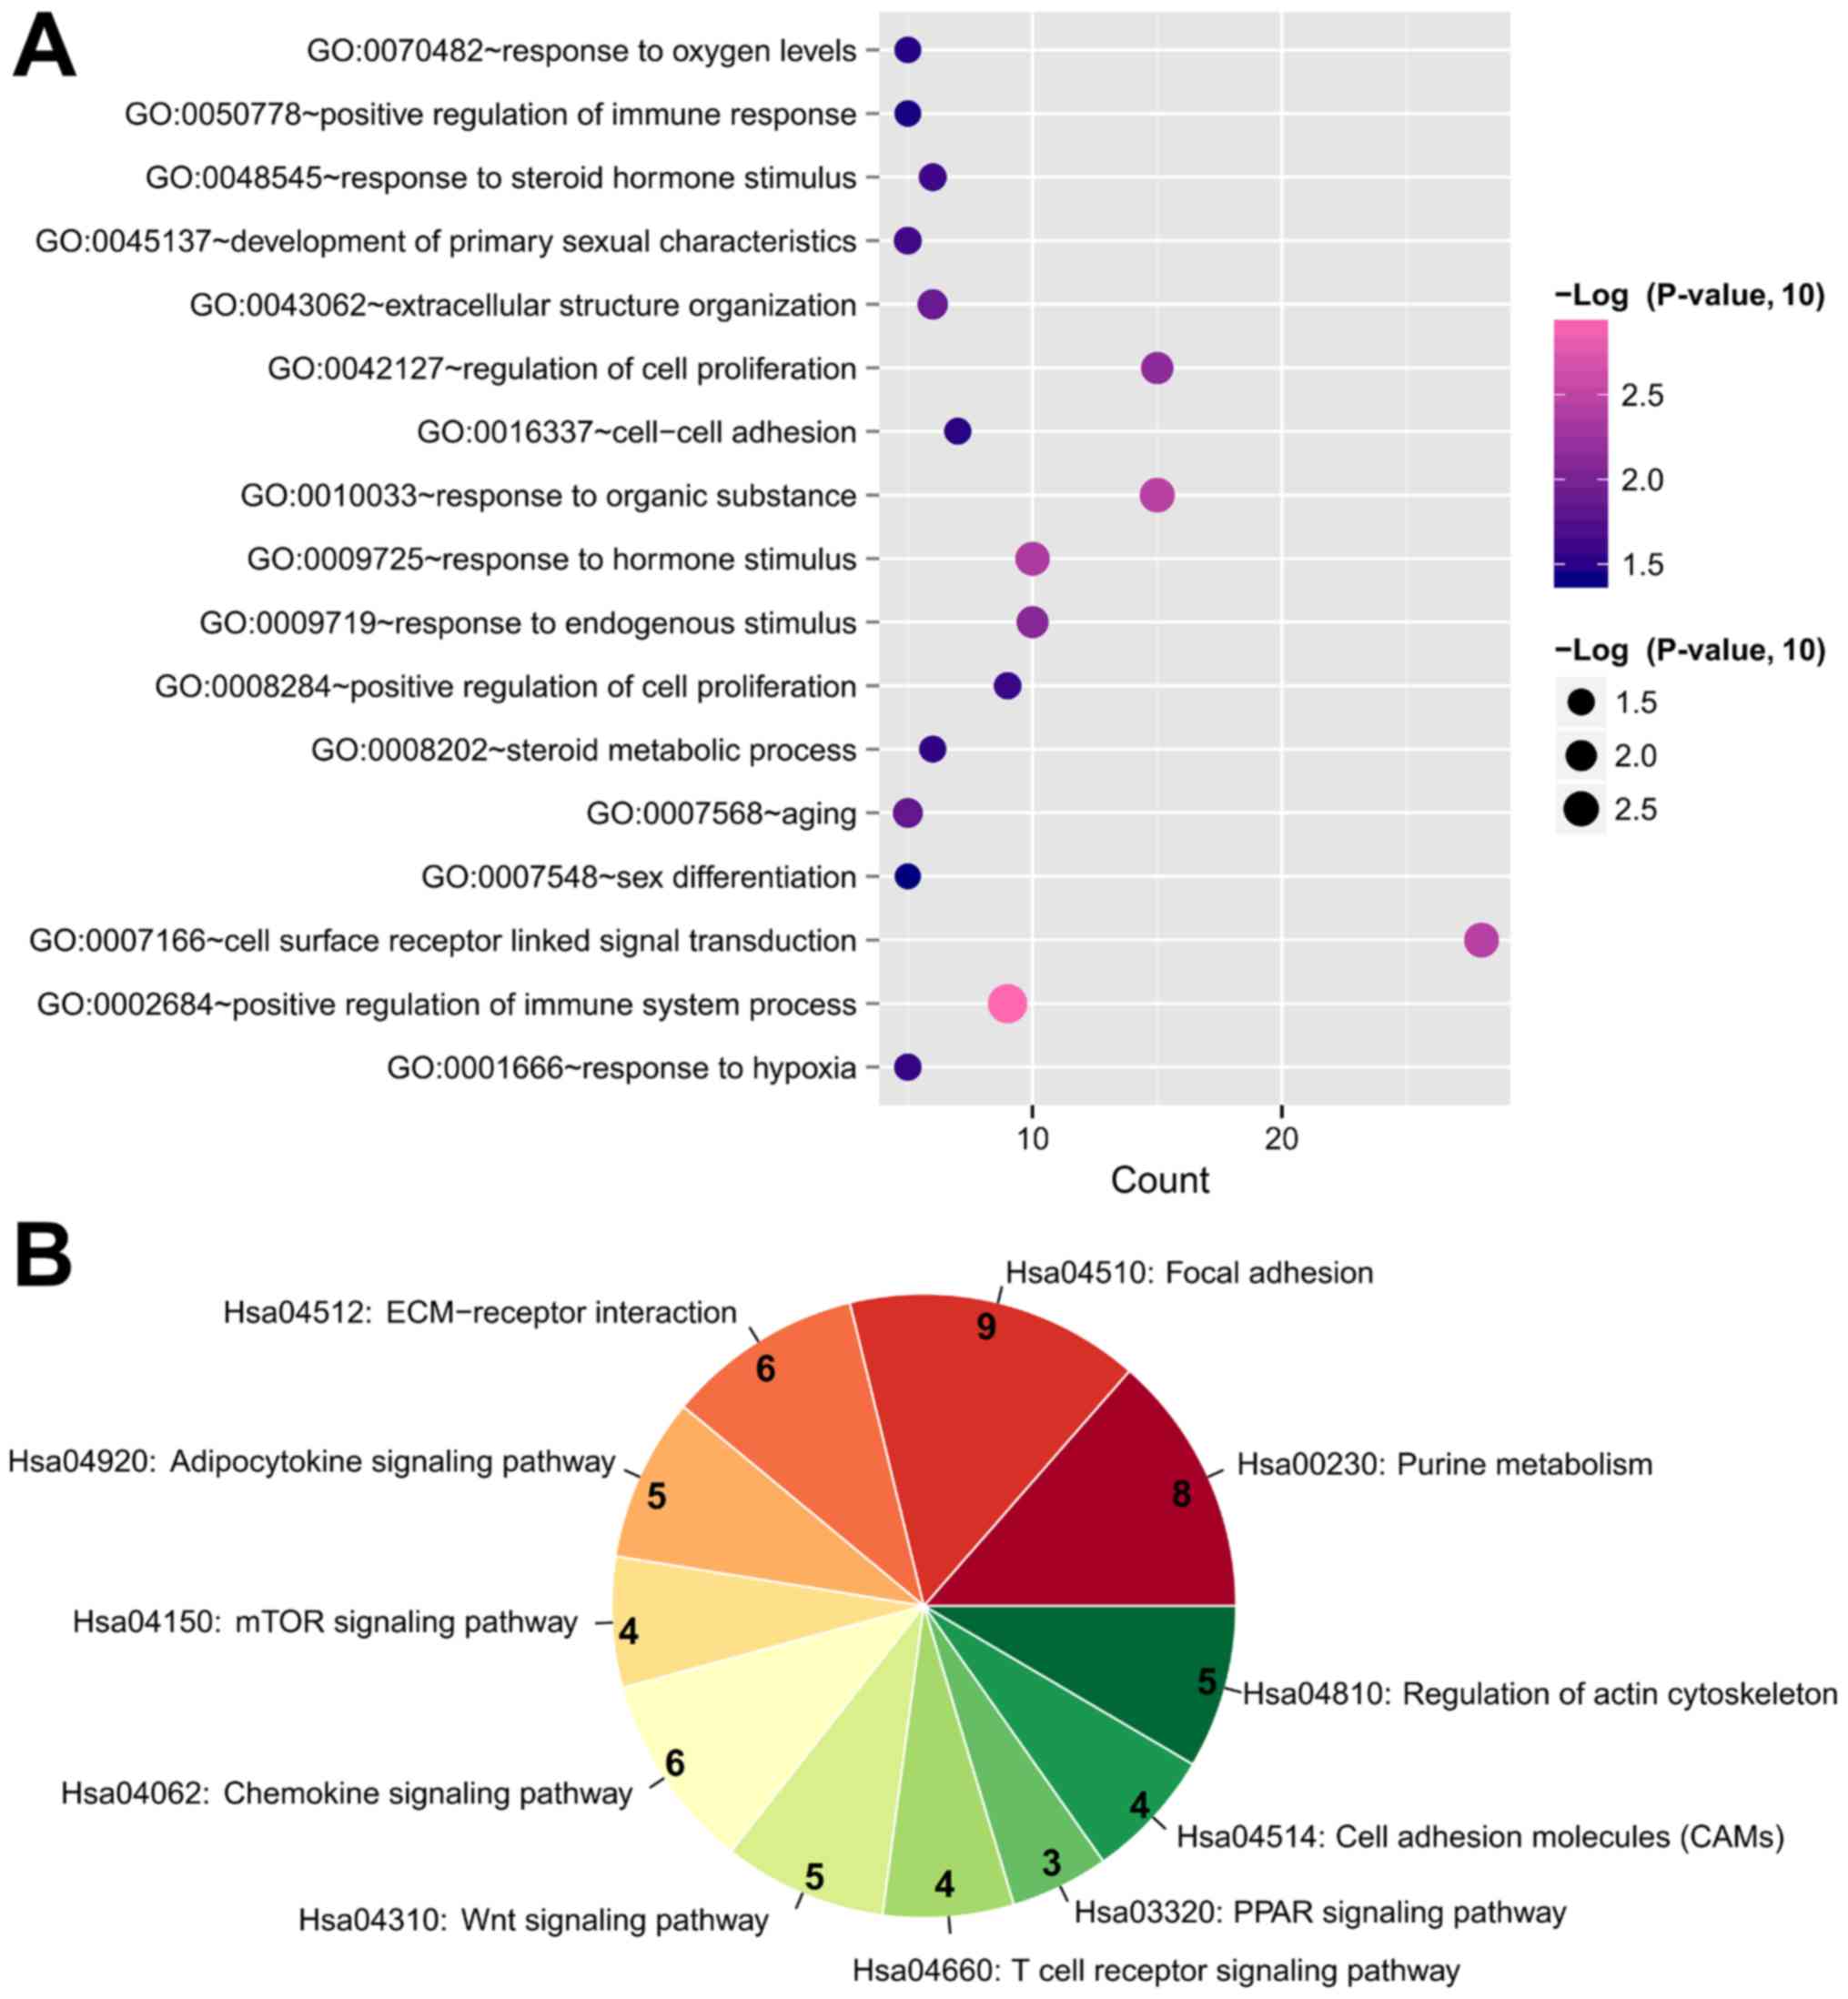
213 DEM-DEG interaction pairs) were involved. The functional
analysis of the genes in this ceRNA network also demonstrated that
‘GO:0009725~response to hormone stimulus’ (GNG4 and ADCY5),
‘GO:0001666~response to hypoxia’ (SOCS3), ‘Hsa00230: Purine
metabolism’ (ADCY5), ‘Hsa04920: Adipocytokine signaling pathway’
(SOCS3), ‘Hsa04062: Chemokine signaling pathway’ (GNG4 and ADCY5)
and ‘Hsa04310: Wnt signaling pathway’ (WNT7B) were enriched
(Table V; Fig. 7).
| Table V.Function enrichment for genes in the
long non-coding RNA-microRNA-mRNA competing endogenous RNA
network. |
Table V.
Function enrichment for genes in the
long non-coding RNA-microRNA-mRNA competing endogenous RNA
network.
| A, Biological
process |
|---|
|
|---|
| Term | P-value | Genes |
|---|
| GO:0002684~positive
regulation of immune system process |
1.01×10³ | PVR, C8B, PRKCQ,
NCK2, CADM1, SLA2, VEGFA, CD247, SPN |
| GO:0010033~response
to organic substance |
3.44×10³ | IL1R1, SOCS3,
STRN3, LEPR, ADCY5, PPARGC1B, MSX2, ERP44, PRKCQ, ADM, TFRC,
COL6A2, PIK3R3, GNG4, IHH |
| GO:0007166~cell
surface receptor linked signal transduction |
3.57×10³ | IL1R1, LEPR, ADCY5,
GNA12, CD247, FST, CCL28, LGR4, ADCYAP1, MSX2, NMUR1, OXER1, FRAT1,
FRAT2, GNG4, PIK3R3, SPN,PTGER2, SLA2, ITGA4, FZD7, RGS13, EPS15,
NCK2, WNT7B, ADM, P2RY14, VEGFA |
| GO:0009725~response
to hormone stimulus |
4.30×10³ | PRKCQ, ADM, SOCS3,
STRN3, ADCY5, LEPR, PIK3R3, GNG4, PPARGC1B, IHH |
|
GO:0042127~regulation of cell
proliferation |
7.37×10³ | PTGER2, RBBP4,
BAP1, CDC25B, MSX2, PRKCQ, NCK2, ATF3, ADM, VEGFA, SERPINE1, MYO16,
LAMC1, SPN, IHH |
| GO:0009719~response
to endogenous stimulus |
8.05×10³ | PRKCQ, ADM, SOCS3,
STRN3, ADCY5, LEPR, PIK3R3, GNG4, PPARGC1B, IHH |
|
GO:0043062~extracellular structure
organization |
1.31×10² | WNT7B, CADM1, ANK3,
DMP1, COL6A2, LAMC1 |
|
GO:0007568~aging |
1.48×10² | PRKCQ, TFRC, ADM,
SOCS3, SERPINE1 |
|
GO:0045137~development of primary sexual
characteristics |
2.37×10² | LEPR, FST, VEGFA,
FOXO3, LGR4 |
| GO:0048545~response
to steroid hormone stimulus |
2.48×10² | ADM, SOCS3, STRN3,
LEPR, PPARGC1B, IHH |
| GO:0008284~positive
regulation of cell proliferation |
2.60×10² | PRKCQ, NCK2, ATF3,
ADM, VEGFA, LAMC1, SPN, CDC25B, IHH |
| GO:0001666~response
to hypoxia |
2.81×10² | PRKCQ, TFRC, ADM,
SOCS3, VEGFA |
| GO:0008202~steroid
metabolic process |
2.99×10² | CYP3A4, SOAT1,
SULT2A1, ADM, LEPR, PRKAA2 |
|
GO:0016337~cell-cell adhesion |
3.15×10² | PVR, CADM1,
COL13A1, CTNND2, COL6A2, ITGA4, CHAD |
| GO:0070482~response
to oxygen levels |
3.31×10² | PRKCQ, TFRC, ADM,
SOCS3, VEGFA |
| GO:0050778~positive
regulation of immune response |
3.61×10² | PVR, C8B, CADM1,
SLA2, CD247 |
| GO:0007548~sex
differentiation |
4.09×10² | LEPR, FST, VEGFA,
FOXO3, LGR4 |
|
| B, KEGG
pathway |
|
| Term | P-value | Genes |
|
| hsa00230:Purine
metabolism |
3.14×10³ | PDE7B, ADCY5,
PDE4A, ENTPD6, AK5, ENTPD4, POLR2D, NT5E |
| hsa04510:Focal
adhesion |
3.77×10³ | VEGFA, COL6A2,
COL6A1, LAMC2, LAMC1, ITGA4, PIK3R3, CRK, CHAD |
|
hsa04512:ECM-receptor interaction |
4.15×10³ | COL6A2, COL6A1,
LAMC2, LAMC1, ITGA4, CHAD |
|
hsa04920:Adipocytokine signaling
pathway |
1.02×10² | PRKCQ, SOCS3, RXRB,
LEPR, PRKAA2 |
| hsa04150:mTOR
signaling pathway |
2.82×10² | VEGFA, ULK3,
PRKAA2, PIK3R3 |
| hsa04062:Chemokine
signaling pathway |
2.90×10² | ADCY5, FOXO3,
PIK3R3, GNG4, CRK, CCL28 |
| hsa04310:Wnt
signaling pathway |
3.13×10² | WNT7B, PPP2R5B,
FRAT1, FRAT2, FZD7 |
| hsa04660:T cell
receptor signaling pathway |
3.16×10² | PRKCQ, NCK2, CD247,
PIK3R3 |
| hsa03320:PPAR
signaling pathway |
3.22×10² | RXRB, SCD,
SLC27A2 |
| hsa04514:Cell
adhesion molecules (CAMs) |
3.23×10² | PVR, CADM1, ITGA4,
SPN |
| hsa04810:Regulation
of actin cytoskeleton |
3.29×10² | GNA12, RDX, ITGA4,
PIK3R3, CRK |
Discussion
Although the same datasets were used from the study
by Han et al (22), the
present study applied several different bioinformatics methods
aiming to screen crucial molecular mechanisms for OLF: i) Hub genes
were identified by constructing the PPI network, ranking the nodes
according to the topological properties and extracting the
sub-modules; ii) the target genes of miRNAs were predicted using
the miRwalk database, which contained 12 prediction algorithms, not
only three; and iii) the key lncRNAs were identified on the basis
of the lncRNA-miRNA-mRNA ceRNA regulatory network, not the
lncRNA-mRNA co-expression network. Accordingly, the present study
may provide certain novel miRNAs and lncRNAs for explaining the
pathogenesis of OLF, and developing novel therapeutic approaches
for OLF. As a result, it was identified, for the first time to the
best of the authors' knowledge, that miR-210-3p may be a key miRNA
for OLF by regulating immune-related gene IL10. lncRNA SNHG16,
ASB16-AS1 and NEAT1 may also be important by acting as ceRNAs for
miR-196a-5p, miR-379-5p and miR-181b-5p to modulate the expression
levels of miRNA target genes SOCS3, GNG4 and ADCY5, respectively.
SOCS3 was involved in ‘response to hypoxia’, ‘regulation of
apoptosis’ and ‘regeneration’, while GNG4 and ADCY5 participated in
the ‘Chemokine signaling pathway’. All these mRNAs were hub genes
in the PPI network.
Previous studies have demonstrated that inflammatory
cytokines promote hypertrophy and ossification of LF cells, but
only a number of them (TNF-α, IL-1α and IL-6) have been
investigated (13–15). The present study predicted that
IL10, SOCS3 and ADCY5 may be anti-inflammatory due to their
downregulation, while GNG4 may be pro-inflammatory due to its
upregulation in OLF. The associations of the identified genes with
inflammation can be indirectly confirmed. For example, IL10 is a
known anti-inflammatory cytokine that was identified to have lower
expression in subligamentous type of disc degeneration (8). SOCS3 may mediate the blockade of
inflammation by inhibiting Janus kinase-STAT3 activity and to
prevent the abnormal expression of IL-6 (32,33).
ADCY5 was also demonstrated to be significantly downregulated in
cytokine-related hepatocellular carcinoma (34) and prostate cancer (35). Although GNG4 was previously
demonstrated to be downregulated in glioblastoma cells and
exogenous overexpression of GNG4 can inhibit stromal cell-derived
factor 1/C-X-C motif chemokine receptor 4-dependent chemokine
signaling (36), two recent
studies observed that GNG4 was significantly upregulated in
patients with colon cancer (37)
and cardiovascular events (38),
indicating its potential pro-inflammatory and pro-proliferation
roles. In agreement with these two studies, the present study
additionally identified that GNG4 was upregulated in LF cells.
Although there have been previous studies that
examined the roles of miRNAs in OLF, all of these studies focused
on miRNAs that regulate osteogenic differentiation related genes
(17–20,39).
miRNAs related with inflammation and cell proliferation in OLF have
rarely been reported. Using comprehensive analysis, the present
study identified that miR-210-3p, miR-196a-5p and miR-181b-5p
targeting anti-inflammatory IL10, SOCS3 and ADCY5, respectively,
were upregulated, but miR-379-5p, which targets pro-inflammatory
GNG4, was downregulated in OLF. The interaction associations
between miR-210 and miR-196 and their target genes has been
demonstrated in other inflammatory diseases. For example,
administration of agomir-210 significantly upregulated IL-10 and
attenuated cellular apoptosis and inflammation in an injured rat
spinal cord, ultimately improving functional recovery (40). Ectopic expression of miR-196
promoted stemness and chemoresistance of colorectal cancer cells by
targeting SOCS3, a negative regulator of the STAT3 signaling
pathway (41). miR-181b has been
reported to stimulate inflammation via the nuclear factor-κB
signaling pathway (42), while
miR-379 significantly suppresses the invasive capacity of cancer
cells by inhibiting cytokine IL-18 (43). These findings may indirectly verify
the important roles of these miRNAs in inflammatory OLF.
Furthermore, the present study also identified
several crucial lncRNAs that regulated the mentioned inflammation
and cell proliferation related genes based on the ceRNA hypothesis,
including downregulated lncRNA SNHG16/NEAT1 and upregulated
ASB16-AS1. Although their mechanisms in OLF require confirmation in
further experiments, previous studies have indirectly identified
their underlying associations. Zhao et al (44) demonstrated that NEAT1 was decreased
in primary acute myeloid leukemia cells and THP-1 monocytes
compared with normal cells; overexpression of NEAT1 inhibits cell
proliferation, promotes apoptosis and affects the cell cycle.
Overexpressed ASB16-AS1 has been reported to increase the
expression of osteoblastogenesis-related genes (BMP2 and ALP)
(45) which were previously
demonstrated to be induced by inflammatory cytokines (14). The roles of SNHG16 on cell
proliferation may be controversial, although the majority of
studies have demonstrated that SNHG16 may functions as an oncogene
(46,47). However, the present study
identified that expression of SNHG16 decreased in LF cells of
patients with OLF compared with the controls and further
investigation is necessary to elucidate the underlying biological
associations between SNHG16 and OLF.
In addition to inflammation genes, the present study
also identified the significant miRNAs and lncRNAs associated with
osteogenic differentiation related genes. miR-329-3p and miR-222-5p
were involved in ossification by regulating COL13A1 and COL2A1,
respectively. RHPN1-AS1 functioned as a ceRNA for miR-299-3p to
influence the Wnt signaling pathway through WNT7B. These results
were in agreement with a previous study, in which inhibition of
miR-222-3p in human bone mesenchymal stem cells promoted the
expression of osteoblast-specific genes, ALP activity, and matrix
mineralization, while overexpression of miR-222-3p inhibited
osteoblast differentiation (48).
The roles of other miRNAs and lncRNAs require further
investigation.
There are certain limitations to the present study.
Only two datasets were included to examine the molecular mechanisms
of OLF due to limited previous studies. Also, the current sample
size of these datasets was small. Therefore, further studies using
high-throughput sequencing experiments with larger clinical samples
would be valuable. Another limitation is that this is a preliminary
study to identify the crucial miRNAs and lncRNAs for OLF. Further
in vitro and in vivo experiments are necessary to
confirm the expression levels of these identified miRNAs and
lncRNAs in OLF, and to demonstrate the regulatory associations
between them and the downstream DEGs.
In conclusion, the present study identified several
inflammation and osteogenic differentiation related miRNA-mRNAs
(miR-210-3p-IL10, hsa-miR-329-3p-COL13A1 and hsa-miR-222-5p-COL2A1)
or lncRNA-miRNA-mRNA interaction axes
(SNHG16-hsa-miR-196a-5p-SOCS3, ASB16-AS1-hsa-miR-379-5p-GNG4,
NEAT1-has-miR-181b- 5p-ADCY5 and RHPN1-AS1-hsa-miR-299-3p-WNT7B),
which may be involved in the pathogenesis of OLF. These miRNAs and
lncRNAs may be natural, endogenous and nontoxic drug targets for
the treatment of OLF.
Acknowledgements
Not applicable.
Funding
No funding was received.
Availability of data and materials
The microarray data GSE106253 and GSE106256 were
downloaded from The Gene Expression Omnibus database in National
Center for Biotechnology Information (http://www.ncbi.nlm.nih.gov/geo/).
Authors' contributions
DK and FW were involved in the conception and design
of this study. DK and QZ collected the data and performed the
bioinformatics analyses. WL prepared the figures and interpreted
the data. DK drafted the manuscript. FW revised the manuscript. All
authors read and approved the final manuscript.
Ethics approval and consent to
participate
Not applicable.
Patient consent for publication
Not applicable.
Competing interests
The authors declare that they have no competing
interests.
References
|
1
|
Lang N, Yuan HS, Wang HL, Liao J, Li M,
Guo FX, Shi S and Chen ZQ: Epidemiological survey of ossification
of the ligamentum flavum in thoracic spine: CT imaging observation
of 993 cases. Eur Spine J. 22:857–862. 2013. View Article : Google Scholar : PubMed/NCBI
|
|
2
|
Mori K, Imai S, Kasahara T, Nishizawa K,
Mimura T and Matsusue Y: Prevalence, distribution and morphology of
thoracic ossification of the posterior longitudinal ligament in
Japanese: Results of CT-based cross-sectional study. Spine (Phila
Pa 1976). 65:394–399. 2014. View Article : Google Scholar
|
|
3
|
Moon BJ, Kuh SU, Kim S, Kim KS, Yong EC
and Dong KC: Prevalence, distribution and significance of
incidental thoracic ossification of the ligamentum flavum in Korean
patients with back or leg pain: MR-based cross sectional study. J
Korean Neurosurg Soc. 58:112–118. 2015. View Article : Google Scholar : PubMed/NCBI
|
|
4
|
Ono K, Yonenobu K, Miyamoto S and Okada K:
Pathology of ossification of the posterior longitudinal ligament
and ligamentum flavum. Clin Orthop Relat Res. 359:18–26. 1999.
View Article : Google Scholar
|
|
5
|
Wang H, Wei F, Long H, Han G, Sribastav
SS, Li Z, Huang Y, Zhu R and Liang C: Surgical outcome of thoracic
myelopathy caused by ossification of ligamentum flavum. J Clin
Neurosci. 45:83–88. 2017. View Article : Google Scholar : PubMed/NCBI
|
|
6
|
Yabe Y, Honda M, Hagiwara Y, Tohjo Y,
Nakajima S, Ando A, Sonofuchi K and Itoi E: Thoracic radiculopathy
caused by ossification of the ligamentum flavum. Ups J Med Sci.
118:54–58. 2013. View Article : Google Scholar : PubMed/NCBI
|
|
7
|
Zhong ZM, Wu Q, Meng TT, Zhu YJ, Qu DB,
Wang JX, Jiang JM, Lu KW, Zheng S and Zhu SY: Clinical outcomes
after decompressive laminectomy for symptomatic ossification of
ligamentum flavum at the thoracic spine. J Clin Neurosci. 28:77–81.
2016. View Article : Google Scholar : PubMed/NCBI
|
|
8
|
Ren L, Hu H, Sun X, Li F, Zhou JJ and Wang
YM: The roles of inflammatory cytokines in the pathogenesis of
ossification of ligamentum flavum. Am J Transl Res. 5:582–585.
2013.PubMed/NCBI
|
|
9
|
Ning S, Chen Z, Fan D, Sun C, Zhang C,
Zeng Y, Li W, Hou X, Qu X and Ma Y: Genetic differences in
osteogenic differentiation potency in the thoracic ossification of
the ligamentum flavum under cyclic mechanical stress. Int J Mol
Med. 39:135–143. 2017. View Article : Google Scholar : PubMed/NCBI
|
|
10
|
Qu X, Chen Z, Fan D, Sun C, Zeng Y, Hou X
and Ning S: Notch signaling pathways in human thoracic ossification
of the ligamentum flavum. J Orthop Res. 34:1481–1491. 2016.
View Article : Google Scholar : PubMed/NCBI
|
|
11
|
Hou XF, Fan DW, Sun CG and Chen ZQ:
Recombinant human bone morphogenetic protein-2-induced ossification
of the ligamentum flavum in rats and the associated global
modification of histone H3. J Neurosurg Spine. 21:334–341. 2014.
View Article : Google Scholar : PubMed/NCBI
|
|
12
|
Zhong ZM, Chen JT, Zhang Y, Zha DS, Lin
ZS, Zhao CY, Xu JC, Li T and Xu Z: Growth/differentiation Factor-5
induces osteogenic differentiation of human ligamentum flavum cells
through activation of ERK1/2 and p38 MAPK. Cell Physiol Biochem.
26:179–186. 2010. View Article : Google Scholar : PubMed/NCBI
|
|
13
|
Zhang C, Chen Z, Meng X, Li M, Zhang L and
Huang A: The involvement and possible mechanism of pro-inflammatory
tumor necrosis factor alpha (TNF-α) in thoracic ossification of the
ligamentum flavum. PLoS One. 12:e01789862017. View Article : Google Scholar : PubMed/NCBI
|
|
14
|
Park JO, Lee BH, Kang YM, Kim TH, Yoon JY,
Kim H, Kwon UH, Lee KI, Lee HM and Moon SH: Inflammatory cytokines
induce fibrosis and ossification of human ligamentum flavum cells.
J Spinal Disord Tech. 26:E6–E12. 2013. View Article : Google Scholar : PubMed/NCBI
|
|
15
|
Wang B, Chen Z, Meng X, Li M, Yang X and
Zhang C: iTRAQ quantitative proteomic study in patients with
thoracic ossification of the ligamentum flavum. Biochem Biophys Res
Commun. 487:834–839. 2017. View Article : Google Scholar : PubMed/NCBI
|
|
16
|
Hausser J and Zavolan M: Identification
and consequences of miRNA-target interactions-beyond repression of
gene expression. Nat Rev Genet. 15:599–612. 2014. View Article : Google Scholar : PubMed/NCBI
|
|
17
|
Yin J, Zhuang G, Zhu Y, Hu X, Zhao H,
Zhang R, Guo H, Fan X and Cao Y: MiR-615-3p inhibits the osteogenic
differentiation of human lumbar ligamentum flavum cells via
suppression of osteogenic regulators GDF5 and FOXO1. Cell Biol Int.
41:779–786. 2017. View Article : Google Scholar : PubMed/NCBI
|
|
18
|
Qu X, Chen Z, Fan D, Sun C and Yan Z:
MiR-132-3p regulates the osteogenic differentiation of thoracic
ligamentum flavum cells by inhibiting multiple osteogenesis-related
genes. Int J Mol Sci. 17(pii): E13702016. View Article : Google Scholar : PubMed/NCBI
|
|
19
|
Qu X, Chen Z, Fan D, Sun C, Yan Z, Guo Z,
Qi Q and Li W: MiR-199b-5p inhibits osteogenic differentiation in
ligamentum flavum cells by targeting JAG1 and modulating the Notch
signalling pathway. J Cell Mol Med. 21:1159–1170. 2017. View Article : Google Scholar : PubMed/NCBI
|
|
20
|
Yayama T, Mori K, Okumura N, Nishizawa K,
Kumagai K, Nakamura A and Imai S: Wnt signaling pathway correlates
with ossification of the spinal ligament: A microRNA array and
immunohistochemical study. J Orthop Sci. 23:26–31. 2018. View Article : Google Scholar : PubMed/NCBI
|
|
21
|
Salmena L, Poliseno L, Tay Y, Kats L and
Pandolfi PP: ceRNA hypothesis: The Rosetta stone of a hidden RNA
language? Cell. 146:353–358. 2011. View Article : Google Scholar : PubMed/NCBI
|
|
22
|
Han Y, Hong Y, Li L, Li T, Zhang Z, Wang
J, Xia H, Tang Y, Shi Z, Han X, et al: A Transcriptome-level study
identifies changing expression profiles for ossification of the
ligamentum flavum of the spine. Mol Ther Nucleic Acids. 12:872–883.
2018. View Article : Google Scholar : PubMed/NCBI
|
|
23
|
Ritchie ME, Phipson B, Wu D, Hu Y, Law CW,
Shi W and Smyth GK: limma powers differential expression analyses
for RNA-sequencing and microarray studies. Nucleic Acids Res.
43:e472015. View Article : Google Scholar : PubMed/NCBI
|
|
24
|
Larkin MA, Blackshields G, Brown NP,
Chenna R, McGettigan PA, McWilliam H, Valentin F, Wallace IM, Wilm
A, Lopez R, et al: Clustal W and Clustal X version 2.0.
Bioinformatics. 23:2947–2948. 2007. View Article : Google Scholar : PubMed/NCBI
|
|
25
|
Szklarczyk D, Franceschini A, Wyder S,
Forslund K, Heller D, Huerta-Cepas J, Simonovic M, Roth A, Santos
A, Tsafou KP, et al: STRING v10: Protein-protein interaction
networks, integrated over the tree of life. Nucleic Acids Res.
43:D447–D452. 2015. View Article : Google Scholar : PubMed/NCBI
|
|
26
|
Kohl M, Wiese S and Warscheid B:
Cytoscape: Software for visualization and analysis of biological
networks. Methods Mol Biol. 696:291–303. 2011. View Article : Google Scholar : PubMed/NCBI
|
|
27
|
Tang Y, Li M, Wang J, Pan Y and Wu FX:
CytoNCA: A cytoscape plugin for centrality analysis and evaluation
of protein interaction networks. Biosystems. 127:67–72. 2015.
View Article : Google Scholar : PubMed/NCBI
|
|
28
|
Bader GD and Hogue CW: An automated method
for finding molecular complexes in large protein interaction
networks. BMC Bioinformatics. 4:22003. View Article : Google Scholar : PubMed/NCBI
|
|
29
|
Dweep H and Gretz N: miRWalk2.0: A
comprehensive atlas of microRNA-target interactions. Nat Methods.
12:6972015. View Article : Google Scholar : PubMed/NCBI
|
|
30
|
Li JH, Liu S, Zhou H, Qu LH and Yang JH:
starBase v2.0: Decoding miRNA-ceRNA, miRNA-ncRNA and protein-RNA
interaction networks from large-scale CLIP-Seq data. Nucleic Acids
Res. 42:D92–D97. 2014. View Article : Google Scholar : PubMed/NCBI
|
|
31
|
Huang DW, Sherman BT and Lempicki RA:
Systematic and integrative analysis of large gene lists using DAVID
bioinformatics resources. Nat Protoc. 4:44–57. 2009. View Article : Google Scholar : PubMed/NCBI
|
|
32
|
Dominguez E, Mauborgne A, Mallet J,
Desclaux M and Pohl M: SOCS3-mediated blockade of JAK/STAT3
signaling pathway reveals its major contribution to spinal cord
neuroinflammation and mechanical allodynia after peripheral nerve
injury. J Neurosci. 30:5754–5766. 2010. View Article : Google Scholar : PubMed/NCBI
|
|
33
|
Fukushima A, Kajiya H, Izumi T, Shigeyama
C, Okabe K and Anan H: Pro-inflammatory cytokines induce suppressor
of cytokine signaling-3 in human periodontal ligament cells. J
Endod. 36:1004–1008. 2010. View Article : Google Scholar : PubMed/NCBI
|
|
34
|
Chen H, Cai W, Chu ESH, Tang J, Wong CC,
Wong SH, Sun W, Liang Q, Fang J, Sun Z and Yu J: Hepatic
cyclooxygenase-2 overexpression induced spontaneous hepatocellular
carcinoma formation in mice. Oncogene. 36:4415–4426. 2017.
View Article : Google Scholar : PubMed/NCBI
|
|
35
|
Li D, Hao X and Song Y: Identification of
the Key MicroRNAs and the miRNA-mRNA regulatory pathways in
prostate cancer by bioinformatics methods. Biomed Res Int.
2018:62041282018.PubMed/NCBI
|
|
36
|
Pal J, Patil V, Mondal B, Shukla S, Hegde
AS, Arivazhagan A, Santosh V and Somasundaram K: Epigenetically
silenced GNG4 inhibits SDF1α/CXCR4 signaling in mesenchymal
glioblastoma. Genes Cancer. 7:136–147. 2016.PubMed/NCBI
|
|
37
|
Liang L, Zeng JH, Qin XG, Chen JQ, Luo DZ
and Chen G: Distinguishable prognostic signatures of left- and
right-sided colon cancer: A study based on sequencing data. Cell
Physiol Biochem. 48:475–490. 2018. View Article : Google Scholar : PubMed/NCBI
|
|
38
|
Liao J, Chen Z, He Q, Liu Y and Wang J:
Differential gene expression analysis and network construction of
recurrent cardiovascular events. Mol Med Rep. 13:1746–1764. 2016.
View Article : Google Scholar : PubMed/NCBI
|
|
39
|
Zhang Q, Shen Y, Jiang Y, Zhao S, Zhou D
and Xu N: Overexpression of miR-182 inhibits ossification of
ligamentum flavum cells by targeting NAMPT. Exp Cell Res.
367:119–131. 2018. View Article : Google Scholar : PubMed/NCBI
|
|
40
|
Cao Y, Wu TD, Wu H, Lang Y, Li DZ, Ni SF,
Lu HB and Hu JZ: Synchrotron radiation micro-CT as a novel tool to
evaluate the effect of agomir-210 in a rat spinal cord injury
model. Brain Res. 1655:55–65. 2017. View Article : Google Scholar : PubMed/NCBI
|
|
41
|
Ren D, Lin B, Zhang X, Peng Y, Ye Z, Ma Y,
Liang Y, Cao L, Li X, Li R, et al: Maintenance of cancer stemness
by miR-196b-5p contributes to chemoresistance of colorectal cancer
cells via activating STAT3 signaling pathway. Oncotarget.
8:49807–49823. 2017. View Article : Google Scholar : PubMed/NCBI
|
|
42
|
Wang Y, Mao G, Lv Y, Huang Q and Wang G:
MicroRNA-181b stimulates inflammation via the nuclear factor-κB
signaling pathway in vitro. Exp Ther Med. 10:1584–1590. 2015.
View Article : Google Scholar : PubMed/NCBI
|
|
43
|
Yamamoto K, Seike M, Takeuchi S, Soeno C,
Miyanaga A, Noro R, Minegishi Y, Kubota K and Gemma A: MiR-379/411
cluster regulates IL-18 and contributes to drug resistance in
malignant pleural mesothelioma. Oncol Rep. 32:2365–2372. 2014.
View Article : Google Scholar : PubMed/NCBI
|
|
44
|
Zhao C, Wang S, Zhao Y, Du F, Wang W, Lv P
and Qi L: Long noncoding RNA NEAT1 modulates cell proliferation and
apoptosis by regulating miR-23a-3p/SMC1A in acute myeloid leukemia.
J Cell Physiol. 234:6161–6172. 2019. View Article : Google Scholar : PubMed/NCBI
|
|
45
|
Meng XH, Chen XD, Greenbaum J, Zeng Q, You
SL, Xiao HM, Tan LJ and Deng HW: Integration of summary data from
GWAS and eQTL studies identified novel causal BMD genes with
functional predictions. Bone. 113:41–48. 2018. View Article : Google Scholar : PubMed/NCBI
|
|
46
|
Feng F, Chen A, Huang J, Xia Q, Chen Y and
Jin X: Long noncoding RNA SNHG16 contributes to the development of
bladder cancer via regulating miR-98/STAT3/Wnt/β-catenin pathway
axis. J Cell Biochem. 119:9408–9418. 2018. View Article : Google Scholar : PubMed/NCBI
|
|
47
|
Lu YF, Cai XL, Li ZZ, Lv J, Xiang YA, Chen
JJ, Chen WJ, Sun WY, Liu XM and Chen JB: LncRNA SNHG16 functions as
an oncogene by sponging miR-4518 and up-regulating PRMT5 expression
in Glioma. Cell Physiol Biochem. 45:1975–1985. 2018. View Article : Google Scholar : PubMed/NCBI
|
|
48
|
Yan J, Guo D, Yang S, Sun H, Wu B and Zhou
D: Inhibition of miR-222-3p activity promoted osteogenic
differentiation of hBMSCs by regulating Smad5-RUNX2 signal axis.
Biochem Biophys Res Commun. 470:498–503. 2016. View Article : Google Scholar : PubMed/NCBI
|