Introduction
CD4+CD25+ regulatory T cells
(Tregs), a subpopulation of T cells positive for CD4 that
constitutively express the transcription factor forkhead box
protein3 (Foxp3), account for 5–10% of the peripheral
CD4+ T cells in normal humans and mice (1,2).
Inducible Tregs (iTregs), a subset of Tregs, play an important role
in a number of immune diseases by regulating the function of
conventional CD4+ T cells and CD8+ T cells
(3,4). Moreover, iTregs have also been
reported to be promising targets in the development of
immunotherapies against various immune related diseases (5,6).
However, the instability of iTregs, including the loss of Foxp3
expression and their ability to suppress conventional
CD4+ T cells and CD8+ T cells, is an obstacle
for clinical research (7,8). Previous studies showed that microRNAs
(miRs/miRNAs), noncoding RNAs that negatively regulate the
post-transcriptional expression of their target genes and are 20–22
nucleotides in length, play an important role in the induction and
instability of iTregs (9,10). It has been reported that miR-155
regulates the induction and suppressive function of iTregs through
the suppressor of cytokine signaling 1 (SOCS1) pathway (11). Furthermore, the miR-17-92 cluster
was reported to be involved in the induction of iTregs though
Ikaros family zinc finger protein 4 (12). Similarly, our previous study showed
that miR-126 may regulate the induction of iTregs via the Akt
pathway (13). However, the exact
role and the mechanisms of distinct miRNAs related to the
instability of iTregs have not been fully elucidated.
miR-30a is a member of the miRNA-30 family, which is
associated with the inflammatory response, and the development and
progression of various types of cancer (14–16).
Previous studies have shown that miR-30a may be a promising new
target for gene therapy against breast cancer and other types of
tumors (17,18). With regards to the immune system,
previous studies have suggested a potential role for miR-30a in the
function of immune cells and the development of related diseases
(19–21). Wu et al (22) found that miR-30a regulates the
function of macrophages in response to Mycobacterium
tuberculosis (MTB) stimulation by altering the expression of
myeloid differentiation primary response 88. Fang et al
(23) reported that overexpression
of miR-30a in microglia promotes the apoptosis of oligodendrocyte
precursor cells and inhibits their differentiation. Furthermore,
the overexpression of miR-30a in transplanted microglia exacerbates
the progression of experimental autoimmune encephalomyelitis (EAE),
which is associated with a change in the expression of peroxisome
proliferator-activated receptor-γ coactivator 1-β (23). In addition, Qu et al
(24) reported that miR-30a
regulates the differentiation of T-helper 17 (Th17) cells by
targeting the interleukin (IL)-21 receptor, contributing to the
development of EAE. However, the potential role of miR-30a in other
immune cells types, including CD4+ Tregs remains to be
explored.
In the present study, the expression pattern of
miR-30a in murine CD4+ iTregs was investigated. The
present study identified that the overexpression of miR-30a reduced
the expression of Foxp3 in murine CD4+ iTregs and
impaired their suppressive abilities in vitro. An adoptive
cell transfer (ACT) assay showed that the overexpression of miR-30a
abrogated the suppressive capacity of iTregs on the function of
murine CD8+ T cells in a murine lung cancer model, which
was accompanied by the altered expression of CD69, CD44 and
interferon (IFN)-γ in murine CD8+ T cells. To the best
of our knowledge, the data in the present study demonstrated a
previously unknown role of miR-30a in the instability of iTregs and
provided a novel insight into the development of therapeutic
strategies for promoting T-cell immunity via the regulation of
iTregs by targeting specific miRNAs.
Materials and methods
Animals
In total, 40 female B6.Cg-Foxp3tm2Tch/J
mice (cat. no. 006772; age, 7–10 weeks) and syngeneic recombination
activating gene (RAG) 1−/− mice (cat. no. 002216; 7–10
weeks old) (n=120) were purchased from the Jackson ImmunoResearch
Laboratories, Inc. All mice were maintained in controlled
conditions at a temperature of 22–24°C, a humidity of 55±5% with a
12 h light/dark cycle and free access to water and food in specific
pathogen-free rooms in the Experimental Animal Laboratory of Zunyi
Medical University. All animal experiments were performed according
to the Guidelines for the Care and Use of Laboratory Animals and
all the experimental procedures were approved by the Zunyi Medical
Laboratory Animal Care and Use Committee (permit no. 20150312).
Cell lines and reagents
The C57BJ/6 metastatic lung cancer cell line 3LL was
a gift from Professor Chu (Shanghai Medical College, Fudan
University). The cells were cultured at 37°C with 5% CO2
in RPMI-1640 (Gibco; Thermo Fisher Scientific, Inc.) containing 10%
heat-inactivated FBS (Gibco; Thermo Fisher Scientific, Inc.), 2 mM
glutamine, 100 IU/ml penicillin and 100 µg/ml streptomycin sulfate.
The miR-30 mimic (sense, UGUAAACAUCCUCGACUGGAAG and antisense,
UCCAGUCGAGGAUGUUUACAUU) and a corresponding miR-negative control
(NC; sense, UUCUCCGAACGUGUCACGUTT and antisense,
ACGUGACACGUUCGGAGAATT) were purchased from Ambion (Thermo Fisher
Scientific, Inc.). All other reagents were purchased from
Sigma-Aldrich (Merck KGaA) unless otherwise stated.
Preparation of murine CD4+
T cells
The spleens from normal
B6.Cg-Foxp3tm2Tch/J mice were dissected, added to PBS
ready for homogenization and passed through a 70 mm cell strainer
at room temperature. Erythrocytes were removed by resuspending
cells in ACK lysis buffer (Beyotime Institute of Biotechnology) for
5 min at room temperature before the addition of PBS. Splenocytes
were pelleted by centrifugation (600 × g at room temperature) and
resuspended in PBS. CD4+ CD62L+ T cells were
isolated from the splenic single cell suspensions using
MACS® (cat. no. 130-106-643; Miltenyi Biotec, Inc.),
according to the manufacturer's protocol, for the iTreg cell
differentiation assay. In addition, CD4+
CD25− T cells were also isolated from the splenic single
cell suspensions using MACS®, according to the
manufacturer's protocol, for the suppressive assay in
vitro.
iTreg cell differentiation assay
According to our previous study (13), 4×10⁶ CD4+
CD62L+ T cells were cultured with 2 µg/ml anti-CD3
antibody (cat. no. MAB848-100; R&D Systems, Inc.) and 4 µg/ml
anti-CD28 antibody (cat. no. MAB4832; R&D Systems, Inc.), in
complete RPMI-1640 (10% FBS and 100 U of penicillin and
streptomycin) containing 20 pmol/ml transforming growth factor
(TGF)-β (Novus Biologicals, Ltd.) and 200 IU/ml IL-2 (Novus
Biologicals, Ltd.). After 7 days of culture at 37°C, the cells were
harvested and the presence of Foxp3+ T cells was
determined by flow cytometry.
Transient transfections
For transient transfections, miR-30a mimics (10 ng)
or the miR-NC (10 ng) was mixed with 100 µl of T-cell Nucleofector
solution (Amaxa; Lonza Group, Ltd.) and transfected into
2×10⁶ iTreg cells by electroporation using a
Nucleofector II instrument (program no. T-020; Amaxa; Lonza Group,
Ltd.) using Nucleofector II buffer (Amaxa; Lonza Group, Ltd),
according to the manufacturer' protocol. The transfection
efficiency was ~65% as evaluated by flow cytometry using a
fluorescently-labeled mimic control (GE Healthcare Dharmacon,
Inc.). After transfection, the cells were allowed to recover for 4
h at 37°C before use in the subsequent experiments.
Suppressive assay in vitro
To test iTregs suppressive activity,
5×10⁴ CD4+CD25− cells were treated
with 2 µg/ml anti-CD3 antibody and 4 µg/ml anti-CD28 antibody for
12 h as effector cells. The effector cells were incubated with or
without iTregs at a ratio of 2:1 for 72 h in complete RPMI-1640
supplemented with 5% FCS. Proliferation was analyzed using an MTT
assay. DMSO was used to dissolve the formazan crystals and the
absorbance was measured at a wave length of 570 nm.
Flow cytometry
Cells were incubated with blocking buffer (1% BSA
and 0.1% saponin) for 30 min at 4°C and washed with PBS twice.
Next, the surface markers of various immune cells were evaluated
using flow cytometry performed using the Beckman Gallios flow
cytometer (Beckman Coulter, Inc.) and using CellQuest Pro software
(version 5.1; BD Biosciences). The following antibodies were used:
CD8-allophycocyanin (cat. no. MCD0805), Ki-67-FITC (cat. no.
11-5699-42), CD69-phycoerythrin (cat. no. 12-0691-83), CD44-PE
(cat. no. 12-0441-82), IFN-γ-PE (cat. no. 12-7319-82), granzyme
B-FITC (cat. no. 11-8898-82) and the corresponding isotype-matched
controls (cat. nos. 11-4321-42, 12-4321-80 and 17-4321-81; all from
eBioscience; Thermo Fisher Scientific, Inc.). The antibodies were
used at a dilution of 1:100 for 30 min at 4°C. To determine the
proportion of CD8+ T cells and the surface molecule
expression of CD44 and CD69 on CD8+ T cells, cells were
stained with the aforementioned antibodies (1:100) at 4°C for 30
min and washed with PBS twice before analysis, according to the
manufacturer's protocol.
To determine the expression levels of CTLA-4 and
GITR on iTregs, iTregs were stained with CTLA-4-FITC (cat. no.
ab24935; Abcam) and GITR-FITC (cat. no. ab72404; Abcam) at a
dilution of 1:100 at 4°C for 30 min, and washed with PBS twice
before analysis.
Reverse transcription-quantitative
(RT-q)PCR
RNA was extracted using TRIzol (Invitrogen; Thermo
Fisher Scientific, Inc.), according to manufacturer's protocol.
Primers were obtained from Sangon Biotech Co., Ltd. The TaqMan
MicroRNA Reverse Transcription kit and the TaqMan Reverse
Transcription kit were obtained from Takara Bio, Inc. The qPCR
reactions for determining the level of miRNA or mRNA expression
were performed using miScript SYBR Green PCR Kit (Exiqon; Qiagen
GmbH) or QuantiFast SYBR Green PCR kit (Qiagen GmbH), respectively.
RT reactions and qPCR assays were performed according to the
manufacturer's protocol. The RT reactions were performed as
follows: 16°C for 15 min followed by 42°C for 30 min and 85°C for 5
min. The qPCR reaction was conducted with an initial denaturation
step at 95°C for 15 min, followed by 40 cycles of 94°C for 15 sec,
60°C for 30 sec and 72°C for 30 sec. All RT reactions, including
the no template and no reverse transcriptase controls, were
performed in triplicate using a Bio-Rad CFX96 (Bio-Rad
Laboratories, Inc.). The following primers were obtained from
Exiqon (Qiagen GmbH) and used for the analysis of miRNA expression:
miR-126, 5′-CAUUAUUACUUUUGGUACGCG-3′ (cat. no. YP00206010); miR-31,
5′-AGGCAAGAUGCUGGCAUAGCUG-3′ (cat. no. MS00001407); miR-125b,
5′-UCCCUGAGACCCUAACUUGUGA-3′ (cat. no. MS00005992); miR-181a,
5′-AACAUUCAACGCUGUCGGUGAGU-3′ (cat. no. YP00206081); miR-30a,
5′-UGUAAACAUCCUCGACUGGAAG-3′ (cat. no. MS00011704); miR-27a,
5′-UUCACAGGGCUAAGUUCCGC-3′ (cat. no. MS00001351); miR-101a,
5′-UACAGUACUGUGAUAACUGAA-3′ (cat. no. MS00011011); and U6,
5′-AGAGAAGATTAGCATGGCCCCTG-3′. In addition, the following primers
were also used: IL-10 forward, 5′-TACACCGGGAAGACAATAA-3′ and
reverse, 5′-AGGAGTCGGTTAGCAGTATG-3′; TGF-β forward,
5′-GGCGGTGCTCGCTTTGTA-3′ and reverse, 5′-TCCCATGTCTGACGTATTGA-3′;
SOCS1 forward, 5′-TTCGACTGCCTTTTCGAGCT-3′ and reverse,
5′-GAAGAAGCAGTTCCGTTGGC-3′; and GAPDH forward,
5′-GAGCCAAACGGGTCATCATCT-3′ and reverse,
5′-GAGGGGCCATCCACAGTCTT-3′. The samples were normalized to GAPDH
for mRNA or U6 for miRNA expression. The relative expression was
calculated using the comparative quantification cycle (Cq) method
(25).
ACT
ACT was performed as previously described with some
modifications (13). Syngeneic
female RAG1−/− mice (6–8 weeks age) were divided into
three groups: i) CD8+ T cell transfer only; ii)
CD8+ T cell with iTregs transfected with miR-30a mimic;
and iii) CD8+ T cell with iTregs transfected with
miR-NC. C57/BJ Mice (6–8 weeks old) were injected subcutaneously
with 0.2 ml of a single-cell suspension in PBS containing
2×10⁵ 3LL lung cancer cells in the right lateral abdomen
region. After 7 days, 3LL specific CD8+ T cells, with or
without iTregs transiently transfected with miR-30a mimic (10 ng)
or miR-NC (10 ng) at a ratio of 2:1, were transferred into the tail
vein. The size of the tumor mass in each group was determined 21
days later. The tumor volumes were measured and calculated
according to the following formula: V=(W2 × L)/2, where
V is the tumor volume, W is the width and L is the length. To
obtain 3LL-specific CD8+ T cells, C57BL/6J mice were
immunized subcutaneously with 1×10⁶ mitomycin C-treated
3LL cells (10 µg/ml mitomycin C for 2 h) three times in total,
every 7 days. After 10 days, the splenocytes were harvested and
re-stimulated with mitomycin C-treated 3LL cells for 24 h at 37°C
in the presence of IL-2 (50 U/ml) in vitro. Following this,
2×10⁶ 3LL specific CD8+ T cells were purified
by fluorescence assisted cell sorting (MoFlo Astrios Cell
Sorter; Beckman Coulter, Inc) and adoptively transferred into
syngeneic RAG1−/− mice bearing 3LL cells.
Intracellular staining for IFN-γ and
granzyme B
Syngeneic RAG1−/− mice bearing 3LL cells
were sacrificed by cervical dislocation following an overdose of
anesthesia performed by intraperitoneal injection of 150 mg/kg
pentobarbital sodium. Tumor infiltrating lymphocytes were isolated
according to a previous report (13). After staining for CD8, cells were
fixed and permeabilized using the Cytofix/Cytoperm and Perm/Wash
buffers (both from BD Biosciences), according to the manufacturer's
protocol. Cells were stained with IFN-γ-PE (1:100) or granzyme
B-FITC (1:100) at 25°C for 20 min and washed twice in Perm/Wash
buffer before flow cytometry analysis.
Ki-67 staining assay
Tumor infiltrating lymphocytes (TILs) were isolated
as aforementioned. After staining for CD8, cells were fixed and
permeabilized using the Cytofix/Cytoperm and Perm/Wash buffers
(both from BD Biosciences), according to the manufacturer's
protocol. Cells were stained with Ki-67-FITC (1:100) at 25°C for 20
min and washed twice in Perm/Wash buffer before flow cytometry
analysis.
Plasmid construction, preparation and
transfection
To identify putative targets of miR-30a for plasmid
construction, miRNA target prediction programs were used, including
TargetScan (http://www.targetscan.org/vert_42/, Version 4.2),
miRanda (http://www.microrna.org/microrna/getMirnaForm.do)
and PicTar (https://pictar.mdc-berlin.de/). The SOCS1 coding
sequence (NM_001271603) was amplified using RT-PCR from mouse cDNA
from CD4+ T cells and cloned into the pcDNA3.1 vector
(Invitrogen; Thermo Fisher Scientific, Inc.) to generate the
pcDNA3.1-SOCS1 plasmid (p-SOCS1). PrimeScriptTM RT-PCR kit
was obtained from Takara Bio, Inc. The RT reaction was performed as
aforementioned. The PCR reaction was conducted with an initial
denaturation step at 95°C for 5 min, followed by 40 cycles of 94°C
for 15 sec, 56°C for 15 sec and 72°C for 60 sec. The SOCS1 sequence
was amplified from cDNA derived from CD4+ T cells using
the following primers: Forward,
5′-GCGGATCCAGCAGAGAGAACTGCGGCCGTG-3′ and reverse,
5′-GGAAGCTTAGCGGCAGCCGGTCAGATCTG-3′. The product was subcloned into
the BamHI and HindIII sites of the pcDNA3.1 vector.
To construct p-SOCS1-WT luciferase (Luc), the 3′untranslated region
(UTR; the sequence from 200 to 350 bp downstream of the stop codon)
of SOCS1 was amplified from cDNA derived from CD4+ T
cells using the following primers: Forward,
5′-GCCTCGAGCCTGGTTGTAGCAGCTTG-3′ and reverse,
5′-GGGTCGACTTGTGCAAAGATACTG-3′. To construct p-SOCS1-mut luciferase
(Luc), the following primers were used: forward,
5′-GCCTCGAGCCTGGTTGTAGCAGCTTG-3′ and reverse,
5′-GGGTCGACTCGTTCGTGGAAGAGGTAG-3′. The PCR reaction was conducted
with an initial denaturation step at 95°C for 5 min, followed by 40
cycles of 94°C for 10 sec, 56°C for 10 sec and 72°C for 10 sec. The
PCR products were subcloned into XhoI and SalI sites
of the pmirGLO Dual-Luciferase miRNA Target Expression Vector
(Promega Corporation). The identity of the clone was verified using
restriction enzyme digest analysis and DNA sequencing.
Endotoxin-free plasmids were purified using the Endofree plasmid
mega kit (Qiagen GmbH).
For transient transfections, 10 µg of the p-SOCS1
plasmid or the control plasmid (p-Cont) plasmids were mixed with or
without miR-30a mimic (10 ng) in 100 µl T-cell Nucleofector
solution and used to transfect 2×10⁶ iTreg cells by
electroporation using a Nucleofector II instrument as
aforementioned. After transfection, the cells were allowed to
recover in RPMI1640 for 4 h at 37°C prior to subsequent
experiments.
Luciferase assay
CD4+CD62L+ cells were
transiently co-transfected with wild-type or mutated pSOCS1 Luc (10
µg) and miR-30 mimic (10 ng) or 10 µg the corresponding pmirGLO
control (Promega Corporation) using Lipofectamine® 2000
(Invitrogen; Thermo Fisher Scientific, Inc.), according to the
manufacturer's protocol. The cells were cultured in the presence of
2 µg/ml anti-CD3 and 4 µg/ml CD28 antibody. After 24 h, cell were
harvested and lysed in passive lysis buffer (Promega Corporation).
Luciferase and Renilla activities were measured with a luminometer
using luciferin (Promega Corporation) and coelenterazine (Biotium)
as substrates, respectively. Luciferase activity was measured at a
wavelength of 560 nm. Renilla activity was measured at a wavelength
of 465 nm. Transfection efficiency was normalized using Renilla
activity.
Western blotting
Cells were lysed with RIPA lysis buffer (50 mM Tris
HCl pH 8, 150 mM NaCl, 1% NP-40, 0.5% sodium deoxycholate, 0.1%
SDS, 1 mM phenylmethylsulfonyl fluoride, 1 µg/ml protease
inhibitors and 1 µg/ml phosphatase inhibitors) on ice for 30 min.
The protein concentration was determined using the Bio-Rad protein
assay reagent (Bio-Rad Laboratories, Inc.). Equal amounts of
protein (15 µg) were subjected to 12% SDS-PAGE and transferred to
nitrocellulose membranes. The membranes were blocked with 5%
non-fat dry milk in PBS with 0.1% Tween-20 for 1 h at 37°C. The
membranes were then incubated overnight at 4°C with the following
antibodies at a dilution of 1:100: SOCS1 (cat. no. PA5-27239;
Invitrogen; Thermo Fisher Scientific, Inc.), phosphorylated
(phospho)-Akt (cat. no. 44-621G; Invitrogen; Thermo Fisher
Scientific, Inc.), total Akt (cat. no. PA5-77855; Invitrogen;
Thermo Fisher Scientific, Inc.), phospho-STAT1 (cat. no. 44-376G;
Invitrogen; Thermo Fisher Scientific, Inc.) and total STAT1 (cat.
no. PA5-95267; Invitrogen; Thermo Fisher Scientific, Inc.). The
membranes were incubated with horseradish peroxidase-conjugated
secondary antibodies at a dilution of 1:1,000 (cat. no. G-21234;
Invitrogen; Thermo Fisher scientific, Inc.) for 1 h at room
temperature. Protein bands were visualized using an ECL detection
system.
Statistical analysis
All experiments were performed three times
independently. The data were analyzed using GraphPad Prism 5.0
(GraphPad Software, Inc.) and are presented as the mean ± SD.
Student's t-test was used when two conditions were compared and
ANOVA with Bonferroni or Newman-Keuls correction was used for
multiple comparisons. P<0.05 was considered to indicate a
statistically significant difference.
Results
Expression of miR-30a in iTregs
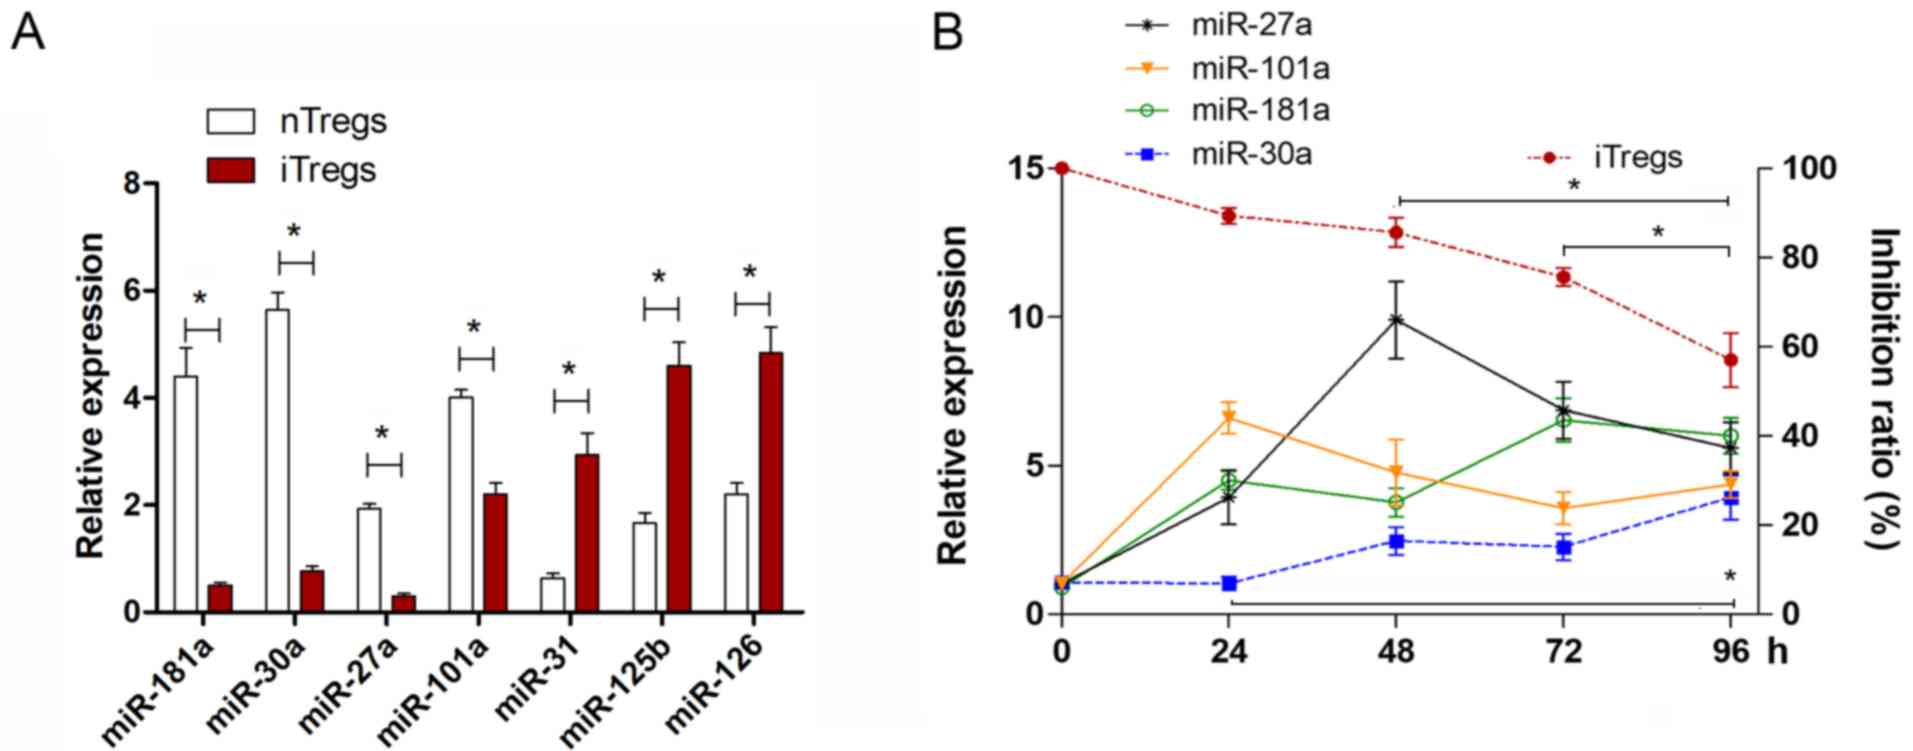
To investigate the possible role of miR-30a in the
instability of CD4+ iTregs, iTregs were generated in
vitro according to a previous report13). The relative
expression levels of several miRNAs, including miR-181, miR-126,
miR-31 and miR-30a were determined. These miRNAs were selected
according to previous studies (13,26,27).
The expression level of miR-126 in iTregs was higher than that in
natural (n)Tregs (Fig. 1A), which
was consistent with our previous study (13). The expression levels of miR-31 and
miR-125b were also higher in iTregs compared with nTregs. However,
the expression levels of miR181a, miR-30a, miR-27a and miR-101a
were significantly lower in iTregs (Fig. 1A; P<0.05).
To analyze the potential role of these four
downregulated miRNAs in the instability of iTregs, re-stimulated
iTregs were analyzed for change in the expression of these miRNAs.
The suppressive capacity of iTregs decreased during the
re-stimulation time course (Fig.
1B). It was found that only the expression of miR-30a increased
during the time course (Fig. 1B),
which was negatively associated with the suppressive capacity of
the iTregs. Therefore, the present data suggested that miR-30a may
be involved in the instability of the suppressive function of
iTregs.
miR-30a reduces the suppressive
function of iTregs in vitro
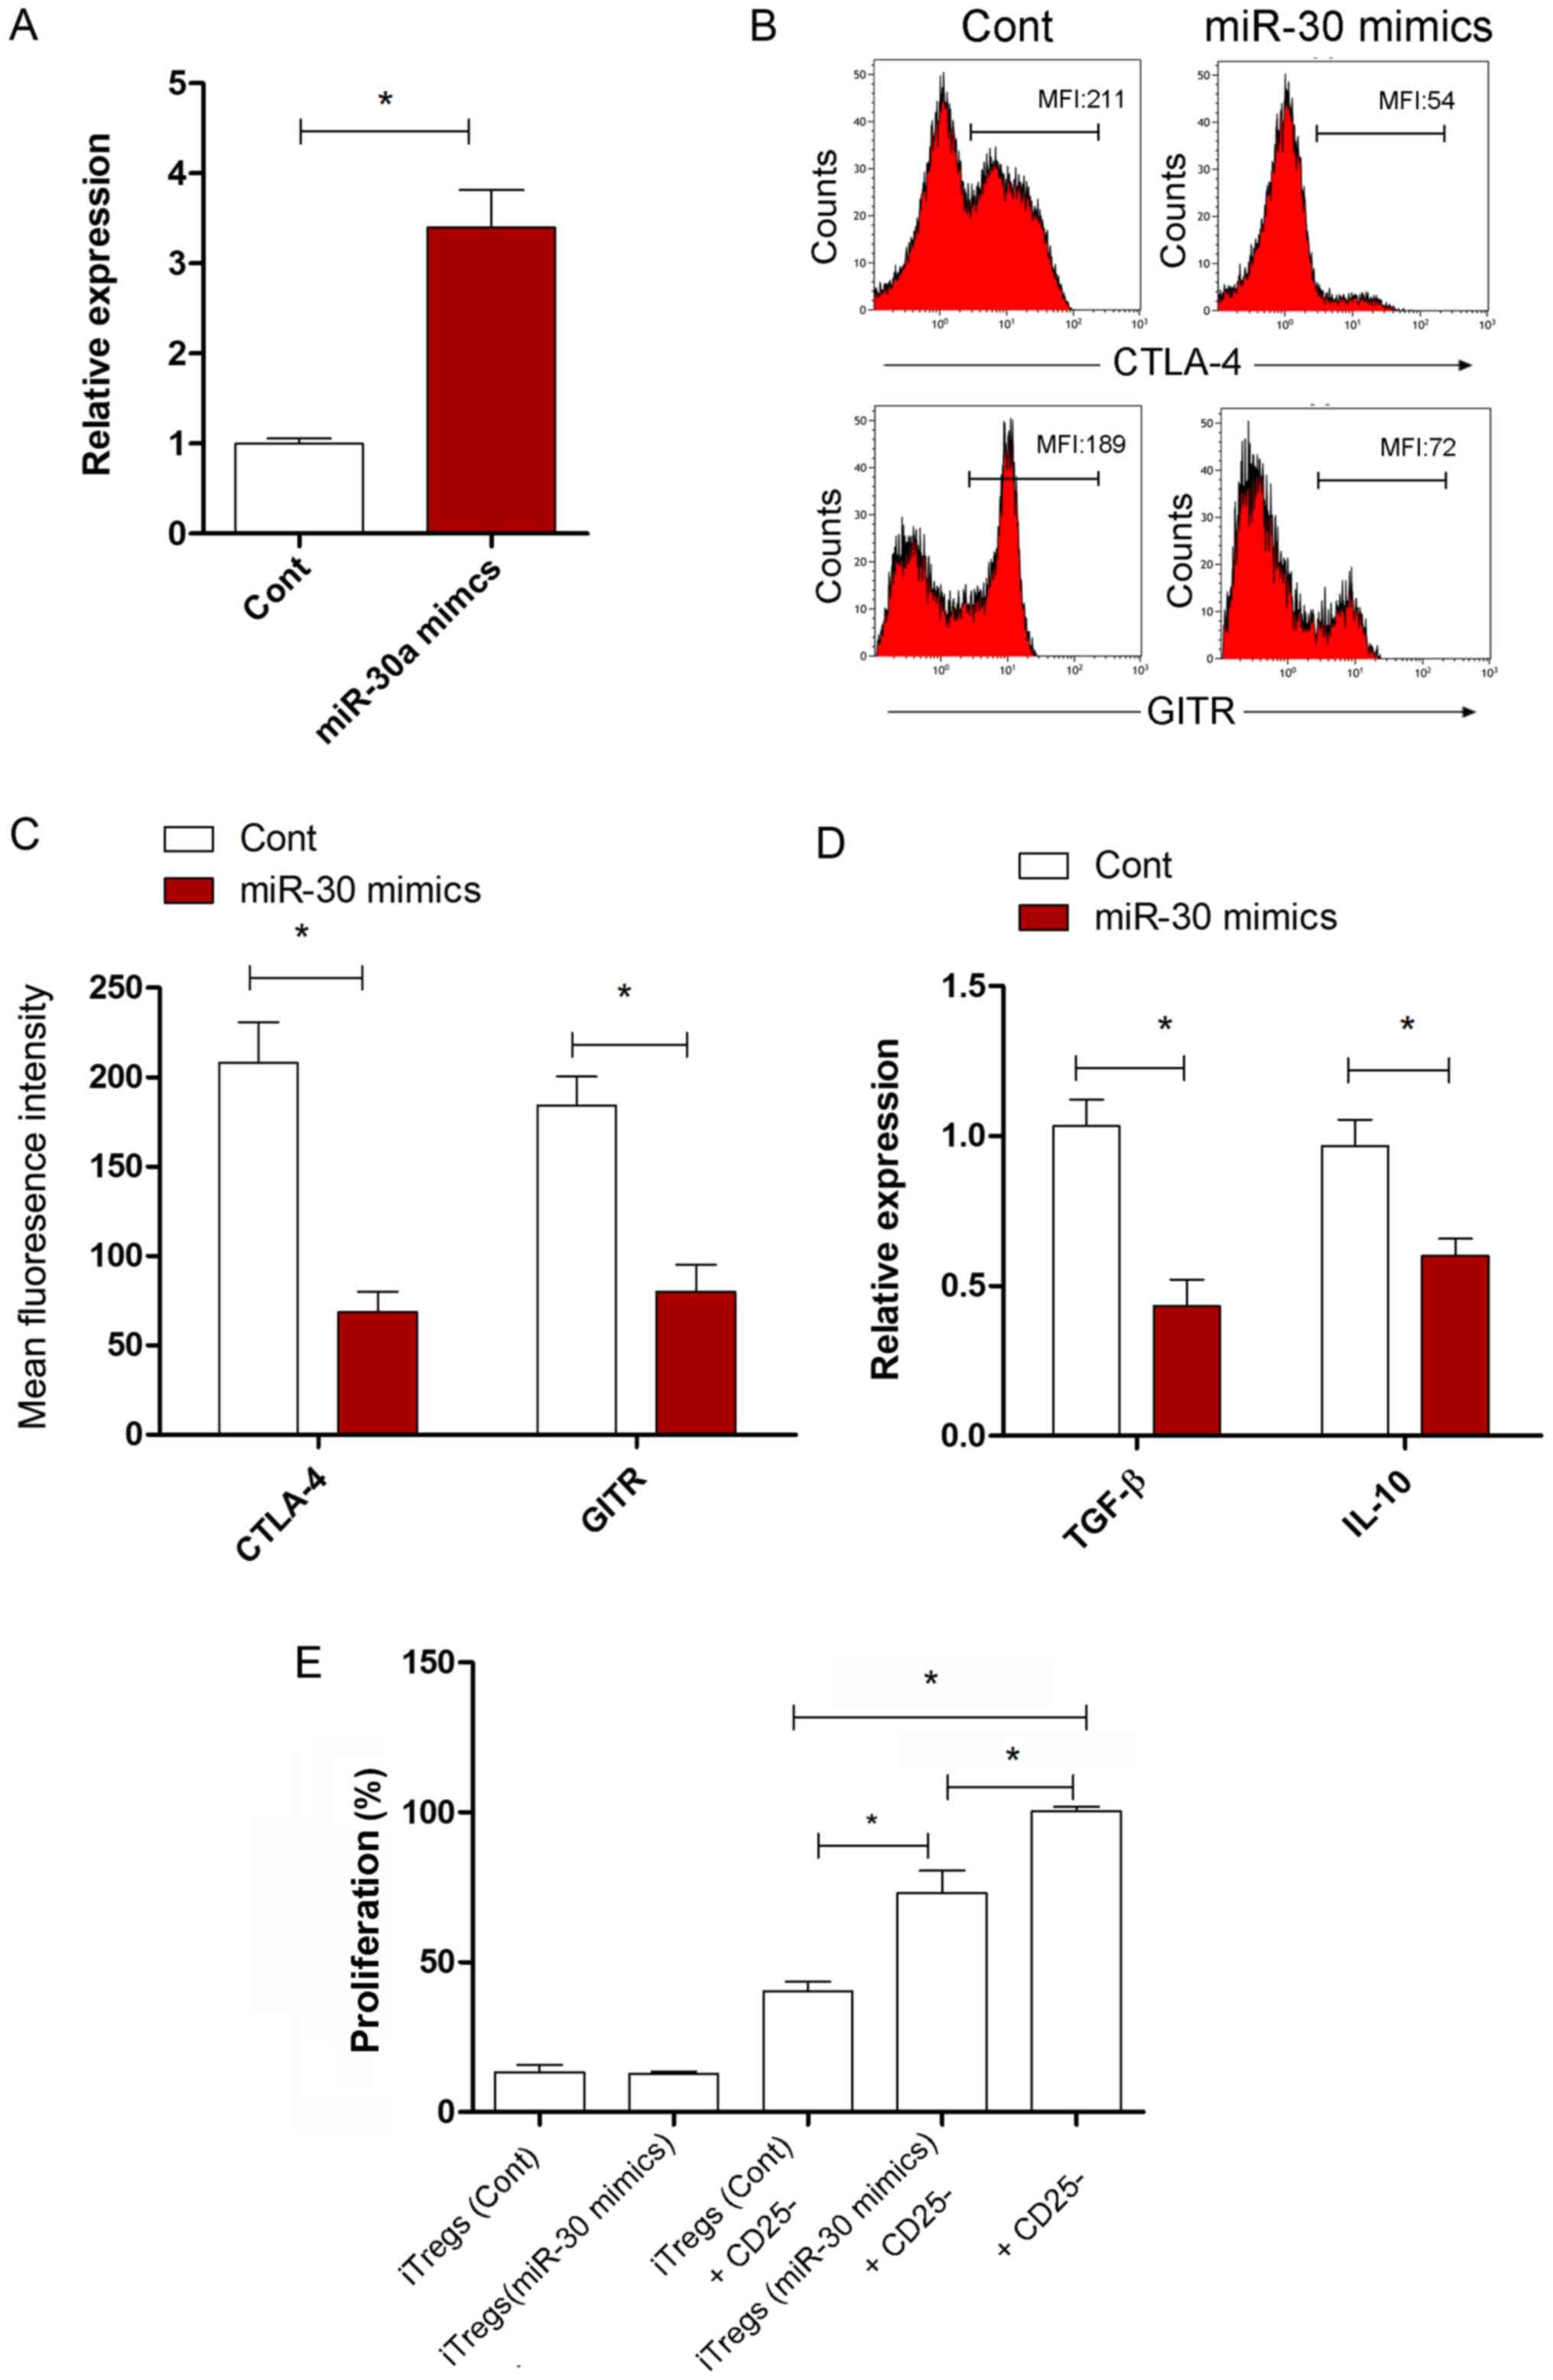
The possible effect of miR-30a on the suppressive
capacity of iTregs was investigated. The expression level of
miR-30a in iTregs in the miR-30a mimic transfected group increased
significantly compared with the miR-NC transfected group (Fig. 2A; P<0.05). Compared with the
miR-NC transfected group, the expression levels of cytotoxic T
lymphocyte-associated antigen 4 and glucocorticoid induced tumor
necrosis factor receptor, functional surface molecules, were
significantly reduced on the iTregs in the miR-30a mimic group
(Fig. 2B and C; P<0.05). The
expression of IL-10 and TGF-β in iTregs also decreased
significantly following miR-30a overexpression (Fig. 2D; P<0.05). To investigate this
finding, changes to the suppressive activity of iTregs in
vitro were also examined. The present data suggested that the
suppressive activity of iTregs on CD4 + CD25−
T cell proliferation in the miR-30a mimic group was lower than in
the miR-NC group (Fig. 2E;
P<0.05). These data suggested that miR-30a regulated the
suppressive capacity of iTregs in vitro.
miR-30a reduces the suppressive
function of iTregs in vivo
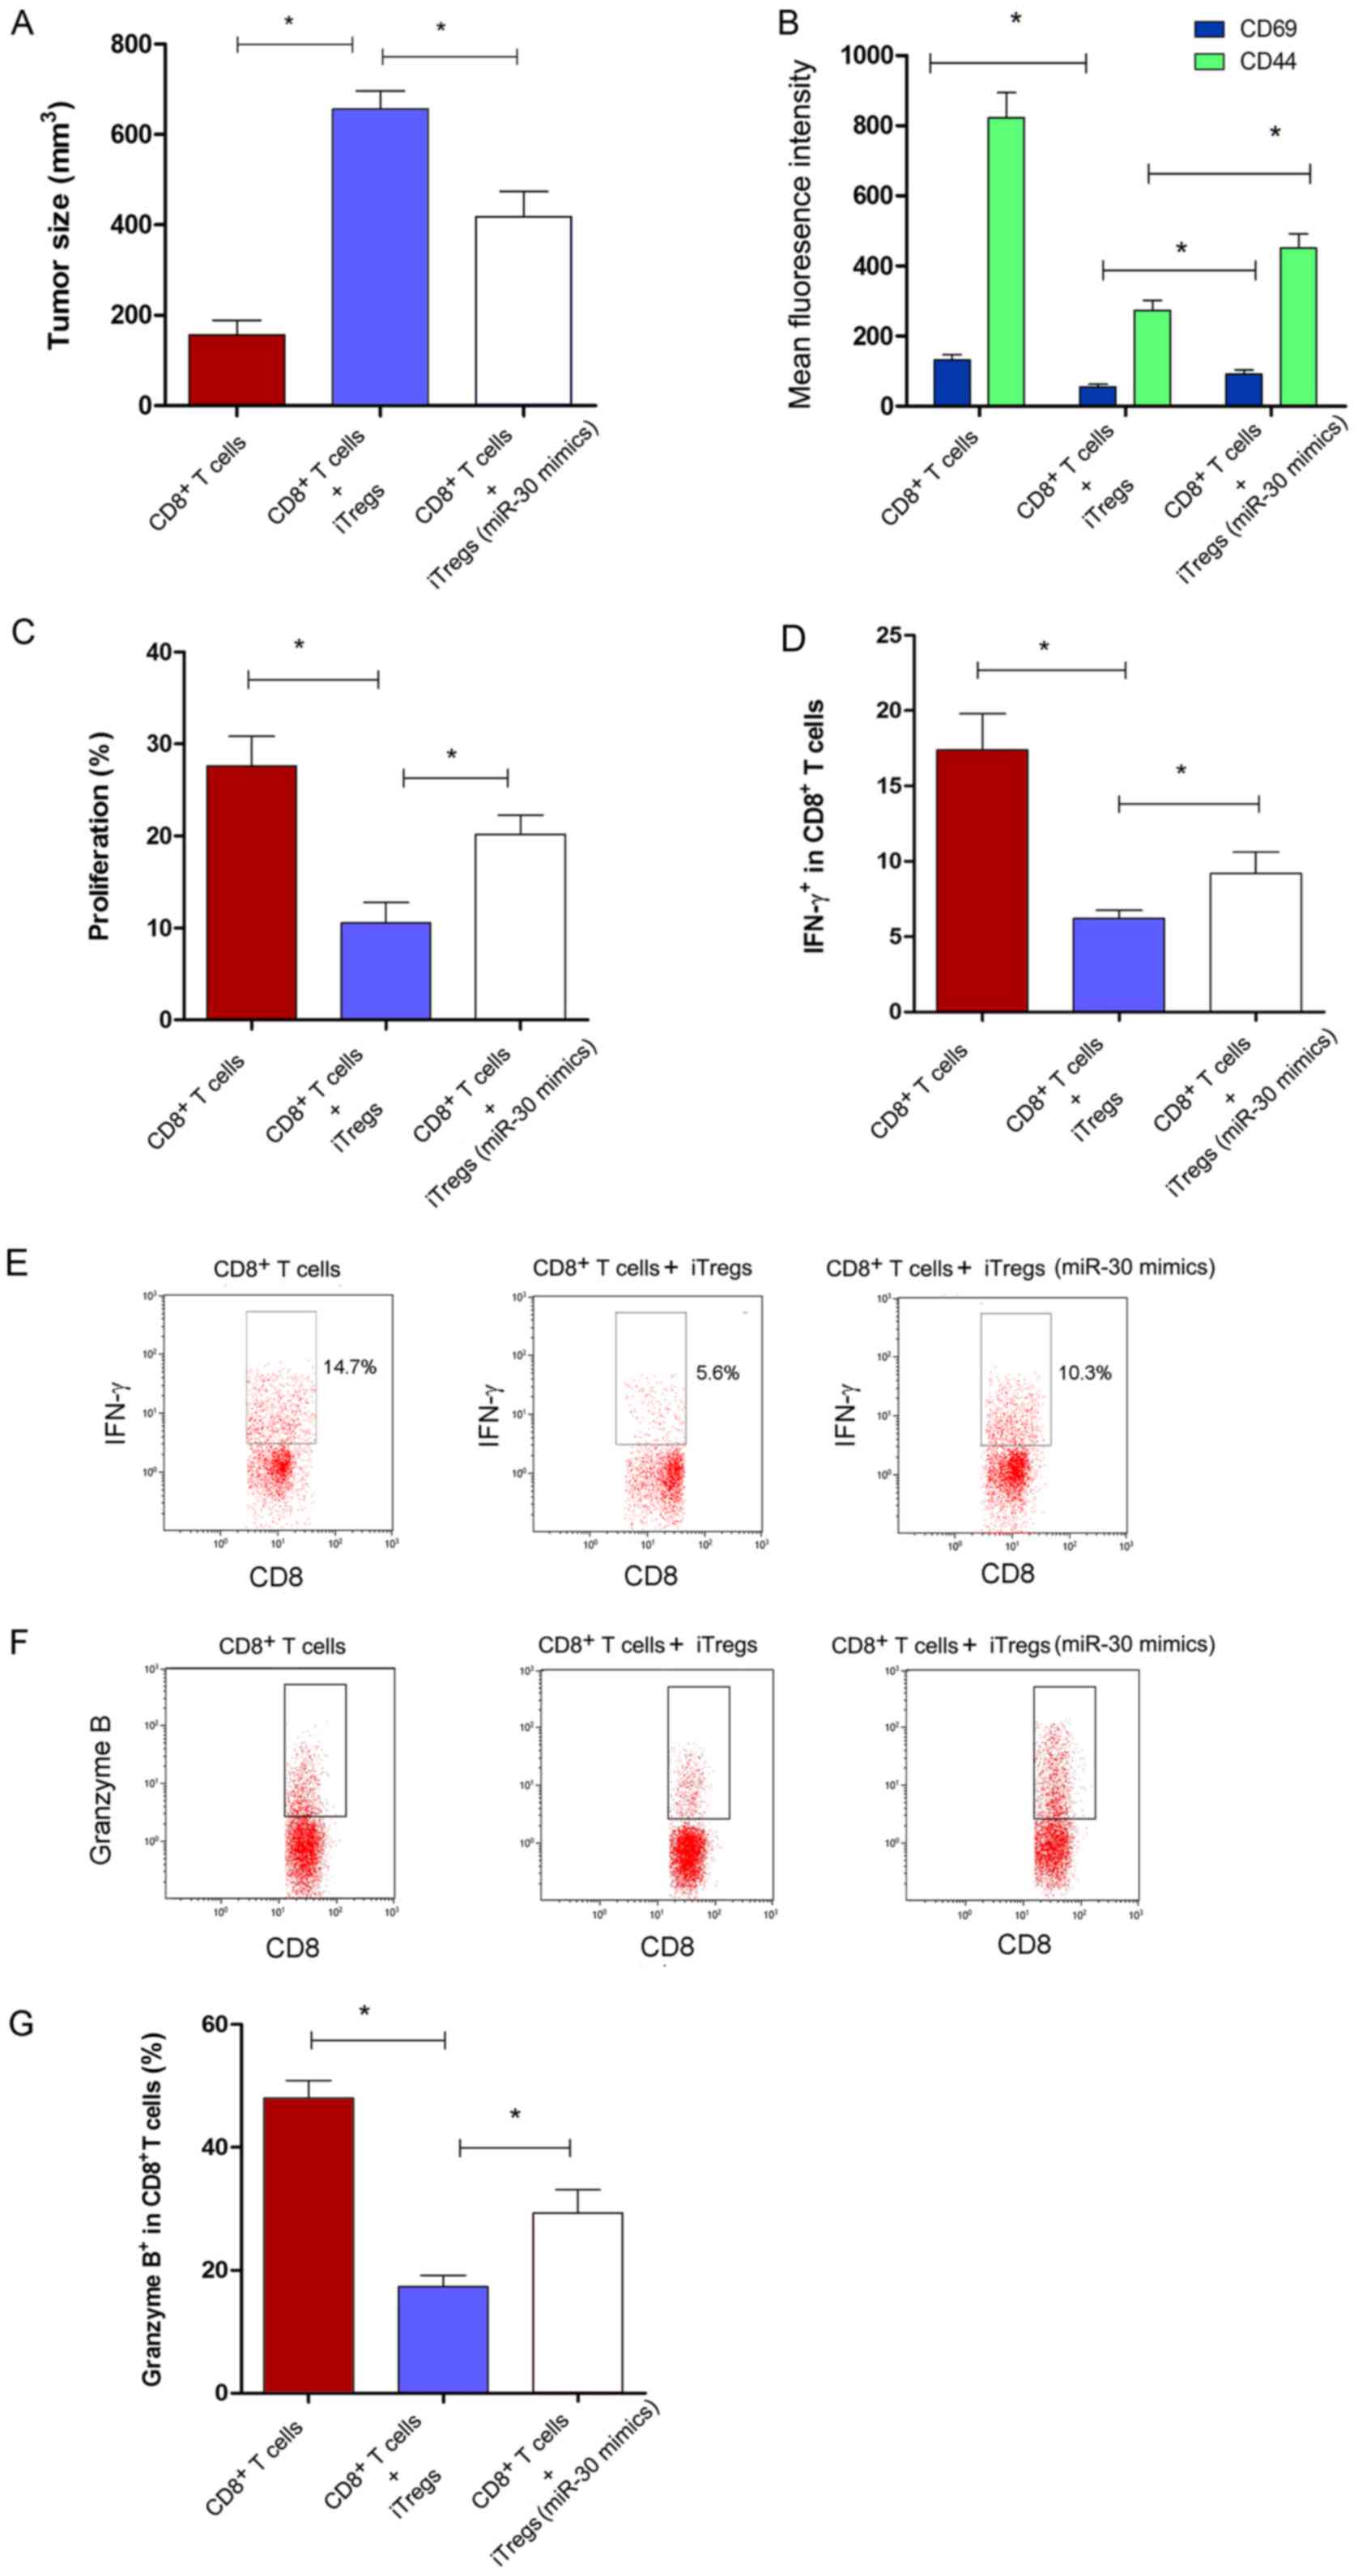
To investigate the effect of miR-30a on the
suppressive capacity of iTregs in vivo, an ACT assay was
performed. Tumor size increased significantly in the
CD8+ T cells + iTregs co-transferred group compared with
the group transferred with only CD8+ T (Fig. 3A; P<0.05). However, it was found
that the size of the tumor was significantly smaller in the miR-30a
mimic-transfected iTregs group compared with the miR-NC group
(Fig. 3A; P<0.05). The change
in the function of CD8+ T cells in vivo was
further analyzed. The expression levels of CD69 and CD44 on
CD8+ T cells increased significantly in the miR-30a
mimic-transfected iTregs + CD8+ T cells co-transferred
group compared with the miR-NC-transfected iTregs + CD8+
T cells co-transferred group (Fig.
3B; P<0.05). In addition, the proliferation and IFN-γ
secretion of CD8+ T cells increased significantly in the
miR-30a mimics-transfected iTregs + CD8+ T cells
co-transferred group (Fig. 3C-E;
P<0.05). In CD8+ T cells, the level of secreted
granzyme B, a type of molecule associated with cytotoxicity,
increased significantly in the miR-30a mimic-transfected iTregs
group compared with the miR-NC group (Fig. 3F and G; P<0.05). These findings
suggested that miR-30a regulated the suppressive activity of iTregs
in vivo.
Expression of SOCS1 in iTregs
Previous studies showed that SOCS1 is important for
the expression of Foxp3 in Tregs (28,29).
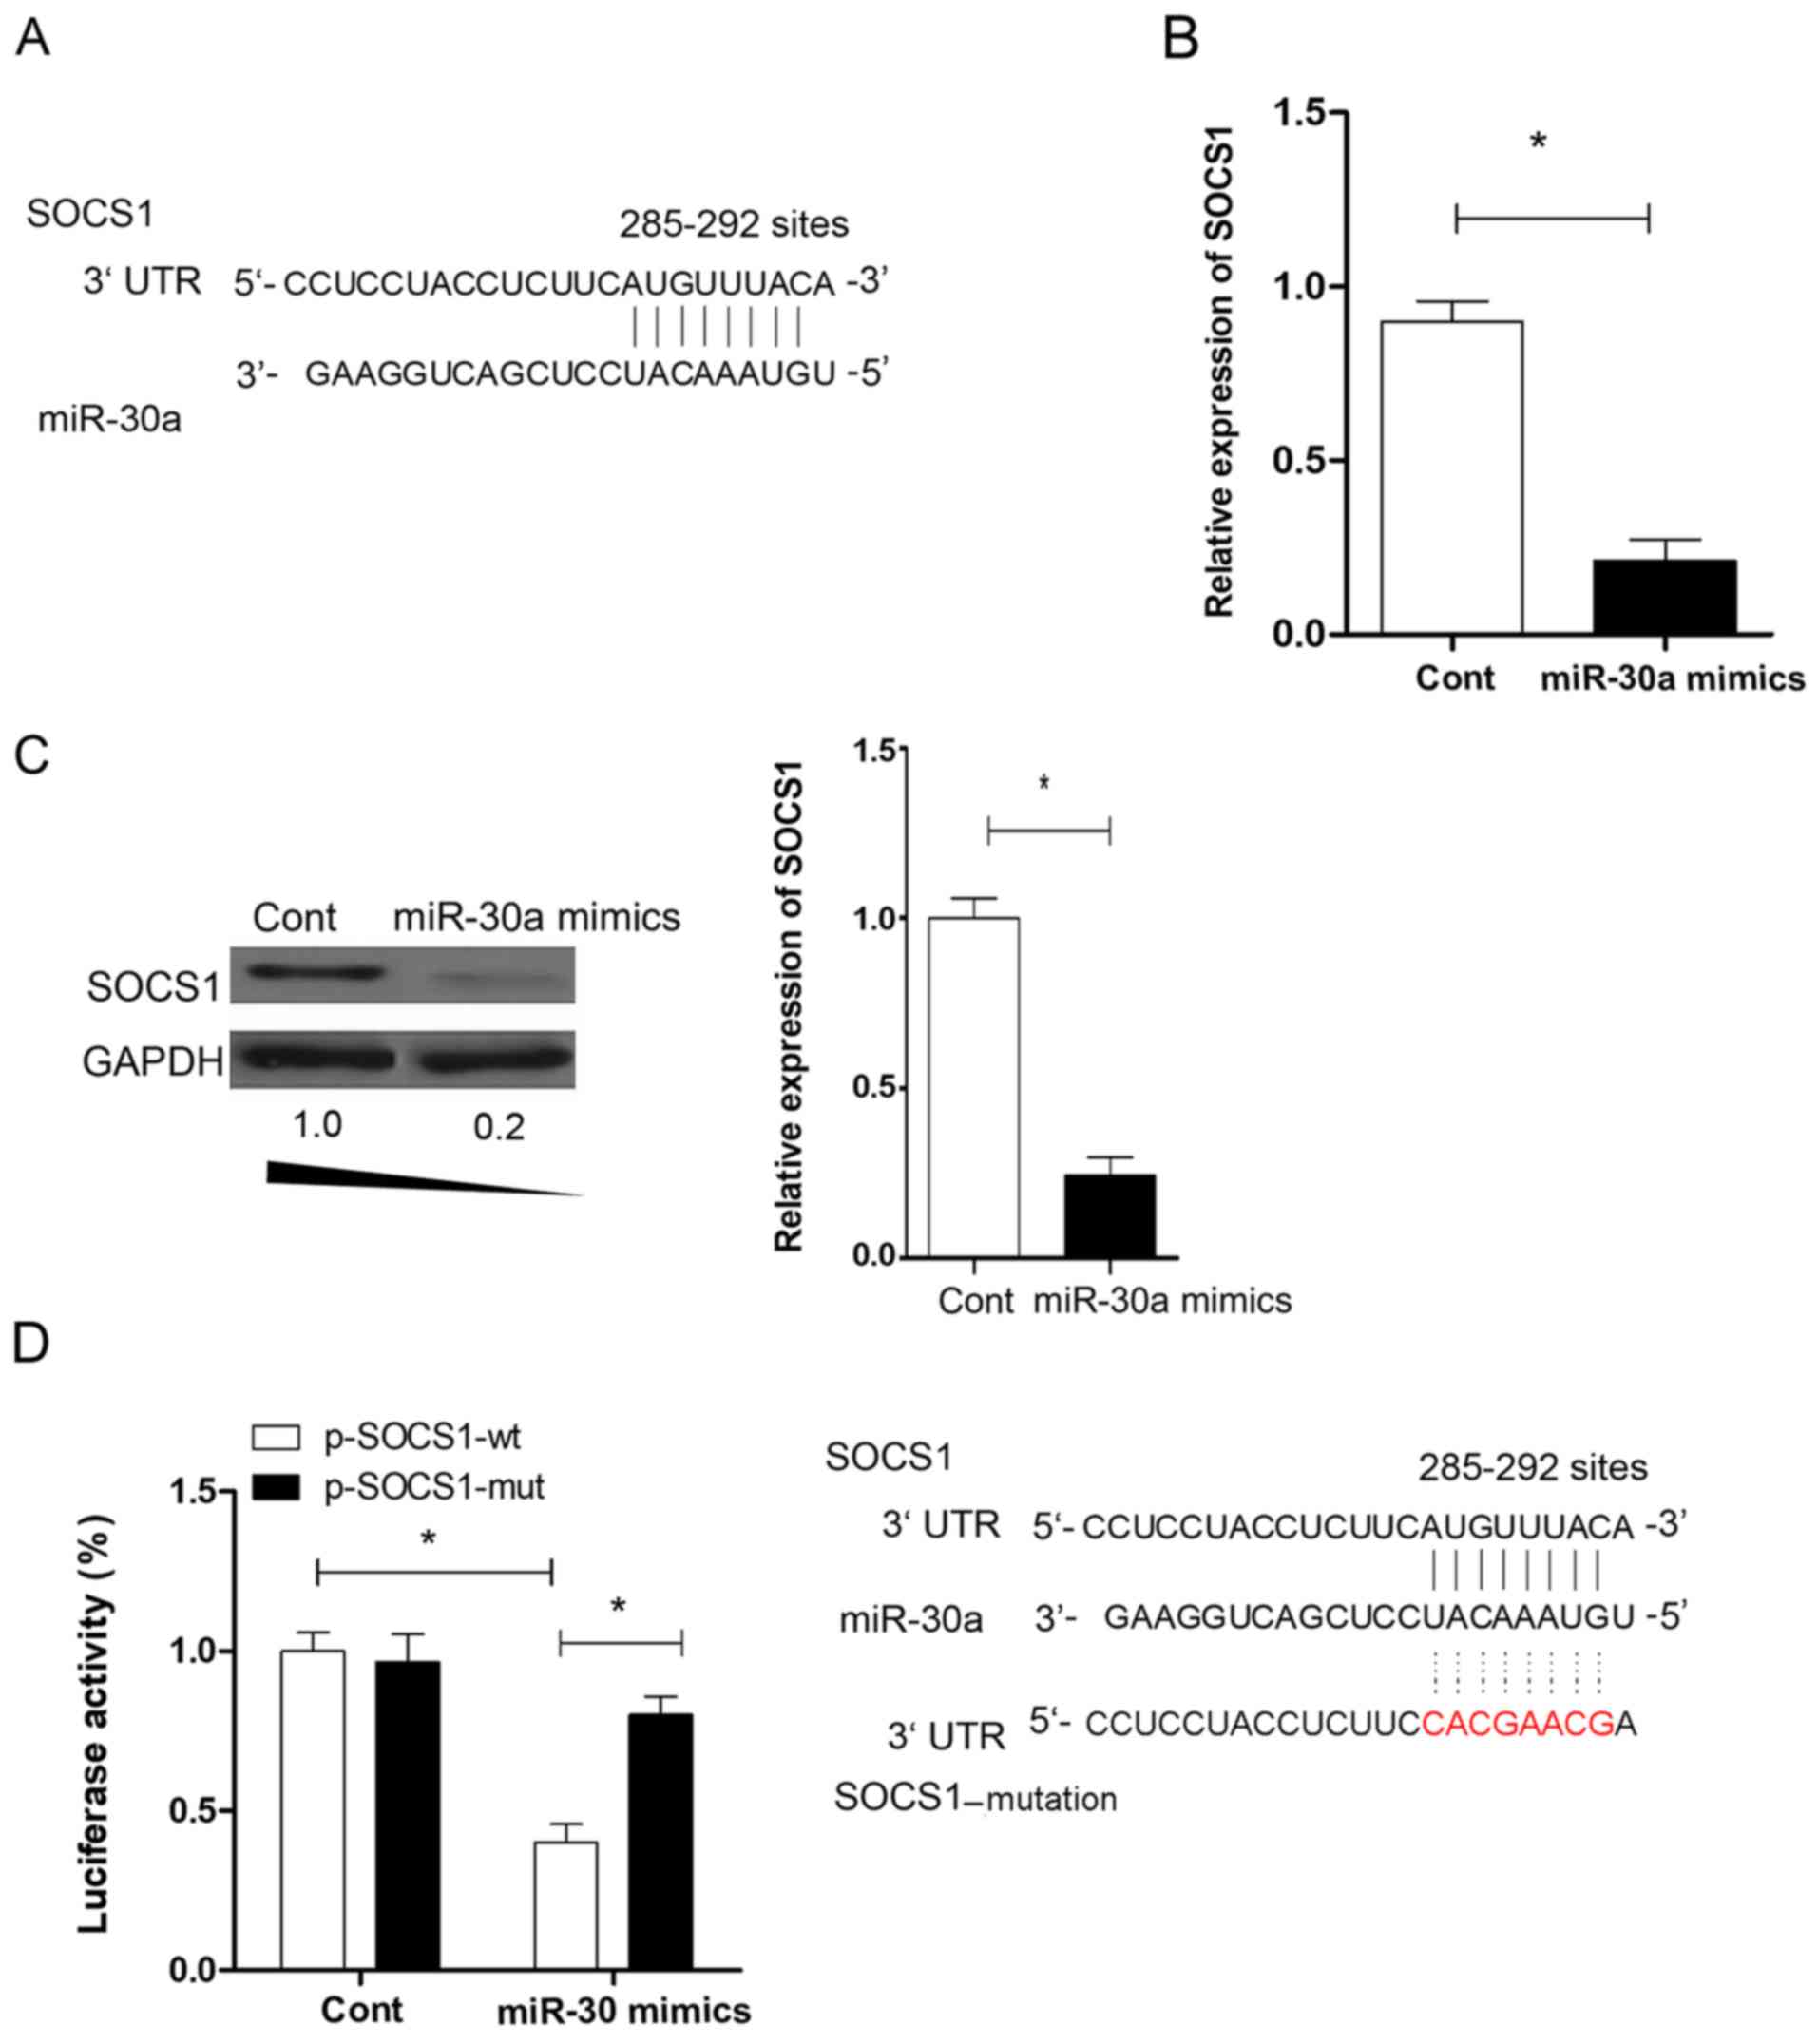
To investigate the potential molecular mechanism through which
miR-30a regulates the suppressive activity of iTregs, putative
targets of miR-30a were identified using computer-aided miRNA
target prediction programs, including TargetScan (http://www.targetscan.org/vert_42/, Version 4.2),
miRanda (http://www.microrna.org/microrna/getMirnaForm.do)
and PicTar (https://pictar.mdc-berlin.de/), and found a ‘matched
seed sequence’ of miR-30a in the 3′UTR of SOCS1 at position 285–292
(Fig. 4A). The expression level of
SOCS1 was determined in iTregs. The present data suggested that the
expression level of SOCS1 was significantly downregulated by
>5-fold in iTregs transfected with the miR-30a mimic compared
with the miR-NC group (Fig. 4B;
P<0.05). The regulation effect of miR-30a on SOCS1 expression
was further examined. The protein expression levels of SOCS1
decreased significantly in iTregs transfected with miR-30a mimic
compared with miR-NC (P<0.05; Fig.
4C). The luciferase assay showed that miR-30a could bind to the
putative sites of wild-type SOCS1 (Fig
4D; P<0.05). The present data suggested that SOCS1 may be a
novel target of miR-30a in iTregs.
miR-30a regulates the suppressive
function of iTregs by regulating SOCS1
To further elucidate the role of SOCS1 in the
miR-30a-mediated regulation of iTregs suppressive capacity, a
eukaryotic expression vector encoding SOCS1 was constructed. It was
found that the expression level of SOCS1 increased significantly in
the p-SOCS1 transfected group compared with the control (Fig. S1; P<0.05), indicating the
effective transfection of p-SOCS1. Compared with the miR-30a mimic
transfected group, the expression level of Foxp3 in iTregs in the
miR-30a mimic and p-SOCS1 co-transfected group did not change
significantly (data not shown). It was found that the expression
levels of IL-10 and TGF-β in iTregs in the miR-30a mimic and
p-SOCS1 co-transfected group increased significantly compared with
the miR-30a mimic and p-Cont co-transfected group (Fig. 5A; P<0.05). The suppressive
activity of iTregs in the miR-30a mimic and p-SOCS1 co-transfected
group was higher than the miR-30a mimic and p-Cont co-transfected
group in vitro (Fig. 5B;
P<0.05), indicating that the altered expression of SOCS1 could
reverse the effect of miR-30a on the suppressive capacity of iTregs
in vitro.
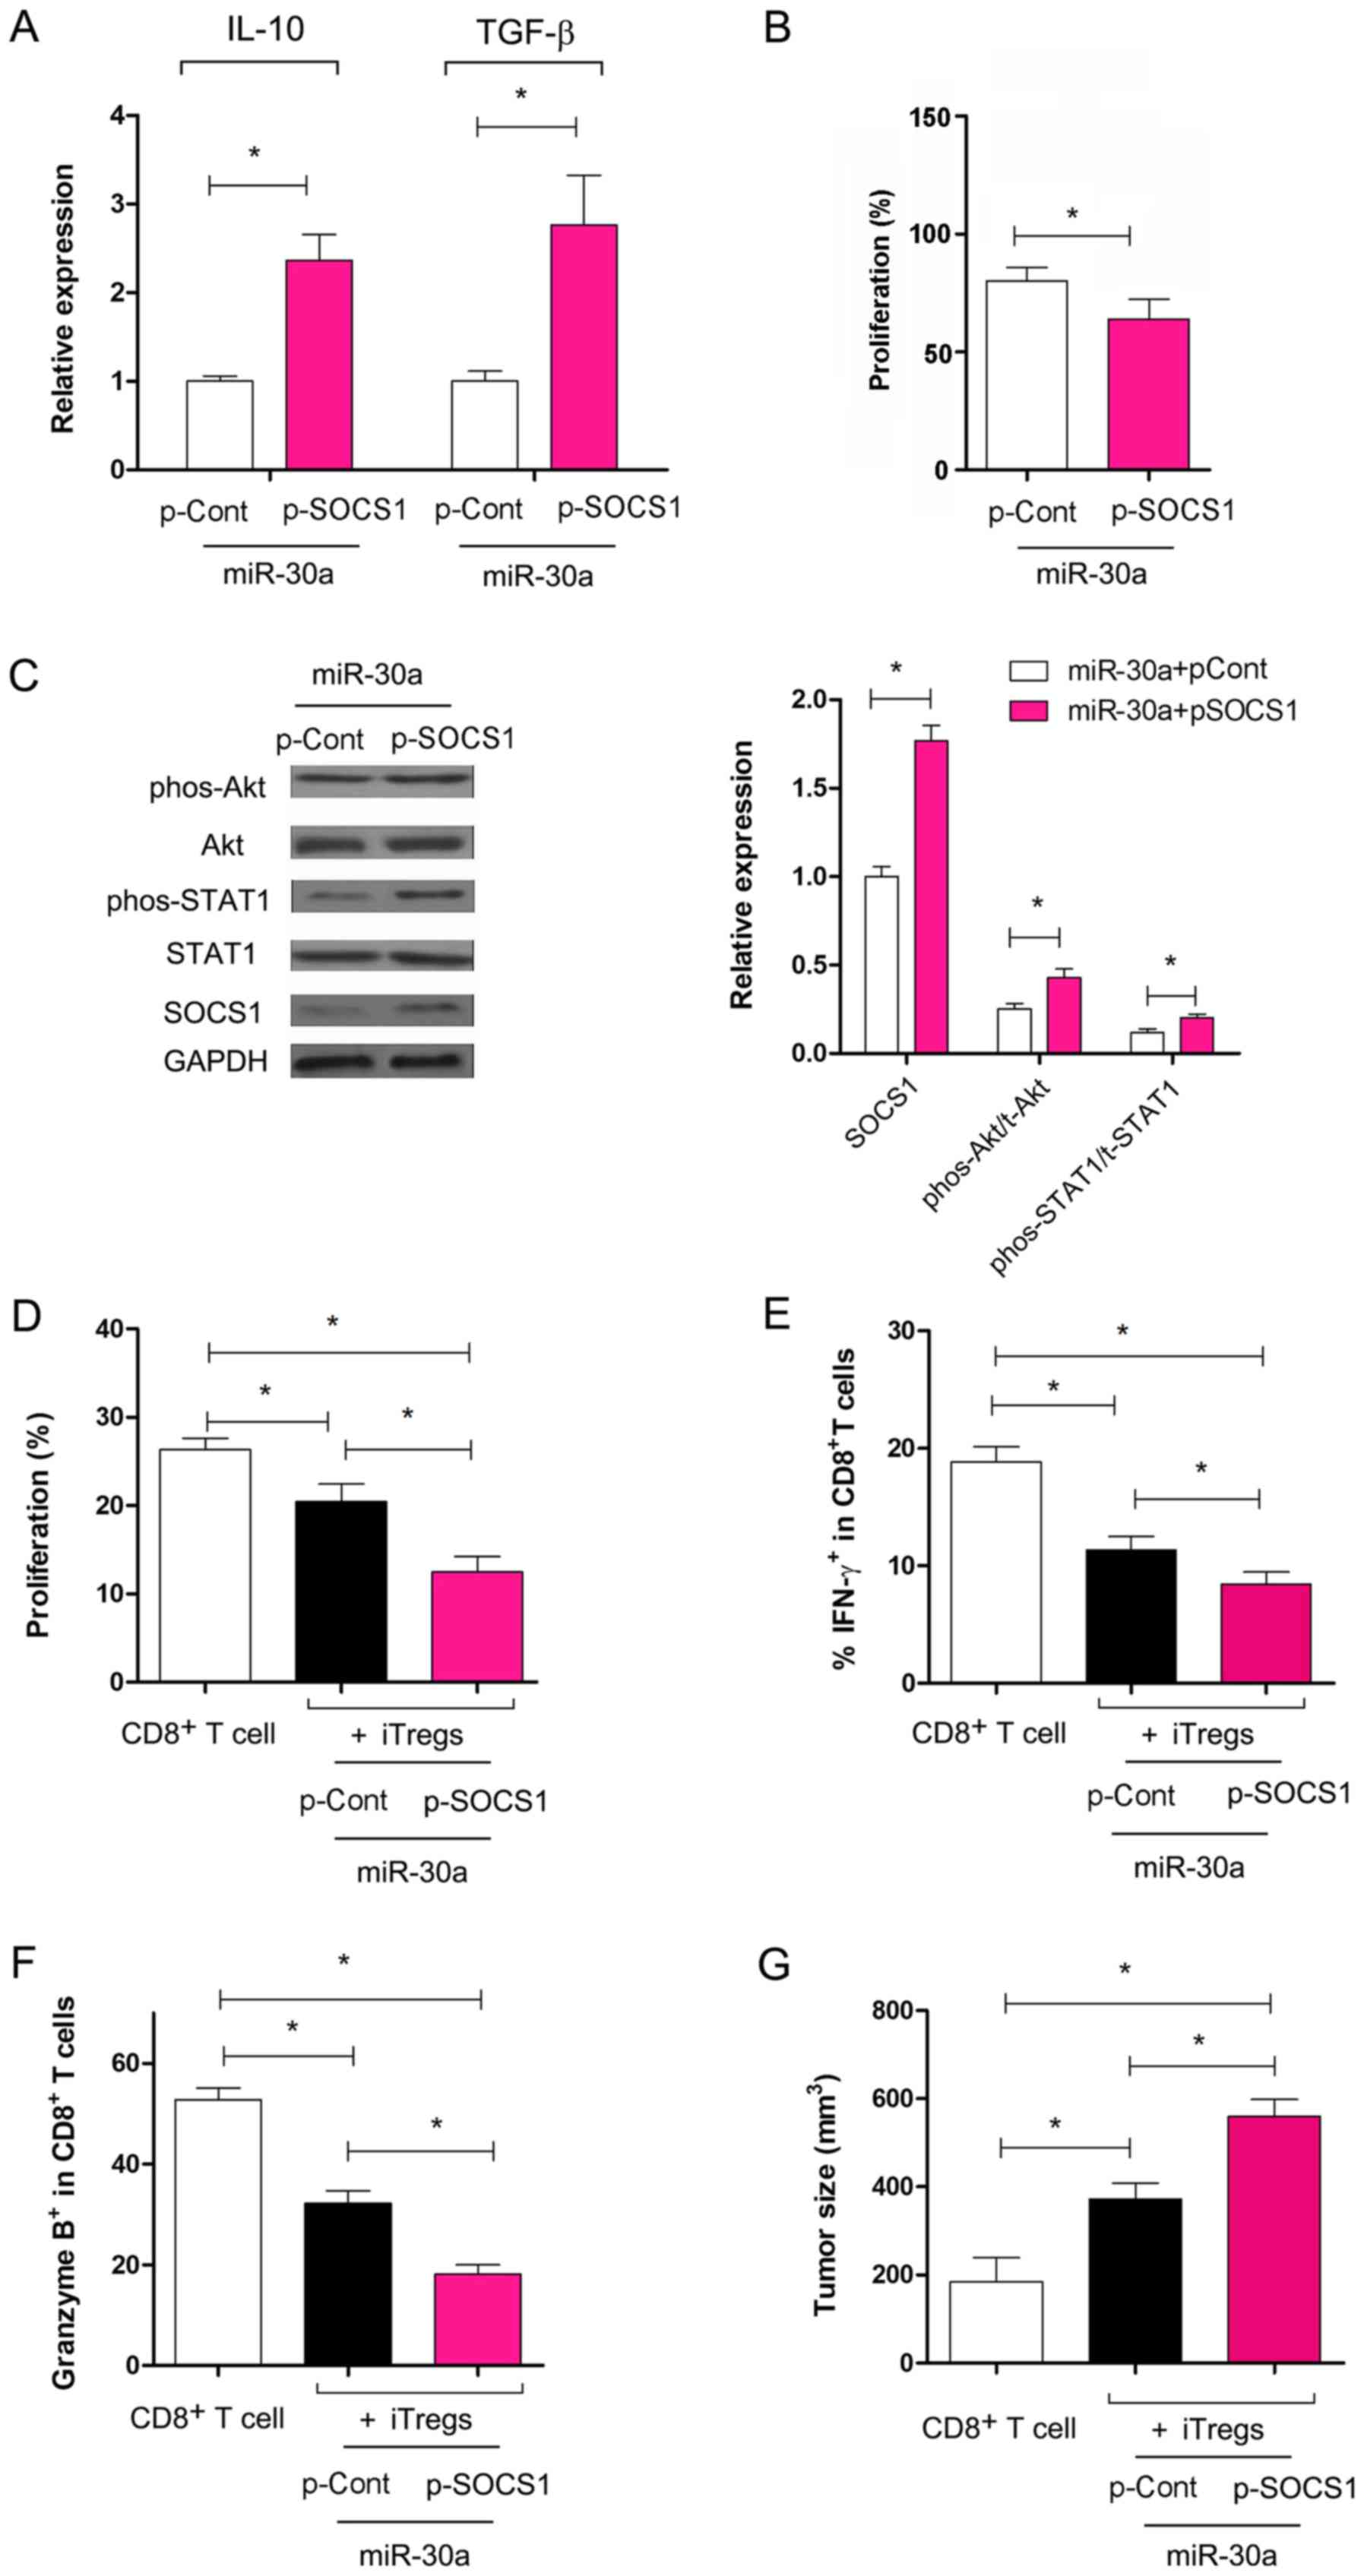 | Figure 5.Overexpression of SOCS1 reverses the
effect of miR-30a on the suppressive function of iTregs. (A)
Relative expression levels of TGF-β and IL-10 were analyzed using
reverse transcription-quantitative PCR. (B) The suppressive
capacity of iTregs was determined. (C) Expression levels of SOCS1,
Akt, phos-Akt, STAT1 and phos-STAT1 were analyzed using western
blot analysis and quantified. (D) C57BL/6J mice were immunized with
inactivated 3LL lung cancer cells three times every 7 days. After
10 days, splenocytes were harvested and re-stimulated using
mitomycin C-treated 3LL cells for 24 h in the presence of IL-2 (50
U/ml) in vitro. Following this, 2×10⁶ 3LL specific CD8+ T
cells were purified by fluorescence assisted cell sorting and
transferred with or without iTregs at a ratio of 2:1 into syngeneic
recombination activating gene 1-/- mice (n=6). After 10 days, tumor
infiltrating lymphocytes were obtained. The expression level of
Ki-67 in CD8+ T cells was determined using flow cytometry. (E) The
percentage of IFN-γ secreting cells and (F) the expression of
granzyme B in CD8+ T cells was analyzed using flow cytometry. (G)
The tumor size was determined for each group. *P<0.05. TGF-β,
transforming growth-β; SOCS1, suppressor of cytokine signaling 1;
miR, micro RNA; IL, interleukin; iTregs, inducible regulatory T
cells; p-, plasmid; phos-, phosphorylated; Cont, control; IFN,
interferon. |
Previous studies have reported that the STAT1 and
the Akt pathways are involved in the induction and function of
iTregs (28,30). Therefore, the present study
analyzed the changes in these pathways. The present data showed
that, compared with the miR-30a mimic and p-Cont co-transfection
group, the expression levels of total Akt and STAT1 did not change
significantly in the iTregs in the miR-30a mimic and p-SOCS1
co-transfection group (Fig. 5C;
P>0.05). However, the expression levels of phospho-STAT1 and
phospho-Akt increased significantly in iTregs co-transfected with
miR-30a mimic and p-SOCS1 compared with iTregs co-transfected with
the miR-30a mimic and p-Cont (Fig.
5C; P<0.05).
To further examine the role of SOCS1 overexpression
and the effect of miR-30a on the suppressive capacity of iTregs,
ACT was performed. The present data suggested that the
proliferation of CD8+ T cells decreased significantly
following co-transfer of iTregs transfected with p-SOCS1 and
miR-30a mimic compared with CD8+ T cells transferred
alone (Fig. 5D; P<0.05), which
was consistent with the aforementioned data (Fig. 5B). The proliferation of
CD8+ T cells decreased significantly in the miR-30a
mimic + p-SOCS1 iTregs co-transferred group compared with the
miR-30a mimic + p-Cont iTregs co-transferred group (Fig. 5D; P<0.05). The expression of
IFN-γ and granzyme B in CD8+ T cells decreased
significantly in the miR-30a mimic and p-SOCS1 iTregs
co-transferred group (Fig. 5E and
F; P<0.05). Consistent with this, the tumor size increased
significantly following co-transfer of CD8+ T and iTregs
co-transfected with miR-30a and p-SOCS1 compared with cells
transfected with miR-30a and p-Cont (Fig. 5G; P<0.05). The present data
suggested that miR-30a regulated the suppressive capacity of iTregs
through the expression of SOCS1, which was accompanied by an
altered activity of the Akt and STAT1 pathways.
Discussion
In the present study, it was found that miR-30a
regulated the suppressive function of iTregs in vitro. ACT
assays showed that miR-30a abrogated the suppressive function of
iTregs on CD8+ T cells activity in a murine lung cancer
model. This effect was accompanied by the altered expression of
CD69, CD44 and IFN-γ in CD8+ T cells. The overexpression
of SOCS1, a target of miR-30a, reversed the effect of miR-30a on
the suppressive function of iTregs.
In total, >700 miRNAs have been identified in
mammals and have been implicated in a wide range of biological
functions (31). Previous studies
have shown that different subsets of Tregs express unique miRNA
signatures (32,33). These miRNAs have been reported to
play important roles in the development and function of Tregs
(34–36). iTregs, a distinct subset of Tregs,
were reported to play an important role in peripheral immune
tolerance and may be a promising target in immune therapy against
related clinical diseases; therefore, investigating the molecular
mechanism of the regulation of induction and the functional
maintenance of iTregs is required. For example, miR-155 was
reported to modify the induction and suppressive function of Tregs
(37,38) and miR-21 was found to regulate the
induction of iTregs in vitro (9). A recent study showed that miR-27
contributed to the induction and function of iTregs (26). Similarly, in our previous study, it
was found that miR-126 may be a novel regulator involved in the
induction and function of iTregs (13). Collectively, these previous studies
suggested that distinct miRNAs play different roles in the
induction and maintenance of the suppressive function of iTregs.
However, knowledge about the distinct miRNAs involved in the
regulation of iTreg induction and their suppressive functions is
limited. Therefore, it is important to explore the underlying
molecular mechanism of iTreg development and function, and also to
develop strategies for iTreg-based immune therapy.
Recently, miR-30a, a member of the miRNA-30 family,
was reported to play an important role in the biological function
of a number of immune cells (9,16–18).
Wu et al (22) found that
miR-30a regulated the function of macrophages in response to MTB
stimulation. The overexpression of miR-30a in transplanted
microglia exacerbated the progression of EAE (23). In the present study, miR-30a was
identified to regulate the suppressive capacity of iTregs.
Consistent with this, Qu et al (24) reported that miR-30 regulated the
differentiation of Th17 cells by targeting the IL-21 receptor,
contributing to the development of EAE. The present study found
that miR-30a regulated the suppressive functions of iTregs on
CD8+ T cells, which provided a robust antitumor effect
of CD8+ T cells in vivo, indicating that miR-30a
may be a potential novel target in iTreg-based immunotherapy
against tumors. Consistent with our previous study, it has been
reported that the depletion of Tregs enhances the antitumor
function of TILs in vivo (39). Collectively, the present and
previous results suggested that immunotherapy targeting Tregs may
represent an alternative to ACT immunotherapy to enhance antitumor
efficacy.
Previous studies suggested that the SOCS1 protein is
an important factor in the development of various diseases
(40,41). SOCS1 overexpression was reported to
decrease the proliferation and induce the apoptosis of cancer
cells, which involved the Akt and STAT1 pathways (42). The dysregulation of SOCS1 signaling
participates in various pathological processes in systemic lupus
erythematosus, such as hematological abnormalities and autoantibody
generation, which is associated with the JNK-STAT pathway (43). SOCS1 was also reported to be a key
regulator of Treg development (44,45).
A deficiency in SOCS1 impairs the suppressive functions of iTregs
in vivo (29). In the
present study, it was found that miR-30a regulated the expression
of SOCS1 in iTregs. It was further shown that the overexpression of
SOCS1 reversed the effects of miR-30a on the maintenance of the
suppressive capacity of iTregs. These data may provide new evidence
for the important role of the miR-30a/SOCS1 axis in the suppressive
function of iTregs. Takahashi et al (28) reported that, in the absence of
SOCS1, the suppressive function of iTregs did not change
significantly in vitro, which may be related to the
hypermethylation of the Foxp3 promoter. However, in the present
study, it was found that miR-30 regulated the suppressive capacity
of iTregs in vitro and in vivo. Moreover, the
overexpression of SOCS1 reversed the effects of miR-30a on the
suppressive capacity of iTregs. In total, two main factors may
explain the different findings between the present study and the
study by Takahashi et al (28). The experimental settings in the
study by Takahashi et al (28) were different from those in the
present study. Moreover, in the present study, the overexpression
of SOCS1 not only altered the activity of the STAT1 pathway, but
also affected the activity of the Akt pathway. Consistent with
this, previous studies have reported that the Akt pathway is
important for the induction and suppressive functions of Tregs
(46,47). The different experimental settings
may have contributed to the different findings in the present study
compared with the study by Takahashi et al (28). Additionally, other potent targets
of miR-30a, not investigated in the present study, may also
contribute to the effect of miR-30a on the function of iTregs,
which remain to be explored in future studies.
In conclusion, the present study revealed that
miR-30a served an important role in the suppressive capacity of
iTregs through the regulation of the SOCS1 pathway. To the best of
our knowledge, these results have identified a previously unknown
role of miR-30a in the instability of iTregs that may facilitate
the development of therapeutic strategies for promoting T-cell
immunity by regulating iTregs by targeting specific miRNAs.
Supplementary Material
Supporting Data
Acknowledgements
The authors would like to thank Professor Wei Xu
(Soochow University, Suzhou, Jiangsu, China) for providing valuable
suggestions on the writing of the original manuscript.
Funding
The present study was supported by the National
Natural Science foundation of China (grant nos. 31760258 and
81871249), the Program for High level innovative talents in Guizhou
Province (grant no. QKH-RC-2016-4031), the Program for New Century
Excellent Talents in University, Ministry of Education of China
(grant no. NCET-12-0661), the Program for Excellent Young Talents
of Zunyi Medical University (grant no. 15ZY-001) and the Project of
Guizhou Provincial Department of Science and Technology (grant no.
2009C491).
Availability of data and materials
The datasets used and/or analyzed during the
current study are available from the corresponding author on
reasonable request.
Authors' contributions
YZ and YL performed the experiments, analyzed the
data and wrote the paper. JL performed the experiments. XH designed
and wrote the paper. LX conceived and designed the experiments,
analyzed the data and wrote the paper. All authors reviewed the
paper.
Ethics approval and consent to
participate
All the experimental procedures were approved by
the Ethical Committee of Zunyi Medical Laboratory Animal Care and
Use Committee.
Patient consent for publication
Not applicable.
Competing interests
The authors declare that they have no competing
interests.
Glossary
Abbreviations
Abbreviations:
|
iTregs
|
inducible regulatory T cells
|
|
Foxp3
|
forkhead box protein 3
|
|
TGF-β
|
transforming growth factor-β
|
|
SOCS1
|
suppressor of cytokine signaling
1
|
|
ACT
|
adoptive cell transfer
|
References
|
1
|
Sakaguchi S, Sakaguchi N, Asano M, Itoh M
and Toda M: Immunologic self-tolerance maintained by activated T
cells expressing IL-2 receptor alpha-chains (CD25). Breakdown of a
single mechanism of self-tolerance causes various autoimmune
diseases. J Immuno. 155:1151–1164. 1995.
|
|
2
|
Liu JY, Zhang XS, Ding Y, Peng RQ, Cheng
X, Zhang NH, Xia JC and Zeng YX: The changes of CD4+CD25+/CD4+
proportion in spleen of tumor-bearing BALB/c mice. J Transl Med.
3:52005. View Article : Google Scholar : PubMed/NCBI
|
|
3
|
Kanamori M, Nakatsukasa H, Okada M, Lu Q
and Yoshimura A: Induced regulatory T cells: Their development,
stability, and applications. Trends Immunol. 37:803–811. 2016.
View Article : Google Scholar : PubMed/NCBI
|
|
4
|
Shevach EM and Thornton AM: tTregs,
pTregs, and iTregs: Similarities and differences. Immunol Rev.
259:88–102. 2014. View Article : Google Scholar : PubMed/NCBI
|
|
5
|
Wainwright DA, Dey M, Chang A and Lesniak
MS: Targeting tregs in malignant brain cancer: Overcoming IDO.
Front Immunol. 4:1162013. View Article : Google Scholar : PubMed/NCBI
|
|
6
|
Danikowski KM, Jayaraman S and Prabhakar
BS: Regulatory T cells in multiple sclerosis and myasthenia gravis.
J Neuroinflammation. 14:1172017. View Article : Google Scholar : PubMed/NCBI
|
|
7
|
Someya K, Nakatsukasa H, Ito M, Kondo T,
Tateda KI, Akanuma T, Koya I, Sanosaka T, Kohyama J, Tsukada YI, et
al: Improvement of Foxp3 stability through CNS2 demethylation by
TET enzyme induction and activation. Int Immunol. 29:365–375. 2017.
View Article : Google Scholar : PubMed/NCBI
|
|
8
|
Gu J, Lu L, Chen M, Xu L, Lan Q, Li Q, Liu
Z, Chen G, Wang P, Wang X, et al: TGF-β-induced CD4+Foxp3+ T cells
attenuate acute graft-versus-host disease by suppressing expansion
and killing of effector CD8+ cells. J Immunol. 193:3388–3397. 2014.
View Article : Google Scholar : PubMed/NCBI
|
|
9
|
Namdari H, Ghayedi M, Hadjati J, Rezaei F,
Kalantar K, Rahimzadeh P and Salehi E: Effect of MicroRNA-21
transfection on in-vitro differentiation of human naive CD4+ T
cells to regulatory t cells. Iran J Allergy Asthma Immunol.
16:235–244. 2017.PubMed/NCBI
|
|
10
|
Jeker LT, Zhou X, Gershberg K, de
Kouchkovsky D, Morar MM, Stadthagen G, Lund AH and Bluestone JA:
MicroRNA 10a marks regulatory T cells. PLoS One. 7:e366842012.
View Article : Google Scholar : PubMed/NCBI
|
|
11
|
Spoerl D, Duroux-Richard I, Louis-Plence P
and Jorgensen C: The role of miR-155 in regulatory T cells and
rheumatoid arthritis. Clin Immunol. 148:56–65. 2013. View Article : Google Scholar : PubMed/NCBI
|
|
12
|
Yang HY, Barbi J, Wu CY, Zheng Y, Vignali
PD, Wu X, Tao JH, Park BV, Bandara S, Novack L, et al: MicroRNA-17
modulates regulatory T cell function by Targeting Co-regulators of
the Foxp3 transcription factor. Immunity. 45:83–93. 2016.
View Article : Google Scholar : PubMed/NCBI
|
|
13
|
Qin A, Wen Z, Zhou Y, Li Y, Li Y, Luo J,
Ren T and Xu L: MicroRNA-126 regulates the induction and function
of CD4(+) Foxp3(+) regulatory T cells through PI3K/AKT pathway. J
Cell Mol Med. 17:252–264. 2013. View Article : Google Scholar : PubMed/NCBI
|
|
14
|
Li C, Zou J, Zheng G and Chu J: MiR-30a
decreases multidrug resistance (MDR) of gastric cancer cells. Med
Sci Monit. 0:02016.PubMed/NCBI
|
|
15
|
Li Y, Zhang J, Liu Y, Zhang B, Zhong F,
Wang S and Fang Z: MiR-30a-5p confers cisplatin resistance by
regulating IGF1R expression in melanoma cells. BMC Cancer.
18:4042018. View Article : Google Scholar : PubMed/NCBI
|
|
16
|
Park YR, Kim SL, Lee MR, Seo SY, Lee JH,
Kim SH, Kim IH, Lee SO, Lee ST and Kim SW: MicroRNA-30a-5p
(miR-30a) regulates cell motility and EMT by directly targeting
oncogenic TM4SF1 in colorectal cancer. J Cancer Res Clin Oncol.
143:1915–1927. 2017. View Article : Google Scholar : PubMed/NCBI
|
|
17
|
Xiao B, Shi X and Bai J: miR-30a regulates
the proliferation and invasion of breast cancer cells by targeting
Snail. Oncol Lett. 17:406–413. 2019.PubMed/NCBI
|
|
18
|
Guo Y, Sun W, Gong T, Chai Y, Wang J, Hui
B, Li Y, Song L and Gao Y: miR-30a radiosensitizes non-small cell
lung cancer by targeting ATF1 that is involved in the
phosphorylation of ATM. Oncol Rep. 37:1980–1988. 2017. View Article : Google Scholar : PubMed/NCBI
|
|
19
|
Jiang X, Xu C, Lei F, Liao M, Wang W, Xu
N, Zhang Y and Xie W: MiR-30a targets IL-1α and regulates islet
functions as an inflammation buffer and response factor. Sci Rep.
7:52702017. View Article : Google Scholar : PubMed/NCBI
|
|
20
|
Hu E, Ding L, Miao H, Liu F, Liu D, Dou H
and Hou Y: MiR-30a attenuates immunosuppressive functions of
IL-1β-elicited mesenchymal stem cells via targeting TAB3. FEBS
Lett. 589:3899–3907. 2015. View Article : Google Scholar : PubMed/NCBI
|
|
21
|
Riess M, Fuchs NV, Idica A, Hamdorf M,
Flory E, Pedersen IM and König R: Interferons induce expression of
SAMHD1 in Monocytes through down-regulation of miR-181a and
miR-30a. J Biol Chem. 292:264–277. 2017. View Article : Google Scholar : PubMed/NCBI
|
|
22
|
Wu Y, Sun Q and Dai L: Immune regulation
of miR-30 on the Mycobacterium tuberculosis-induced TLR/MyD88
signaling pathway in THP-1 cells. Exp Ther Med. 14:3299–3303. 2017.
View Article : Google Scholar : PubMed/NCBI
|
|
23
|
Fang X, Sun D, Wang Z, Yu Z, Liu W, Pu Y,
Wang D, Huang A, Liu M, Xiang Z, et al: MiR-30a positively
regulates the inflammatory response of microglia in experimental
autoimmune Encephalomyelitis. Neurosci Bull. 33:603–615. 2017.
View Article : Google Scholar : PubMed/NCBI
|
|
24
|
Qu X, Zhou J, Wang T, Han J, Ma L, Yu H,
Geng D, Fan H, Zhang Q, Hua F, et al: MiR-30a inhibits Th17
differentiation and demyelination of EAE mice by targeting the
IL-21R. Brain Behav Immun. 57:193–199. 2016. View Article : Google Scholar : PubMed/NCBI
|
|
25
|
Livak KJ and Schmittgen TD: Analysis of
relative gene expression data using real-time quantitative PCR and
the 2(-Delta Delta C(T)) method. Methods. 25:402–408. 2001.
View Article : Google Scholar : PubMed/NCBI
|
|
26
|
Cruz LO, Hashemifar SS, Wu CJ, Cho S,
Nguyen DT, Lin LL, Khan AA and Lu LF: Excessive expression of
miR-27 impairs Treg-mediated immunological tolerance. J Clin
Invest. 127:530–542. 2017. View Article : Google Scholar : PubMed/NCBI
|
|
27
|
Ripamonti A, Provasi E, Lorenzo M, De
Simone M, Ranzani V, Vangelisti S, Curti S, Bonnal RJP, Pignataro
L, Torretta S, et al: Repression of miR-31 by BCL6 stabilizes the
helper function of human follicular helper T cells. Proc Natl Acad
Sci USA. 114:12797–12802. 2017. View Article : Google Scholar : PubMed/NCBI
|
|
28
|
Takahashi R, Nakatsukasa H, Shiozawa S and
Yoshimura A: SOCS1 is a key molecule that prevents regulatory T
cell plasticity under inflammatory conditions. J Immunol.
199:149–158. 2017. View Article : Google Scholar : PubMed/NCBI
|
|
29
|
Takahashi R and Yoshimura A: SOCS1 and
regulation of regulatory T cells plasticity. J Immunol Res.
2014:9431492014. View Article : Google Scholar : PubMed/NCBI
|
|
30
|
Melnik BC, John SM, Carrera-Bastos P and
Schmitz G: Milk: A postnatal imprinting system stabilizing FoxP3
expression and regulatory T cell differentiation. Clin Transl
Allergy. 6:182016. View Article : Google Scholar : PubMed/NCBI
|
|
31
|
Friedman RC, Farh KK, Burge CB and Bartel
DP: Most mammalian mRNAs are conserved targets of microRNAs. Genome
Res. 19:92–105. 2009. View Article : Google Scholar : PubMed/NCBI
|
|
32
|
Zhao J, Li Y, Hu Y, Chen C, Zhou Y, Tao Y,
Guo M, Qin N and Xu L: MicroRNAs expression profile in CCR6(+)
regulatory T cells. PeerJ. 2:e5752014. View Article : Google Scholar : PubMed/NCBI
|
|
33
|
Mohammadnia-Afrouzi M, Hosseini AZ,
Khalili A, Abediankenari S, Amari A, Aghili B and Nataj HH: Altered
microRNA expression and immunosuppressive cytokine production by
regulatory T cells of ulcerative colitis patients. Immunol Invest.
45:63–74. 2016. View Article : Google Scholar : PubMed/NCBI
|
|
34
|
Hu Y, Wang C, Li Y, Zhao J, Chen C, Zhou
Y, Tao Y, Guo M, Qin N, Ren T, et al: MiR-21 controls in situ
expansion of CCR6+ regulatory T cells through PTEN/AKT pathway in
breast cancer. Immunol Cell Biol. 93:753–64. 2015. View Article : Google Scholar : PubMed/NCBI
|
|
35
|
Sánchez-Díaz R, Blanco-Dominguez R,
Lasarte S, Tsilingiri K, Martín-Gayo E, Linillos-Pradillo B, de la
Fuente H, Sánchez-Madrid F, Nakagawa R, Toribio ML, et al:
Thymus-derived regulatory T cell development is regulated by C-Type
Lectin-mediated BIC/MicroRNA 155 expression. Mol Cell Biol.
37(pii): e00341–16. 2017.PubMed/NCBI
|
|
36
|
Bronevetsky Y, Burt TD and McCune JM:
Lin28b regulates fetal regulatory T cell differentiation through
modulation of TGF-β signaling. J Immunol. 197:4344–4350. 2016.
View Article : Google Scholar : PubMed/NCBI
|
|
37
|
Zhou Q, Haupt S, Kreuzer JT, Hammitzsch A,
Proft F, Neumann C, Leipe J, Witt M, Schulze-Koops H and Skapenko
A: Decreased expression of miR-146a and miR-155 contributes to an
abnormal Treg phenotype in patients with rheumatoid arthritis. Ann
Rheum Dis. 74:1265–1274. 2015. View Article : Google Scholar : PubMed/NCBI
|
|
38
|
Yao R, Ma YL, Liang W, Li HH, Ma ZJ, Yu X
and Liao YH: MicroRNA-155 modulates Treg and Th17 cells
differentiation and Th17 cell function by targeting SOCS1. PLoS
One. 7:e460822012. View Article : Google Scholar : PubMed/NCBI
|
|
39
|
Xu L, Xu W, Jiang Z, Zhang F, Chu Y and
Xiong S: Depletion of CD4(+)CD25(high) regulatory T cells from
tumor infiltrating lymphocytes predominantly induces Th1 type
immune response in vivo which inhibits tumor growth in adoptive
immunotherapy. Cancer Biol Ther. 8:66–72. 2009. View Article : Google Scholar : PubMed/NCBI
|
|
40
|
Ilangumaran S, Bobbala D and Ramanathan S:
SOCS1: Regulator of T cells in autoimmunity and cancer. Curr Top
Microbiol Immunol. 410:159–189. 2017.PubMed/NCBI
|
|
41
|
Zhao M, Sun D, Guan Y, Wang Z, Sang D, Liu
M, Pu Y, Fang X, Wang D, Huang A, et al: Disulfiram and
Diphenhydramine Hydrochloride upregulate miR-30a to suppress
IL-17-associated autoimmune inflammation. J Neurosci. 36:9253–9266.
2016. View Article : Google Scholar : PubMed/NCBI
|
|
42
|
Sugase T, Takahashi T, Serada S, Fujimoto
M, Ohkawara T, Hiramatsu K, Nishida T, Hirota S, Saito Y, Tanaka K,
et al: SOCS1 gene therapy has antitumor effects in
imatinib-resistant gastrointestinal stromal tumor cells through
FAK/PI3K signaling. Gastric Cancer Nov. 21:968–976. 2018.
View Article : Google Scholar
|
|
43
|
Wang H, Wang J and Xia Y: Defective
suppressor of cytokine signaling 1 signaling contributes to the
pathogenesis of systemic lupus erythematosus. Front Immunol.
8:12922017. View Article : Google Scholar : PubMed/NCBI
|
|
44
|
Knosp CA, Schiering C, Spence S, Carroll
HP, Nel HJ, Osbourn M, Jackson R, Lyubomska O, Malissen B, Ingram
R, et al: Regulation of Foxp3+ inducible regulatory T cell
stability by SOCS2. J Immunol. 190:3235–3245. 2013. View Article : Google Scholar : PubMed/NCBI
|
|
45
|
Yu CR, Kim SH, Mahdi RM and Egwuagu CE:
SOCS3 deletion in T lymphocytes suppresses development of chronic
ocular inflammation via upregulation of CTLA-4 and expansion of
regulatory T cells. J Immunol. 191:5036–5043. 2013. View Article : Google Scholar : PubMed/NCBI
|
|
46
|
Kitz A, de Marcken M, Gautron AS, Mitrovic
M, Hafler DA and Dominguez-Villar M: AKT isoforms modulate Th1-like
Treg generation and function in human autoimmune disease. EMBO Rep.
17:1169–1183. 2016. View Article : Google Scholar : PubMed/NCBI
|
|
47
|
Kurebayashi Y, Baba Y, Minowa A, Nadya NA,
Azuma M, Yoshimura A, Koyasu S and Nagai S: TGF-β-induced
phosphorylation of Akt and Foxo transcription factors negatively
regulates induced regulatory T cell differentiation. Biochem
Biophys Res Commun. 480:114–119. 2016. View Article : Google Scholar : PubMed/NCBI
|