Introduction
Spinal cord injury (SCI) is a disabling condition
with significant morbidity and mortality, that affects ~11,000
individuals annually worldwide (1). The mean age for patients with SCI is
33 years worldwide, and the incidence of SCI is approximately four
times higher among males (2).
Spinal cord damage may result in pain and paralysis, as well as
loss of sensation and physical function. The causes of SCI are
varied and include accidents, falls, infections and tumors
(3). In addition, patients with
SCI may develop spondylosis, a common degenerative change in the
cervical spine (4) and its
incidence has increased over the past several decades, but
management strategies to reduce SCI prevalence have not yet been
developed.
The current management strategies for SCI are
limited. A better understanding of the physiological mechanisms
underlying the disease may lead to the identification of novel
interventions. A study exploring the mechanisms underlying SCI has
reported that overexpression of signal transducer and activator of
transcription 3 (STAT3) promotes neuron regeneration and
functional recovery following SCI (5). In addition, connexin 43 (Cx43)
expression has been demonstrated to aggravate secondary injury
following SCI, leading to researchers proposing connexins as
potential targets for SCI treatment (6).
Tropomyosin-related kinase B.T1 (trkB.T1), which is
highly expressed in the nervous system of adult mammals, has been
identified to accumulate in astrocytes, white matter and ependymal
cells following SCI (7,8). Although trkB.T1 lacks a kinase
activation domain, it is active in signal transduction (9,10).
Wu et al (11) performed
whole genome analysis for trkB.T1 knockout (KO) mice and reported
that trkB.T1 serves a critical role in SCI pain and progression by
regulating pathways associated with the cell cycle (11).
Herein, a bioinformatic approach was used to analyze
the microarray data compiled by Wu et al (11), in order to further investigate the
differentially expressed genes (DEGs) in trkB.T1 KO mice at
different time points following SCI. As genes with differential
expression may be closely associated with SCI pathogenesis, the
functions and interactions of the identified DEGs were explored. In
addition, the present study aimed to identify potential target
genes and their involvement in the biological functions underlying
SCI pathogenesis.
Materials and methods
Data collection
Spinal cord tissues of SCI mice were profiled based
on the Affymetrix Mouse Genome 430 2.0 Array platform (11). Microarray data were provided by Wu
et al (11); these data
were generated from trkB.T1 KO and trkB.T1 wild type (WT) mice
under different conditions, including sham operations, and at days
1, 3, and 7 following SCI. This dataset (GSE47681) was downloaded
from the Gene Expression Omnibus database (www.ncbi.nlm.nih.gov/geo/).
Data preprocessing and DEG
analysis
Differences in gene expression between trkB.T1 KO
and trkB.T1 WT mice in sham groups (sham KO vs. sham WT) and in SCI
groups at days 1, 3, and 7 after injury (day 1 KO vs. day 1 WT; day
3 KO vs. day 3 WT; and day 7 KO vs. day 7 WT) were respectively
compared via unpaired t-tests using the R package ‘limma’ (12). Genes for which met the P<0.05
and |log2 fold change (FC)|≥0.4 cutoff points were
selected as DEGs, following which gene expression profiles of DEGs
were visualized via the ‘gplots’ in R package version 3.0. 1
(13).
Venn diagram analysis
In order to mine the feature genes from different
datasets, a Venn diagram analysis was conducted using VennPlex
version 1.0.0.2 software (www.irp.nia.nih.gov/bioinformatics/vennplex.html)
(14). The DEGs and their
respective log2FC values were uploaded to the VennPlex
version 1.0.0.2 tool, from which differences in the expression
levels of DEGs at several time points were obtained, and the number
of upregulated, downregulated and contraregulated genes were
calculated.
Co-expression module and functional
analysis
Weighted correlation network analysis (WGCNA) was
used to identify highly correlated genes based on gene expression
patterns across the microarray samples (15). DEGs in trkB.T1 KO mice of the sham
group and SCI groups at days 1, 3 and 7 following injury were
subjected to co-expression analysis using the R package ‘WGCNA’
version 1.19 (15) based on the
WGCNA algorithm. Significant gene co-expression modules were
screened out using the clustering method. The |correlation
coefficient|≥0.65 and P<0.05 were set as the cutoff values.
Gene Ontology (GO) (16) function and Kyoto Encyclopedia of
Genes and Genomes (KEGG) (17)
pathway analyses were conducted for the genes in the co-expression
modules by the Database for Annotation, Visualization and
Integrated Discovery (DAVID) online tool (18) with new fuzzy classification
algorithms. GO and KEGG terms with counts ≥2 and P<0.05 was
considered to indicate a statistically significant difference.
Protein-protein interaction
network
PPI network analysis was performed to analyze the
functional interactions between proteins encoded by DEGs associated
with the co-expression network. the Search Tool for the Retrieval
of Interacting Genes/Proteins (STRING) database (19) includes an extensive list of protein
interacting pairs collected from neighborhood, gene fusion,
co-occurrence, co-expression experiments, databases and text
mining. Genes from the co-expression network were input into the
STRING online tool to identify highly associated gene pairs. The
protein pairs with medium confidence (≥0.4) were collected and the
PPI network was visualized using the package ‘Cytoscape’ version 3
(20). Significant nodes with high
degrees of connectivity were screened out.
Module analysis
PPI networks contain several densely connected
network modules, with genes in each module commonly involved in the
same biological processes. ClusterONE (21) is a graph-clustering algorithm that
incorporates weighted graphs and readily generates overlapping
clusters (www.paccanarolab.org/cluster-one/). As such,
ClusterONE version 1.0 was used to cluster the PPI network, with
P<1×10⁻⁴ set as the threshold value. Further KEGG
pathway analysis of the module genes was subsequently undertaken to
identify the significant pathways (P<0.05).
Results
Differential expression analysis
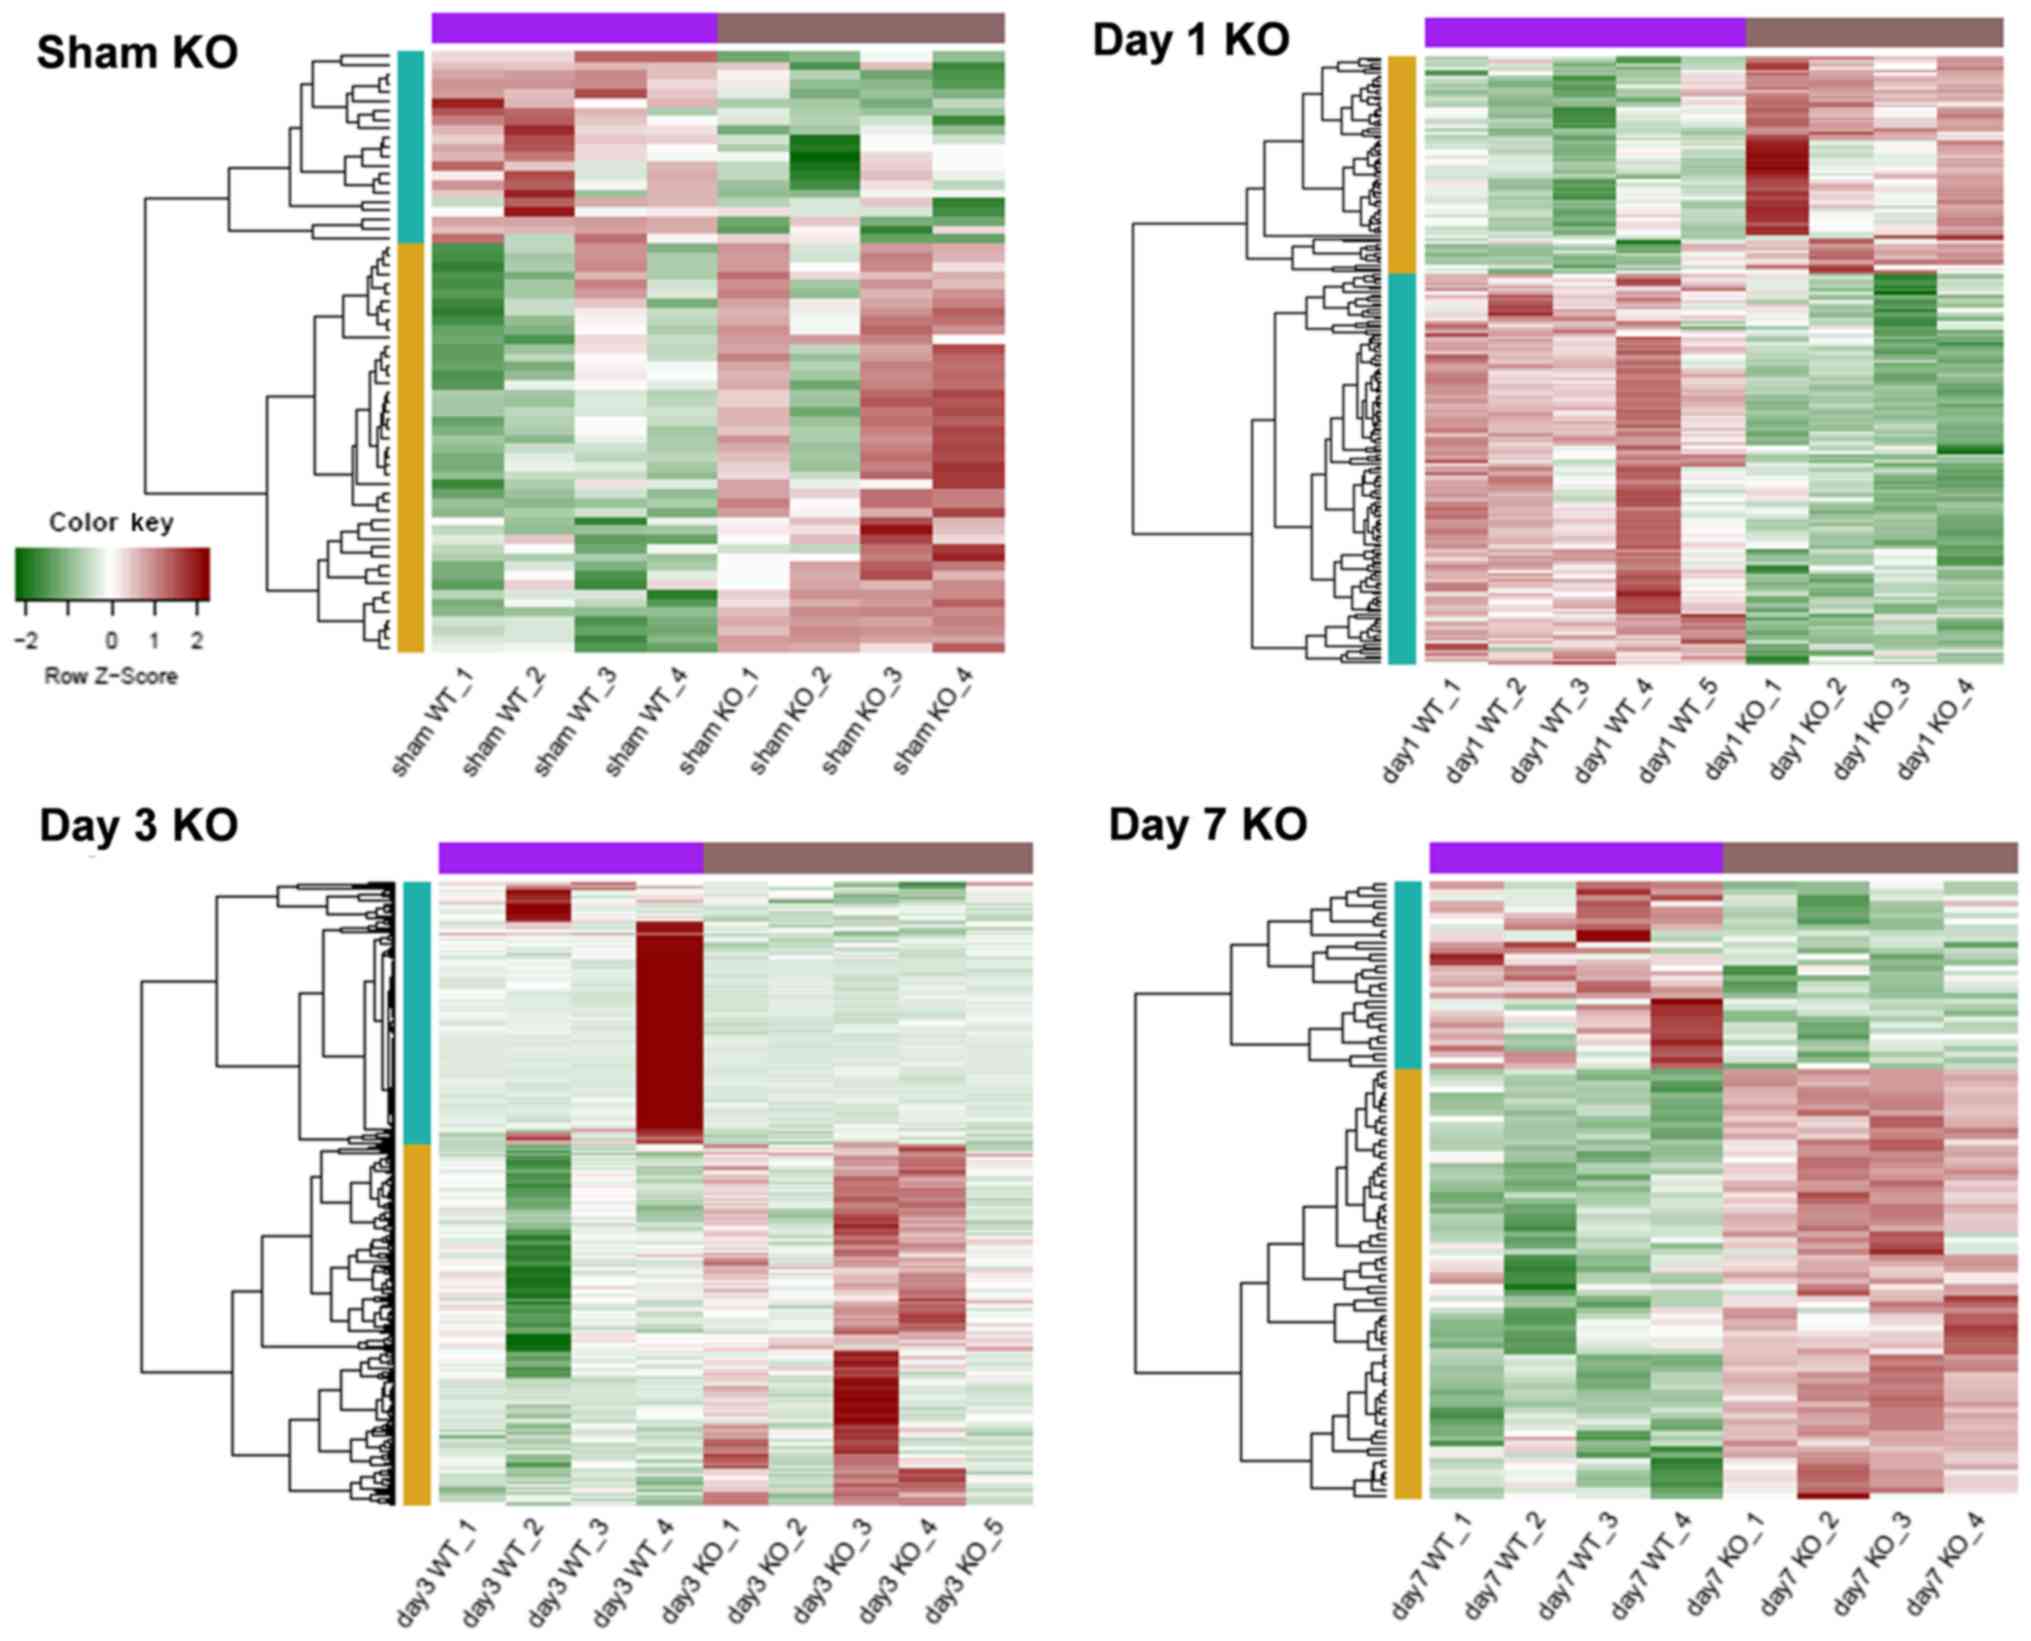
Based on P<0.05 and |log2FC| ≥0.4,
DEGs of trkB.T1 KO mice in the sham, day 1, day 3 and day 7 SCI
groups were respectively identified. As presented in Table I, the smallest number of DEGs
occurred in the sham group, consisting of 45 upregulated and 21
downregulated genes. The day 3 SCI group contained the largest
number of differentially expressed genes, consisting of 206
upregulated and 149 downregulated genes. Gene expression profiles
of the various DEGs in the different groups are presented in
Fig. 1. This analysis suggested
that DEG expression levels may be used to distinguish between
trkB.T1 KO and WT samples.
 | Table I.Differentially expressed genes in the
sham and spinal cord injury groups. |
Table I.
Differentially expressed genes in the
sham and spinal cord injury groups.
| Group | Upregulated gene
count | Mean value logFC
(up) | Downregulated gene
count | Mean value logFC
(down) | Total |
|---|
| Sham KO | 45 | 0.882 | 21 | −0.5569 | 66 |
| Day 1 KO | 73 | 0.7096 | 132 | −0.6407 | 205 |
| Day 3 KO | 206 | 0.6201 | 149 | −0.8843 | 355 |
| Day 7 KO | 74 | 0.54 | 32 | −0.5852 | 106 |
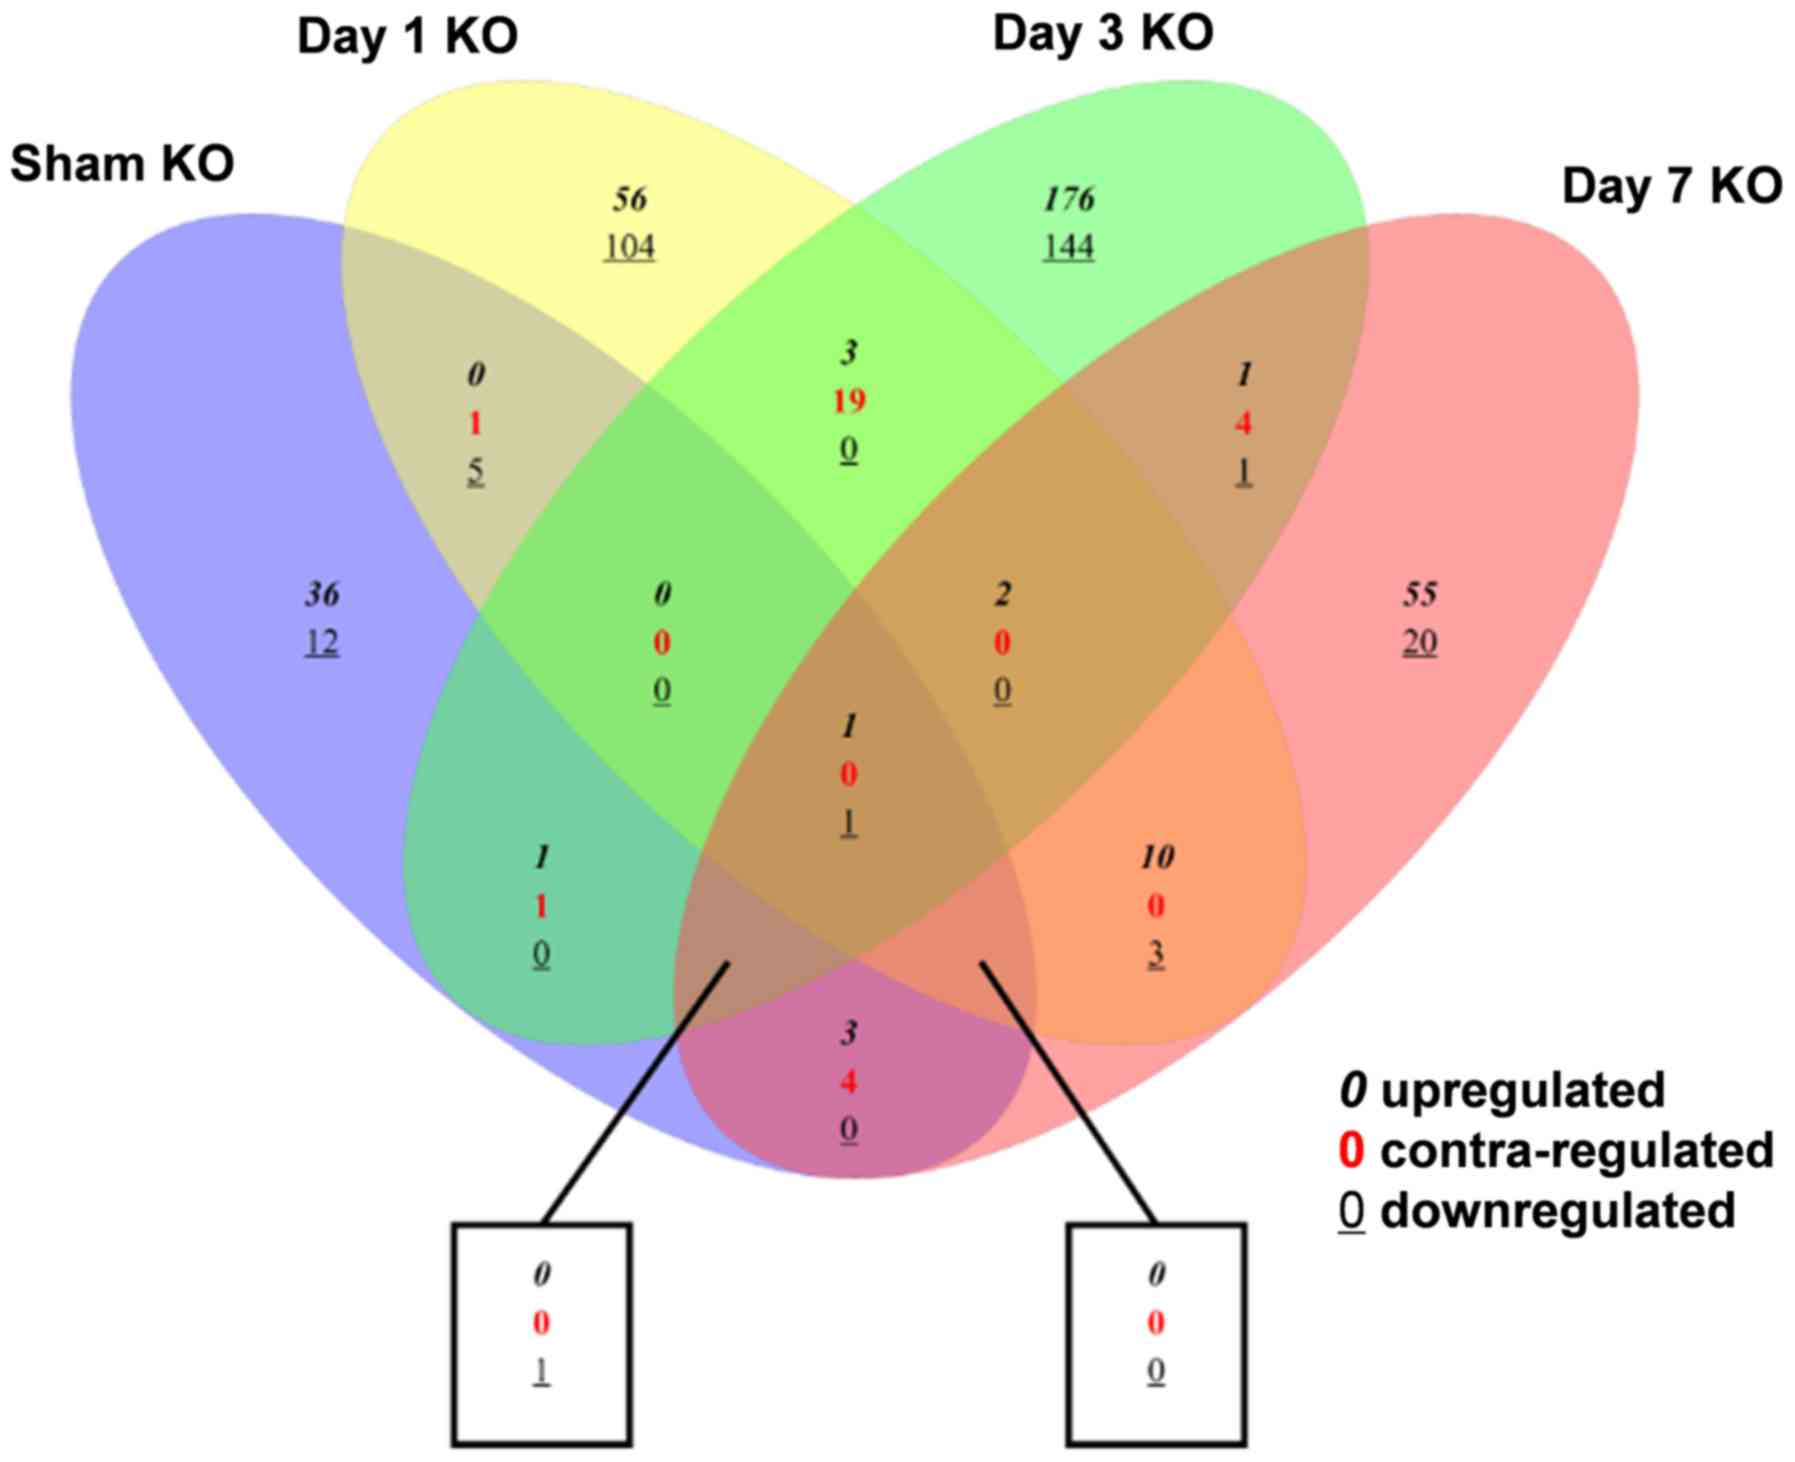
Venn diagram analysis
The relationships between the different DEG groups
are depicted in Fig. 2. Compared
with the sham group, the number of overlapping DEGs of trkB.T1 KO
mice at days 1, 3 and 7 after SCI were 7, 5 and 10, respectively.
In addition, 26 DEGs overlapped between the day 1 and day 3 SCI
groups; 17 overlapped between the day 1 and day 7 SCI groups; and
11 overlapped between the day 3 and day 7 SCI groups.
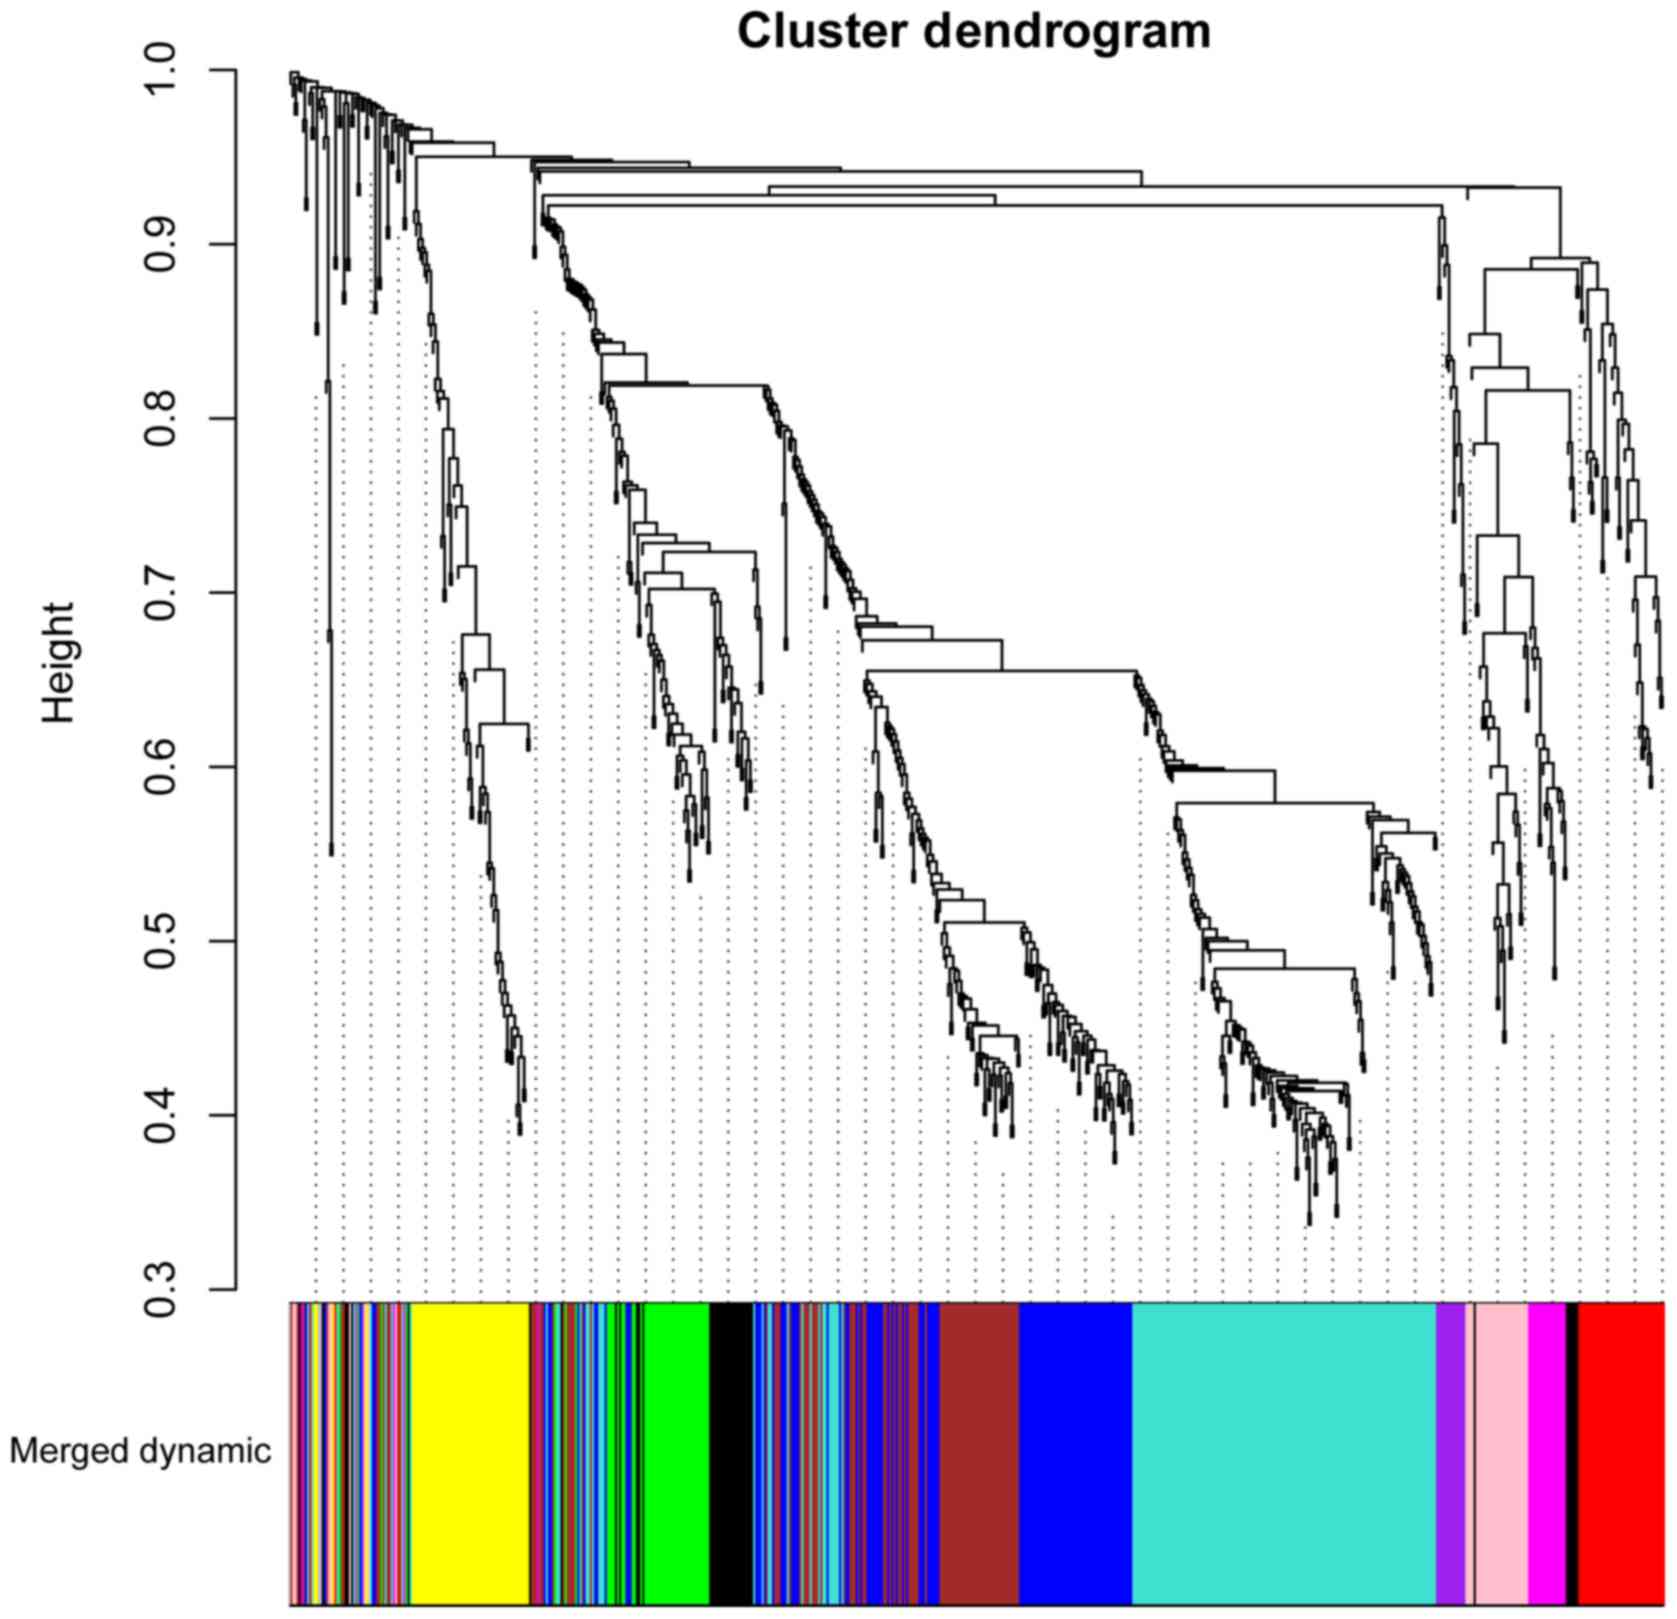
WGCNA co-expression analysis
A total of 664 DEGs in the sham group and SCI groups
at days 1, 3, and 7 following injury were identified in trkB.T1 KO
mice. Subjecting the DEGs to WGCNA analysis revealed that they were
clustered into 11 modules (represented by the different colors in
Fig. 3). The top four
modules-those with the highest correlation coefficients (CC) and
lowest P-values-were, in the following order: Magenta (CC=0.66,
P=3.67×10⁻³; gene count, 23), Purple (CC=0.65,
P=4.69×10⁻³; gene count, 15), Brown (CC=0.9,
P=7.20×10⁻⁷; gene count, 96) and Blue (CC=0.88,
P=3.62×10⁻⁶; gene count, 110) modules.
Functional analysis revealed that the genes in the
Magenta module were significantly enriched in ‘response to virus’,
‘immune response’, and ‘cytosolic DNA-sensing pathway’; genes in
the Purple module were strongly associated with ‘extracellular
region’ and ‘drug metabolism’; genes in the Blue module were
significantly associated with ‘immune response’, ‘Fc γ R-mediated
phagocytosis’ and ‘complement and coagulation cascades’; and genes
in the Brown module were markedly enriched in ‘oxidation
reduction’, ‘drug metabolism’ and ‘complement and coagulation
cascades’ (Table II).
| Table II.Significant GO and KEGG pathways for
genes in co-expression modules. |
Table II.
Significant GO and KEGG pathways for
genes in co-expression modules.
| Module | Category | Term | Count | P-value |
|---|
| Magenta | BP | GO:0009615~response
to virus | 5 |
1.85×10⁻⁷ |
|
|
| GO:0006955~immune
response | 6 |
1.07×10⁻⁵ |
|
| BP | GO:0006952~defense
response | 5 |
2.09×10⁻⁴ |
|
| CC |
GO:0005783~endoplasmic reticulum | 5 |
5.95×10⁻⁴ |
|
| MF | GO:0032555~purine
ribonucleotide binding | 8 |
1.17×10⁻³ |
|
|
|
GO:0032553~ribonucleotide binding | 8 |
1.17×10⁻³ |
|
| MF | GO:0017076~purine
nucleotide binding | 8 |
1.50×10⁻³ |
|
| KEGG_PATHWAY | mmu04623:Cytosolic
DNA-sensing pathway | 3 |
1.84×10⁻³ |
|
|
| mmu04622:RIG-I-like
receptor signaling pathway | 3 |
2.80×10⁻³ |
| Purple | CC |
GO:0044421~extracellular region part | 4 |
1.50×10⁻² |
|
|
|
GO:0005576~extracellular region | 5 |
2.34×10⁻² |
|
| KEGG_PATHWAY | mmu00983:Drug
metabolism | 2 |
4.11×10⁻² |
| Blue | BP | GO:0006955~immune
response | 15 |
8.03×10⁻⁸ |
|
|
| GO:0009611~response
to wounding | 11 |
9.24×10⁻⁶ |
|
| BP | GO:0001775~cell
activation | 9 |
3.32×10⁻⁵ |
|
| CC | GO:0034358~plasma
lipoprotein particle | 4 |
4.65×10⁻⁴ |
|
|
|
GO:0032994~protein-lipid complex | 4 |
4.65×10⁻⁴ |
|
| CC | GO:0005886~plasma
membrane | 28 |
3.60×10⁻³ |
|
| MF | GO:0001871~pattern
binding | 6 |
4.28×10⁻⁴ |
|
|
|
GO:0030247~polysaccharide binding | 6 |
4.28×10⁻⁴ |
|
| MF |
GO:0005539~glycosaminoglycan binding | 5 |
2.46×10⁻³ |
|
| KEGG_PATHWAY | mmu04666:Fc γ
R-mediated phagocytosis | 6 |
3.71×10⁻⁴ |
|
|
| mmu04610:Complement
and coagulation cascades | 5 |
1.28×10⁻³ |
|
|
| mmu04650:Natural
killer cell mediated cytotoxicity | 5 |
7.47×10⁻³ |
| Brown | BP |
GO:0055114~oxidation reduction | 10 |
2.03×10⁻³ |
|
|
| GO:0002526~acute
inflammatory response | 4 |
4.97×10⁻³ |
|
| BP |
GO:0055090~acylglycerol homeostasis | 2 |
8.52×10⁻³ |
|
| CC |
GO:0005576~extracellular region | 22 |
7.15×10⁻⁵ |
|
|
|
GO:0005615~extracellular space | 10 |
1.23×10⁻³ |
|
|
|
GO:0044421~extracellular region part | 12 |
1.97×10⁻³ |
|
| MF |
GO:0016712~oxidoreductase activity, acting
on paired donors, with incorporation or reduction of molecular
oxygen, reduced flavin or flavoprotein as one donor, and
incorporation of one atom of oxygen | 4 |
9.68×10⁻⁴ |
|
|
| GO:0009055~electron
carrier activity | 6 |
1.99×10⁻³ |
|
| MF | GO:0043176~amine
binding | 4 |
2.49×10⁻³ |
|
| KEGG_PATHWAY | mmu00982:Drug
metabolism | 5 |
1.04×10⁻³ |
|
|
| mmu04610:Complement
and coagulation cascades | 4 |
1.04×10⁻² |
|
|
| mmu00591:Linoleic
acid metabolism | 3 |
3.16×10⁻² |
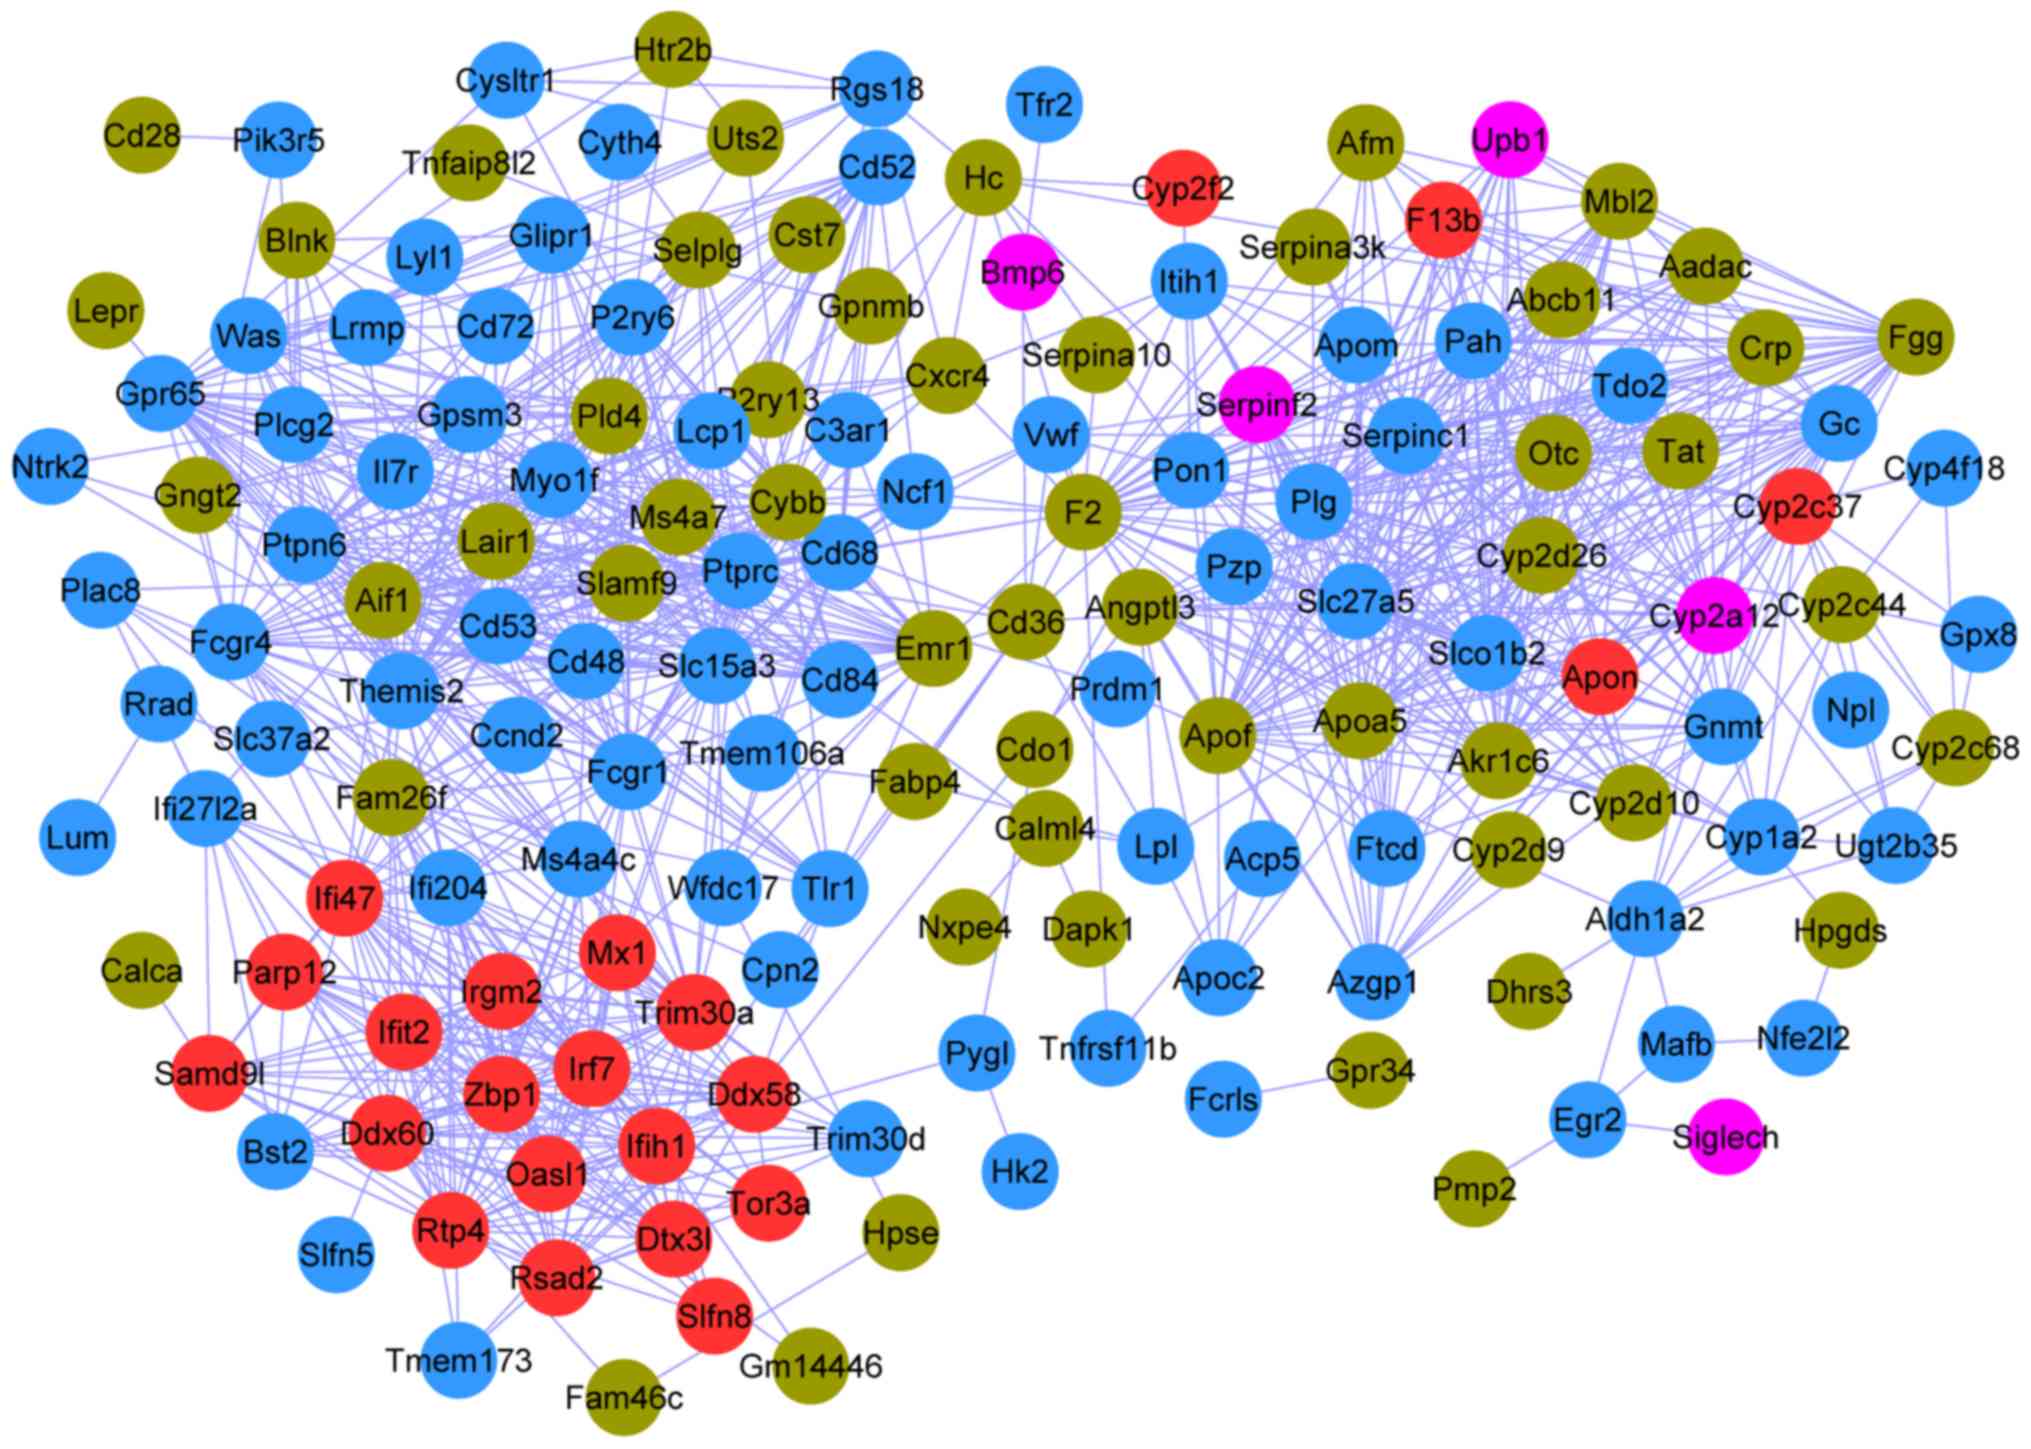
PPI construction and module
analysis
The PPI network connected 161 nodes through 1,051
edges; the color scheme used for the nodes was the same as that
used for the modules described in the previous section (Fig. 4). The top 20 nodes (Table III) were determined to have a
degree ≥28 in the PPI network, including protein tyrosine
phosphatase, receptor type C (PTPRC; degree, 43; Blue),
coagulation factor II, thrombin (F2; degree, 41; Brown),
plasminogen (PLG; degree, 38; Blue), and thymocyte selection
associated family member 2 (Themis2; degree, 37; Blue).
| Table III.Top 20 genes with the highest degree
in the PPI network. |
Table III.
Top 20 genes with the highest degree
in the PPI network.
| Gene | Module type | Degree |
|---|
| PTPRC | Blue | 43 |
| F2 | Brown | 41 |
| PLG | Blue | 38 |
| THEMIS2 | Blue | 37 |
|
SERPINC1 | Blue | 35 |
| SLC27A5 | Blue | 34 |
| SLC15A3 | Blue | 33 |
| AKR1C6 | Brown | 32 |
| CD53 | Blue | 32 |
| TRIM30A | Magenta | 32 |
| PTPN6 | Blue | 32 |
| GPR65 | Blue | 32 |
| SLCO1B2 | Blue | 32 |
| APOF | Brown | 32 |
| FCGR4 | Blue | 30 |
| AIF1 | Brown | 30 |
| APOA5 | Brown | 28 |
| IFI47 | Magenta | 28 |
| FGG | Brown | 28 |
| FCGR1 | Blue | 28 |
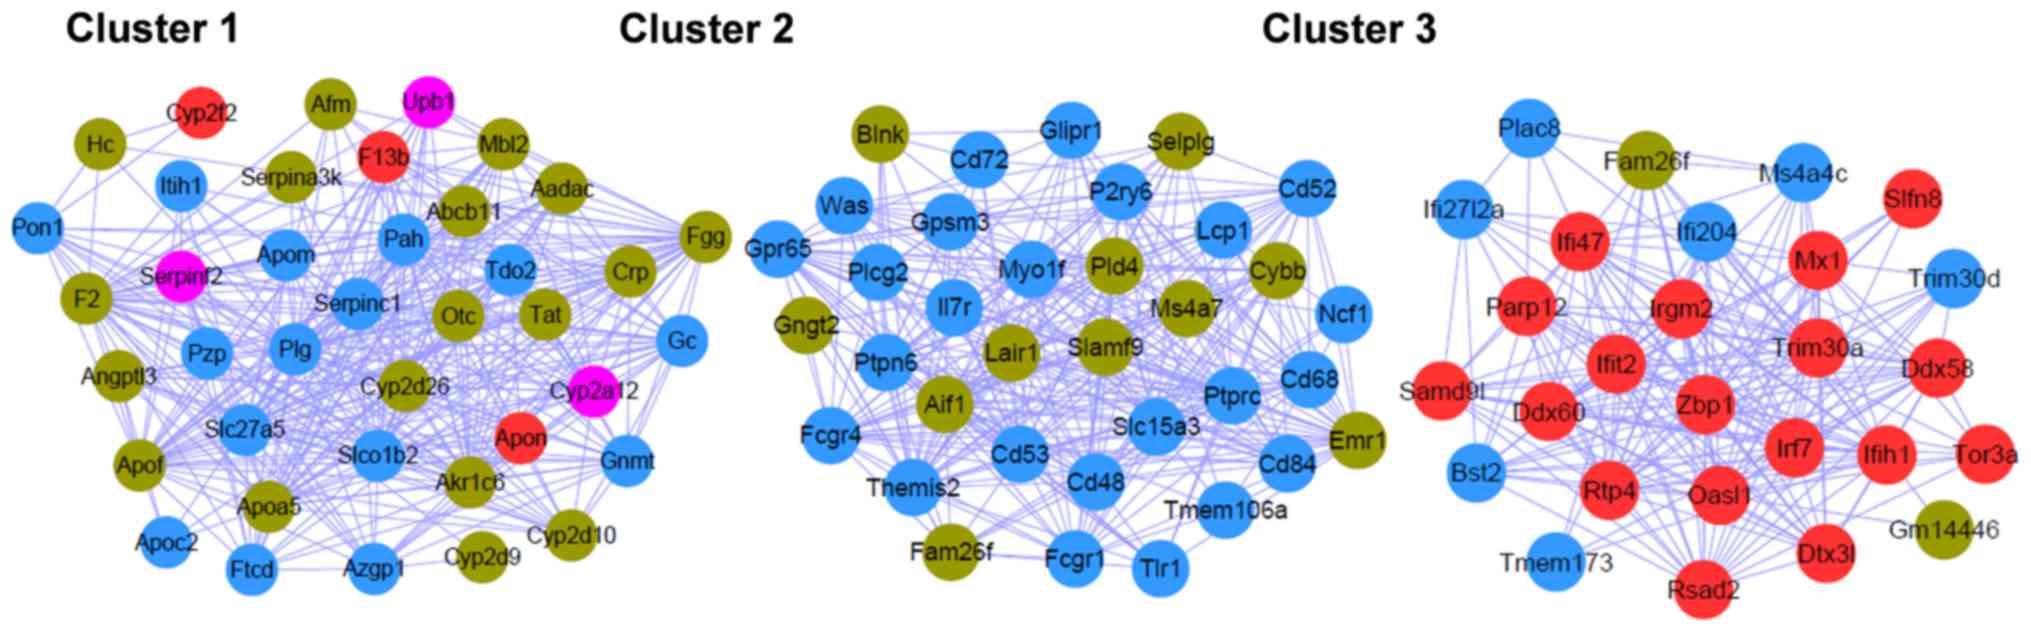
ClusterOne analysis resulted in three significant
gene clusters (Fig. 5), and the
DAVID online tool, which facilitates classification of functionally
associated genes in different KEGG pathways (Table IV), demonstrated that the genes in
cluster 1 were closely associated with ‘complement and coagulation
cascades’, ‘drug metabolism’, and ‘phenylalanine, tyrosine, and
tryptophan biosynthesis’; the genes in cluster 2 were significantly
involved in ‘Fc γ R-mediated phagocytosis’, ‘B cell receptor
signaling pathway’ and ‘natural killer cell mediated cytotoxicity’;
genes in cluster 3 were involved in the ‘cytosolic DNA-sensing’ and
‘RIG-I-like receptor signaling pathways’.
| Table IV.Significant pathways for genes in the
protein-protein interaction network. |
Table IV.
Significant pathways for genes in the
protein-protein interaction network.
| Cluster | Term | P-value | Genes |
|---|
| Cluster 1 | mmu04610:
Complement and coagulation cascades |
1.02×10⁻⁸ | F13B, MBL2, FGG,
HC, SERPINF2, F2, SERPINC1, PLG |
|
| mmu00982: Drug
metabolism |
3.15×10⁻³ | CYP2D9, CYP2A12,
CYP2D10, CYP2D26 |
|
| mmu00400:
Phenylalanine, tyrosine and tryptophan biosynthesis |
1.99×10⁻² | PAH,
TAT |
| Cluster 2 | mmu04666: Fc γ
R-mediated phagocytosis |
1.24×10⁻⁴ | PTPRC, NCF1,
PLCG2, WAS, FCGR1 |
|
| mmu04662: B cell
receptor signaling pathway |
1.28×10⁻³ | PTPN6, PLCG2,
CD72, BLNK |
|
| mmu04650: Natural
killer cell mediated cytotoxicity |
4.29×10⁻³ | CD48, PTPN6,
PLCG2, FCGR4 |
|
| mmu05340: Primary
immunodeficiency |
4.35×10⁻³ | PTPRC, IL7R,
BLNK |
|
| mmu04670: Leukocyte
transendothelial migration |
4.23×10⁻² | CYBB, NCF1,
PLCG2 |
| Cluster 3 | mmu04623: Cytosolic
DNA-sensing pathway |
8.22×10⁻⁶ | DDX58, TMEM173,
IRF7, ZBP1 |
|
| mmu04622:
RIG-I-like receptor signaling pathway |
1.57×10⁻⁵ | DDX58, IFIH1,
TMEM173, IRF7 |
Discussion
SCI often results in chronic pain and loss of
physical function (22). A
previous study demonstrated that TrkB.T1, as a receptor for
brain-derived neurotrophic factor, serves a critical role in
neuropathic pain and SCI progression (11). In the present study, the
significant DEGs at different time points following SCI were
identified and potential targets for SCI therapy were suggested
based on the differential expression profiles induced by TrkB.T1
KO.
In total, 664 genes were differentially expressed in
the sham group and SCI groups at different time points following
injury. Gene expression profiles of the DEGs differed significantly
between TrkB.T1 KO and TrkB.T1 WT samples, and construction of a
Venn diagram indicated a lower number of overlapping DEGs under the
different conditions. Based on these results, it was concluded that
the DEGs screened out were significant.
Analysis of the PPI network suggested that PTPRC,
F2, and PLG were the most significant nodes, with
multiple interactions with other nodes, and PTPRC with a
degree of 43 was identified to be the single most significant node
in the PPI network. Previous research has shown PTPRC to be
a critical DEG in the PPI network following spared nerve injury,
and PTPRC might thus represent a potential target for
peripheral neuropathic pain intervention (23). Based on the results obtained in the
present study, it was speculated that PTPRC may also have a
critical role in the pathology of SCI.
Protein tyrosine phosphatase, the receptor type C
encoded by PTPRC, is a member of the protein tyrosine
phosphatase family. PTPRC, also known as CD45 antigen, is highly
expressed in hematopoietic cells in particular and is strongly
associated with cellular growth and proliferation. Transplanted
hematopoietic stem cells have been demonstrated to persist in SCI
lesions and contribute to functional recovery following SCI
(24). The expression of CD45 has
been revealed to be upregulated in macrophages and microglia during
the inflammatory response following SCI (25). The anti-inflammatory activation of
macrophages and microglia promotes tissue and function repair
following SCI (25).
In addition, PTPRC in cluster 2 was
significantly enriched in Fc γ R-mediated phagocytosis, a finding
consistent with previous results; Jin et al (26) also reported that the genes
upregulated post-SCI are significantly enriched in Fc γ R-mediated
phagocytosis. Furthermore, Ohri et al (27) observed that the Fc γ R-mediated
phagocytosis pathway is dysregulated in C/EBP-homologous protein
10-null mice following severe SCI. Previous evidence further
suggests that superoxide is produced during Fc γ R-mediated
phagocytosis, and is strongly associated with neuronal death
following SCI (28,29). In the present study, co-expression
analysis also revealed that PTPRC was clustered in the Blue
module, and the genes contained therein are known to be associated
with Fc γ R-mediated phagocytosis. Taken together, these results
suggested that PTPRC serves a critical role in SCI
progression via interactions with other genes.
F2 and PLG were also identified to be
critical genes in the PPI network. PPI module analysis suggested
that F2 and PLG composed cluster 2, and were both
significantly enriched in the complement and coagulation cascades.
Co-expression analysis clustered F2 in the Brown module and
PLG in the Blue module, and subsequent KEGG pathway analysis
revealed that the genes in the Brown and Blue modules were closely
associated with the complement and coagulation cascades, which
suggested that the findings of the present study were of particular
significance.
Coagulation factor II, also known as thrombin, is
encoded by F2. Thrombin functions in coagulation-associated
reactions and thus in reducing blood loss. Like thrombin, plasmin
encoded by PLG is a serine protease present in the blood
(27). It has been reported that
patients with SCI are often afflicted with coagulation-related
disorders, including altered platelet function and coagulation
factor concentrations, which may lead to cardiovascular disorders
(30,31). Therefore, focused targeting of
F2 and PLG expression may aid in the mitigation of
cardiovascular disorders associated with SCI.
Due to a lack of clinical materials and funding, the
present study was unable to provide experimental validation of
these findings, but these results warrant future research involving
both cellular and clinical samples.
In conclusion, PTPRC, F2 and PLG were
identified as significant nodes in the PPI network, and therefore
may have critical function in SCI progression through their
involvement in inflammatory responses and coagulation disorders. As
such, PTPRC, F2 and PLG may be candidate targets for
SCI gene therapy. The findings of the present study may lead to a
better understanding of the pathogenesis of SCI and shed light on
the identification of novel therapeutic targets. However, clinical
trials on gene therapy are necessary to assess potential genetic
strategies for SCI.
Acknowledgments
Not applicable.
Funding
The study was funded by the Shanghai Science and
Technology Committee program (no 16411955200) and the Scientific
Research and Innovation Team Funding Plan of Shanghai Sanda
University.
Availability of data and materials
All data generated or analyzed during the present
study are included in this published article.
Authors' contributions
LW and FH were responsible for the conception and
design of the research, and drafting the manuscript. WZ performed
the data acquisition. WC performed the data analysis and
interpretation. BY participated in the design of the study and
performed the statistical analysis. All authors have read and
approved the manuscript.
Ethics approval and consent to
participate
Not applicable.
Patient consent for publication
Not applicable.
Competing interests
The authors declare that they have no competing
interests.
References
|
1
|
Crewe NM and Krause JS: Spinal cord
injury. In: Medical, Psychosocial and Vocational Aspects of
Disability. Brodwin MG, Siu FW, Howard J and Brodwin ER: 3rd.
Elliott and Fitzpatrick, Inc.; Athens, GA: pp. 289–304. 2009
|
|
2
|
Wyndaele M and Wyndaele JJ: Incidence,
prevalence and epidemiology of spinal cord injury: What learns a
worldwide literature survey? Spinal Cord. 44:523–529. 2006.
View Article : Google Scholar : PubMed/NCBI
|
|
3
|
Chen Y, Tang Y, Vogel LC and DeVivo MJ:
Causes of spinal cord injury. Top Spinal Cord Inj Rehabil. 19:1–8.
2013. View Article : Google Scholar : PubMed/NCBI
|
|
4
|
Shah RR and Tisherman SA: Spinal cord
injury. J Imaging the ICU Patient. 377–380. 2014. View Article : Google Scholar
|
|
5
|
Lang C, Bradley PM, Jacobi A,
Kerschensteiner M and Bareyre FM: STAT3 promotes corticospinal
remodelling and functional recovery after spinal cord injury. EMBO
Rep. 14:931–937. 2013. View Article : Google Scholar : PubMed/NCBI
|
|
6
|
Huang C, Han X, Li X, Lam E, Peng W, Lou
N, Torres A, Yang M, Garre JM, Tian GF, et al: Critical role of
connexin 43 in secondary expansion of traumatic spinal cord injury.
J Neurosci. 32:3333–3338. 2012. View Article : Google Scholar : PubMed/NCBI
|
|
7
|
King VR, Bradbury EJ, McMahon SB and
Priestley JV: Changes in truncated trkB and p75 receptor expression
in the rat spinal cord following spinal cord hemisection and spinal
cord hemisection plus neurotrophin treatment. Exp Neurol.
165:327–341. 2000. View Article : Google Scholar : PubMed/NCBI
|
|
8
|
Liebl DJ, Huang W, Young W and Parada LF:
Regulation of Trk receptors following contusion of the rat spinal
cord. Exp Neurol. 167:15–26. 2001. View Article : Google Scholar : PubMed/NCBI
|
|
9
|
Dorsey SG, Renn CL, Carimtodd L, Barrick
CA, Bambrick L, Krueger BK, Ward CW and Tessarollo L: In vivo
restoration of physiological levels of truncated TrkB.T1 receptor
rescues neuronal cell death in a trisomic mouse model. Neuron.
51:21–28. 2006. View Article : Google Scholar : PubMed/NCBI
|
|
10
|
Carim-Todd L, Bath KG, Fulgenzi G,
Yanpallewar S, Jing D, Barrick CA, Becker J, Buckley H, Dorsey SG,
Lee FS and Tessarollo L: Endogenous truncated TrkB.T1 receptor
regulates neuronal complexity and TrkB kinase receptor function in
vivo. J Neurosci. 29:678–685. 2009. View Article : Google Scholar : PubMed/NCBI
|
|
11
|
Wu J, Renn CL, Faden AI and Dorsey SG:
TrkB. T1 contributes to neuropathic pain after spinal cord injury
through regulation of cell cycle pathways. J Neurosci.
33:12447–12463. 2013. View Article : Google Scholar : PubMed/NCBI
|
|
12
|
Smyth GK: Limma: Linear models for
microarray data. J Bioinform Comput Biol Solut Using R and
Bioconductor. 397–420. 2005.
|
|
13
|
Warnes GR, Bolker B, Bonebakker L,
Gentleman R, Liaw WHA, Lumley T, Maechler M, Magnusson A, Moeller
S, Schwartz M and Venables B: gplots: Various R programming tools
for plotting data. R package version 3.0.1. The Comprehensive R
Archive Network. 2016.
|
|
14
|
Cai H, Chen H, Yi T, Daimon CM, Boyle JP,
Peers C, Maudsley S and Martin B: VennPlex-A novel Venn diagram
program for comparing and visualizing datasets with differentially
regulated datapoints. PLoS One. 8:e533882013. View Article : Google Scholar : PubMed/NCBI
|
|
15
|
Langfelder P and Horvath S: WGCNA: An R
package for weighted correlation network analysis. BMC
Bioinformatics. 9:5592008. View Article : Google Scholar : PubMed/NCBI
|
|
16
|
Ashburner M, Ball CA, Blake JA, Botstein
D, Butler H, Cherry JM, Davis AP, Dolinski K, Dwight SS, Eppig JT,
et al: Gene ontology: Tool for the unification of biology. The gene
ontology consortium. Nat Genet. 25:25–29. 2000. View Article : Google Scholar : PubMed/NCBI
|
|
17
|
Kanehisa M and Goto S: KEGG: Kyoto
encyclopedia of genes and genomes. Nucleic Acids Res. 28:27–30.
2000. View Article : Google Scholar : PubMed/NCBI
|
|
18
|
Huang da W, Sherman BT and Lempicki RA:
Systematic and integrative analysis of large gene lists using DAVID
bioinformatics resources. Nat Protoc. 4:44–57. 2009. View Article : Google Scholar : PubMed/NCBI
|
|
19
|
Szklarczyk D, Franceschini A, Wyder S,
Forslund K, Heller D, Huerta-Cepas J, Simonovic M, Roth A, Santos
A, Tsafou KP, et al: STRING v10: Protein-protein interaction
networks, integrated over the tree of life. Nucleic Acids Res.
43:D447–D452. 2015. View Article : Google Scholar : PubMed/NCBI
|
|
20
|
Shannon P, Markiel A, Ozier O, Baliga NS,
Wang JT, Ramage D, Amin N, Schwikowski B and Ideker T: Cytoscape: A
software environment for integrated models of biomolecular
interaction networks. Genome Res. 13:2498–2504. 2003. View Article : Google Scholar : PubMed/NCBI
|
|
21
|
Nepusz T, Yu H and Paccanaro A: Detecting
overlapping protein complexes in protein-protein interaction
networks. Nat Methods. 9:471–472. 2012. View Article : Google Scholar : PubMed/NCBI
|
|
22
|
Defrin R, Ohry A, Blumen N and Urca G:
Characterization of chronic pain and somatosensory function in
spinal cord injury subjects. Pain. 89:253–263. 2001. View Article : Google Scholar : PubMed/NCBI
|
|
23
|
Yang YK, Lu XB, Wang YH, Yang MM and Jiang
DM: Identification crucial genes in peripheral neuropathic pain
induced by spared nerve injury. Eur Rev Med Pharmacol Sci.
18:2152–2159. 2014.PubMed/NCBI
|
|
24
|
Koda M, Okada S, Nakayama T, Koshizuka S,
Kamada T, Nishio Y, Someya Y, Yoshinaga K, Okawa A, Moriya H and
Yamazaki M: Hematopoietic stem cell and marrow stromal cell for
spinal cord injury in mice. Neuroreport. 16:1763–1767. 2005.
View Article : Google Scholar : PubMed/NCBI
|
|
25
|
David S and Kroner A: Repertoire of
microglial and macrophage responses after spinal cord injury. Nat
Rev Neurosci. 12:388–399. 2011. View
Article : Google Scholar : PubMed/NCBI
|
|
26
|
Jin L, Wu Z, Xu W, Hu X, Zhang J, Xue Z
and Cheng L: Identifying gene expression profile of spinal cord
injury in rat by bioinformatics strategy. Mol Biol Rep.
41:3169–3177. 2014. View Article : Google Scholar : PubMed/NCBI
|
|
27
|
Ohri SS, Maddie MA, Zhang Y, Shields CB,
Hetman M and Whittemore SR: Deletion of the pro-apoptotic
endoplasmic reticulum stress response effector CHOP does not result
in improved locomotor function after severe contusive spinal cord
injury. J Neurotrauma. 29:579–588. 2012. View Article : Google Scholar : PubMed/NCBI
|
|
28
|
Xu W, Chi L, Xu R, Ke Y, Luo C, Cai J, Qiu
M, Gozal D and Liu R: Increased production of reactive oxygen
species contributes to motor neuron death in a compression mouse
model of spinal cord injury. Spinal Cord. 43:204–213. 2005.
View Article : Google Scholar : PubMed/NCBI
|
|
29
|
Ueyama T, Lennartz MR, Noda Y, Kobayashi
T, Shirai Y, Rikitake K, Yamasaki T, Hayashi S, Sakai N, Seguchi H,
et al: Superoxide production at phagosomal cup/phagosome through βI
protein kinase C during FcγR-mediated phagocytosis in microglia. J
Immunol. 173:4582–4589. 2004. View Article : Google Scholar : PubMed/NCBI
|
|
30
|
Furlan JC and Fehlings MG: Cardiovascular
complications after acute spinal cord injury: Pathophysiology,
diagnosis, and management. Neurosurg Focus. 25:E132008. View Article : Google Scholar : PubMed/NCBI
|
|
31
|
Bravo G, Guízar-Sahagún G, Ibarra A,
Centurión D and Villalón CM: Cardiovascular alterations after
spinal cord injury: An overview. Curr Med Chem Cardiovasc Hematol
Agents. 2:133–148. 2004. View Article : Google Scholar : PubMed/NCBI
|