Introduction
In addition to genetic and epigenetic alterations,
metabolic reprogramming has been identified as a hallmark of
numerous types of malignant tumour, as it is associated with
cellular transformation and cancer progression (1). Apart from altered glucose metabolism,
a recent study demonstrated that cancer cells exhibit aberrant
lipid metabolism to facilitate cell growth, proliferation,
differentiation and motility (2).
As the major components of triglycerides (TGs), fatty acids (FA)
serve essential roles in the synthesis of structural membranes,
signalling pathways and energy homeostasis (3). In energy metabolism, fatty acid
oxidation (FAO) also provides an important source of reducing
equivalents and ATP, which assists the survival of cancer cells
(4); however, FAO increases the
production of reactive oxygen species (ROS) via the mitochondria
(5). ROS able to modify biological
macromolecules, including DNA, lipids and proteins (5). Additionally, the levels of ROS are
upregulated in cancer cells (6).
Recurrent mutations in isocitrate dehydrogenase 1/2
(IDH1/2) have been identified in gliomas, acute myeloid leukemia
(AML) and chondrosarcomas (7–10).
Wild type IDH1/2 catalyses the conversion of isocitrate to
α-ketoglutarate (α-KG) via the reduction of nicotinamide-adenine
dinucleotide phosphate (NADP)+ (11), and serves important roles in the
regulation of redox status, lipogenesis, glucose and amino acid
metabolism (12); however, it is
well established that oncogenic IDH mutations promote the
NADPH-dependent reduction of α-KG into 2-hydroxyglutarate (2-HG)
(13). As an oncometabolite, 2-HG
is a competitive inhibitor of α-KG-dependent dioxygenases,
including histone demethylases and 5-methylcytosine hydroxylases,
which can result in complex genetic and epigenetic alterations
(14). The roles of wild type IDH1
in lipid biosynthesis of liver and adipose tissues have been
established (15,16) and its roles in tumorigenesis have
also been investigated (17). A
recent study has demonstrated that D-2-HG-induced
hypersuccinylation contributes to the tumorigenicity of cells with
IDH mutations, consequently resulting in mitochondrial dysfunction
(18); however the regulatory
functions of mutant IDH in lipid metabolism remain unknown.
In the present study, the effects of FAs on the
growth and apoptosis of human colon carcinoma HCT116 cells with
mutant IDH1 were investigated. Furthermore, ROS production and
mitochondrial dysfunction were determined to identify the roles of
mutant IDH1 in FA metabolism. The findings of the present study are
not only important to understand the functions of mutant IDH in
tumour metabolic reprogramming, but also provide novel insight into
the therapeutic strategies for patients with cancer and mutant
IDH.
Materials and methods
Cell culture
The parental and IDH1 (R132H/+) HCT116 cells
(Horizon Discovery, Cambridge, UK) were cultured in McCoy's 5A
medium (cat. no. 16600082, Gibco; Thermo Fisher Scientific, Inc.,
Waltham, MA, USA) with 10% fetal bovine serum (FBS; cat. no.
10099141, Gibco; Thermo Fisher Scientific, Inc.) at 37°C in an
atmosphere containing 5% CO2. The heterozygous IDH1
(R132H/+) HCT116 cells were generated from the parental cells that
were transfected with the IDH1 (R132H) allele, which resulted in
>100-fold upregulation of D-2-HG compared with the parental
cells (19). Cells
(5×10⁶) were treated with 0, 50, 100, 200 and 400 µM
oleic acid (OA) or palmitic acid (PA) (Sigma-Aldrich; Merck KGaA,
Darmstadt, Germany) in the presence or absence of 5.5 mM glucose at
37°C for 24 h.
PA and OA were prepared with a bovine serum albumin
(BSA) (Sigma-Aldrich; Merck KGaA) conjugate. Briefly, 0.25 ml 200
mM PA or OA solutions (in anhydrous ethanol) were added into 10 ml
FA-free BSA (10%, A4612, Sigma-Aldrich; Merck KGaA) in PBS, and
mixed gently for ≥2 h until completely dissolved. Control BSA was
prepared by adding the same amount of ethanol into 10% BSA
solution. BSA-FA conjugates were further diluted in medium to reach
a final concentration of 0, 50, 100, 200 or 400 µM. All solutions
were aliquoted and frozen at −80°C.
MTT assay
The number of viable cells was determined using an
MTT assay. The cells were plated in a 96-well culture plate.
Following treatment with 0, 50, 100, 200 or 400 µM OA or PA, in the
presence or absence of 5.5 mM glucose, at 37°C for 24 h, MTT
solution was added at a final concentration of 0.5 mg/ml. Following
1 h of incubation at 37°C in the dark, the media were removed and
purple formazan was solubilized using dimethyl sulfoxide
(Sigma-Aldrich; Merck KGaA). The solutions were collected and
transferred to a 96-well plate; the absorbance was measured at a
wavelength of 540 nm using a microplate reader (Thermo Fisher
Scientific, Inc.).
Propidium iodide (PI) staining
Parental and IDH1 (R132H/+) HCT116 cells were seeded
at a density of 1×10⁵ cells/well on coverslips in
12-well plates and cultured in McCoy's 5A medium overnight.
Treatment with 0, 50, 100, 200 or 400 µM OA or PA, in the presence
or absence of 5.5 mM glucose, was performed at 37°C for 24 h.
Medium was removed from the plates and the cells were rinsed cells
twice in PBS. Staining solution containing PI (cat. no. P3566;
Invitrogen; Thermo Fisher Scientific, Inc.) was added at room
temperature for 5 min. Cells were viewer using a fluorescence
microscope (U-RFL-T; Olympus Corporation, Tokyo, Japan) under
×1,000 magnification. The numbers of positive cells across six
fields of view were counted and averaged.
MitoTracker staining
Parental and IDH1 (R132H/+) HCT116 cells were seeded
at a density of 4×10⁵ cells/well on coverslips in
12-well plates and cultured in McCoy's 5A medium overnight. The
medium was removed from the plates and prewarmed (37°C) staining
solution containing Mito Tracker Red CMXRos probe (cat. no. M7512,
Invitrogen; Thermo Fisher Scientific, Inc.) was added at 37°C for
20 min. The staining solution was replaced with fresh prewarmed
PBS. The PBS covering the cells was subsequently removed and
replaced with 4% formaldehyde at 37°C for 15 min. Following
fixation, the cells were rinsed a number of times in buffer. Nuclei
were stained with Hoechst at room temperature for 2 min. Cells were
viewed using a fluorescence microscope (U-RFL-T; Olympus
Corporation) under ×1,000 magnification.
Dichloro-dihydro-fluorescein diacetate
(DCFH-DA) staining
Parental and IDH1 (R132H/+) HCT116 cells were seeded
at a density of 1×10⁵ cells/well on coverslips in
12-well plates and cultured in McCoy's 5A medium overnight. Cells
were treated with 400 µM OA or PA in the presence or absence of 5.5
mM glucose at 37°C for 24 h. The medium was removed from the plates
and staining solution containing DCFH-DA (cat. no. S0033; Beyotime
Institute of Biotechnology, Haimen, China) was added at 37°C for 20
min. The cells were rinsed twice in serum-free medium. The medium
was replaced with 4% formaldehyde at 37°C for 15 min. Following
fixation, the cells were rinsed twice. The nuclei were stained with
Hoechst at room temperature for 2 min. Cells were viewed using a
fluorescence microscope (U-RFL-T; Olympus Corporation) under ×1,000
magnification, followed by quantitative analysis using flow
cytometry (FlowJo v.7.6.3; FlowJo, LLC, Ashland, OR, USA).
Bodipy 493/503 staining
Parental and IDH1 (R132H/+) HCT116 cells were seeded
at a density of 1×10⁵ cells/well on coverslips in
12-well plates and cultured in McCoy's 5A medium overnight. The
cells were treated with 400 µM OA or PA in the presence or absence
of 5.5 mM glucose at 37°C for 24 h. The cells were rinsed twice in
PBS. The cells were fixed with 4% formaldehyde at 37°C for 15 min.
Subsequently, the cells were rinsed twice in PBS. The PBS was
removed and staining solution containing Bodipy 493/503
(Invitrogen; Thermo Fisher Scientific, Inc.) was added at room
temperature for 5 min. The cells were rinsed twice. The nuclei were
stained with Hoechst at room temperature for 2 min. The cells were
viewed using a fluorescence microscope (U-RFL-T; Olympus
Corporation) under ×1,000 magnification, followed by quantitative
analysis using flow cytometry (FlowJo v.7.6.3; FlowJo, LLC).
Determination of intracellular TG
levels
The cells in each group were homogenized in lysis
buffer. A volume of 200 µl cell lysate was added to 800 µl
methanol/chloroform (2:1 v/v). After vigorously mixing several
times, the tubes were centrifuged at 3,000 × g for 5 min. The lower
phase containing lipids was removed and placed in vials, and dried
under nitrogen steam. The lipids were resolved in 200 µl 2% Triton
X-100 and the levels of intracellular TG in the cells were analyzed
using a TG test kit (Wako Pure Chemical Industries, Ltd., Osaka,
Japan).
Determination of malondialdehyde (MDA)
and 4-hydroxy-2-nonenal (4-HNE)
The cellular levels of MDA and 4-HNE were determined
using a microscale MDA assay kit (cat. no. A003, Nanjing Jiancheng
Bioengineering Institute Co., Ltd., Nanjing, China) and a 4-HNE
adduct ELISA kit (cat. no. STA-838, Cell Biolabs, Inc., San Diego,
CA, USA) according to the manufacturer's protocols.
Determination of FAO
Parental and IDH1 (R132H/+) HCT116 cells were
cultured at 37°C for 12 h in McCoy's 5A medium containing 10% FBS.
Cells (2×10⁶) were then washed twice with Hanks'
balanced salt solution [HBSS; 137.93 mM NaCl, 5.33 mM KCl, 4.17 mM
NaHCO3, 0.441 mM KH2PO4, 0.338 mM
Na2HPO4, 5.56 mM glucose, 0.407 mM
MgSO4, 0.493 mM MgCl2 and 1.26 mM
CaCl2 (Beyotime Institute of Biotechnology)]. The
experiments were performed in triplicate on a 12-well plate.
Briefly, 500 µl HBSS containing 22 µM 3H-labelled OA or
PA (1 µCi/well) (GE Healthcare Life Sciences, Little Chalfont, UK)
with 0.5 mg/ml FA-free BSA was added into each well. Following
incubation for 4 and 8 h at 37°C, the medium was collected and
transferred into a glass tube, followed by extraction with 8 ml
methanol/chloroform (2:1, v/v) and 0.5 ml 2 M KCl/2 M HCl. The
aqueous phase containing 3H2O was transferred
into a fresh tube and further extracted using methanol/chloroform
(2:1 v/v) and 2 M KCl/2 M HCl solution. Subsequently, 10 ml
scintillation solution (PerkinElmer, Inc., Waltham, MA, USA) was
added to the aqueous phase, and radioactivity was measured using a
liquid scintillation counter (L6500; Beckman Coulter, Inc., Brea,
CA, USA). The rate of FAO was presented as the production of
radioactive water or water-soluble metabolites at 4 and 8 h.
Glucose consumption analysis
Parental and IDH1 (R132H/+) HCT116 cells were seeded
in 24-well plates, at a density of 1×10⁵ cells/well.
Following overnight incubation, the cells were cultured in McCoy's
5A medium with 5.5 mM glucose and 400 µM OA or PA at 37°C for 4 and
8 h. The glucose levels in the medium were determined using a high
sensitivity glucose assay kit (Sigma-Aldrich; Merck KGaA) according
to the manufacturer's protocols.
Western blot analysis
The cells in each group were homogenized in lysis
buffer [20 mM Tris (pH 7.5), 150 mM NaCl, 1% Triton X-100, sodium
pyrophosphate, β-glycerophosphate, EDTA,
Na3VO4 and leupeptin] (Beyotime Institute of
Biotechnology). The protein concentrations in the soluble lysates
were determined by the Bradford method (Bio-Rad Laboratories, Inc.,
Hercules, CA, USA). Briefly, proteins (10–50 µg/lane) were
separated by 10 and 15% SDS-PAGE and transferred onto a
polyvinylidene fluoride membranes (EMD Millipore, Billerica, MA,
USA). The membranes were blocked using 5% skimmed milk at room
temperature for 1 h. The membranes were incubated with each primary
antibody at 4°C overnight, followed by incubation with horseradish
peroxidase-conjugated secondary antibodies (cat. nos. NA931 and
NA934; 1:5,000; GE Healthcare Life Sciences) at room temperature
for 1 h. The bands were visualized using enhanced chemiluminescence
substrate (Applygen Technologies, Inc., Beijing, China) and exposed
using X-ray film.
The antibodies used for immunoblotting were as
follows: IDH1 (R132H; 1:2,000; cat. no. D339-3; Medical &
Biological Laboratories Co., Ltd., Nagoya, Japan); glucose
transporter 1 (GLUT1; cat. no. 07-1401; 1:10,000; EMD Millipore);
carnitine palmitoyl transferase 1 (CPT1; cat. no. CPT1L12-A;
1:5,000; Alpha Diagnostic International, Inc., San Antonio, TX,
USA); cytochrome c (CYCS; cat. no. 556433; 1:1,000; BD
Pharmingen; BD Biosciences, Franklin Lakes, NJ, USA); CYCS oxidase
IV (Cox4; cat. no. YM3033; 1:1,000; ImmunoWay Biotechnology Co.,
Plano, TX, USA); and β-tubulin (cat. no. KM9003T; 1:1,000; Tianjin
Sungene Biotech Co., Ltd., Tianjin, China).
Reverse transcription-quantitative
polymerase chain reaction (RT-qPCR)
Total RNA was isolated from cells using
TRIzol® (Invitrogen; Thermo Fisher Scientific, Inc.)
according to the manufacturer's protocols. A total of 10 µg RNA was
reverse-transcribed into cDNA using a Prime Script RT Master Mix
kit (Takara Biotechnology Co., Ltd., Dalian, China) (conditions:
37°C for 15 min, followed by 85°C for 5 sec); qPCR was performed
using SYBR® Premix Ex Taq™ II (Takara
Biotechnology Co., Ltd.) with an ABI Step One plus Real-time PCR
system (Applied Biosystems; Thermo Fisher Scientific, Inc.). The
thermocycling conditions used for qPCR were as follows: 95°C for 30
sec, followed by 40 cycles of 95°C for 5 sec and 60°C for 30 sec.
Each analysis was performed in three to six replicates. Primers
used for RT-qPCR are presented in Table I. The relative gene expression was
normalized to the reference gene β-actin using the
2−ΔΔCq method (20).
 | Table I.Polymerase chain reaction primer
sequences (human). |
Table I.
Polymerase chain reaction primer
sequences (human).
| Gene | Primers | Sequences
(5′-3′) | Accession
no.a |
|---|
| ACTB | Forward |
CCAACCGCGAGAAGATGA | NM_001101 |
|
| Reverse |
CCAGAGGCGTACAGGGATAG |
|
| GLUT1 | Forward |
CTGGCATCAACGCTGTCTTC | NM_006516 |
|
| Reverse |
GTTGACGATACCGGAGCCAA |
|
| GLUT4 | Forward |
TGGGCGGCATGATTTCCTC | NM_001042 |
|
| Reverse |
GCCAGGACATTGTTGACCAG |
|
| CPT1 | Forward |
TCCAGTTGGCTTATCGTGGTG | NM_001876 |
|
| Reverse |
TCCAGAGTCCGATTGATTTTTGC |
|
| CPT2 | Forward |
CATACAAGCTACATTTCGGGACC | NM_000098 |
|
| Reverse |
AGCCCGGAGTGTCTTCAGAA |
|
| OGDH | Forward |
GGCTTCCCAGACTGTTAAGAC | NM_001003941 |
|
| Reverse |
GCAGAATAGCACCGAATCTGTTG |
|
| CS | Forward |
TGCTTCCTCCACGAATTTGAAA | NM_004077 |
|
| Reverse |
CCACCATACATCATGTCCACAG |
|
| IDH2 | Forward |
CGCCACTATGCCGACAAAAG | NM_002168 |
|
| Reverse |
ACTGCCAGATAATACGGGTCA |
|
| IDH3a | Forward |
CCCGCGTGGATCTCTAAGG | NM_005530 |
|
| Reverse |
AATTTCTGGGCCAATACCATCTC |
|
| ACO2 | Forward |
CCCTACAGCCTACTGGTGACT | NM_001098 |
|
| Reverse |
TGTACTCGTTGGGCTCAAAGT |
|
| SDHA | Forward |
CAAACAGGAACCCGAGGTTTT | NM_004168 |
|
| Reverse |
CAGCTTGGTAACACATGCTGTAT |
|
| CYCS | Forward |
CTTTGGGCGGAAGACAGGTC | NM_018947 |
|
| Reverse |
TTATTGGCGGCTGTGTAAGAG |
|
| Cox4 | Forward |
CAGGGTATTTAGCCTAGTTGGC | NM_001861 |
|
| Reverse |
GCCGATCCATATAAGCTGGGA |
|
mitochondrial DNA quantification
Total DNA was extracted using the Universal Genomic
DNA Extraction kit (Takara Biotechnology Co., Ltd.). The mtDNA copy
number was determined using qPCR which was performed using
SYBR® Premix Ex Taq™ II (Takara Biotechnology
Co., Ltd.) with an ABI Step One plus Real-time PCR system (Applied
Biosystems; Thermo Fisher Scientific, Inc.). Primers of the
mtDNA-encoded gene NADH dehydrogenase subunit 1 (ND1) were
(forward) 5′-CCCTAAAACCCGCCACATCT-3′ and (reverse)
5′-GAGCGATGGTGAGAGCTAAGGT-3′, and primers of the nuclear gene
hemoglobin subunit β (HGB) were (forward)
5′-GAAGAGCCAAGGACAGGTAC-3′ and (reverse)
5′-CAACTTCATCCACGTTCACC-3′. The thermocycling conditions used for
mtDNA-encoded gene ND1 qPCR were as follows: 50°C for 2 min, 95°C
for 2 min, followed by 40 cycles of 95°C for 15 sec and 60°C for 1
min. The thermocycling conditions used for nuclear gene HGB qPCR
were as follows: 50°C for 2 min, 95°C for 2 min, followed by 40
cycles of 95°C for 15 sec and 56°C for 1 min. Each analysis was
performed in three to six replicates. The results are presented as
the ratio of mtDNA relative to nuclear DNA.
Statistical analysis
Results were presented as mean ± standard error of
the mean of at least three independent experiments. The data were
analysed with an unpaired Student's t-test using GraphPad Prism 5.0
(GraphPad Software, Inc., La Jolla, CA, USA). P<0.05 was
considered to indicate a statistically significant difference.
Results
Mutation of IDH1 exacerbates
FA-induced apoptosis in HCT116 cells
Prior to the addition of FAs, the IDH1 (R132H)
mutant HCT116 cells exhibited intrinsic vulnerability to the
absence of glucose absence, which was consistent with a recent
study (21). To investigate the
roles of FA on cell viability, the parental and IDH1 mutant HCT116
cells were treated with serial concentrations of PA or OA. In the
presence of 5.5 mM glucose, lower concentrations (50–200 µM) of PA
or OA promoted the viability of parental and IDH1 mutant HCT116
cells, whereas a higher concentration (400 µM) notably inhibited
cell viability (Fig. 1A); however,
in the absence of glucose, a high concentration (400 µM) of OA
(t=5.751, P<0.001) or PA (t=6.029, P<0.001) significantly
suppressed the viability of IDH1 mutant HCT116 cells compared with
the parental cells, while lower concentrations (50 and 100 µM) of
PA significantly increased cell viability (Fig. 1B). Furthermore, in the absence of
glucose, the results of PI staining indicated that a high
concentration (400 µM) of PA or OA significantly stimulated the
apoptosis of IDH1 mutant HCT116 cells compared with parental cells;
however, in the presence of glucose, the percentage of apoptotic
cells was markedly altered in IDH1 mutant HCT116 cells compared
with the parental cells, when cultured with OA (t=5.749,
P<0.001) or PA (t=6.030, P≤0.001) (Fig. 1C and D). In summary, these results
indicated that IDH1 mutant cells were more sensitive to FA-induced
suppressed viability and apoptosis in the absence of glucose.
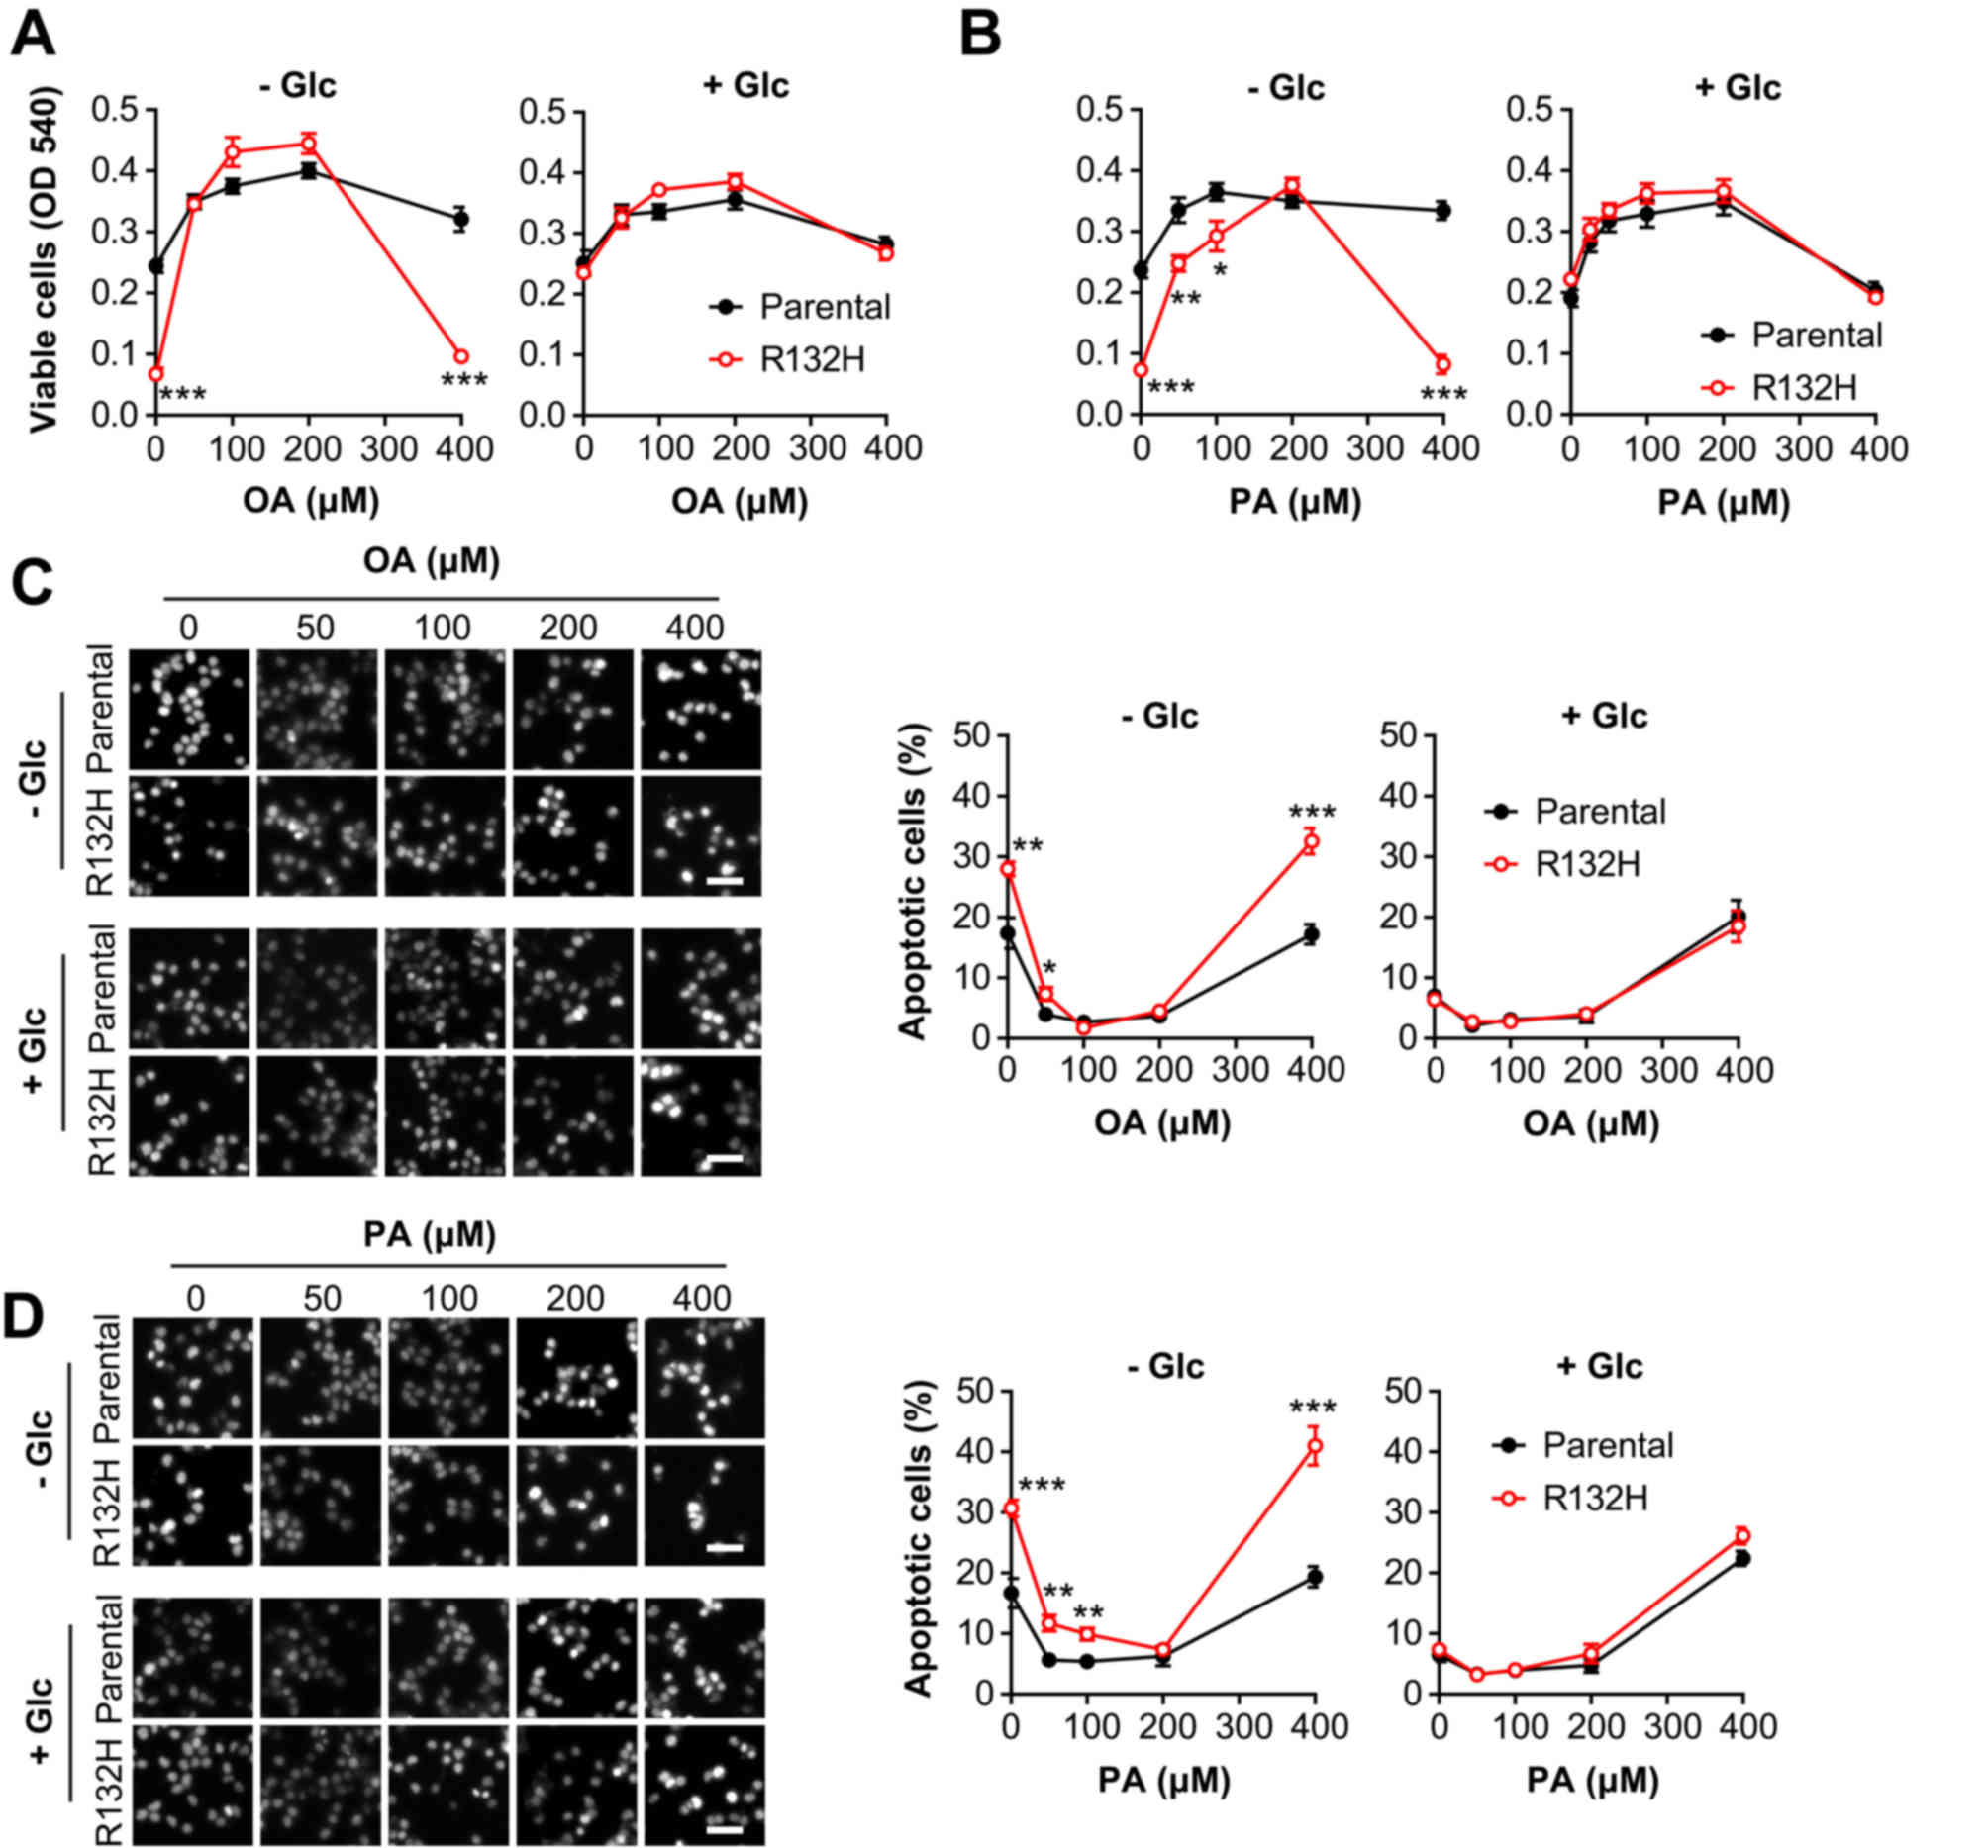 | Figure 1.Mutation of IDH1 exacerbates the
effects of fatty acids on the viability and apoptosis of HCT116
cells in the absence of glucose. Parental and IDH1 (R132H) mutant
HCT116 cells were treated for 24 h with 0, 50, 100, 200 and 400 µM
(A) OA or (B) PA in the presence or absence of glucose,
respectively. The number of viable cells was determined by an MTT
assay. Percentages of apoptotic cells were determined by propidium
iodide staining. Scale bar, 50 µm. (C) Cells treated with OA; (D)
Cells treated with PA. The results are presented as the mean ±
standard error of the mean (n=6). *P<0.05, **P<0.01,
***P<0.001 vs. parental cells. IDH1, isocitrate dehydrogenase 1;
OA, oleic acid; PA, palmitic acid; +Glc, presence of glucose; -Glc,
absence of glucose. |
Mutation of IDH1 aggravates FA-induced
oxidative stress in HCT116 cells
To investigate FA-induced suppressed viability and
apoptosis, the intracellular ROS levels were determined in the
parental and IDH1 mutant HCT116 cells treated with PA or OA. The
results of DCFH-DA staining demonstrated that the absence of
glucose significantly increased OA- (t=3.479, P<0.01) and PA
(t=3.900, P<0.01)-induced ROS production in IDH1 mutant HCT116
cells compared with parental cells (Fig. 2A-C). Additionally, the ROS levels
in OA- or PA-treated IDH1 mutant HCT116 cells in the presence of
glucose were notably increased compared with the parental cells
(Fig. 2A-C).
 | Figure 2.Mutation of IDH1 aggravates fatty
acid-induced oxidative stress in HCT116 cells in the absence of
glucose. Parental and IDH1 (R132H) mutant HCT116 cells were treated
with 400 µM OA or PA for 24 h in the presence or absence of
glucose. The intracellular reactive oxygen species levels were
evaluated using (A) DCFH-DA staining and quantified using (B and C)
flow cytometry. Scale bar=20 µm. The expression levels of (D) MDA
and (E) 4-HNE were determined. The results were presented as the
mean ± standard error of the mean (n=6). *P<0.05, **P<0.01
vs. parental cells. IDH1, isocitrate dehydrogenase 1; OA, oleic
acid; PA, palmitic acid; DCFH-DA, dichloro-dihydro-fluorescein
diacetate; +Glc, presence of glucose; -Glc, absence of glucose;
MDA, malondialdehyde; 4-HNE, 4-hydroxy-2-nonenal; MFI, mean
fluorescence intensity. |
Furthermore, the levels of MDA and 4-HNE, two end
products of lipid peroxidation (22,23),
were significantly increased in IDH1 mutant HCT116 cells compared
with the parental cells treated with OA (t=2.470, P<0.05 and
t=2.317, P<0.05, respectively) or PA (t=2.910, P<0.05 and
t=3.842, P<0.01, respectively) in the absence of glucose
(Fig. 2D and E). Conversely, the
addition of glucose markedly affected the levels of MDA and 4-HNE
in parental and IDH1 mutant HCT116 cells (Fig. 2D and E). In summary, these results
demonstrated that mutation of IDH1 promoted FA-induced production
of ROS in HCT116 cells, in the absence of glucose.
Mutation of IDH1 inhibits FAO and
increases glucose consumption
Excess intracellular FAs are primarily stored in LDs
in the form of TG (24). In the
present study, the results of Bodipy 493/503 staining demonstrated
that there were significantly more LDs in IDH1 mutant HCT116 cells
compared with in the parental cells following the treatment with OA
(t=3.005, P<0.05) or PA (t=2.927, P<0.05) in the absence of
glucose; however, the addition of glucose notably increased the
number and size of LDs in parental and IDH1 mutant HCT116 cells
(Fig. 3A-C). Quantitative analysis
of intracellular TG content revealed similar results (Fig. 3D).
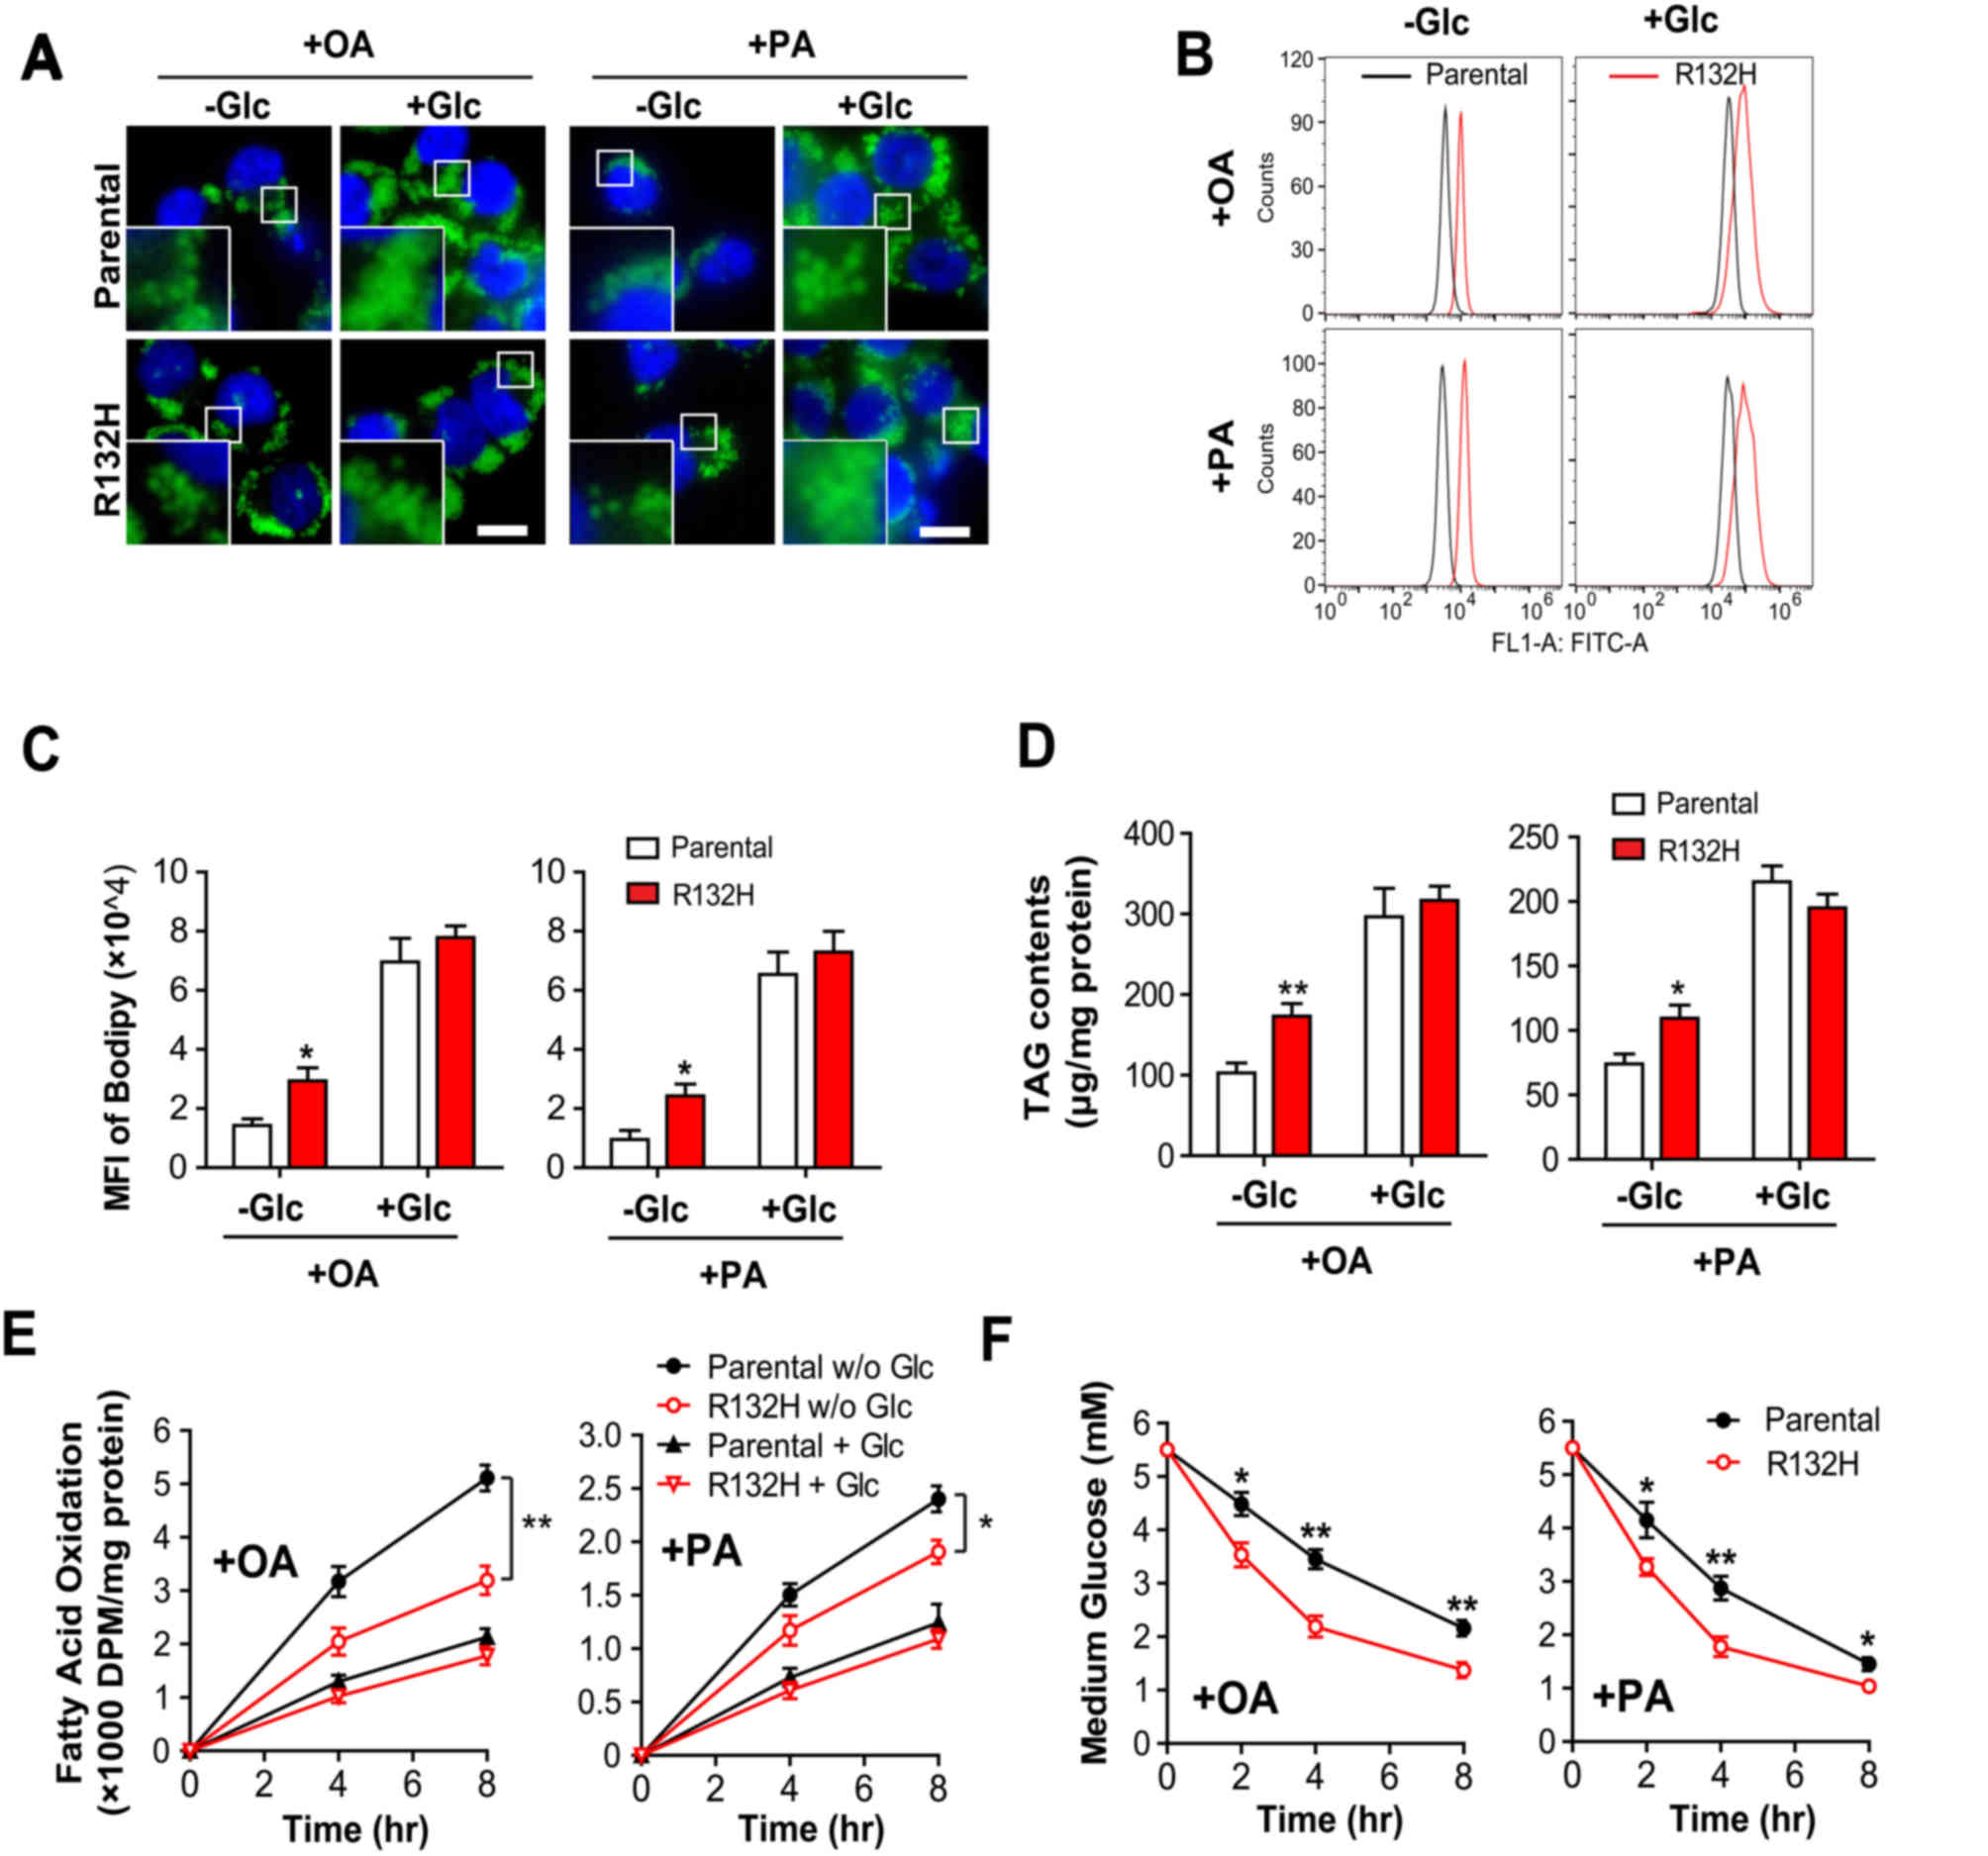 | Figure 3.Mutation of IDH1 inhibits FAO and
increases glucose consumption in HCT116 cells. Parental and IDH1
(R132H) mutant HCT116 cells were treated with 400 µM OA or PA for
24 h, in the presence or absence of glucose. The intracellular
lipid droplets were stained with (A) Bodipy 493/503 and quantified
using (B and C) flow cytometry. Scale bar=20 µm. (D) Total lipids
were extracted and the intracellular TG levels were determined. (E)
Parental and IDH1 (R132H) mutant HCT116 cells were cultured with
3H-labelled OA and PA in the presence and absence of
glucose. The rate of FAO was presented as the production of
radioactive water or water-soluble metabolites following incubation
for 4 and 8 h. (F) Parental and IDH1 (R132H) mutant HCT116 cells
were treated with 400 µM OA or PA for 24 h in the presence of
glucose, and the glucose levels in the media were determined. The
results were presented as the mean ± standard error of the mean
(n=4). *P<0.05, **P<0.01 vs. parental cells. IDH1, isocitrate
dehydrogenase 1; OA, oleic acid; PA, palmitic acid; +Glc, presence
of glucose; -Glc, absence of glucose; FAO, fatty acid oxidation;
TG, triglyceride; MFI, mean fluorescence intensity; DPM,
disintegrations per minute. |
Furthermore, the oxidation of OA and PA was
significantly reduced in IDH1 mutant HCT116 cells compared with
parental cells (Fig. 3E; t=5.286,
P<0.01; and t=3.013, P<0.05, respectively) in the absence of
glucose at 8 h; however, the addition of glucose suppressed the
rate of FAO in parental and IDH1 mutant cells, but the difference
between the groups was not significant (Fig. 3E). In addition, the results
demonstrated that the levels of glucose in culture media decreased
more rapidly in IDH1 mutant cells compared with the parental cells,
when treated with OA (t=4.714, P<0.01 at 4 h) or PA (t=3.768,
P<0.01 at 4 h) (Fig. 3F), which
indicated that IDH1 mutant HCT116 cells consumed more glucose than
the parental cells. In summary, these results suggested that
mutation of IDH1 reduced the rate of FAO, but promoted glucose
consumption in HCT116 cells.
Mutation of IDH1 disrupts the
mitochondrial respiratory chain
To confirm the elevated ROS production and reduced
FAO rate in IDH1 mutant HCT116 cells, mitochondrial function was
further analyzed. The results of MitoTracker staining and
mitochondrial DNA quantification demonstrated that the quantity of
mitochondria in IDH1 mutant HCT116 cells was similar to that of the
parental cells (Fig. 4A).
Furthermore, the results of RT-qPCR indicated that the mRNA
expression levels of GLUT1 were significantly increased (t=3.356,
P<0.01; Fig. 4B) compared with
parental cells; however, that of CPT1, CYCS and Cox4 were
significantly reduced in IDH1 mutant HCT116 cells (t=2.537, 2.567
and 5.039; P<0.05, 0.05 and 0.01, respectively). The mRNA
expression levels of GLUT4, CPT2, oxoglutarate dehydrogenase,
citrate synthase, IDH2, IDH3a, aconitase 2 and succinate
dehydrogenase complex flavoprotein subunit A were notably altered
in IDH1 mutant HCT116 cells compared with in the parental cells.
Immunoblotting demonstrated that the protein expression levels of
GLUT1 were markedly upregulated, but the protein levels of CPT1,
CYCS and Cox4 were notably downregulated in IDH1 mutant HCT116
cells treated with PA or OA in the presence or absence of glucose
compared with in the parental cells, which were consistent with the
results of RT-qPCR (Fig. 4C);
reduced expression of CYCS and Cox4 in IDH1 mutant HCT116 cells
indicated that the mutation of IDH1 impaired the mitochondrial
respiratory chain.
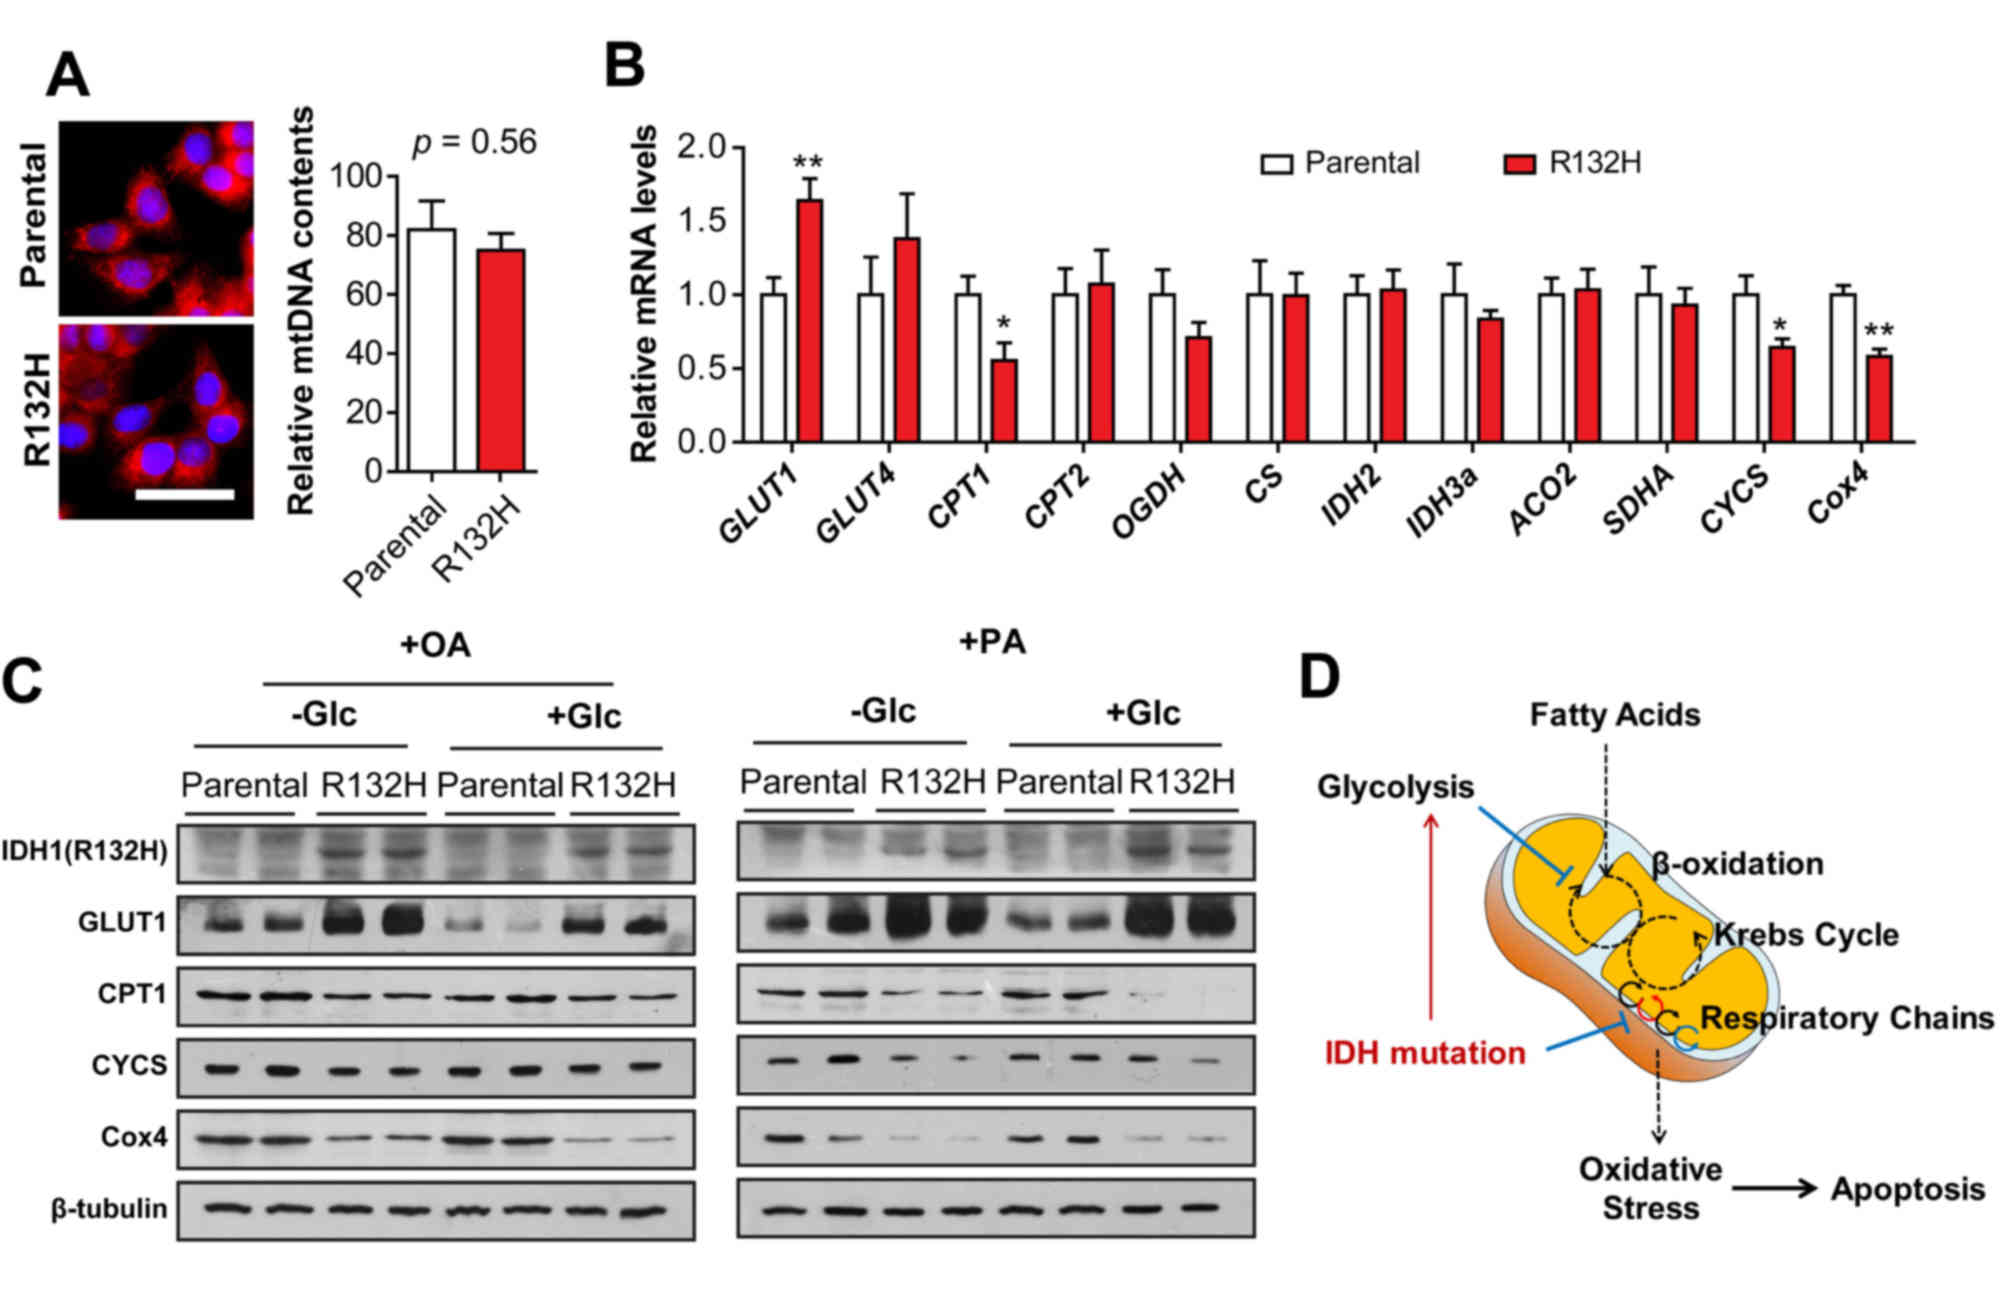 | Figure 4.Mutation of IDH1 impairs the
respiratory chain in mitochondria. (A) Quantity of mitochondria and
mtDNA in parental and IDH1 (R132H) mutant HCT116 cells were
determined using MitoTracker staining and mtDNA quantification.
Scale bar=20 µm. (B) mRNA levels of GLUT1, GLUT4, CPT1, CPT2, OGDH,
CS, IDH2, IDH3a, ACO2, SDHA, CYCS and Cox4 in parental and IDH1
(R132H) mutant HCT116 cells were determined using reverse
transcription-quantitative polymerase chain reaction. The results
were presented as the mean ± standard error of the mean (n=4).
*P<0.05, **P<0.01 vs. parental cells. (C) Parental and IDH1
(R132H) mutant HCT116 cells were treated with PA or OA for 24 h in
the presence or absence of glucose. The protein levels of GLUT1,
CPT1, CYCS, and Cox4 were determined using western blotting
analysis. (D) Schematic diagram revealed that mutation of IDH1
aggravates fatty acid-induced oxidative stress in HCT116 cells.
IDH, isocitrate dehydrogenase; OA, oleic acid; PA, palmitic acid;
+Glc, presence of glucose; -Glc, absence of glucose; GLUT, glucose
transporter; CPT, carnitine palmitoyl transferase; OGDH,
oxoglutarate dehydrogenase; CS, citrate synthase; ACO2, aconitase
2; SDHA, succinate dehydrogenase complex flavoprotein subunit A;
CYCS, cytochrome c; Cox4, CYCS oxidase IV; mtDNA,
mitochondrial DNA. |
Discussion
ROS in cancer cells are frequently upregulated, and
elevated ROS is pro-tumorigenic, consequently resulting in the
activation of pro-survival signaling pathways, increased glucose
metabolism, adaptation to hypoxia and the generation of oncogenic
mutations (25); however, toxic
levels of ROS in cancer cells are also anti-tumorigenic by
increasing oxidative stress and inducing tumour cell death
(26,27). In clinical practice, numerous
chemotherapy drugs increase the production of ROS to toxic levels
and exhaust the capacity of the antioxidant system to induce growth
arrest and cell death (28); thus,
eliminating or elevating ROS production may be effective
therapeutic strategies for the treatment of cancer.
IDH mutations have been reported in glioma, AML,
enchondroma and chondrosarcoma (7–10).
Wild type IDH1/2 catalysed the conversion of isocitrate into α-KG
with the reduction of NADP+ and functioned in protecting
cells from oxidative stress by regulating the intracellular
NADP+/NADPH ratio (11). Wild type IDH1 reduced ROS following
treatment with lipopolysaccharide in vitro (29), and IDH1-null hepatocytes also
exhibited upregulated intracellular ROS; however, the oncogenic IDH
mutations served a novel function to catalyse the reduction of α-KG
to 2-HG by oxidizing NADPH (13).
A recent study indicated that 2-HG inhibited ATP synthase and
mechanistic target of rapamycin signalling in glioblastoma cells,
consequently inducing growth arrest and tumour cell death in the
absence of glucose (21).
Furthermore, it was demonstrated that ROS generation was elevated
in IDH1 mutant cells, and the potential mechanism was due to
decreased NADPH, which may suppress the conversion of oxidized
glutathione (GSH) disulfide into GSH (30); however, the effects of IDH1
mutation on lipid metabolism and mitochondrial functions remain
unknown.
A recent study demonstrated that cancer cells
primarily cultured under serum-free conditions exhibited the
ability to oxidize FA, in order to maintain respiratory and
proliferative activity (31). OA
(C18:1) and PA (C16:0) are the most abundant dietary and plasma FAs
(32). As a saturated FA, PA
serves prominent roles in perturbing the lipid composition in
membranes, resulting in endoplasmic reticulum stress and
mitochondrial dysfunction (33–35).
In the present study, it was determined that lower concentrations
(50–200 µM) of PA or OA promoted the viability of parental and IDH1
mutant HCT116 cells in the absence of glucose; however, a higher
concentration of PA or OA (400 µM) induced the apoptosis and
suppressed the viability of IDH1 mutant cells by increasing ROS
production and lipid peroxidation in the absence of glucose. In
addition, the results of the present study indicated that mutation
of IDH1 inhibited FAO in HCT116 cells, resulting in increased TG
accumulation in the absence of glucose.
Among the mitochondrial metabolic pathways, FAO is
of particular interest as the inhibition of FAO may be a potential
target for reducing tumor growth (36). Regarding metabolic stress, the
production of FAO-derived cytosolic NADPH by cancer cells may be
key to counteract oxidative stress. In the present study, decreased
β-oxidation of FA and the activity of mutant IDH may have also
decreased the levels of reducing equivalents, aggravating oxidative
stress in IDH mutant cells. Furthermore, during the production of
ATP via oxidative phosphorylation, mitochondria are the primary
intracellular producers of ROS and ~0.1–2% of the O2
consumed by the mitochondria is used to produce O2
(37,38), particularly at the levels of
complexes I and III in the mitochondrial electron transport chain
(ETC). In the present study, mutation of IDH1 downregulated the
expression of CYCS and Cox4 in the mitochondrial respiratory chain.
As a component of the mitochondrial ETC, CYCS serves crucial roles
in transferring electrons between complexes III (coenzyme Q-CYCS
reductase) and IV (CYCS oxidase), and the reduced levels of CYCS
and Cox4 may also contribute to the elevated mitochondrial ROS
production in IDH1 mutant HCT116 cells (Fig. 4D). Additionally, peroxisomes are
sources of cytosolic H2O2 under physiological
conditions (39). Furthermore,
endoplasmic reticular monooxygenases, such as cytochrome P450, also
contribute to increased cellular ROS levels, which promote lipid
peroxidation, altered calcium homeostasis, mitochondrial
dysfunction and cell apoptosis (40,41);
however, the effects of IDH1 mutations on other cellular sources of
ROS require further investigation.
Accumulating oxidative damage may affect the
efficiency of mitochondria and further promote the ROS generation.
In order to determine the association between mitochondrial
dysfunction and oxidative stress in IDH mutant cells, the essential
roles of mutant IDH in regulating gene transcription were
investigated in the present study. CPT1 is an transporter
associated with the outer mitochondrial membrane (42) and is required to transport
long-chain FAs into the mitochondrial matrix (43). GLUT1 facilitates the transport of
glucose across the plasma membranes of mammalian cells (36,44).
In the present study, it was determined that mutation of IDH1
downregulated the expression levels of CPT1, but upregulated those
of GLUT1, which coincided with reduced FAO and increased glycolysis
in IDH1 mutant HCT116 cells. The aberrant expression of GLUT1 and
CPT1 may be attributed to the alterations of epigenetics and
hypoxia inducible factor-1 in cancer types with IDH mutation;
however, their roles in tumorigenesis require further investigation
(45).
IDH mutations may affect cellular metabolism,
epigenetics and other biochemical functions (13), but their roles in lipid metabolism
remain unknown. In the present study, the data indicated that
mutation of IDH1 aggravated FA-induced oxidative stress in HCT116
cells by reducing FAO and disrupting mitochondrial function. These
results are not only important for understanding the roles of IDH
mutation in tumour metabolic reprogramming, but also provide novel
insight into potential therapeutic strategies for the treatment of
cancers with IDH mutation.
Acknowledgements
Not applicable.
Funding
The present study was funded by the National Natural
Science Foundation of China (grant nos. 81572471 and 81370958), the
Natural Science Foundation of Shanxi Province China (grant no.
2016JM8100), the Booster Program of Xijing Hospital (grant no.
XJZT15ZL03), the Key Laboratory free exploration project (grant no.
CBSKL2015Z11) and the Youth Science Foundation of Xi'an Medical
College (grant no. 2015QN01).
Availability of data and materials
All data generated or analyzed during this study are
included in this published article.
Authors' contributions
SL performed the administration and cell culture and
revised the figures. CS and YG performed the PI staining,
MitoTracker staining, DCFH-DA staining and Bodipy staining. XG, YZ
and YY performed the determination of FAO. FZ and PH performed the
western blot analysis and RT-qPCR. WL, KC and JZ performed the
determination of MDA and 4-HNE and glucose consumption analysis. JY
and ZW contributed to the experimental design and drafted the
manuscript. All authors read and approved the final manuscript.
Ethics approval and consent to
participate
Not applicable.
Patient consent for publication
Not applicable.
Competing interests
The authors declare that they have no competing
interests.
References
|
1
|
Hanahan D and Weinberg RA: Hallmarks of
cancer: The next generation. Cell. 144:646–674. 2011. View Article : Google Scholar : PubMed/NCBI
|
|
2
|
Huang C and Freter C: Lipid metabolism,
apoptosis and cancer therapy. Int J Mol Sci. 16:924–949. 2015.
View Article : Google Scholar : PubMed/NCBI
|
|
3
|
Currie E, Schulze A, Zechner R, Walther TC
and Farese RV Jr: Cellular fatty acid metabolism and cancer. Cell
Metab. 18:153–161. 2013. View Article : Google Scholar : PubMed/NCBI
|
|
4
|
Carracedo A, Cantley LC and Pandolfi PP:
Cancer metabolism: Fatty acid oxidation in the limelight. Nat Rev
Cancer. 13:227–232. 2013. View
Article : Google Scholar : PubMed/NCBI
|
|
5
|
Tafani M, Sansone L, Limana F, Arcangeli
T, De Santis E, Polese M, Fini M and Russo MA: The interplay of
reactive oxygen species, hypoxia, inflammation, and sirtuins in
cancer initiation and progression. Oxid Med Cell Longev.
2016:39071472016. View Article : Google Scholar : PubMed/NCBI
|
|
6
|
Kim J, Kim J and Bae JS: ROS homeostasis
and metabolism: A critical liaison for cancer therapy. Exp Mol Med.
48:e2692016. View Article : Google Scholar : PubMed/NCBI
|
|
7
|
Reitman ZJ and Yan H: Isocitrate
dehydrogenase 1 and 2 mutations in cancer: Alterations at a
crossroads of cellular metabolism. J Natl Cancer Inst. 102:932–941.
2010. View Article : Google Scholar : PubMed/NCBI
|
|
8
|
Hirata M, Sasaki M, Cairns RA, Inoue S,
Puviindran V, Li WY, Snow BE, Jones LD, Wei Q, Sato S, et al:
Mutant IDH is sufficient to initiate enchondromatosis in mice. Proc
Natl Acad Sci USA. 112:2829–2834. 2015. View Article : Google Scholar : PubMed/NCBI
|
|
9
|
Sasaki M, Knobbe CB, Munger JC, Lind EF,
Brenner D, Brüstle A, Harris IS, Holmes R, Wakeham A, Haight J, et
al: IDH1(R132H) mutation increases murine haematopoietic
progenitors and alters epigenetics. Nature. 488:656–659. 2012.
View Article : Google Scholar : PubMed/NCBI
|
|
10
|
Cairns RA, Iqbal J, Lemonnier F, Kucuk C,
de Leval L, Jais JP, Parrens M, Martin A, Xerri L, Brousset P, et
al: IDH2 mutations are frequent in angioimmunoblastic T-cell
lymphoma. Blood. 119:1901–1903. 2012. View Article : Google Scholar : PubMed/NCBI
|
|
11
|
Xu X, Zhao J, Xu Z, Peng B, Huang Q,
Arnold E and Ding J: Structures of human cytosolic NADP-dependent
isocitrate dehydrogenase reveal a novel self-regulatory mechanism
of activity. J Biol Chem. 279:33946–33957. 2004. View Article : Google Scholar : PubMed/NCBI
|
|
12
|
Ye J, Gu Y, Zhang F, Zhao Y, Yuan Y, Hao
Z, Sheng Y, Li WY, Wakeham A, Cairns RA and Mak TW: IDH1 deficiency
attenuates gluconeogenesis in mouse liver by impairing amino acid
utilization. Proc Natl Acad Sci USA. 114:292–297. 2017. View Article : Google Scholar : PubMed/NCBI
|
|
13
|
Cohen AL, Holmen SL and Colman H: IDH1 and
IDH2 mutations in gliomas. Curr Neurol Neurosci Rep. 13:3452013.
View Article : Google Scholar : PubMed/NCBI
|
|
14
|
Ma S, Jiang B, Deng W, Gu ZK, Wu FZ, Li T,
Xia Y, Yang H, Ye D, Xiong Y and Guan KL: D-2-hydroxyglutarate is
essential for maintaining oncogenic property of mutant
IDH-containing cancer cells but dispensable for cell growth.
Oncotarget. 6:8606–8620. 2015. View Article : Google Scholar : PubMed/NCBI
|
|
15
|
Lazarow PB: The role of peroxisomes in
mammalian cellular metabolism. J Inherit Metab Dis. 10 (Suppl
1):S11–S22. 1987. View Article : Google Scholar
|
|
16
|
Shechter I, Dai P, Huo L and Guan G: IDH1
gene transcription is sterol regulated and activated by SREBP-1a
and SREBP-2 in human hepatoma HepG2 cells: Evidence that IDH1 may
regulate lipogenesis in hepatic cells. J Lipid Res. 44:2169–2180.
2003. View Article : Google Scholar : PubMed/NCBI
|
|
17
|
Bogdanovic E: IDH1, lipid metabolism and
cancer: Shedding new light on old ideas. Biochim Biophys Acta.
1850:1781–1785. 2015. View Article : Google Scholar : PubMed/NCBI
|
|
18
|
Li F, He X, Ye D, Lin Y, Yu H, Yao C,
Huang L, Zhang J, Wang F, Xu S, et al: NADP(+)-IDH mutations
promote hypersuccinylation that impairs mitochondria respiration
and induces apoptosis resistance. Mol Cell. 60:661–675. 2015.
View Article : Google Scholar : PubMed/NCBI
|
|
19
|
Jin G, Reitman ZJ, Duncan CG, Spasojevic
I, Gooden DM, Rasheed BA, Yang R, Lopez GY, He Y, McLendon RE, et
al: Disruption of wild-type IDH1 suppresses D-2-hydroxyglutarate
production in IDH1-mutated gliomas. Cancer Res. 73:496–501. 2013.
View Article : Google Scholar : PubMed/NCBI
|
|
20
|
Livak KJ and Schmittgen TD: Analysis of
relative gene expression data using real-time quantitative PCR and
the 2(-Delta Delta C(T)) method. Methods. 25:402–408. 2001.
View Article : Google Scholar : PubMed/NCBI
|
|
21
|
Fu X, Chin RM, Vergnes L, Hwang H, Deng G,
Xing Y, Pai MY, Li S, Ta L, Fazlollahi F, et al: 2-hydroxyglutarate
inhibits ATP synthase and mTOR signaling. Cell Metab. 22:508–515.
2015. View Article : Google Scholar : PubMed/NCBI
|
|
22
|
Gutiérrez AM, Reboredo GR and Catalá A:
Fatty acid profiles and lipid peroxidation of microsomes and
mitochondria from liver, heart and brain of Cairina moschata. Int J
Biochem Cell Biol. 34:605–612. 2002. View Article : Google Scholar : PubMed/NCBI
|
|
23
|
Rohn TT, Nelson LK, Waeg G and Quinn MT:
U-101033E (2,4-diaminopyrrolopyrimidine), a potent inhibitor of
membrane lipid peroxidation as assessed by the production of
4-hydroxynonenal, malondialdehyde, and 4-hydroxynonenal-protein
adducts. Biochem Pharmacol. 56:1371–1379. 1998. View Article : Google Scholar : PubMed/NCBI
|
|
24
|
Nguyen P, Leray V, Diez M, Serisier S, Le
Bloc'h J, Siliart B and Dumon H: Liver lipid metabolism. J Anim
Physiol Anim Nutr (Berl). 92:272–283. 2008. View Article : Google Scholar : PubMed/NCBI
|
|
25
|
Sabharwal SS and Schumacker PT:
Mitochondrial ROS in cancer: Initiators, amplifiers or an Achilles'
heel? Nat Rev Cancer. 14:709–721. 2014. View Article : Google Scholar : PubMed/NCBI
|
|
26
|
Glasauer A and Chandel NS: Targeting
antioxidants for cancer therapy. Biochem Pharmacol. 92:90–101.
2014. View Article : Google Scholar : PubMed/NCBI
|
|
27
|
Wu MS, Lien GS, Shen SC, Yang LY and Chen
YC: N-acetyl-L-cysteine enhances fisetin-induced cytotoxicity via
induction of ROS-independent apoptosis in human colonic cancer
cells. Molecular Carcinogenesis. 53 (Suppl 1):E119–E129. 2014.
View Article : Google Scholar : PubMed/NCBI
|
|
28
|
Pelicano H, Carney D and Huang P: ROS
stress in cancer cells and therapeutic implications. Drug Resist
Updat. 7:97–110. 2004. View Article : Google Scholar : PubMed/NCBI
|
|
29
|
Itsumi M, Inoue S, Elia AJ, Murakami K,
Sasaki M, Lind EF, Brenner D, Harris IS, Chio II, Afzal S, et al:
Idh1 protects murine hepatocytes from endotoxin-induced oxidative
stress by regulating the intracellular NADP(+)/NADPH ratio. Cell
Death Differ. 22:1837–1845. 2015. View Article : Google Scholar : PubMed/NCBI
|
|
30
|
Shi J, Zuo H, Ni L, Xia L, Zhao L, Gong M,
Nie D, Gong P, Cui D, Shi W and Chen J: An IDH1 mutation inhibits
growth of glioma cells via GSH depletion and ROS generation. Neurol
Sci. 35:839–845. 2014. View Article : Google Scholar : PubMed/NCBI
|
|
31
|
Lin H, Patel S, Affleck VS, Wilson I,
Turnbull DM, Joshi AR, Maxwell R and Stoll EA: Fatty acid oxidation
is required for the respiration and proliferation of malignant
glioma cells. Neuro Oncol. 19:43–54. 2017. View Article : Google Scholar : PubMed/NCBI
|
|
32
|
Staiger H, Staiger K, Stefan N, Wahl HG,
Machicao F, Kellerer M and Häring HU: Palmitate-induced
interleukin-6 expression in human coronary artery endothelial
cells. Diabetes. 53:3209–3216. 2004. View Article : Google Scholar : PubMed/NCBI
|
|
33
|
Palomer X, Pizarro-Delgado J, Barroso E
and Vázquez-Carrera M: Palmitic and oleic acid: The Yin and Yang of
fatty acids in type 2 diabetes mellitus. Trends Endocrinol Metab.
29:178–190. 2018. View Article : Google Scholar : PubMed/NCBI
|
|
34
|
Leamy AK, Egnatchik RA, Shiota M, Ivanova
PT, Myers DS, Brown HA and Young JD: Enhanced synthesis of
saturated phospholipids is associated with ER stress and
lipotoxicity in palmitate treated hepatic cells. J Lipid Res.
55:1478–1488. 2014. View Article : Google Scholar : PubMed/NCBI
|
|
35
|
Moravcová A, Červinková Z, Kučera O,
Mezera V, Rychtrmoc D and Lotková H: The effect of oleic and
palmitic acid on induction of steatosis and cytotoxicity on rat
hepatocytes in primary culture. Physiol Res. 64 (Suppl
5):S627–S636. 2015.PubMed/NCBI
|
|
36
|
Tirado-Vélez JM, Joumady I, Sáez-Benito A,
Cózar-Castellano I and Perdomo G: Inhibition of fatty acid
metabolism reduces human myeloma cells proliferation. PLoS One.
7:e464842012. View Article : Google Scholar : PubMed/NCBI
|
|
37
|
Handy DE and Loscalzo J: Redox regulation
of mitochondrial function. Antioxid Redox Signal. 16:1323–1367.
2012. View Article : Google Scholar : PubMed/NCBI
|
|
38
|
Quinlan CL, Treberg JR, Perevoshchikova
IV, Orr AL and Brand MD: Native rates of superoxide production from
multiple sites in isolated mitochondria measured using endogenous
reporters. Free Radic Biol Med. 53:1807–1817. 2012. View Article : Google Scholar : PubMed/NCBI
|
|
39
|
Fritz R, Bol J, Hebling U, Angermüller S,
Völkl A, Fahimi HD and Mueller S: Compartment-dependent management
of H(2)O(2) by peroxisomes. Free Radic Biol Med. 42:1119–1129.
2007. View Article : Google Scholar : PubMed/NCBI
|
|
40
|
Zangar RC, Davydov DR and Verma S:
Mechanisms that regulate production of reactive oxygen species by
cytochrome P450. Toxicol Appl Pharmacol. 199:316–331. 2004.
View Article : Google Scholar : PubMed/NCBI
|
|
41
|
Caro AA and Cederbaum AI: Role of
cytochrome P450 in phospholipase A2- and arachidonic acid-mediated
cytotoxicity. Free Radic Biol Med. 40:364–375. 2006. View Article : Google Scholar : PubMed/NCBI
|
|
42
|
McGarry JD and Brown NF: The mitochondrial
carnitine palmitoyltransferase system. From concept to molecular
analysis. Eur J Biochem. 244:1–14. 1997. View Article : Google Scholar : PubMed/NCBI
|
|
43
|
Palomer X, Salvadó L, Barroso E and
Vázquez-Carrera M: An overview of the crosstalk between
inflammatory processes and metabolic dysregulation during diabetic
cardiomyopathy. Int J Cardiol. 168:3160–3172. 2013. View Article : Google Scholar : PubMed/NCBI
|
|
44
|
Olson AL and Pessin JE: Structure,
function, and regulation of the mammalian facilitative glucose
transporter gene family. Annu Rev Nutr. 16:235–256. 1996.
View Article : Google Scholar : PubMed/NCBI
|
|
45
|
Young RM and Simon MC: Untuning the tumor
metabolic machine: HIFα: Pro-and anti-tumorigenic? Nat Med.
18:1024–1025. 2012. View Article : Google Scholar : PubMed/NCBI
|


