Introduction
Ewing sarcoma (ES) is a malignancy of the bones and
soft tissue that affects children and adolescents. Approximately
300 new cases are diagnosed each year in the USA, and it is the
second most common bone and soft tissue cancer behind osteosarcoma.
Current standard of care for ES patients includes control of all
sites of disease with surgery and/or radiation for localized
disease, usually combined with a multidrug chemotherapy regimen
consisting of doxorubicin, vincristine, cyclophosphamide, etoposide
and ifosfamide. Approximately two thirds of patients present with
localized disease at the time of diagnosis, and 5-year survival for
these patients is >70% (1). For
the one third of patients that present with metastatic disease at
the time of diagnosis or patients with relapse, 5-year survival
rates are below 30% (1).
Approximately 85% of all ES cases contain a balanced
chromosomal translocation [t(11;22)(q24;q12)] between the ES
breakpoint region 1 (EWSR1) gene and the Friend leukemia
integration site 1 (FLI1) gene (2). This fusion gene produces EWS-FLI1, a
true chimeric protein, with the amino-terminal portion being
derived from EWS and the carboxy-terminal portion being derived
from FLI1 (3,4). EWS is a member of the FET family of
DNA and RNA binding proteins, and FLI1 is a member of the E26
transformation specific (ETS) family of transcription factor.
Expression of EWS-FLI1 results in transformation (5–7) and
is a critical driver of ES malignancy as well as ES cell survival
(3,8,9).
EWS-FLI1 exhibits multiple functions in ES that
contribute to oncogenesis, including transcription and
post-transcriptional mRNA splicing. The DNA binding domain of FLI1
is present in the fusion and binds to DNA at ETS binding sites
containing GGAA motifs, while the EWS portion of the fusion protein
functions as a transcriptional activator (8,10).
Additionally, EWS-FLI1 also binds to RNA helicase A (RHA/DHX9), a
transcriptional coactivator, and localizes to promoter regions
containing the ETS binding GGAA motifs where it then acts as a
transcription factor and regulates gene expression (11). The transcriptional profile induced
by EWS-FLI1 promotes oncogenic cellular processes. EWS-FLI1 has
also been implicated in RNA processing events. EWS-FLI1 is capable
of directly binding to RNA and inhibiting the helicase function of
RHA, potentially altering RNA metabolism (12).
One of the first reports of EWS-FLI1 being actively
involved in splicing mechanisms demonstrated that EWS-FLI1
inhibited splicing from occurring by interfering with the activity
of serine-arginine splicing factors, thereby yielding alternatively
spliced transcripts (13).
EWS-FLI1 interacts with several spliceosome proteins including U1,
U2, U5, and U4/6, which play a role in 5′ splice site selection
(14–16). EWS-FLI1 expression induces
expression changes as well as isoform shifts of several genes where
it also differentially regulates gene expression including cyclin
D1 and TERT (16,17). The alternatively spliced isoforms
of these genes produced by EWS-FLI1 expression display enhanced
functional capabilities that increase the oncogenic potential of
the cell.
YK-4-279 (YK) is a small molecule that was
synthesized from a lead compound discovered by a surface plasmon
resonance screen for direct binding to EWS-FLI1 (18,19).
YK disrupts the interaction between EWS-FLI1 and RHA, inhibiting
transcription of target genes and restoring RHA helicase activity
(12,18). YK also blocks the interaction
between EWS-FLI1 and members of the spliceosome, indicating that
treatment with the compound also effectively targets the splicing
modulation of EWS-FLI1. Importantly, YK effectively inhibits
xenograft tumor growth in vivo (20). A synergistic relationship exists
between YK and the standard of care chemotherapeutic agent
vincristine in vitro, providing further evidence that this
drug has high clinical value in the context of ES (21). YK is a chiral molecule, with the
(S) enantiomer [(S)-YK] as the active enantiomer. YK is also
effective at inhibiting other members of the ETS family of
transcription factors such as ERG and ETV1 in prostate cancer
(22–24), and may be of clinical value in
other diseases such as neuroblastoma (25,26).
An analog of YK called TK216 is currently undergoing
a phase 1 clinical trial, and it appears likely that it will move
forward to phase 2 (27). With any
targeted agent, there is a possibility that resistance to the drug
may develop in patients. We developed an ES cell line which
acquired resistance to the (S) enantiomer of YK (referred to herein
as YK) with the goals of better understanding the biology of ES
cells after prolonged exposure to YK and identifying any
potentially targetable changes in cells which have acquired
resistance. In the future, tumor samples can be collected from
patients with relapse and compared to cell line data from this
manuscript. If a similar gene expression pattern is observed, the
YK resistant cell line generated here may become a useful tool to
study resistance mechanisms in this disease.
Materials and methods
Compounds
All compounds were dissolved in 100% DMSO
(ThermoFisher Scientific, Inc.). YK was obtained from AMRI Global.
Etoposide, imatinib, and vincristine were purchased from
Selleckchem. Doxorubicin and verapamil were purchased from
MilliporeSigma.
Cell culture and development of YK
resistant cell lines
A4573 sensitive and resistant (A4573-R) cell lines
were maintained in RPMI (Thermo Fisher Scientific, Inc.) with 10%
FBS (MilliporeSigma) and 10 mM HEPES (Thermo Fisher Scientific,
Inc.). TC71 sensitive and resistant (TC71-R) cell lines were
maintained in RPMI with 10% FBS. TC71-R cells were maintained in
flasks coated with collagen. Cells were maintained at 37°C in a
humidified atmosphere containing 5% CO2. All cells
tested negative for mycoplasma infection using MycoAlert Detection
kit (Lonza) according to manufacturer's protocol. A4573-R and
TC71-R cell lines were developed by adding YK to the growth media
at the concentration equivalent to the IC50 of sensitive
cells. As resistant cells regained normal growth rates in the
presence of YK, a new IC50 value was determined and the
concentration of YK in the growth media was increased to 90% of the
IC50 value. This was repeated until either a desirable
degree of resistance was achieved (A4573-R) or the cells could no
longer tolerate higher concentrations (TC71-R). All cell lines were
passaged upon reaching 75–85% confluence at a ratio of 1:10.
Resistant cell lines were passaged upon reaching 80–90% confluence
at a ratio of 1:3 while increasing YK concentration and at a ratio
of 1:5 once a stable YK concentration was reached.
Cell viability assays
Cell viability assays were performed using WST-1
(MilliporeSigma) according to the manufacturer's protocol. For 24-h
compound treatment, cells were plated in a 96-well plate at a
density of 10,000 cells/well for sensitive cells and 15,000
cells/well for resistant cells. Twenty-four-hour treatment was
performed for YK, doxorubicin, and etoposide in 100 µl volumes. For
48-h treatment, cells were plated in a 96-well plate at a density
of 5,000 cells/well for sensitive cells and 10,000 cells/well for
resistant cells. Forty-eight-hour treatment was performed for
vincristine, and imatinib in 200 µl volumes.
RNA isolation and RT-qPCR
RNA was isolated using RNeasy Mini kit (Qiagen)
according to the manufacturer's protocol. Reverse transcription
(RT) was performed to produce cDNA using SuperScript VILO cDNA
Synthesis Kit (Invitrogen; Thermo Fisher Scientific, Inc.)
according to the manufacturer's protocol. Quantitative PCR (qPCR)
was performed on a Roche LightCycler 480 II (Basel) using KiCqStart
SYBR Green qPCR ReadyMix (MilliporeSigma) per the manufacturer's
protocol. Primer pairs used for qPCR are listed in Table SI. A PCR profile of 95°C for 10
min (1 cycle), 95°C for 15 sec followed by 59°C for 30 sec followed
by 72°C for 40 sec (40 cycles), 95°C for 5 sec followed by 65°C for
1 min (1 cycle) was used. Data were analyzed for expression
relative to 18S rRNA using the 2−∆∆Cq method (28).
RNA sequencing and analysis
RNA was isolated using a RNeasy Mini kit (Qiagen)
according to manufacturer protocol. Sequencing libraries were
generated from total mRNA using a TruSeq RNA Library Prep kit
(Illumina) and sequenced on an Illumina HiSeq 2500 (Illumina).
Reads were trimmed and adapters were removed using
trimmomatic (29). Trimmed
reads were aligned using STAR to human genome version GRCh38 with
GENCODE annotation v27 (30).
Unstranded gene-wise counts were assessed using htseq-count
with the union parameter. Differential expression was assessed
using the R package edgeR (31).
Orthotopic mouse xenograft model
A4573 ×enograft tumors treated with YK were obtained
from a previously published mouse study (21). Tumor samples were flash frozen in
liquid nitrogen and stored at −80°C until time of protein
extraction for western blot analysis.
Cell lysis, SDS-PAGE, and western
blotting
Cells in culture were lysed using phospholysis
buffer (50 mM HEPES pH 7.9, 100 mM sodium chloride, 4.0 mM sodium
pyrophosphate, 10 mM EDTA, 10 mM sodium fluoride, and 1% Triton
X-100 v:v) containing 2.0 mM sodium vanadate, 1.0 mM PMSF, 4.0
µg/ml aprotinin, 4.0 µg/ml leupeptin, and 1.0 µg/ml calyculin A.
For tumor tissue, between 60–80 mg of frozen tissue was homogenized
with a mortar and pestle with liquid nitrogen base and lysed using
phospholysis buffer. Protein concentration was determined by
bicinchoninic (BCA) assay using Pierce BCA Protein assay reagents
(Thermo Fisher Scientific, Inc.) following the manufacturer's
protocol. Samples were denatured after adding the appropriate
volume of 5X Laemmli buffer. Concentrations and volume of samples
were equalized using 1X Laemmli buffer prior to electrophoresis.
Gels (12% polyacrylamide) were run at 150 V for 1.5–2 h. Protein
transfer to Immobilon-P PVDF membrane (MilliporeSigma) was
performed at 4°C either overnight at 330 mAmp or for 3 h at 1,000
mAmp. Membranes were blocked in 5% non-fat dry milk in 1X TTBS (20
mM Tris-HCl, pH 7.5, 150 mM NaCl, 0.5% Tween-20 v:v) for one hour
at room temperature. Three, five-minute washes were performed with
1X TTBS. Primary antibody was diluted 1:1,000 in 5% BSA
(MilliporeSigma) in 1X TTBS and incubated overnight at 4°C. Primary
antibodies used were anti-CD99 (ab75858, rabbit monoclonal, Abcam)
and anti-FLI1 (MBS301248, rabbit polyclonal, MyBioSource). Three,
five-minute washes were performed with 1X TTBS. Secondary rabbit
antibody (NA934-1ML, GE Healthcare) was diluted 1:5,000 in 5%
non-fat dry milk in 1X TTBS and incubated for one hour at room
temperature. HRP-conjugated actin antibody (sc-1615, Santa Cruz
Biotechnology, Inc.) was diluted 1:5,000 in 5% non-fat dry milk in
1X TTBS was incubated for 2 h at room temperature following
blocking. Blots were developed using Immobilon Western
Chemiluminescent HRP Substrate (MilliporeSigma) according to the
manufacturer's protocol. A Fujifilm LAS-3000 system was used to
detect chemiluminescence and image blots. To reblot membranes if
needed, antibodies were stripped using Restore Western Blot
Stripping Buffer (Thermo Fisher Scientific, Inc.) and the blotting
process was repeated no more than one time. Protein quantification
was performed using open source ImageJ software.
Statistical analyses
All statistical analyses were performed using
GraphPad Prism software, version 8.0.2 (GraphPad Software, Inc.).
All data are presented as the mean ± standard error of the mean.
IC50 values were determined by non-linear regression.
The statistical difference between IC50 values was
determined by Student's t-test or ordinary one-way analysis of
variance with a Tukey's multiple comparisons test. The statistical
difference between gene expression levels was determined by one-way
analysis of variance with a Tukey's multiple comparisons test.
Results
A4573 cells developed robust
resistance to YK
In order to investigate potential molecular
mechanisms that may lead to YK resistance in ES, we attempted to
develop two YK resistant ES cell lines (A4573-R and TC71-R). YK was
added to the growth media at the concentration equivalent to the
IC50 of A4573 (0.54 µM) and TC71 (0.88 µM) cell lines.
As resistant cells regained normal growth rates in the presence of
YK, a new IC50 value was determined and the
concentration of YK in the growth media was increased to 90% of the
new IC50 value. Both A4573-R and TC71-R were able to
tolerate increasing doses of YK until a desirable level of
resistance was achieved or higher YK concentrations could no longer
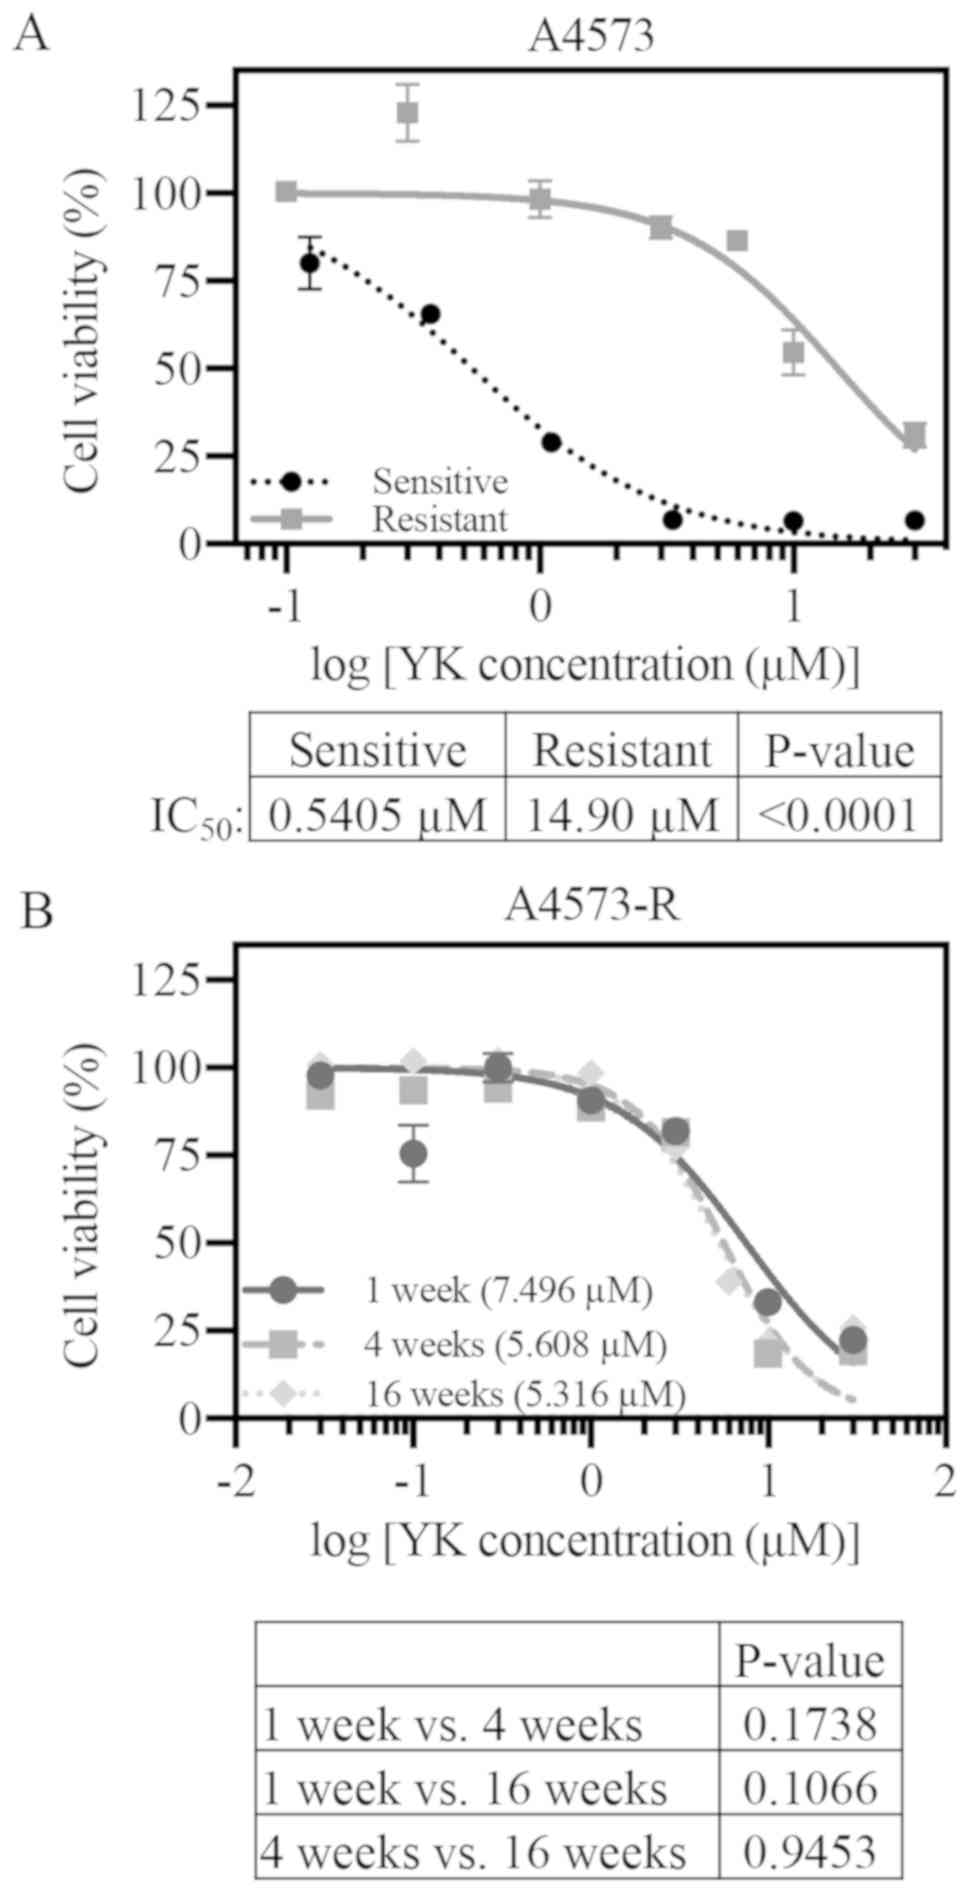
be tolerated (Fig. S1). A4573-R
was utilized as the primary cell line for all subsequent
experiments. After 550 days in culture with YK, A4573-R
demonstrated significant resistance to YK as compared to sensitive
A4573 cells (Fig. 1A, sensitive
IC50, 0.54 µM; resistant IC50, 14.9 µM;
P<0.0001). TC71 cells were less efficient in resistance
development. Even though they showed an initial 7-fold increase in
IC50 values (Fig. S1),
they did not maintain that level of resistance. By day 360 the
IC50 for TC71-R cells was 1.9 µM compared to 0.6 µM of
sensitive cells (Fig. S2). In
order to test if the resistance was maintained in the absence of YK
in A4573-R cells, viability assays were performed at various points
following YK removal from the media. We observed a decrease in
IC50 values over 16 weeks in drug-free media. However,
A4573-R cells still maintained significant resistance to YK
compared to sensitive cells (Fig.
1B).
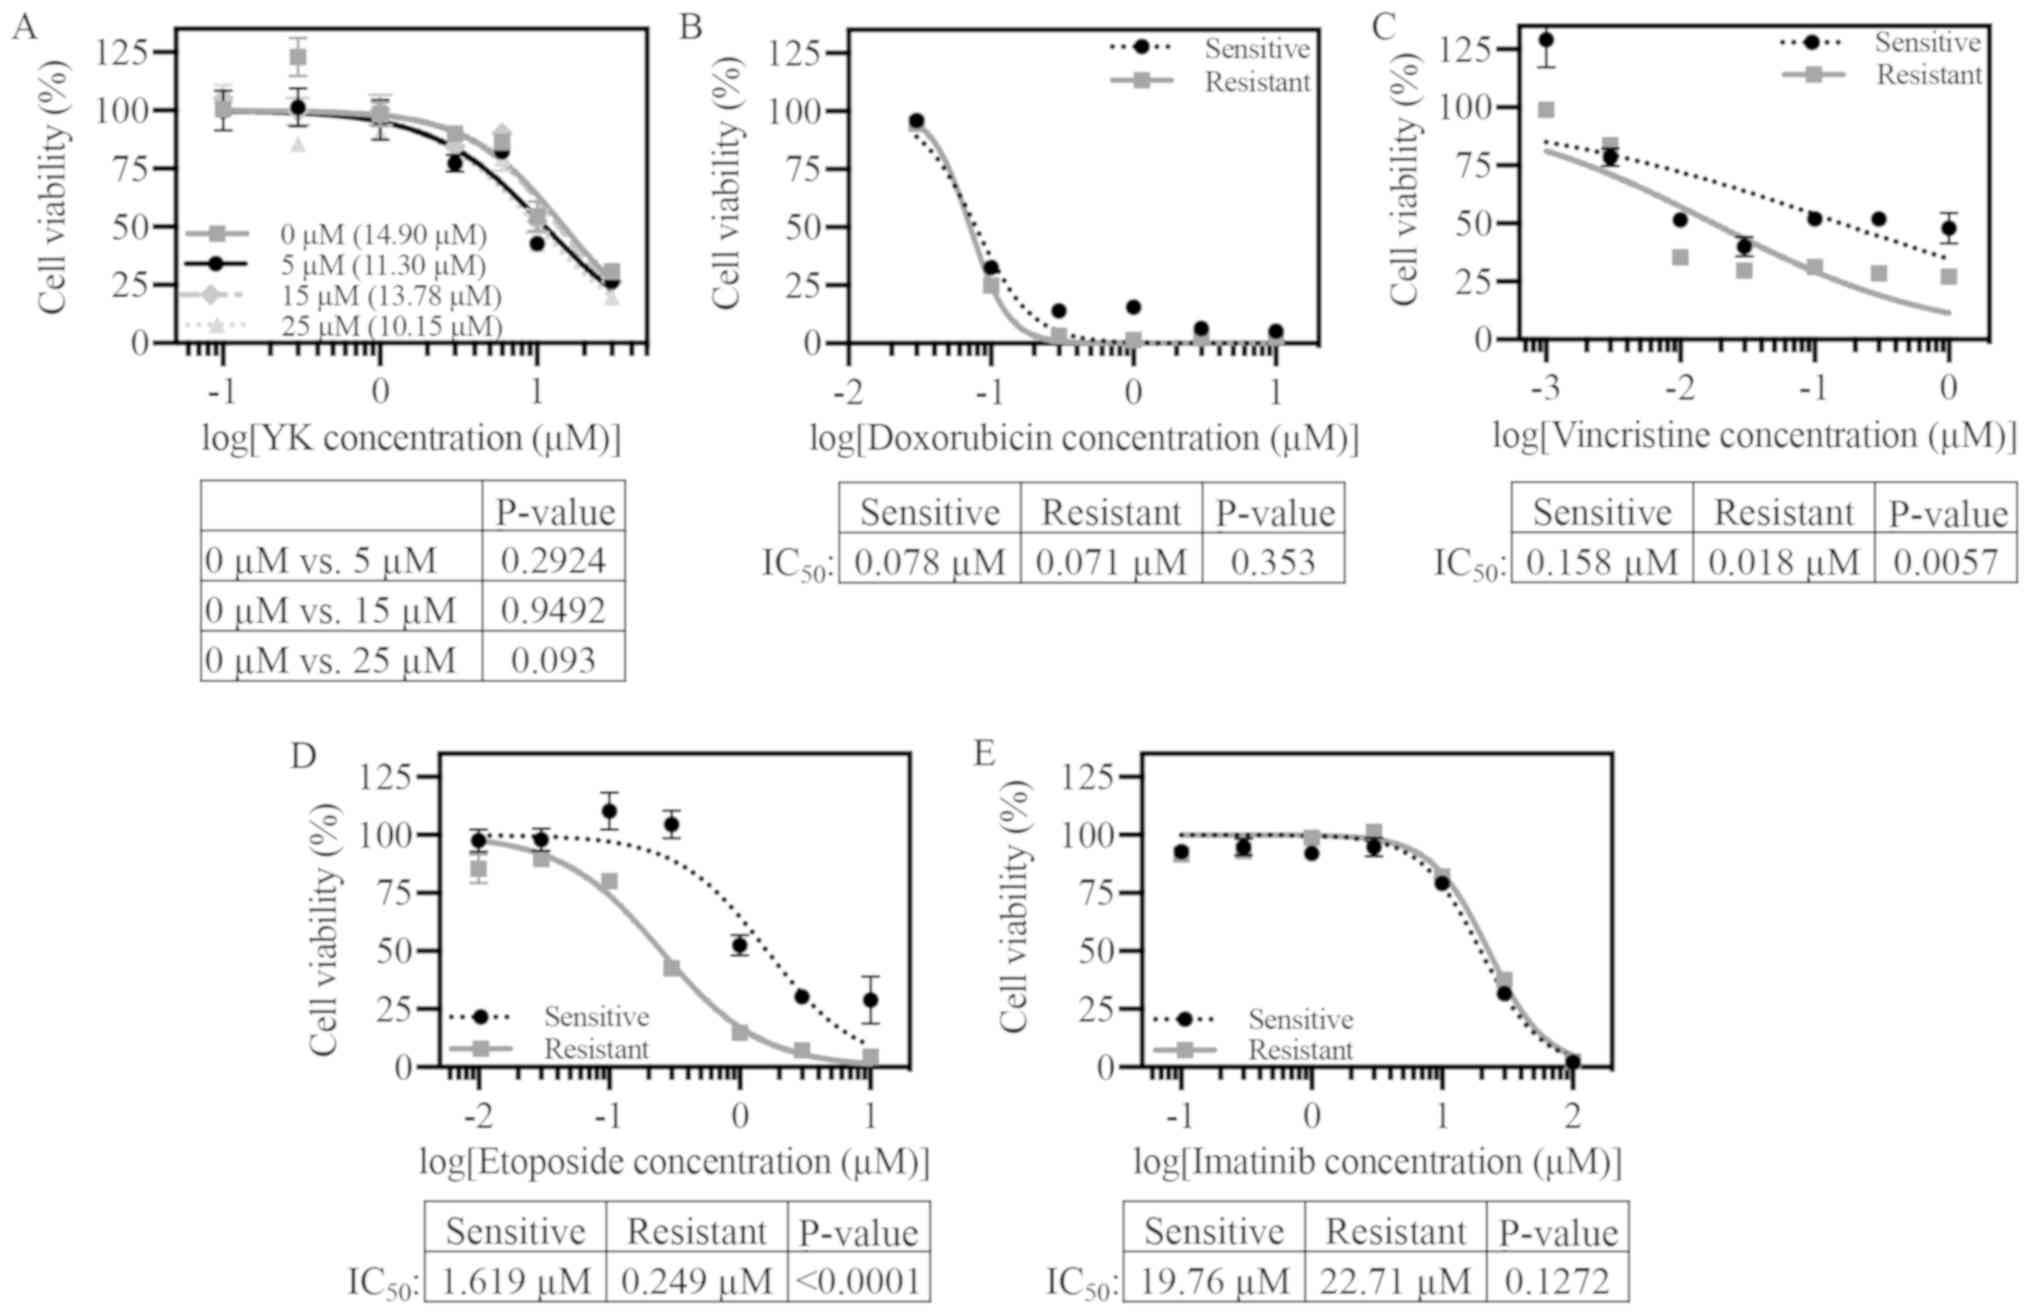
Resistance to YK is specific
A common mechanism for cancer cells to gain drug
resistance is increased expression and/or activity of efflux pumps,
such as P-glycoprotein, which can provide resistance to multiple
chemotherapeutic agents. In order to test if this mechanism was
involved in YK resistance, viability assays were first performed
using the efflux pump P-glycoprotein inhibitor verapamil in
combination with YK. A4573-R did not display heightened sensitivity
to YK with increasing verapamil treatment (Fig. 2A). This finding suggests that
A4573-R resistance to YK is unlikely a result of increased
P-glycoprotein efflux pump expression and/or activity. However,
there are a number of mechanisms through which cells may develop
multidrug resistance. Our data does not rule out these
possibilities which need to be investigated further. Further,
A4573-R cells did not exhibit cross resistance to three of the ES
standard of care drugs: Doxorubicin, vincristine, and etoposide
(Figs. 2B-D and S2B-D for TC71). There was even increased
sensitivity to etoposide and vincristine in the A4573-R cell line.
In a similar study characterizing ES resistance mechanisms to YK,
Lamhamedi-Cherradi et al reported that YK resistant cell
lines were cross resistant to the tyrosine kinase inhibitor
imatinib (32). In our study,
A4573-R cells did not display cross resistance to imatinib
(Fig. 2E).
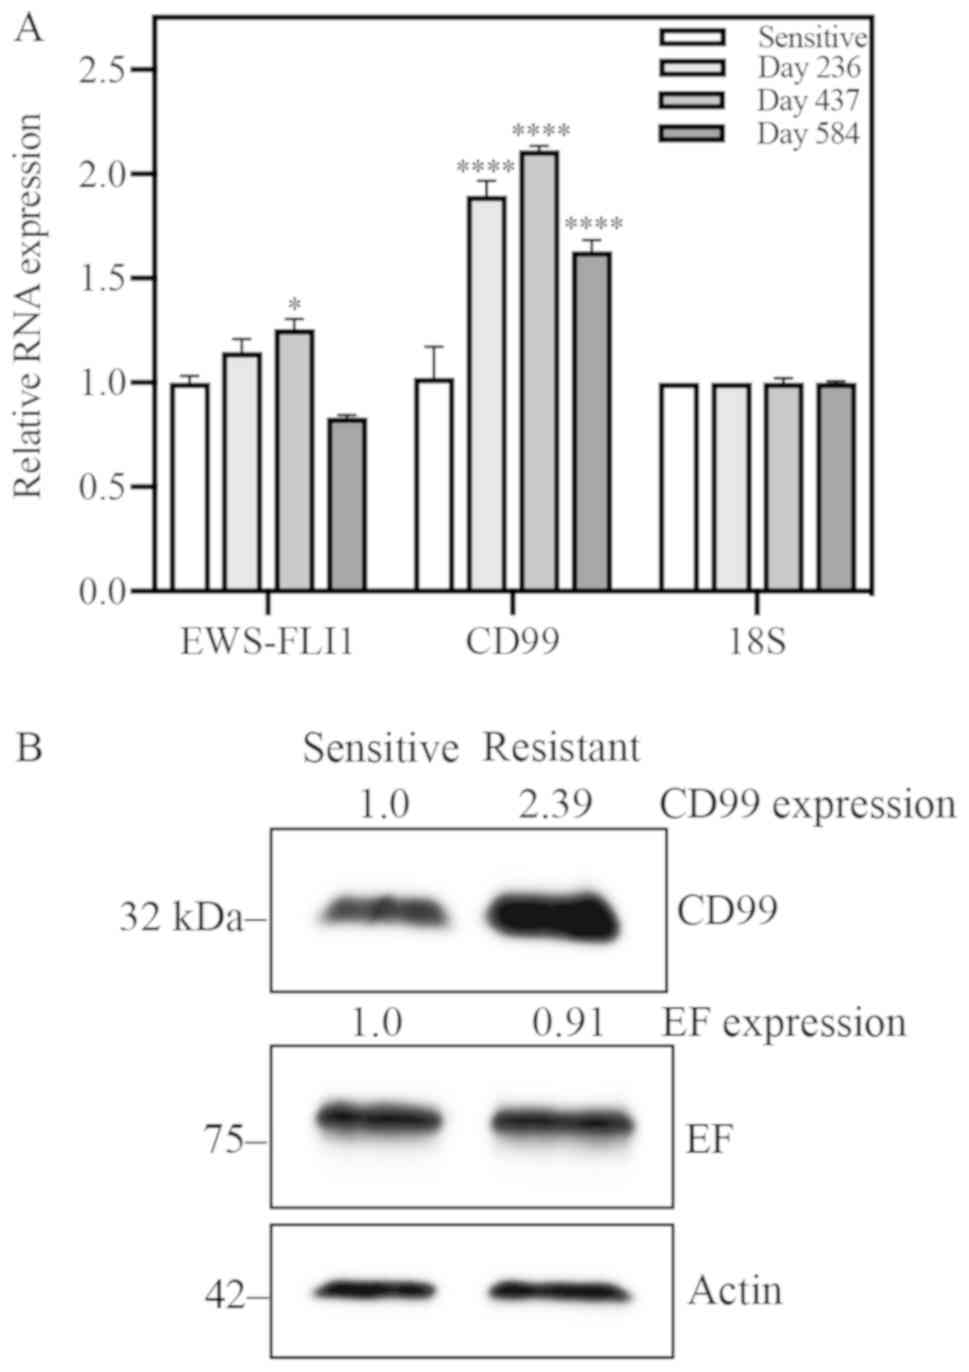
EWS-FLI1 expression is unchanged and
CD99 expression is increased in resistant cells
To address the possibility that resistance is due to
differential expression of EWS-FLI1, the target of YK, EWS-FLI1
expression was quantified at both the RNA and protein levels.
Expression of CD99 was also assessed, as this protein is important
in ES biology. RNA expression of these two genes was evaluated
longitudinally: At days 236, 437 and 584 for A4573-R (Fig. 3A), and at days 181, 342 and 489 for
TC71-R (Fig. S3A). CD99 RNA
expression was consistently increased significantly as compared to
sensitive cells at all time points evaluated. EWS-FLI1 RNA
expression was only significantly increased at day 437 for A4573
and day 342 for TC71, and returned to levels not significantly
different from sensitive cells at the following time point for both
cell lines. EWS-FLI1 and CD99 protein expression was also evaluated
in both cell lines. Relative to sensitive cells, CD99 protein
expression was increased nearly 2.4-fold in A4573-R cells (Fig. 3B). Similarly, TC71-R exhibited a
1.75-fold increase in CD99 protein expression (Fig. S3B). EWS-FLI1 protein expression
does not appear to be affected by acquisition of resistance.
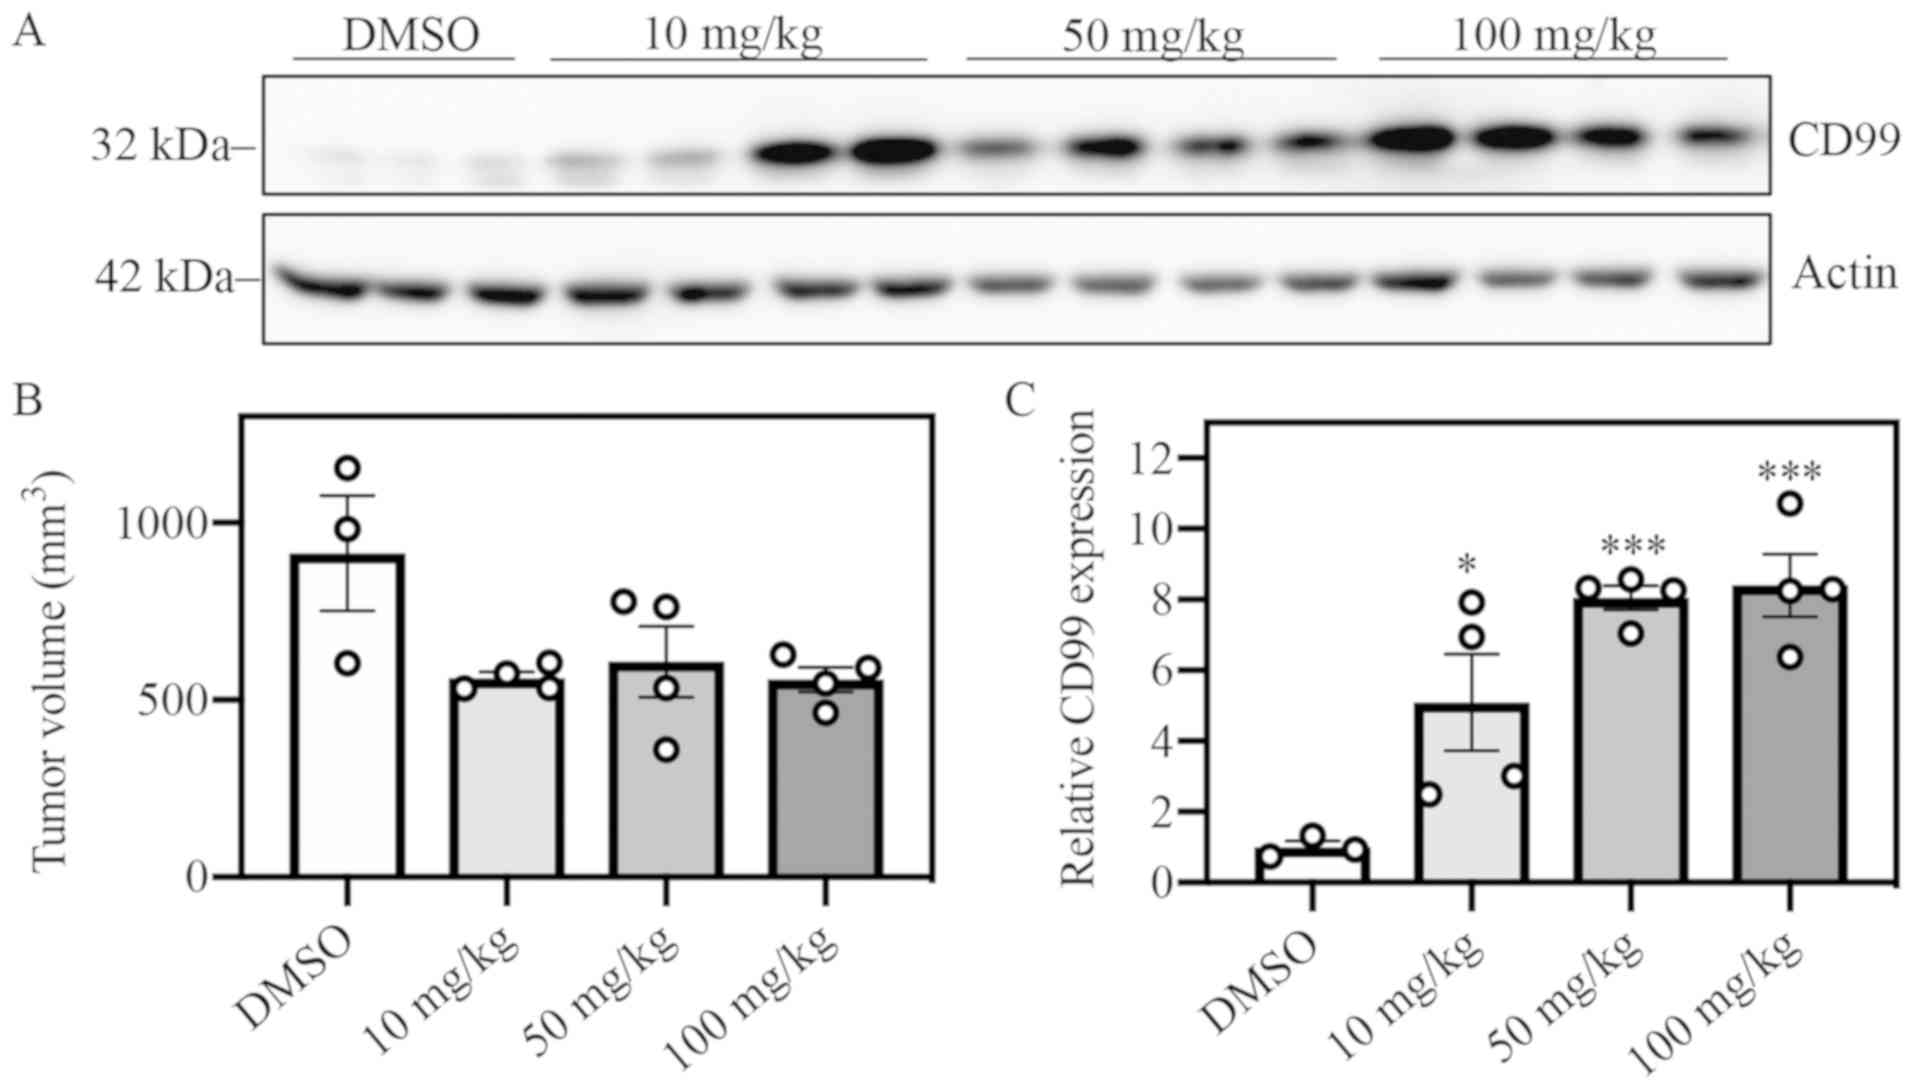
CD99 expression is elevated within
five days of YK treatment in vivo
Mice with sensitive A4573 ×enograft tumors were
treated with YK by IP injection daily over the course of five days.
DMSO was used as vehicle control, and three escalating dose groups
of YK were observed: 10, 50 and 100 mg/kg. All YK-treated groups
exhibited elevated levels of CD99 protein expression vs. the DMSO
control group (Fig. 4A and C).
Tumor volumes between the DMSO control and YK-treated groups did
not significantly differ after five days of treatment (Fig. 4B). These data suggest that
elevation of CD99 expression is an early effect of YK treatment and
subsequent development of resistance. We tried to inhibit CD99
expression by siRNA and perform drug sensitivity studies in
resistant cells but we could not achieve good reduction in protein
levels. Since inhibition of CD99 results in death of ES cells, this
finding was not surprising.
RNA sequencing revealed candidate
genes involved in resistance mechanisms and expression was
validated by RT-qPCR
RNA sequencing of A4573 and TC71 sensitive and
resistant cells was performed on day 236 and 181 of culture
respectively to identify differentially expressed genes. For each
cell line, data sets were filtered for genes with at least a 2-fold
change in expression. The A4573 and TC71 filtered data sets were
compared to determine the genes with expression changes that were
shared between the two cell lines. From this pool of 152 genes
(Table SII), a second filter of
4-fold change in expression was applied in order to narrow down
potential candidates. Expression of these candidate genes was
evaluated in resistant cells. Three upregulated and three
downregulated genes were validated in triplicate by RT-qPCR in both
A4573 (Fig. 5) and TC71 (Fig. S4).
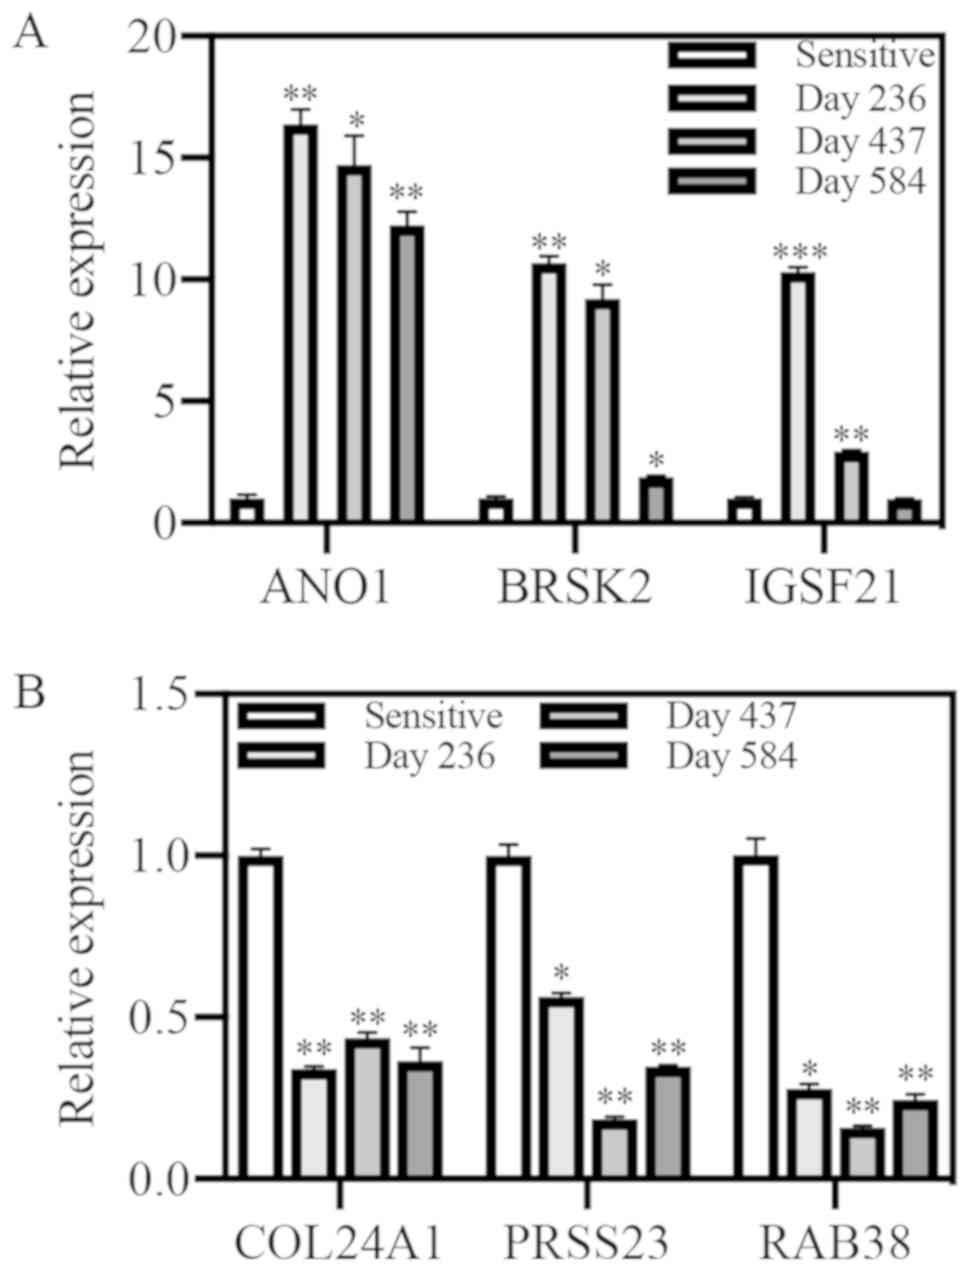 | Figure 5.Quantitative PCR for upregulated
genes identified through RNA sequencing in A4573 cells. Relative
expression was evaluated at multiple time points in resistant cells
compared with sensitive cells. (A) ANO1, BRSK2, and IGSF21 were
upregulated. (B) COL24A1, PRSS23 and RAB38 were downregulated.
*P<0.05, **P<0.01 and ***P<0.001 vs. sensitive. ANO1,
anoctamin 1; BRSK2, BR serine/threonine kinase 2; IGSF21,
immunoglobulin superfamily member 21; COL24A1, collagen type XXIV
alpha 1 chain; PRSS23, serine protease 23; RAB38, Ras-related
protein Rab-38. |
The three top upregulated genes were ANO1, BRSK2,
and IGSF21, and the three top downregulated genes were COL24A1,
PRSS23, and RAB38. Expression of all three candidate upregulated
genes, ANO1, BRSK2, and IGSF21, showed significant upregulation by
qPCR at the time of RNA sequencing in A4573-R cells (Fig. 5A). High ANO1 expression was
maintained in both cell lines over time. Expression of all three
candidate down-regulated genes, COL24A1, PRSS23, and RAB38,
displayed significant down-regulation at all timepoints in A4573-R
cells as compared to sensitive cell expression (Fig. 5B). Further mechanistic
investigation of these gene expression changes is needed.
Discussion
This study created cell lines that are resistant to
YK for purposes of planning future combinatorial studies to avoid
single agent resistance. In this body of work, we attempted to
establish resistance to the EWS-FLI1 inhibitor (S)-YK in two of the
commonly used ES cell lines A4573 and TC71. These two cell lines
were chosen because they each harbor a different version of the
EWS-FLI1 fusion; TC71 has a type 1 fusion and A4573 has a type 3
fusion. The cell line A4573 developed sustained, and specific
resistance to YK over time to levels that was consistent with
published resistance models (33).
However, the resistance in cell line TC71 was not as stable and
over a 1-year period of time did not show a significant resistant
phenotype. Future work will also include combinatorial testing with
compounds known to be synergistic with YK (21).
No cross-resistance was observed to any of the
current standard-of-care drugs that were tested. Also, resistant
cells did not become more sensitive to YK when treated in
combination with the p-glycoprotein inhibitor verapamil, indicating
that the efflux pump p-glycoprotein, which is often associated with
multidrug resistance mechanisms, is not the main driver of
resistance in A4573-R cells. Cancer cells can acquire multidrug
resistance through multiple mechanisms. Measurement of YK
concentration within A4573-R cells by mass spectrometry and
comparing it to sensitive A4573 cells may provide evidence for
augmented drug metabolism or accelerated efflux of the drug by an
alternate pathway. A4573-R cells exhibited an increased sensitivity
to the standard-of-care drugs etoposide and vincristine. We did not
observe the same phenotype in TC71-R cells. Since YK and
vincristine show synergy (21),
A4573-R cells that have stronger and sustainable YK resistance may
also have acquired better sensitivity to etoposide and vincristine
compared to the TC71-R cells that had a weaker YK resistance.
Alternatively, the observed difference may be an artifact of
selection during development of resistance and maintenance.
An avenue that was not explored through this study
was the possibility that resistance emerged due to a mutation in
EWS-FLI1. Sequencing of both sensitive and resistant cells could be
performed to evaluate EWS-FLI1 mutation status. Any mutation
identified would need to be validated by re-development of
resistant lines, as the current cell lines have been in culture
with YK for over a year and it would be impossible to decipher if
resistance arose due to the mutation. In the developed resistant
lines, YK viability assays could be performed in conjunction with
DNA collection to determine if the acquisition of resistance
coincides with the mutation presence. Any mutations in EWS-FLI1
that arise simultaneously with acquired resistance may be
associated with binding site of YK, and could help shed light on
the location of YK binding to the EWS-FLI1 fusion protein.
There is another publication characterizing ES
resistance to YK. While resistance to YK was established,
Lamhamedi-Cherradi et al found that resistant cells became
cross-resistant to the tyrosine kinase inhibitor imatinib (32). Despite creating a resistant cell
line with a similar level of resistance to YK (~28-fold increase),
the YK resistant cells developed in this body of work did not
demonstrate cross resistance to imatinib. One reason this
difference might have occurred is the method by which the cells
were made resistant. In the previous study, sensitive cells were
exposed to a high 3 µM concentration of YK and subsequently
maintained at that concentration for an unspecified amount of time.
In this study, the concentration of YK in the growth media was
gradually increased over time as tolerated by the cells, and
maintained in culture for >1 year. This distinct difference in
development of resistant cell lines may be inadvertently
highlighting the differences between cells that are intrinsically
resistant vs. those that acquire resistance. In the context of a
tumor, cells with intrinsic resistance exist, and more cells will
acquire resistance as treatment is sustained (34). By exposing ES cells to especially
high concentrations of YK, Lamhamedi-Cherradi et al
(32) created clonal populations
of cells, which presumably harbor intrinsic resistance mechanisms
to YK. One of those mechanisms potentially also contributed to
cross-resistance of imatinib. In this study, gradually increasing
the concentration of YK present created resistant populations of
cells by allowing cells to acquire resistance to the drug. While
there may be a proportion of cells in this resistant population
that possess an intrinsic resistance to imatinib, the data
presented here do not demonstrate that possession of this
capability is necessary for resistance to YK. However, resistance
to imatinib should be an important consideration when determining
revised treatment strategies in eventual cases of TK216 resistance
in patients.
Even though the IC50 values were
gradually increasing, resistant A4573 cells were able to maintain
the phenotype in the absence of YK for up to 16 weeks. This signals
that the resistant population acquired changes that facilitated
resistance to but were independent of YK treatment. In other words,
the mechanisms driving YK resistance became fixed cellular
processes after an extended period of exposure to YK. These data
and the current structure of treatment highlight the necessity of
understanding the driving mechanisms of resistance. An important
caveat to note is that resistant cells were in culture with YK for
over one year at the time the washout experiment began. This is a
long period of time for cells and may not accurately reflect
changes that occur in humans with ES. Future experiments are
required to determine if this phenomenon exists in cells exposed to
YK for shorter periods of time.
CD99 unexpectedly emerged as an upregulated protein
in YK resistant cells. CD99 RNA and protein expression was elevated
in both the A4573-R and TC71-R cell lines. A4573 ×enograft tumors
in vivo exhibited elevated CD99 expression after just five
days of YK treatment with no differences in tumor volume. This
five-day evaluation of xenograft tumors was done as an early phase
pharmacodynamic marker in a previous study (21). We do not believe that these
xenograft tumors are resistant to YK yet. We have performed several
mouse xenograft studies with ES cell lines (including A4573) and YK
(18,20). In control groups, the tumor volume
grew exponentially but in the YK treatment groups the tumor volume
stayed close to unchanged. Through histopathological analysis we
observed increased apoptosis, reduced mitosis, and reduced
expression of EWS-FLI1 target genes in these tumors (20). Therefore, there was a clear and
significant drug effect on tumor growth. Lack of tumor shrinkage
was primarily due to the relatively poor pharmacokinetic profile of
YK. When we performed similar studies in rats with ES cell line
xenografts, we observed tumor shrinkage because we were able to
deliver the drug through a continuous IV infusion. In mouse
studies, IP or IV bolus injections do not deliver enough drug to
maintain serum levels that would cause tumor shrinkage. The
patients in the current clinical trial are receiving the drug with
continuous IV injection for 14–21 days.
There is a correlation between EWS-FLI1 expression
and CD99 in ES cell lines. The CD99 promoter contains a consensus
ets binding site, which shows EWS-FLI1 binding by ChIP assay
(35). There is evidence that
EWS-FLI1 may induce CD99 expression (36–38).
Therefore, one might expect to see reduced CD99 expression
following inhibition of EWS-FLI1 activity by YK. However, the
observed increase in CD99 expression in A4573-R cells suggest a
compensation mechanism, which further highlights the biological
importance of CD99 for ES cell survival.
Increased CD99 expression has been reported
previously in a resistant population of cells, which poses an
intriguing question surrounding the role of CD99 in resistance
mechanisms. Aldegaither and colleagues developed a squamous cell
carcinoma line that was resistant to antibody-dependent
cell-mediated cytotoxicity (ADCC) (39). Under ADCC conditions, targeting
antibodies direct binding of effector natural killer cells to
cancer cells to create an immune synapse. Upon effector cell
binding to the cancer cells through the target antibody, the
effector cells release perforins and granzymes, which cause
apoptosis to occur in the cancer cell. In their model system, CD99
expression is increased 16-fold in the ADCC resistant cells. Their
study did not explore the role of CD99 in maintenance of the
resistant phenotype. This study did not explore the mechanisms
through which YK treatment induced high CD99 expression. It would
be intriguing to assess if CD99 is playing a role in YK resistance
specifically or has a role in more general resistance mechanisms.
Cell lines could be established that are resistant to other drugs
and CD99 expression could be evaluated. If CD99 expression is
elevated, this would suggest that a role for CD99 exists in a
broader context of resistance.
RNA sequencing of resistant and sensitive cells
revealed six top candidate genes that may be involved in YK
resistance mechanisms, and their expression was validated in both
A4573 and TC71 resistant cell lines by qPCR. The top upregulated
genes are the calcium activated chloride channel ANO1, the
serine/threonine kinase BRSK2, and the immunoglobulin family member
IGSF21. The top downregulated genes are the collagen COL24A1, the
serine protease PRSS23, and the Ras-related GTPase RAB38. The
threshold for candidate genes to validate by qPCR was set high at a
4-fold change cut-off mark. These six genes consistently exhibited
expected expression levels in resistant cells at all points in time
evaluated for A4573, with the one exception being IGSF21 at the
latest time point. There were some inconsistencies in TC71-R
expression of BRSK2 and PRSS23. For BRSK2, gene expression did not
match what was observed by RNA sequencing, but expression increased
as time progressed. For PRSS23, expression was not downregulated at
any of the timepoints beyond RNA sequencing at day 181. This may be
due to a change in culture conditions following RNA collection for
RNA sequencing-cells were not thriving on plastic and were
transferred to culture in collagen-coated flasks for all points
forward. It may be possible that of the 149 genes returned after
the initial cut off of 2-fold change would have been validated by
qPCR and are important in resistance mechanisms. A larger qPCR
screen would be required to make this determination.
Of the validated candidate genes, one that could be
interesting to investigate further would be ANO1. ANO1 is utilized
as a diagnostic marker in gastrointestinal stromal tumors, but its
functional role is still under investigation (40–42).
Interestingly, ANO1 has been functionally associated with c-kit,
which was one of the genes identified by Lamhamedi-Cherradi et al
(32)to be upregulated in their YK
resistant cells (43). Given that
CD99 is a critical player in resistance mechanisms and has been
associated with ion channels previously (44), it would be interesting to see if
ANO1 is associated with CD99-dependent YK resistance in ES cells.
Knockdown of ANO1 by siRNA in resistant cells and subsequent
assessment of sensitivity to YK would need to be performed to
determine if this protein is also important in YK resistance
mechanisms.
We developed a model of YK resistance in A4573 ES
cells in culture. The cell line maintained a stable resistance that
was not consistent in both cell lines, so this opens future
opportunities for mechanistic investigation. Several genes were
identified that may have a role in resistance mechanisms. Future
studies are needed to determine their significance, particularly
ANO1. Overall, this study contributes new information regarding the
biology of ES and may lead to a better understanding of CD99.
Supplementary Material
Supporting Data
Acknowledgements
Not applicable.
Funding
No funding was received.
Availability of data and materials
The datasets used and/or analyzed during the current
study are available from the corresponding author on reasonable
request.
Authors' contributions
AÜ and EC conceived and designed the present study.
EC, SH, DA, GG, JP, MKB, SS and SHH performed the experiments. EC,
SH, DA, GG, SS, HÇ, JT and AÜ analyzed the data. SS and HÇ
contributed reagents/technical expertise/materials/intellectual
discussion/analysis tools. EC and AÜ wrote the manuscript. All
authors reviewed, edited and approved the manuscript.
Ethics approval and consent to
participate
Not applicable.
Patient consent for publication
Not applicable.
Competing interests
United States Patent and Trademark Office awarded a
patent for YK-4-279 to Georgetown University, inventors include AÜ
and JAT (Patent no. 8,232,310). The other authors declare that they
have no competing interests.
References
|
1
|
Balamuth NJ and Womer RB: Ewing's sarcoma.
Lancet Oncol. 11:184–192. 2010. View Article : Google Scholar : PubMed/NCBI
|
|
2
|
Aurias A, Rimbaut C, Buffe D, Dubousset J
and Mazabraud A: Chromosomal translocations in Ewing's sarcoma. N
Engl J Med. 309:496–498. 1983. View Article : Google Scholar
|
|
3
|
Delattre O, Zucman J, Plougastel B,
Desmaze C, Melot T, Peter M, Kovar H, Joubert I, de Jong P, Rouleau
G, et al: Gene fusion with an ETS DNA-binding domain caused by
chromosome translocation in human tumours. Nature. 359:162–165.
1992. View
Article : Google Scholar : PubMed/NCBI
|
|
4
|
Delattre O, Zucman J, Melot T, Garau XS,
Zucker JM, Lenoir GM, Ambros PF, Sheer D, Turc-Carel C, Triche TJ,
et al: The Ewing family of tumors-a subgroup of small-round-cell
tumors defined by specific chimeric transcripts. N Engl J Med.
331:294–299. 1994. View Article : Google Scholar : PubMed/NCBI
|
|
5
|
May WA, Gishizky ML, Lessnick SL, Lunsford
LB, Lewis BC, Delattre O, Zucman J, Thomas G and Denny CT: Ewing
sarcoma 11;22 translocation produces a chimeric transcription
factor that requires the DNA-binding domain encoded by FLI1 for
transformation. Proc Natl Acad Sci USA. 90:5752–5756. 1993.
View Article : Google Scholar : PubMed/NCBI
|
|
6
|
Jaishankar S, Zhang J, Roussel MF and
Baker SJ: Transforming activity of EWS/FLI is not strictly
dependent upon DNA-binding activity. Oncogene. 18:5592–5597. 1999.
View Article : Google Scholar : PubMed/NCBI
|
|
7
|
Chan D, Wilson TJ, Xu D, Cowdery HE, Sanij
E, Hertzog PJ and Kola I: Transformation induced by Ewing's sarcoma
associated EWS/FLI-1 is suppressed by KRAB/FLI-1. Br J Cancer.
88:137–145. 2003. View Article : Google Scholar : PubMed/NCBI
|
|
8
|
May WA, Lessnick SL, Braun BS, Klemsz M,
Lewis BC, Lunsford LB, Hromas R and Denny CT: The Ewing's sarcoma
EWS/FLI-1 fusion gene encodes a more potent transcriptional
activator and is a more powerful transforming gene than FLI-1. Mol
Cell Biol. 13:7393–7398. 1993. View Article : Google Scholar : PubMed/NCBI
|
|
9
|
Ramakrishnan R, Fujimura Y, Zou JP, Liu F,
Lee L, Rao VN and Reddy ES: Role of protein-protein interactions in
the antiapoptotic function of EWS-Fli-1. Oncogene. 23:7087–7094.
2004. View Article : Google Scholar : PubMed/NCBI
|
|
10
|
Ohno T, Rao VN and Reddy ES: EWS/Fli-1
chimeric protein is a transcriptional activator. Cancer Res.
53:5859–5863. 1993.PubMed/NCBI
|
|
11
|
Toretsky JA, Erkizan V, Levenson A, Abaan
OD, Parvin JD, Cripe TP, Rice AM, Lee SB and Uren A: Oncoprotein
EWS-FLI1 activity is enhanced by RNA helicase A. Cancer Res.
66:5574–5581. 2006. View Article : Google Scholar : PubMed/NCBI
|
|
12
|
Erkizan HV, Schneider JA, Sajwan K, Graham
GT, Griffin B, Chasovskikh S, Youbi SE, Kallarakal A, Chruszcz M,
Padmanabhan R, et al: RNA helicase A activity is inhibited by
oncogenic transcription factor EWS-FLI1. Nucleic Acids Res.
43:1069–1080. 2015. View Article : Google Scholar : PubMed/NCBI
|
|
13
|
Yang L, Chansky HA and Hickstein DD:
EWS.Fli-1 fusion protein interacts with hyperphosphorylated RNA
polymerase II and interferes with serine-arginine protein-mediated
RNA splicing. J Biol Chem. 275:37612–37618. 2000. View Article : Google Scholar : PubMed/NCBI
|
|
14
|
Knoop LL and Baker SJ: The splicing factor
U1C represses EWS/FLI-mediated transactivation. J Biol Chem.
275:24865–24871. 2000. View Article : Google Scholar : PubMed/NCBI
|
|
15
|
Knoop LL and Baker SJ: EWS/FLI alters
5′-splice site selection. J Biol Chem. 276:22317–22322. 2001.
View Article : Google Scholar : PubMed/NCBI
|
|
16
|
Selvanathan SP, Graham GT, Erkizan HV,
Dirksen U, Natarajan TG, Dakic A, Yu S, Liu X, Paulsen MT, Ljungman
ME, et al: Oncogenic fusion protein EWS-FLI1 is a network hub that
regulates alternative splicing. Proc Natl Acad Sci USA.
112:E1307–E1316. 2015. View Article : Google Scholar : PubMed/NCBI
|
|
17
|
Sanchez G, Bittencourt D, Laud K, Barbier
J, Delattre O, Auboeuf D and Dutertre M: Alteration of cyclin D1
transcript elongation by a mutated transcription factor
up-regulates the oncogenic D1b splice isoform in cancer. Proc Natl
Acad Sci USA. 105:6004–6009. 2008. View Article : Google Scholar : PubMed/NCBI
|
|
18
|
Erkizan HV, Kong Y, Merchant M,
Schlottmann S, Barber-Rotenberg JS, Yuan L, Abaan OD, Chou TH,
Dakshanamurthy S, Brown ML, et al: A small molecule blocking
oncogenic protein EWS-FLI1 interaction with RNA helicase A inhibits
growth of Ewing's sarcoma. Nat Med. 15:750–756. 2009. View Article : Google Scholar : PubMed/NCBI
|
|
19
|
Barber-Rotenberg JS, Selvanathan SP, Kong
Y, Erkizan HV, Snyder TM, Hong SP, Kobs CL, South NL, Summer S,
Monroe PJ, et al: Single enantiomer of YK-4-279 demonstrates
specificity in targeting the oncogene EWS-FLI1. Oncotarget.
3:172–182. 2012. View Article : Google Scholar : PubMed/NCBI
|
|
20
|
Hong SH, Youbi SE, Hong SP, Kallakury B,
Monroe P, Erkizan HV, Barber-Rotenberg JS, Houghton P, Üren A and
Toretsky JA: Pharmacokinetic modeling optimizes inhibition of the
‘undruggable’ EWS-FLI1 transcription factor in Ewing sarcoma.
Oncotarget. 5:338–350. 2014. View Article : Google Scholar : PubMed/NCBI
|
|
21
|
Zöllner SK, Selvanathan SP, Graham GT,
Commins RMT, Hong SH, Moseley E, Parks S, Haladyna JN, Erkizan HV,
Dirksen U, et al: Inhibition of the oncogenic fusion protein
EWS-FLI1 causes G2-M cell cycle arrest and enhanced
vincristine sensitivity in Ewing's sarcoma. Sci Signal. 10(pii):
eaam84292017. View Article : Google Scholar : PubMed/NCBI
|
|
22
|
Rahim S, Beauchamp EM, Kong Y, Brown ML,
Toretsky JA and Üren A: YK-4-279 inhibits ERG and ETV1 mediated
prostate cancer cell invasion. PLoS One. 6:e193432011. View Article : Google Scholar : PubMed/NCBI
|
|
23
|
Rahim S, Minas T, Hong SH, Justvig S,
Çelik H, Kont YS, Han J, Kallarakal AT, Kong Y, Rudek MA, et al: A
small molecule inhibitor of ETV1, YK-4-279, prevents prostate
cancer growth and metastasis in a mouse Xenograft model. PLoS One.
9:e1142602014. View Article : Google Scholar : PubMed/NCBI
|
|
24
|
Winters B, Brown L, Coleman I, Nguyen H,
Minas TZ, Kollath L, Vasioukhin V, Nelson P, Corey E, Üren A and
Morrissey C: Inhibition of ERG activity in patient-derived prostate
cancer Xenografts by YK-4-279. Anticancer Res. 37:3385–3396.
2017.PubMed/NCBI
|
|
25
|
Sun W, Rojas Y, Wang H, Yu Y, Wang Y, Chen
Z, Rajapakshe K, Xu X, Huang W, Agarwal S, et al: EWS-FLI1 and RNA
helicase A interaction inhibitor YK-4-279 inhibits growth of
neuroblastoma. Oncotarget. 8:94780–94792. 2017. View Article : Google Scholar : PubMed/NCBI
|
|
26
|
Kollareddy M, Sherrard A, Park JH, Szemes
M, Gallacher K, Melegh Z, Oltean S, Michaelis M, Cinatl J Jr, Kaidi
A and Malik K: The small molecule inhibitor YK-4-279 disrupts
mitotic progression of neuroblastoma cells, overcomes drug
resistance and synergizes with inhibitors of mitosis. Cancer Lett.
403:74–85. 2017. View Article : Google Scholar : PubMed/NCBI
|
|
27
|
TK216 in patients with relapsed or
refractory Ewing sarcoma. NCT02657005. https://clinicaltrials.gov/ct2/show/NCT02657005January
15–2016
|
|
28
|
Livak KJ and Schmittgen TD: Analysis of
relative gene expression data using real-time quantitative PCR and
the 2(-Delta Delta C(T)) method. Methods. 25:402–408. 2001.
View Article : Google Scholar : PubMed/NCBI
|
|
29
|
Bolger AM, Lohse M and Usadel B:
Trimmomatic: A flexible trimmer for Illumina sequence data.
Bioinformatics. 30:2114–2120. 2014. View Article : Google Scholar : PubMed/NCBI
|
|
30
|
Dobin A, Davis CA, Schlesinger F, Drenkow
J, Zaleski C, Jha S, Batut P, Chaisson M and Gingeras TR: STAR:
Ultrafast universal RNA-seq aligner. Bioinformatics. 29:15–21.
2013. View Article : Google Scholar : PubMed/NCBI
|
|
31
|
Robinson MD, McCarthy DJ and Smyth GK:
EdgeR: A Bioconductor package for differential expression analysis
of digital gene expression data. Bioinformatics. 26:139–140. 2010.
View Article : Google Scholar : PubMed/NCBI
|
|
32
|
Lamhamedi-Cherradi SE, Menegaz BA,
Ramamoorthy V, Aiyer RA, Maywald RL, Buford AS, Doolittle DK,
Culotta KS, O'Dorisio JE and Ludwig JA: An oral formulation of
YK-4-279: Preclinical efficacy and acquired resistance patterns in
Ewing sarcoma. Mol Cancer Ther. 14:1591–1604. 2015. View Article : Google Scholar : PubMed/NCBI
|
|
33
|
McDermott M, Eustace AJ, Busschots S,
Breen L, Crown J, Clynes M, O'Donovan N and Stordal B: In vitro
development of chemotherapy and targeted therapy drug-resistant
cancer cell lines: A practical guide with case studies. Front
Oncol. 4:402014. View Article : Google Scholar : PubMed/NCBI
|
|
34
|
Foo J and Michor F: Evolution of acquired
resistance to anti-cancer therapy. J Theor Biol. 355:10–20. 2014.
View Article : Google Scholar : PubMed/NCBI
|
|
35
|
Rocchi A, Manara MC, Sciandra M, Zambelli
D, Nardi F, Nicoletti G, Garofalo C, Meschini S, Astolfi A, Colombo
MP, et al: CD99 inhibits neural differentiation of human Ewing
sarcoma cells and thereby contributes to oncogenesis. J Clin
Invest. 120:668–680. 2010. View Article : Google Scholar : PubMed/NCBI
|
|
36
|
Lessnick SL, Dacwag CS and Golub TR: The
Ewing's sarcoma oncoprotein EWS/FLI induces a p53-dependent growth
arrest in primary human fibroblasts. Cancer Cell. 1:393–401. 2002.
View Article : Google Scholar : PubMed/NCBI
|
|
37
|
Hu-Lieskovan S, Zhang J, Wu L, Shimada H,
Schofield DE and Triche TJ: EWS-FLI1 fusion protein up-regulates
critical genes in neural crest development and is responsible for
the observed phenotype of Ewing's family of tumors. Cancer Res.
65:4633–4644. 2005. View Article : Google Scholar : PubMed/NCBI
|
|
38
|
Suvà ML, Riggi N, Stehle JC, Baumer K,
Tercier S, Joseph JM, Suvà D, Clément V, Provero P, Cironi L, et
al: Identification of cancer stem cells in Ewing's sarcoma. Cancer
Res. 69:1776–1781. 2009. View Article : Google Scholar : PubMed/NCBI
|
|
39
|
Aldeghaither DS, Zahavi DJ, Murray JC,
Fertig EJ, Graham GT, Zhang YW, O'Connell A, Ma J, Jablonski SA and
Weiner LM: A mechanism of resistance to antibody-targeted immune
attack. Cancer Immunol Res. 7:230–243. 2019. View Article : Google Scholar : PubMed/NCBI
|
|
40
|
Tuveson DA, Willis NA, Jacks T, Griffin
JD, Singer S, Fletcher CD, Fletcher JA and Demetri GD: STI571
inactivation of the gastrointestinal stromal tumor c-KIT
oncoprotein: Biological and clinical implications. Oncogene.
20:5054–5058. 2001. View Article : Google Scholar : PubMed/NCBI
|
|
41
|
Berglund E, Akcakaya P, Berglund D,
Karlsson F, Vukojević V, Lee L, Bogdanović D, Lui WO, Larsson C,
Zedenius J, et al: Functional role of the Ca2+-activated
Cl− channel DOG1/TMEM16A in gastrointestinal stromal
tumor cells. Exp Cell Res. 326:315–325. 2014. View Article : Google Scholar : PubMed/NCBI
|
|
42
|
Rizzo FM, Palmirotta R, Marzullo A, Resta
N, Cives M, Tucci M and Silvestris F: Parallelism of DOG1
expression with recurrence risk in gastrointestinal stromal tumors
bearing KIT or PDGFRA mutations. BMC Cancer. 16:872016. View Article : Google Scholar : PubMed/NCBI
|
|
43
|
Simon S, Grabellus F, Ferrera L, Galietta
L, Schwindenhammer B, Mühlenberg T, Taeger G, Eilers G, Treckmann
J, Breitenbuecher F, et al: DOG1 regulates growth and IGFBP-5 in
gastrointestinal stromal tumors. Cancer Res. 73:3661–3670. 2013.
View Article : Google Scholar : PubMed/NCBI
|
|
44
|
Kreppel M, Aryee DN, Schaefer KL, Amann G,
Kofler R, Poremba C and Kovar H: Suppression of KCMF1 by
constitutive high CD99 expression is involved in the migratory
ability of Ewing's sarcoma cells. Oncogene. 25:2795–2800. 2006.
View Article : Google Scholar : PubMed/NCBI
|