Introduction
Tumors that form in the colon or rectum are often
referred to together as colorectal cancer (CRC). CRC is one of the
most common types of digestive system tumors, with its mortality
rate ranking 4th among all malignant tumors (1). A total of >90% of CRC cases occur
after the age of 50 years, and the average age at diagnosis is 68
(2). The 5-year survival rate of
CRC can reach 90% at early diagnosis, but is <10% when distant
metastasis has developed (3).
Unfortunately, CRC usually reveals no symptoms at early stages, so
it is important to identify biomarkers for its earlier diagnosis to
improve the outcome of this disease.
Various molecular pathways have been shown to be
involved in CRC, such as the chromosomal instability (CIN),
microsatellite instability and CpG island methylator phenotype
pathways (4). These 3 CRC pathways
overlap in complex ways (5). CIN
is the most widespread in CRC, accounting for 65–70% of sporadic
cases (6). In CIN, the
Wnt/β-catenin signaling pathway, which includes adenomatous
polyposis (APC), (pro) renin receptor [(P)RR] and
axis inhibition protein 1 (Axin) (7), is the pathway most clinically
associated with CRC. APC serves an anti-carcinogenic role by
regulating canonical Wnt signal transduction mediated by
cytoplasmic and nuclear mechanisms; mutations in the APC
gene have been identified in ~80% patients with CRC (8). By contrast, the (P)RR, which
is a component of the Wnt receptor complex, is usually
overexpressed in CRC (9). The
Axin gene can downregulate β-catenin and inhibit cell growth
via its co-expression with APC5, when compared with cells
transfected with Axin alone (10). However, the clinical approach to
the CRC treatment of the CIN pathway is limited, suggesting that
focusing on a single pathway is not sufficient to explain CRC
pathobiology; a comprehensive consideration of multiple biological
pathways is being suggested by an increasing number of studies
(6,11). While studies into the molecular
mechanism of CRC have focused on individual molecules rather than
functional networks involving multiple pathways, weighted gene
co-expression network analysis (WGCNA) may be used to analyze
potential gene modules critically involved in gene expression. In
the present study, WGCNA was performed on the Gene Expression
Omnibus (GEO) dataset GSE87211 to further determine the molecular
mechanisms of CRC. Key gene modules associated with CRC
tumorigenesis were identified, and a series of biological functions
and pathways were analyzed. A second GEO dataset, GSE21510, was
used to validate the results, and The Cancer Genome Atlas (TCGA)
database was used to further reveal the genetic information and
clinical characteristics of CRC. The genes identified by WGCNA
provided a more detailed insight into the molecular mechanism of
CRC tumorigenesis, and could provide new targets for the diagnosis
and treatment of the disease.
Materials and methods
Data extraction
A total of 1,014 series of human CRC were retrieved
from the GEO database. Following careful screening of the content,
discarding the datasets with incomplete information and those
lacking control patients, the two datasets with the largest sample
size (GSE87211 and GSE21510) were obtained. The GSE87211 dataset
contained 230 CRC and 133 normal samples, and the platform used was
GPL13497, Agilent-026652 Whole Human Genome Microarray 4×44K v2.
Clinical information obtained from the dataset included sex, age
and disease status (12). The
GSE21510 dataset consisted of 123 CRC and 23 normal samples, and
its platform was GPL570 Affymetrix Human Genome U133 Plus 2.0 Array
(13). R packages were used to
annotate the raw data, generate the expression matrix and match the
probes targeted gene symbols.
Construction of WGCNA
Affy package (version 3.5.2 in R environment)
(14) was used to pre-process and
normalize (Robust Multiarray Averaging normalization) the original
data of GEO database (.CEL file). Standard deviations (SDs) were
arranged from large to small, and the expression of the top 5,000
genes with the greatest differences in case and control samples
were selected for WGCNA. Using the pickSoftThreshold function in R
language, the scale-free topology fitting index for several power
was calculated, and the parameters that provided appropriate
soft-threshold power for the construction of the network were
obtained.
To measure the network connectivity of a gene
defined as the sum of its adjacency with all other genes for the
network generation, adjacency of the gene network was transformed
into topological overlap. Hierarchical clustering was used to
classify genes with similar expression profiles into the same
modules, based on topical overlap matrix dissimilarity. As default,
the minimum number of genes per gene module was set to 30 (14). The dynamicTreeCut algorithm of
WGCNA was used to distinguish the gene co-expression modules by
calculating the dissimilarity of the eigengenes. The MEDissThres,
which is a parameter in the dynamicTreeCut algorithm of the WGCNA
package, was used to select cutting lines merging some of the
modules. Subsequently, visualization of eigengene network was
performed.
Identification of modules association
with clinical features
Module eigengenes (ME) is the first principal
component of a given module and can be considered as a
representative of the gene expression profile in a module (14). The association between ME and
clinical features was calculated using linear regression, and
modules significantly associated with clinical features were
obtained. In addition, the logarithmic transformation of the
P-value [gene significance (GS)=lgP] in the linear
regression between genes and clinical features was calculated. GS
was used to measure the correlation between gene expression and
clinical features of CRC. The average value of GS in each module
was defined as module significance (MS). The module with the
highest absolute MS value was considered to be the module most
significantly associated with the clinical information.
Functional enrichment analysis of key
module genes
In order to investigate the function of genes in the
selected module, genes of the most meaningful modules, the key
modules, were uploaded to the online database DAVID (https://david.ncifcrf.gov/) for annotation. Gene
Ontology (GO) and biological process analyses were performed using
Kyoto Encyclopedia of Genes and Genomes (KEGG) pathway enrichment
analysis (15–17). False discovery ratio (FDR) <0.05
was considered to be statistically significant.
Identification of hub genes
The key module networks obtained from WGCNA analysis
were imported into Cytoscape version 3.7.1 platform (18). Based on the degree of association,
the top 30 hub genes of the 2 key module networks were selected as
candidate genes for further analysis, verification and
visualization.
Validation of hub genes
The limma algorithm of the R package (version 3.5.2)
was used to screen the differentially expressed genes (DEGs)
between CRC and normal samples in the dataset GSE21510, and the
heatmap of DEGs was generated using the ggplot2 function of the R
package (19,20). The significant DEGs were identified
with the critical value of logFC≥|1.0|, and the adjusted P<0.05.
A Venn diagram was drawn (http://bioinformatics.psb.ugent.be/webtools/Venn/) to
obtain the overlapping genes in key modules from GSE87211 and DEGs
from GSE21510. TCGA data of patients with CRC existing in the Gene
Expression Profiling Interactive Analysis (GEPIA; http://gepia.cancer-pku.cn) database were used to
validate the expression of the hub genes (21). P<0.05 was considered to indicate
a statistically significant difference.
Results
Gene selection and hierarchical
clustering analysis
The R software was used to pre-process the original
data for background correction and normalization. Probes used in
the GEO datasets without corresponding annotation information, or
probes matching multiple genes were removed; for genes matched by
several probes, the median of that gene expression was selected.
The expression profiles of 34,127 genes in 363 samples were
obtained from the GSE87211 dataset. WGCNA was constructed by
arranging the SDs from large to small, and the top 5,000 genes were
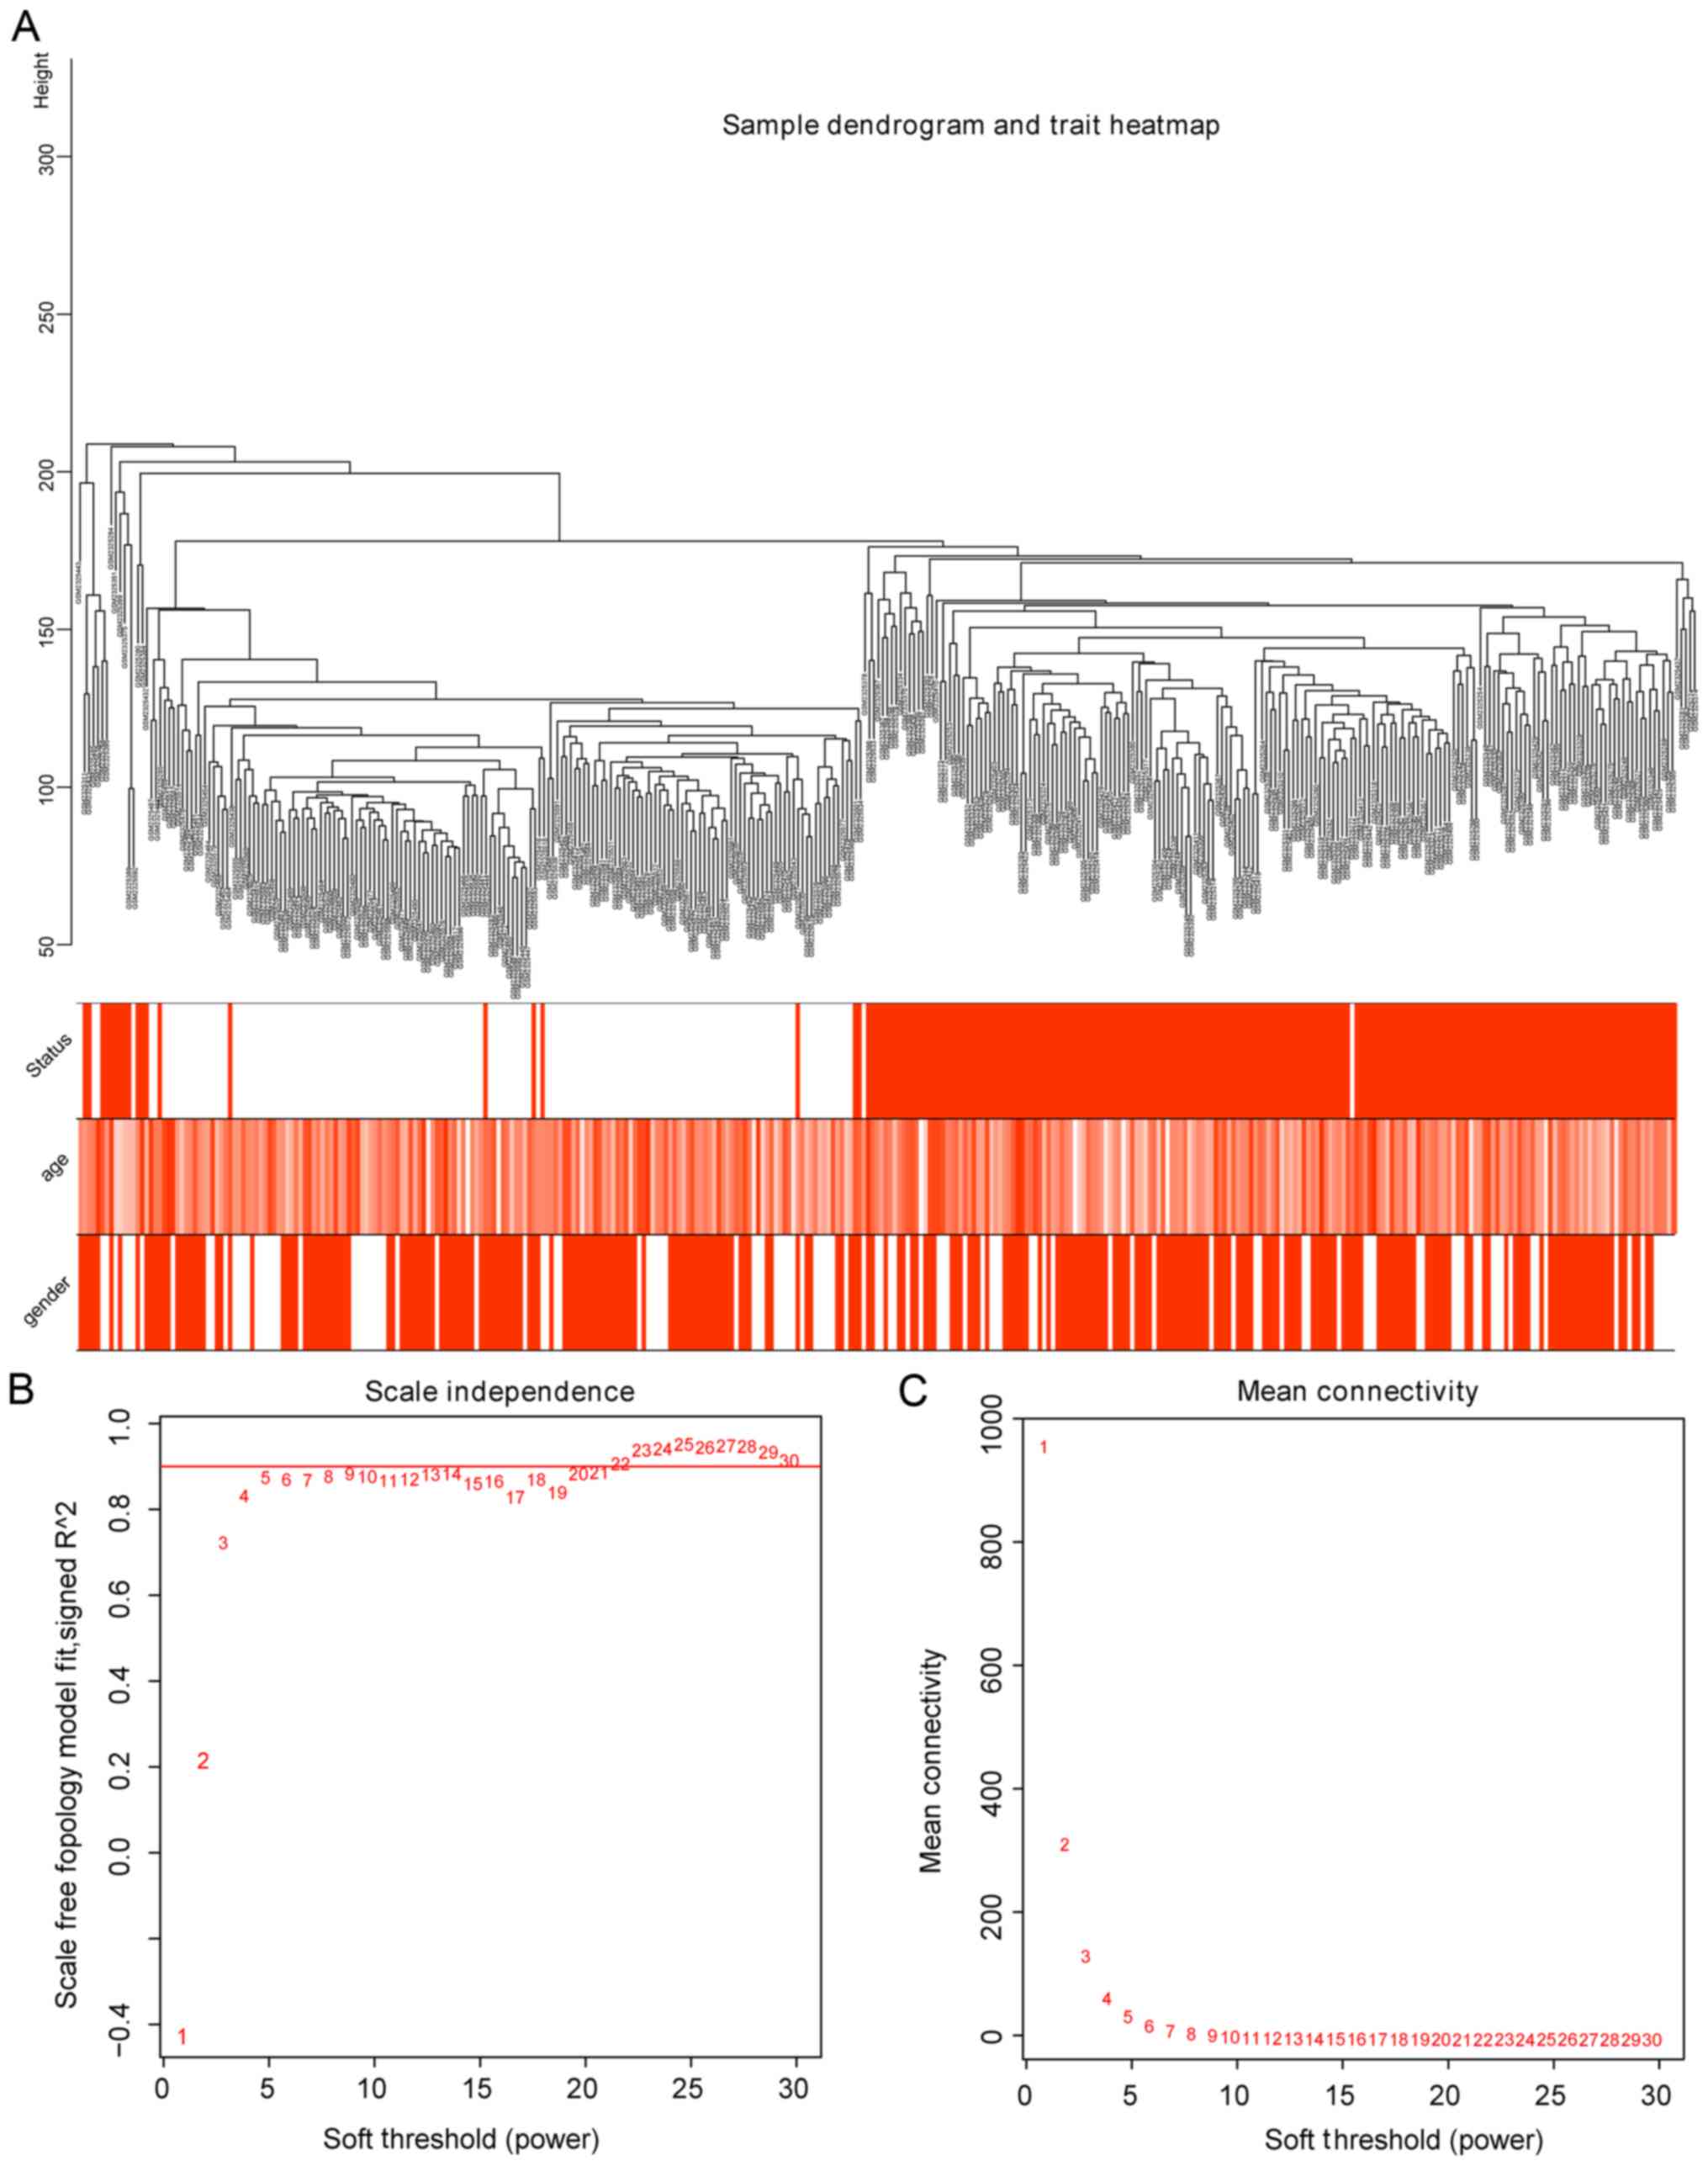
selected. In order to further determine whether all samples
obtained were suitable for WGCNA network analysis, samples with the
clinical characteristics were analyzed. As a result, the 363
samples were divided into 2 clusters in the dendrogram (Fig. 1A). The threshold power (β), a key
parameter for WGCNA, affects the independence and average
connectivity of the co-expression module. The network topology of β
from 1 to 30 was analyzed, and for further analysis, all samples
with β=5 were selected, as the lowest power of the scale-free
topological fitted an index of R2=0.9 at this point
(Fig. 1B).
Construction and analysis of WGCNA
with selected genes in CRC
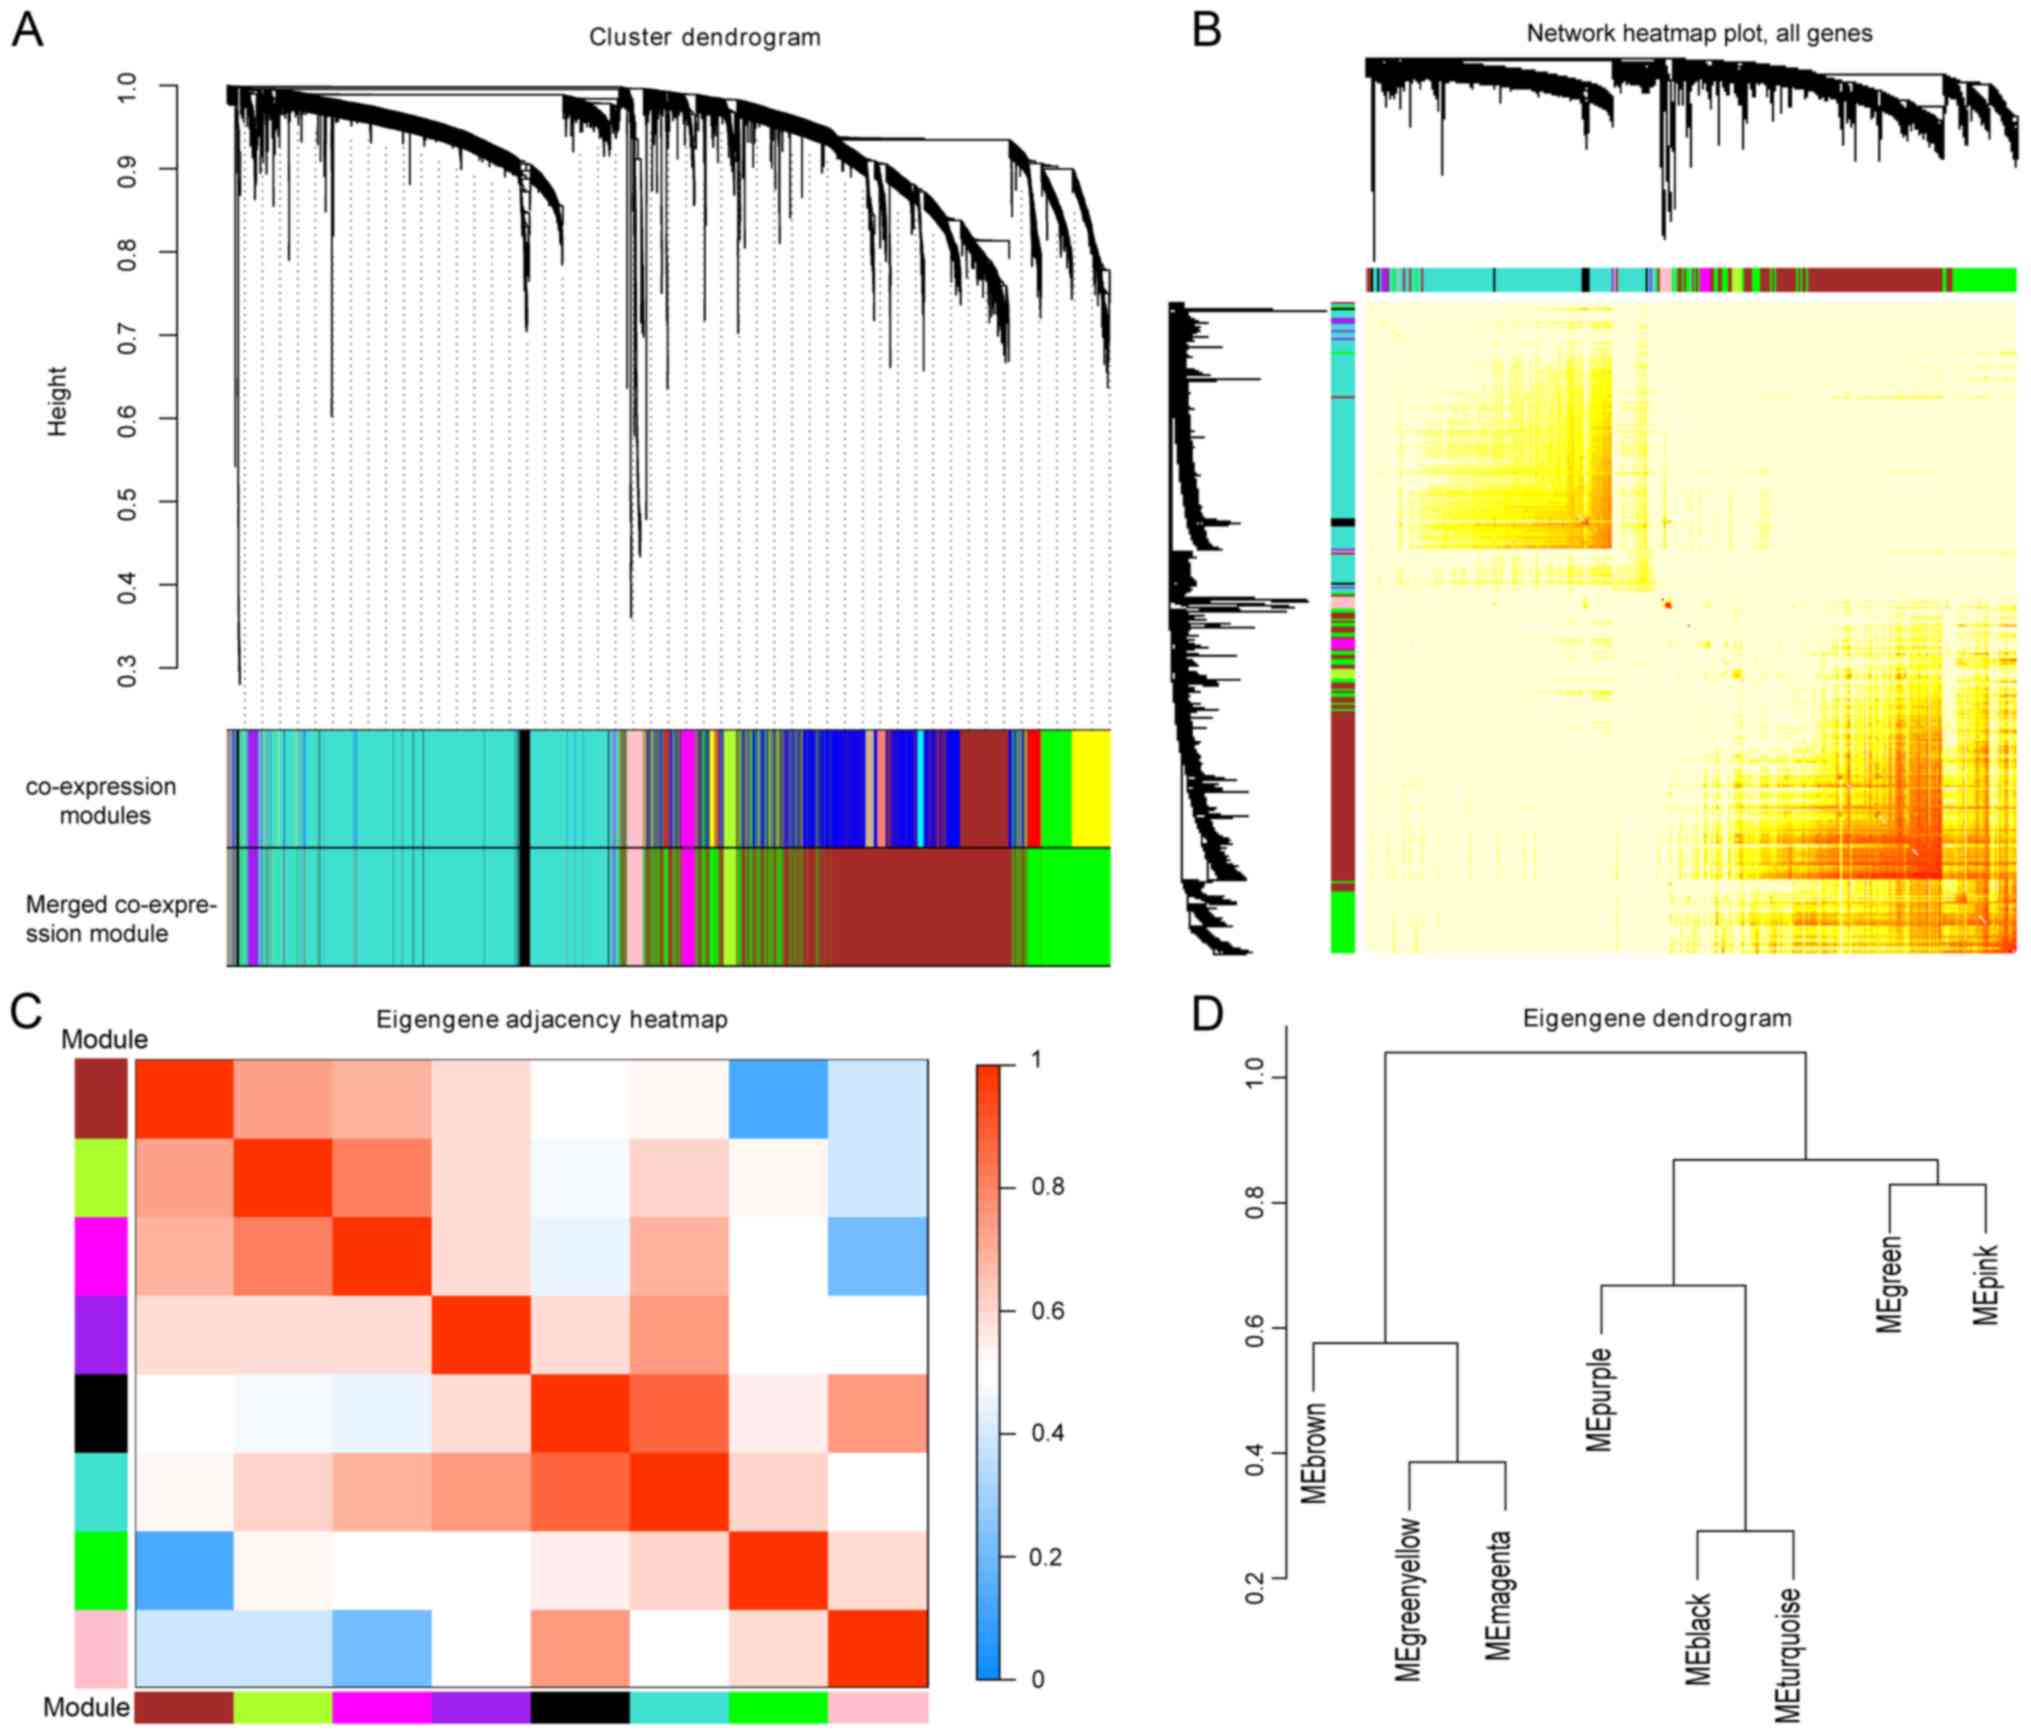
WGCNA was constructed based on computational
heterogeneous hierarchical clustering. A total of 15 co-expression
modules were generated in the GSE87211 dataset, and 9 merged
co-expression modules were obtained by merging similar modules when
the MEDissThres was set at 0.25 (Fig.
2A). As the gray module here indicated an unclassifiable
eigengene cluster, the remaining 8 modules were selected for
further analysis. The network heatmap of the 8 modules was plotted,
and the results showed that each module was independent of one
another. The modules and gene expression in each module showed a
high relative independence level (Fig.
2B); similar results were observed by a heatmap plotted
according to adjacencies (Fig.
2C). In addition, eigengenes in the 8 modules were calculated
and clustered according to their correlations with each other, and
the modules were divided into two groups (Fig. 2D).
Identification of key modules
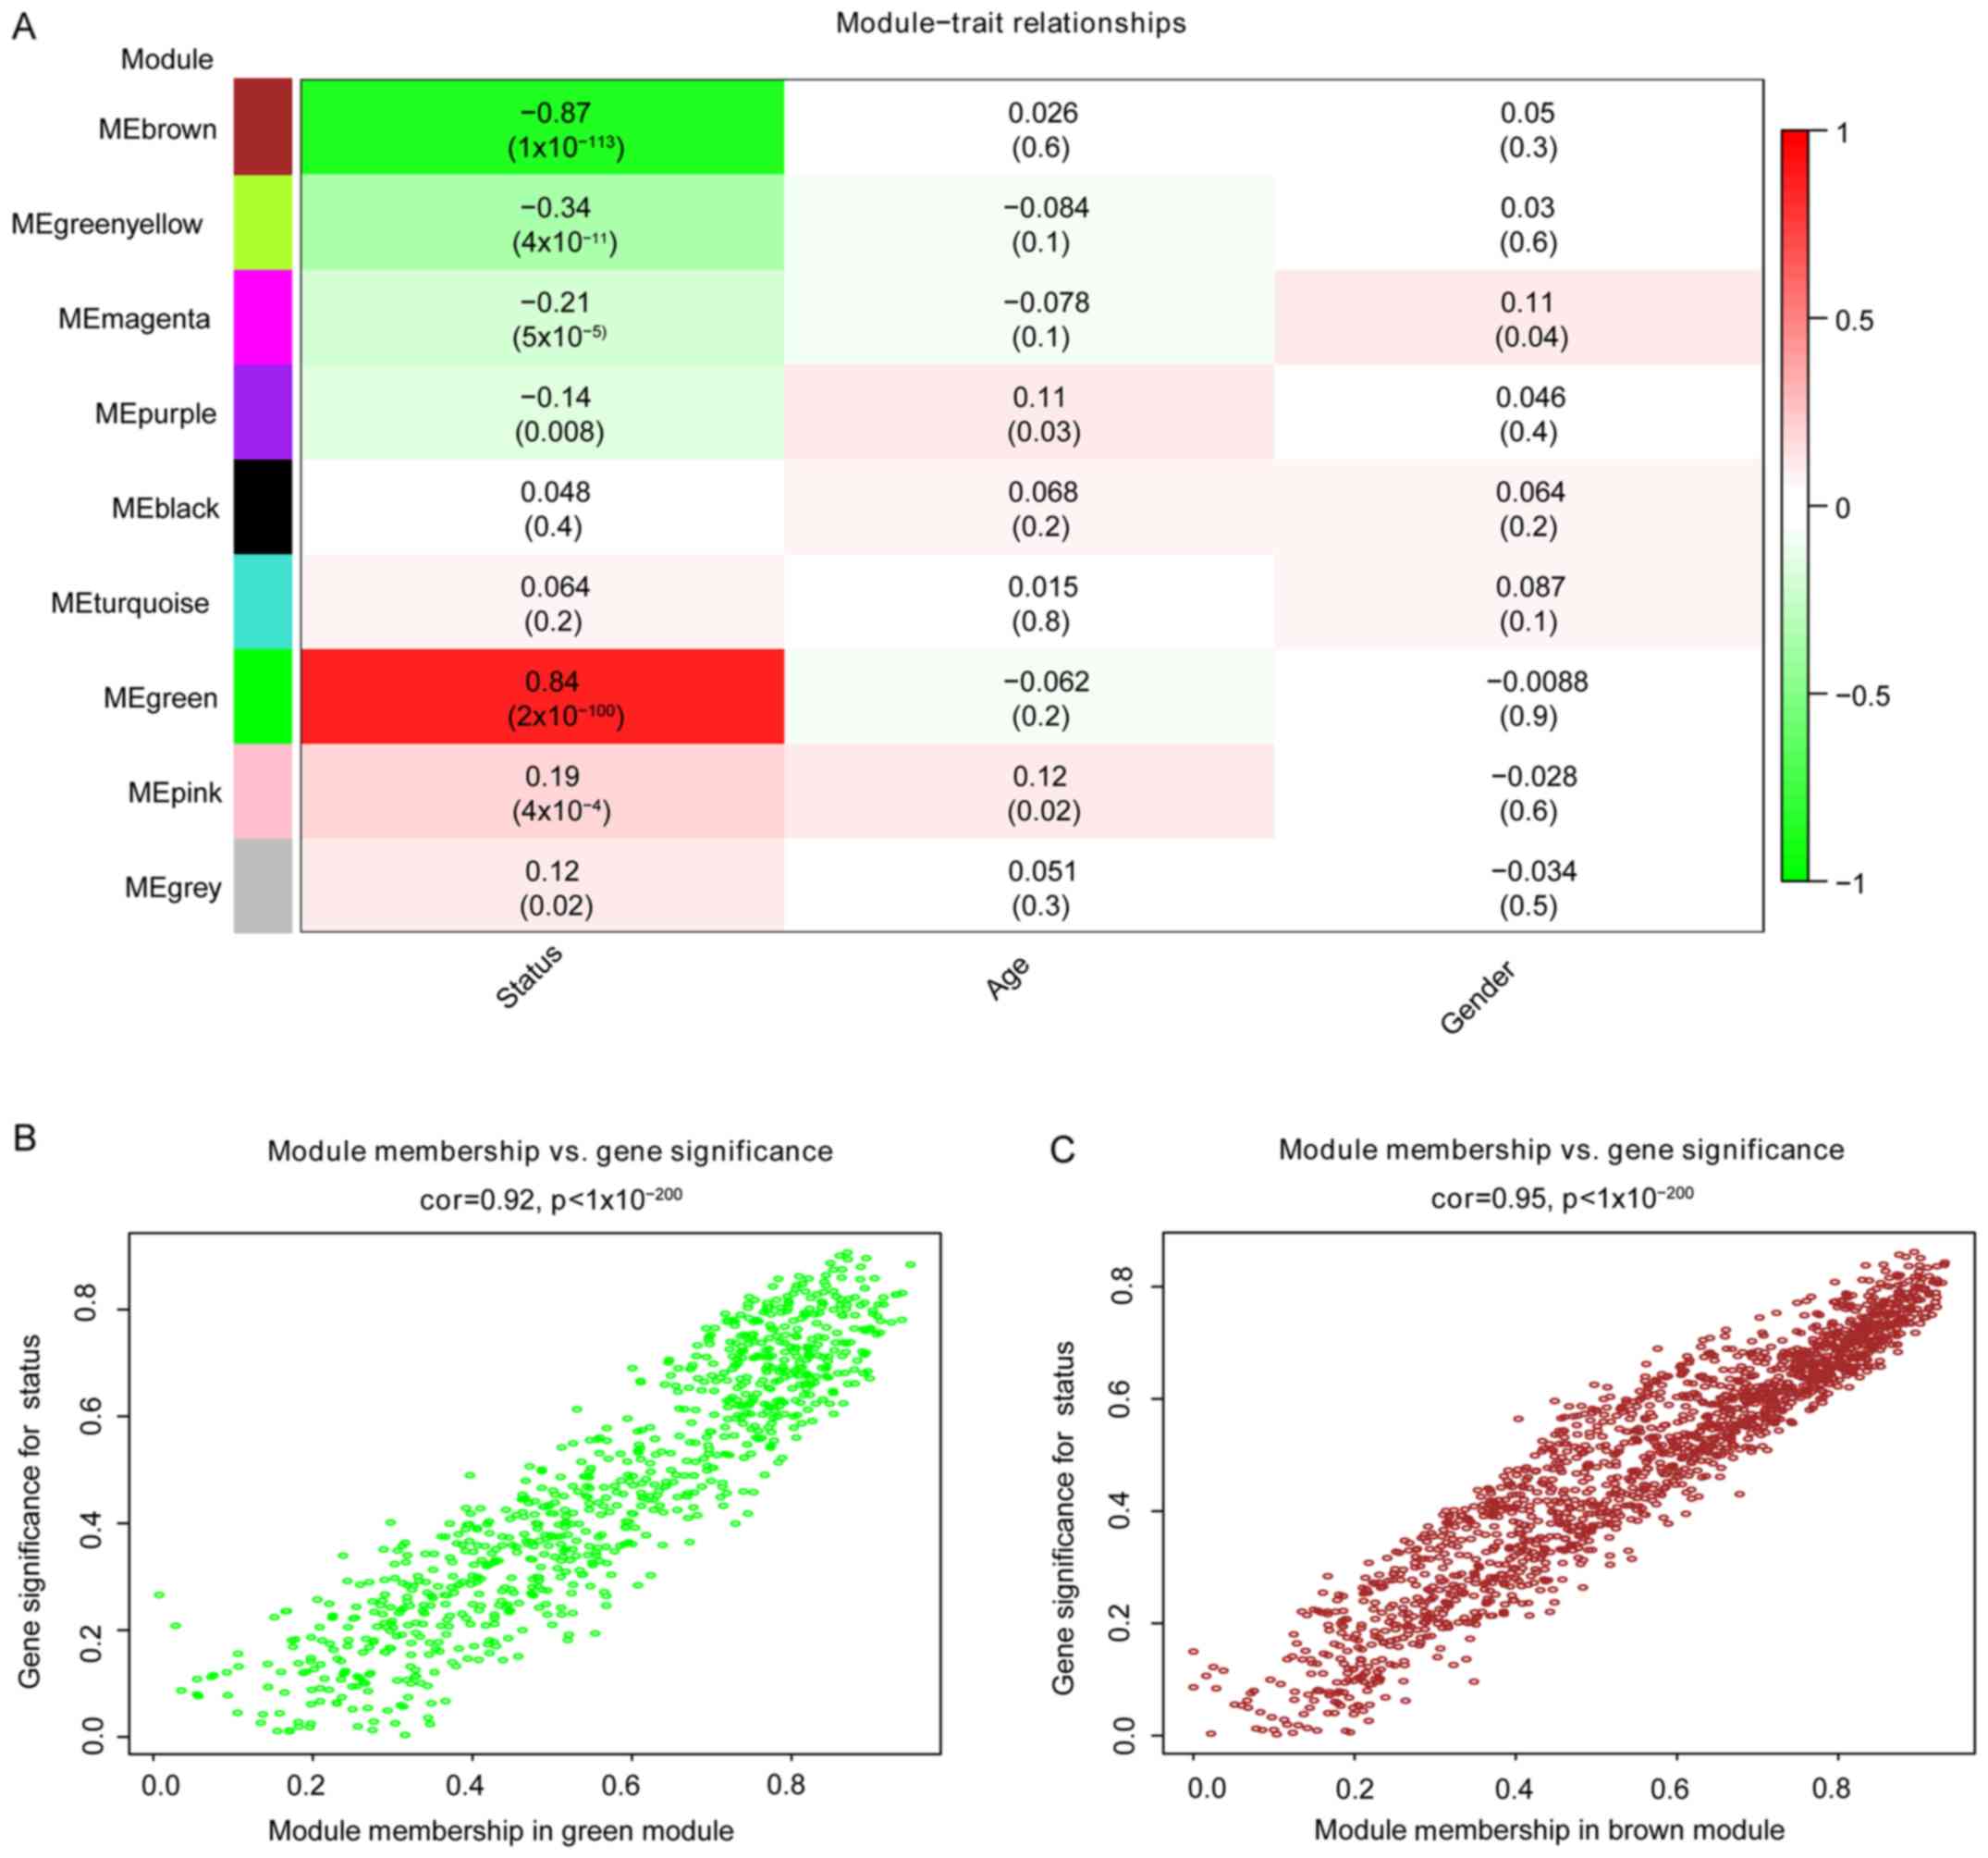
The correlation between modules and disease
characteristics was examined, and the eigengene tree and thermogram
demonstrated that the green and brown modules were highly
correlated with disease status. The green module was identified to
be significantly positively correlated with disease status (r=0.84,
P=2e-100), while the brown module was markedly negatively
correlated with disease status (r=0.87, P=1e-113; Fig. 3A). Therefore, the two key modules
were identified as the modules most associated with CRC disease
status. The correlations between module members and GS in the green
and brown modules are demonstrated by scatter plots in Fig. 3B and C, respectively.
GO enrichment and KEGG pathway
analyses of key modules
Using the DAVID functional annotations tool, the GO
function and KEGG pathway enrichment of genes in 2 key modules were
analyzed, with detailed information listed in Tables I and II. The green module was mainly enriched
in collagen catabolic process, cell adhesion, extracellular matrix
(ECM) organization, chemotaxis and cell-cell signaling of
biological processes, primarily regulation of the ECM, and the
PI3K-Akt and Chemokine signaling pathways. These processes and
pathways serve a key role in cancer progression, suggesting that
genes in the green module participated in the progression of CRC.
The enrichment analysis results of the brown module indicated that
it was mainly enriched in the chemokine-mediated signaling pathway
and negative regulation of growth and steroid metabolism, which
were negatively correlated with tumorigenesis.
 | Table I.GO enrichment analysis of green
module and brown modules (only biological processes). |
Table I.
GO enrichment analysis of green
module and brown modules (only biological processes).
| Term | Description | Count | % | FDR |
|---|
| Green module |
|
GO:0030574 | Collagen catabolic
process | 25 | 3.205128 |
1.50×10⁻¹⁴ |
|
GO:0006954 | Inflammatory
response | 55 | 7.051282 |
2.00×10⁻¹³ |
|
GO:0007155 | Cell adhesion | 58 | 7.435897 |
1.81×10⁻¹¹ |
|
GO:0030198 | Extracellular
matrix organization | 35 | 4.487179 |
4.26×10⁻¹⁰ |
|
GO:0030593 | Neutrophil
chemotaxis | 20 | 2.564103 |
8.23×10⁻⁹ |
|
GO:0007267 | Cell-cell
signaling | 38 | 4.871795 |
9.10×10⁻⁹ |
|
GO:0030199 | Collagen fibril
organization | 16 | 2.051282 |
1.31×10⁻⁹ |
|
GO:0042060 | Wound healing | 21 | 2.692308 |
3.96×10⁻⁸ |
|
GO:0070098 | Chemokine-mediated
signaling pathway | 19 | 2.435897 |
3.11×10⁻⁷ |
|
GO:0006935 | Chemotaxis | 24 | 3.076923 |
5.95×10⁻⁷ |
|
GO:0060326 | Cell
chemotaxis | 17 | 2.179487 |
5.16×10⁻⁶ |
|
GO:0002548 | Monocyte
chemotaxis | 13 | 1.666667 |
8.20×10⁻⁵ |
|
GO:0008284 | Positive regulation
of cell proliferation | 45 | 5.769231 |
1.24×10⁻⁴ |
|
GO:0006955 | Immune
response | 42 | 5.384615 |
1.51×10⁻⁴ |
|
GO:0001501 | Skeletal system
development | 22 | 2.820513 |
1.56×10⁻⁴ |
|
GO:0071346 | Cellular response
to interferon-γ | 14 | 1.794872 |
4.19×10⁻⁴ |
|
GO:0071347 | Cellular response
to interleukin-1 | 15 | 1.923077 |
9.83×10⁻⁴ |
|
GO:0050900 | Leukocyte
migration | 19 | 2.435897 |
2.31×10⁻³ |
|
GO:0022617 | Extracellular
matrix disassembly | 15 | 1.923077 |
2.34×10⁻³ |
|
GO:0010628 | Positive regulation
of gene expression | 29 | 3.717949 |
2.87×10⁻³ |
| Brown module |
|
GO:0007586 | Digestion | 20 | 1.380262 |
3.25×10⁻⁵ |
|
GO:0034765 | Regulation of ion
transmembrane transport | 25 | 1.725328 |
5.43×10⁻⁴ |
|
GO:0071294 | Cellular response
to zinc ion | 10 | 0.690131 | 2.60×10⁻³ |
|
GO:0001764 | Neuron
migration | 23 | 1.587302 |
2.94×10⁻³ |
|
GO:0006730 | One-carbon
metabolic process | 12 | 0.828157 |
3.87×10⁻³ |
|
GO:1902476 | Chloride
transmembrane transport | 21 | 1.449275 |
5.68×10⁻³ |
|
GO:0015701 | Bicarbonate
transport | 14 | 0.966184 |
7.57×10⁻³ |
|
GO:0007218 | Neuropeptide
signaling pathway | 21 | 1.449275 |
2.13×10⁻² |
|
GO:0070098 | Chemokine-mediated
signaling pathway | 17 | 1.173223 |
2.90×10⁻² |
|
GO:0045926 | Negative regulation
of growth | 9 | 0.621118 |
3.00×10⁻² |
|
GO:0008202 | Steroid metabolic
process | 13 | 0.89717 |
3.38×10⁻² |
|
GO:0007267 | Cell-cell
signaling | 37 | 2.553485 |
3.52×10⁻² |
| Table II.KEGG pathway enrichment analysis of
green module and brown modules. |
Table II.
KEGG pathway enrichment analysis of
green module and brown modules.
| Category | Term | Description | Count | % | FDR |
|---|
| Green module |
|
KEGG | hsa04060 | Cytokine-cytokine
receptor interaction | 40 | 5.128205 |
3.32×10⁻¹⁰ |
|
KEGG | hsa04974 | Protein digestion
and absorption | 22 | 2.820513 |
7.29×10⁻⁸ |
|
KEGG | hsa04512 | ECM-receptor
interaction | 18 | 2.307692 |
1.27×10⁻⁴ |
|
KEGG | hsa05146 | Amoebiasis | 19 | 2.435897 |
4.96×10⁻⁴ |
|
KEGG | hsa05323 | Rheumatoid
arthritis | 16 | 2.051282 |
4.50×10⁻³ |
|
KEGG | hsa04151 | PI3K-Akt signaling
pathway | 33 | 4.230769 |
2.73×10⁻² |
|
KEGG | hsa04062 | Chemokine signaling
pathway | 22 | 2.820513 |
4.61×10⁻² |
|
KEGG | hsa04668 | TNF signaling
pathway | 14 | 1.794872 |
7.10×10⁻¹ |
|
KEGG | hsa04310 | Wnt signaling
pathway | 16 | 2.05128 |
9.10×10⁻¹ |
| Brown module |
|
KEGG | hsa00830 | Retinol
metabolism | 24 | 1.656315 |
1.39×10⁻⁸ |
|
KEGG | hsa05204 | Chemical
carcinogenesis | 23 | 1.587302 |
1.30×10⁻⁵ |
|
KEGG | hsa00982 | Drug
metabolism-cytochrome P450 | 20 | 1.380262 |
1.02×10⁻⁴ |
|
KEGG | hsa00910 | Nitrogen
metabolism | 9 | 0.621118 |
8.46×10⁻³ |
|
KEGG | hsa00980 | Metabolism of
xenobiotics by cytochrome P450 | 18 | 1.242236 |
9.57×10⁻³ |
|
KEGG | hsa00140 | Steroid hormone
biosynthesis | 15 | 1.035197 |
3.38×10⁻² |
|
KEGG | hsa04978 | Mineral
absorption | 13 | 0.89717 |
3.44×10⁻² |
Validation of hub genes
The gene network of 2 key modules was imported into
Cytoscape and the scores of all genes were calculated by 11
different methods. Finally, the first 30 genes from each module
were screened according to the degree of association among genes
for further analysis. Survival analysis of patients with CRC in
GEPIA, depending on the expression level of the selected genes,
showed statistical significance; and the top 5 significant genes
for survival analysis in each module were considered to be hub
genes. Survival analysis of the hub genes was performed in GEPIA
patients with CRC, the collagen type I α1 chain (COL1A1),
collagen type XII α1 chain (COL12A1), collagen triple helix
repeat containing 1 (CTHRC1), inhibin subunit βa
(INHBA) and chromobox 2 (CBX2) genes were obtained
from the green module; and the bestrophin 2 (BEST2),
carbonic anhydrase 2 (CA2), glucagon (GCG), solute
carrier family 4 member 4 (SLC4A4) and gliomedin
(GLDN) genes were obtained from the brown module (Fig. 4).
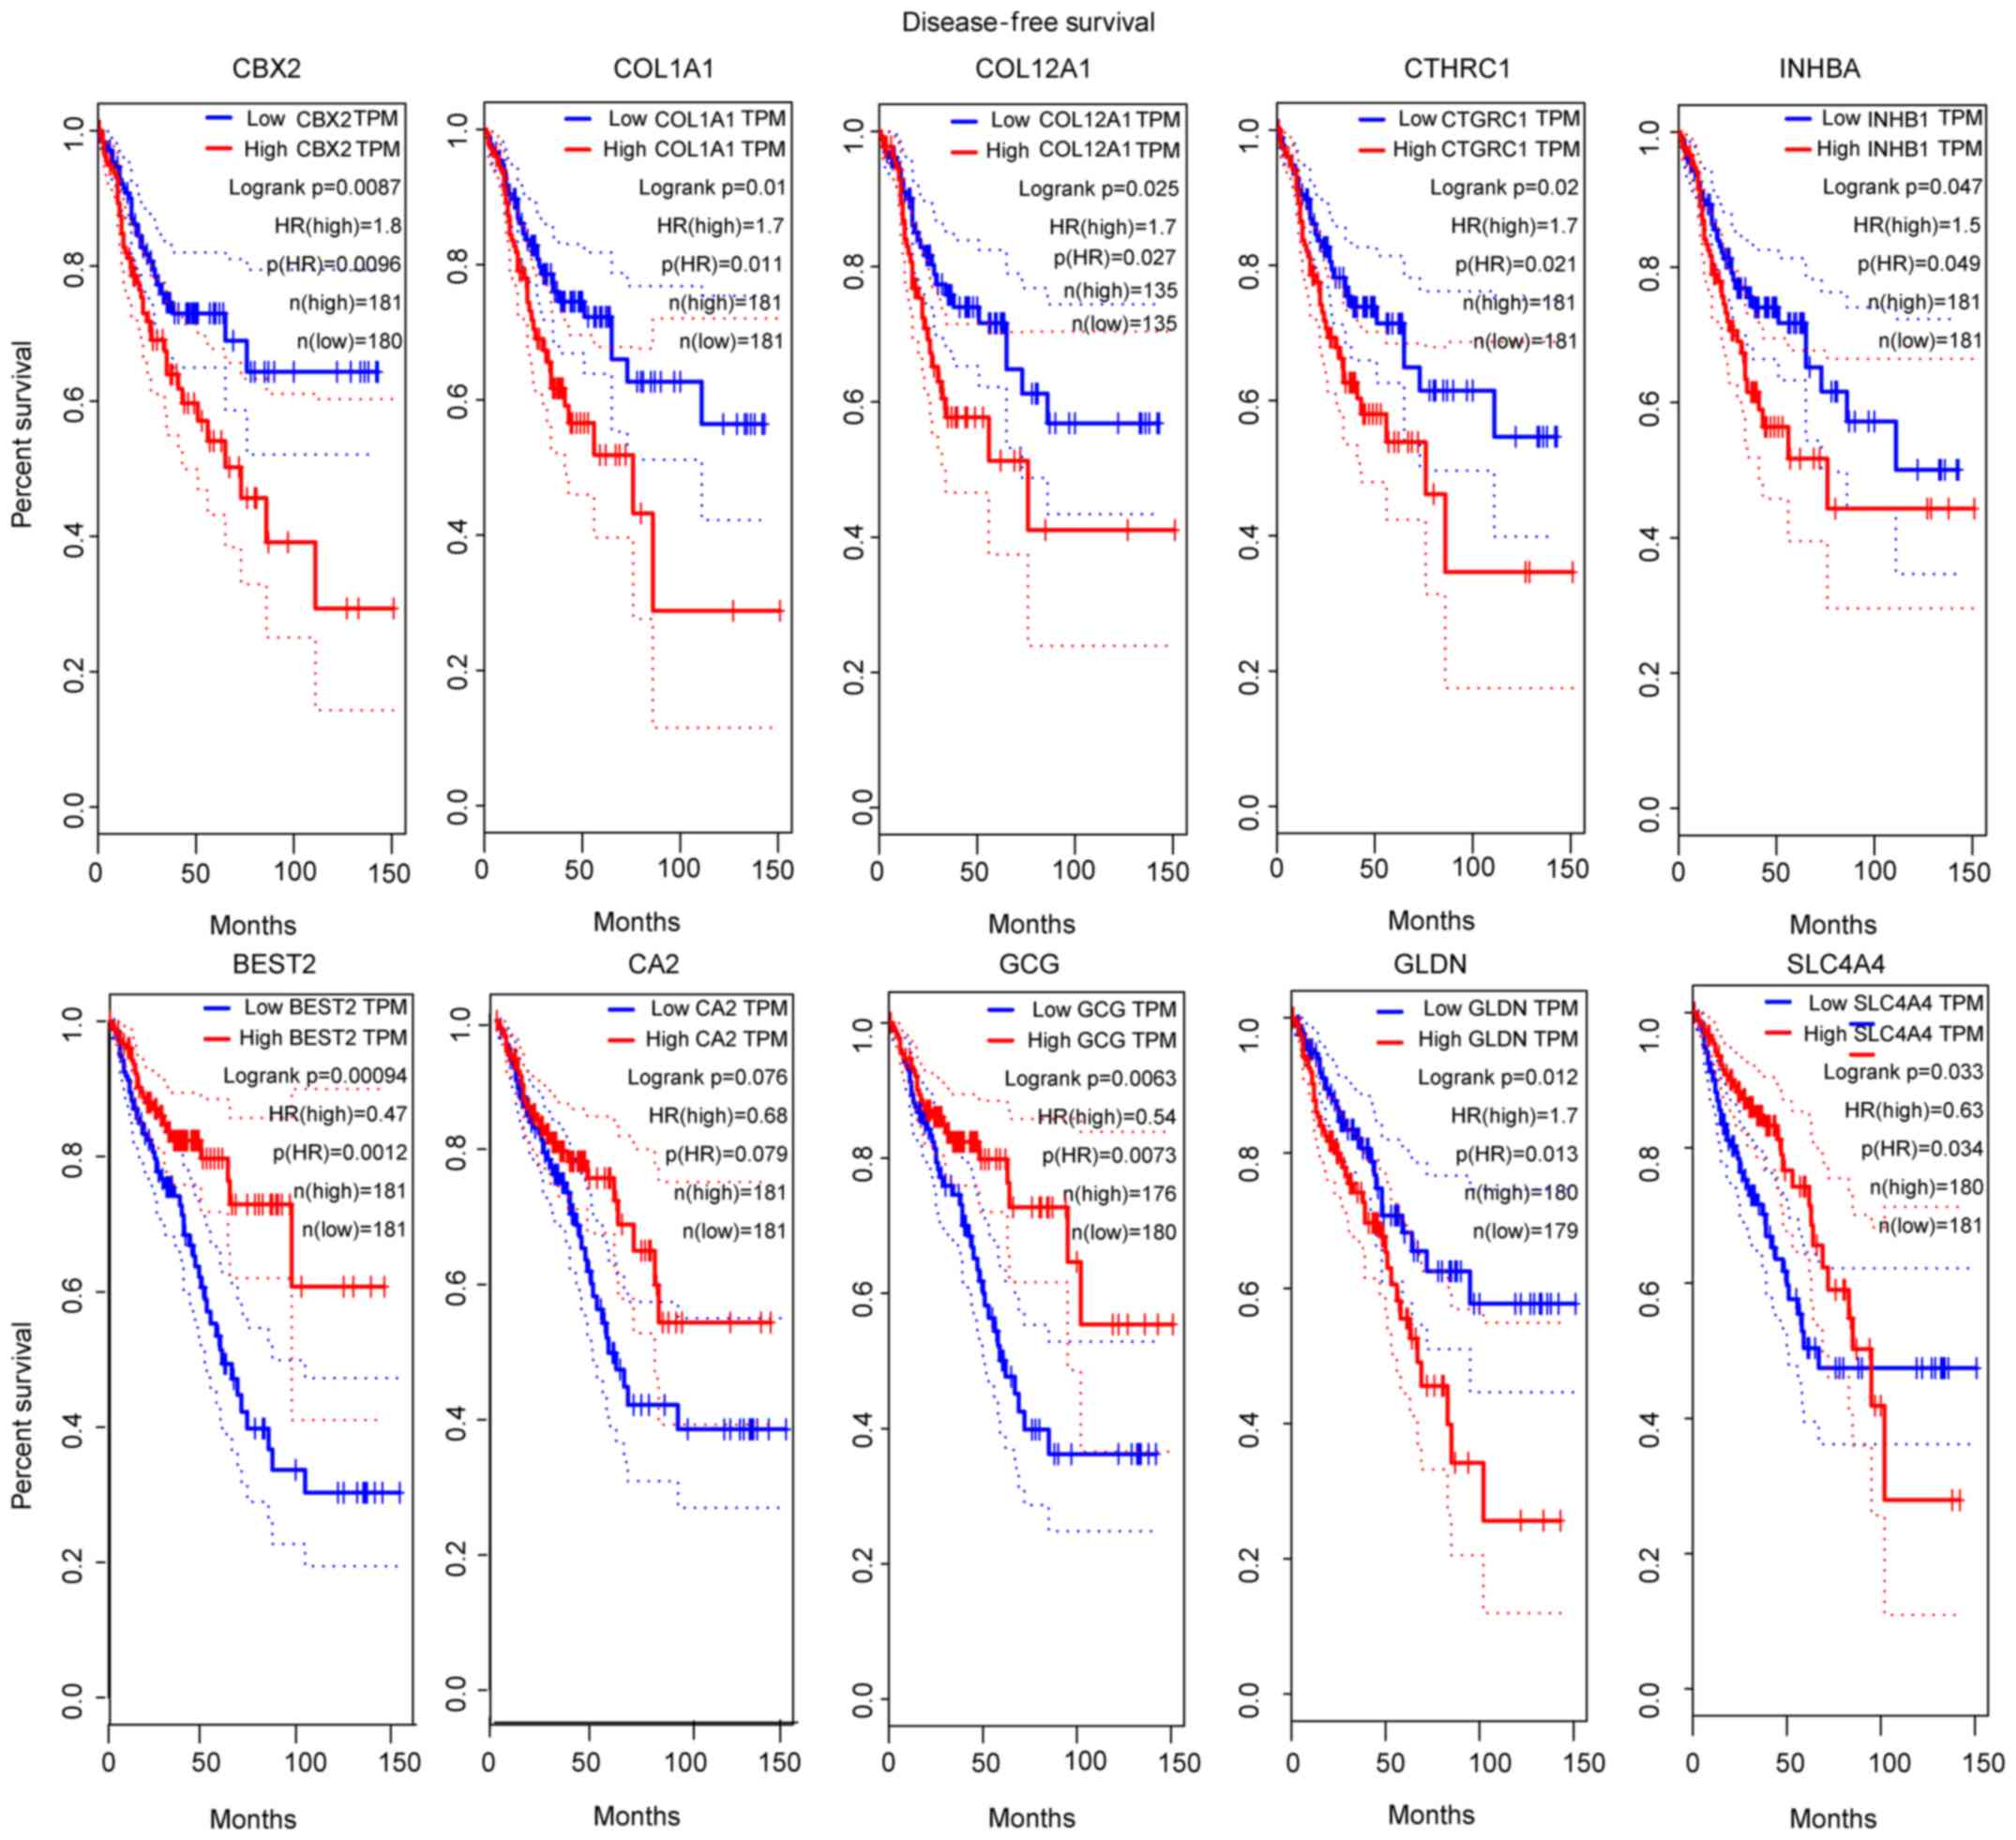 | Figure 4.Survival analysis of 10 hub genes
according to data from the TCGA database. P<0.05 was considered
to indicate a statistically significant difference. COL1A1,
collagen type I α1 chain; COL12A1, collagen type XII α1 chain;
CTHRC1, collagen triple helix repeat containing 1; INHBA, inhibin
subunit βa; CBX2, chromobox 2; BEST2, bestrophin 2; CA2, carbonic
anhydrase 2; GCG, glucagon; SLC4A4, solute carrier family 4 member
4; GLDN, gliomedin. |
Next, the limma R package with a logFC≥|1.0| as the
cutoff was used to screen for DEGs in another GEO dataset,
GSE21510; the heatmap of the DEGs for this dataset is presented in
Fig. 5A. The DEGs from GSE21510
and genes of the green modules or brown modules from GSE87211 were
overlapped by Venn diagram. The results demonstrated that the 10
hub genes were validated in the Venn diagrams (Fig. 5B and C).
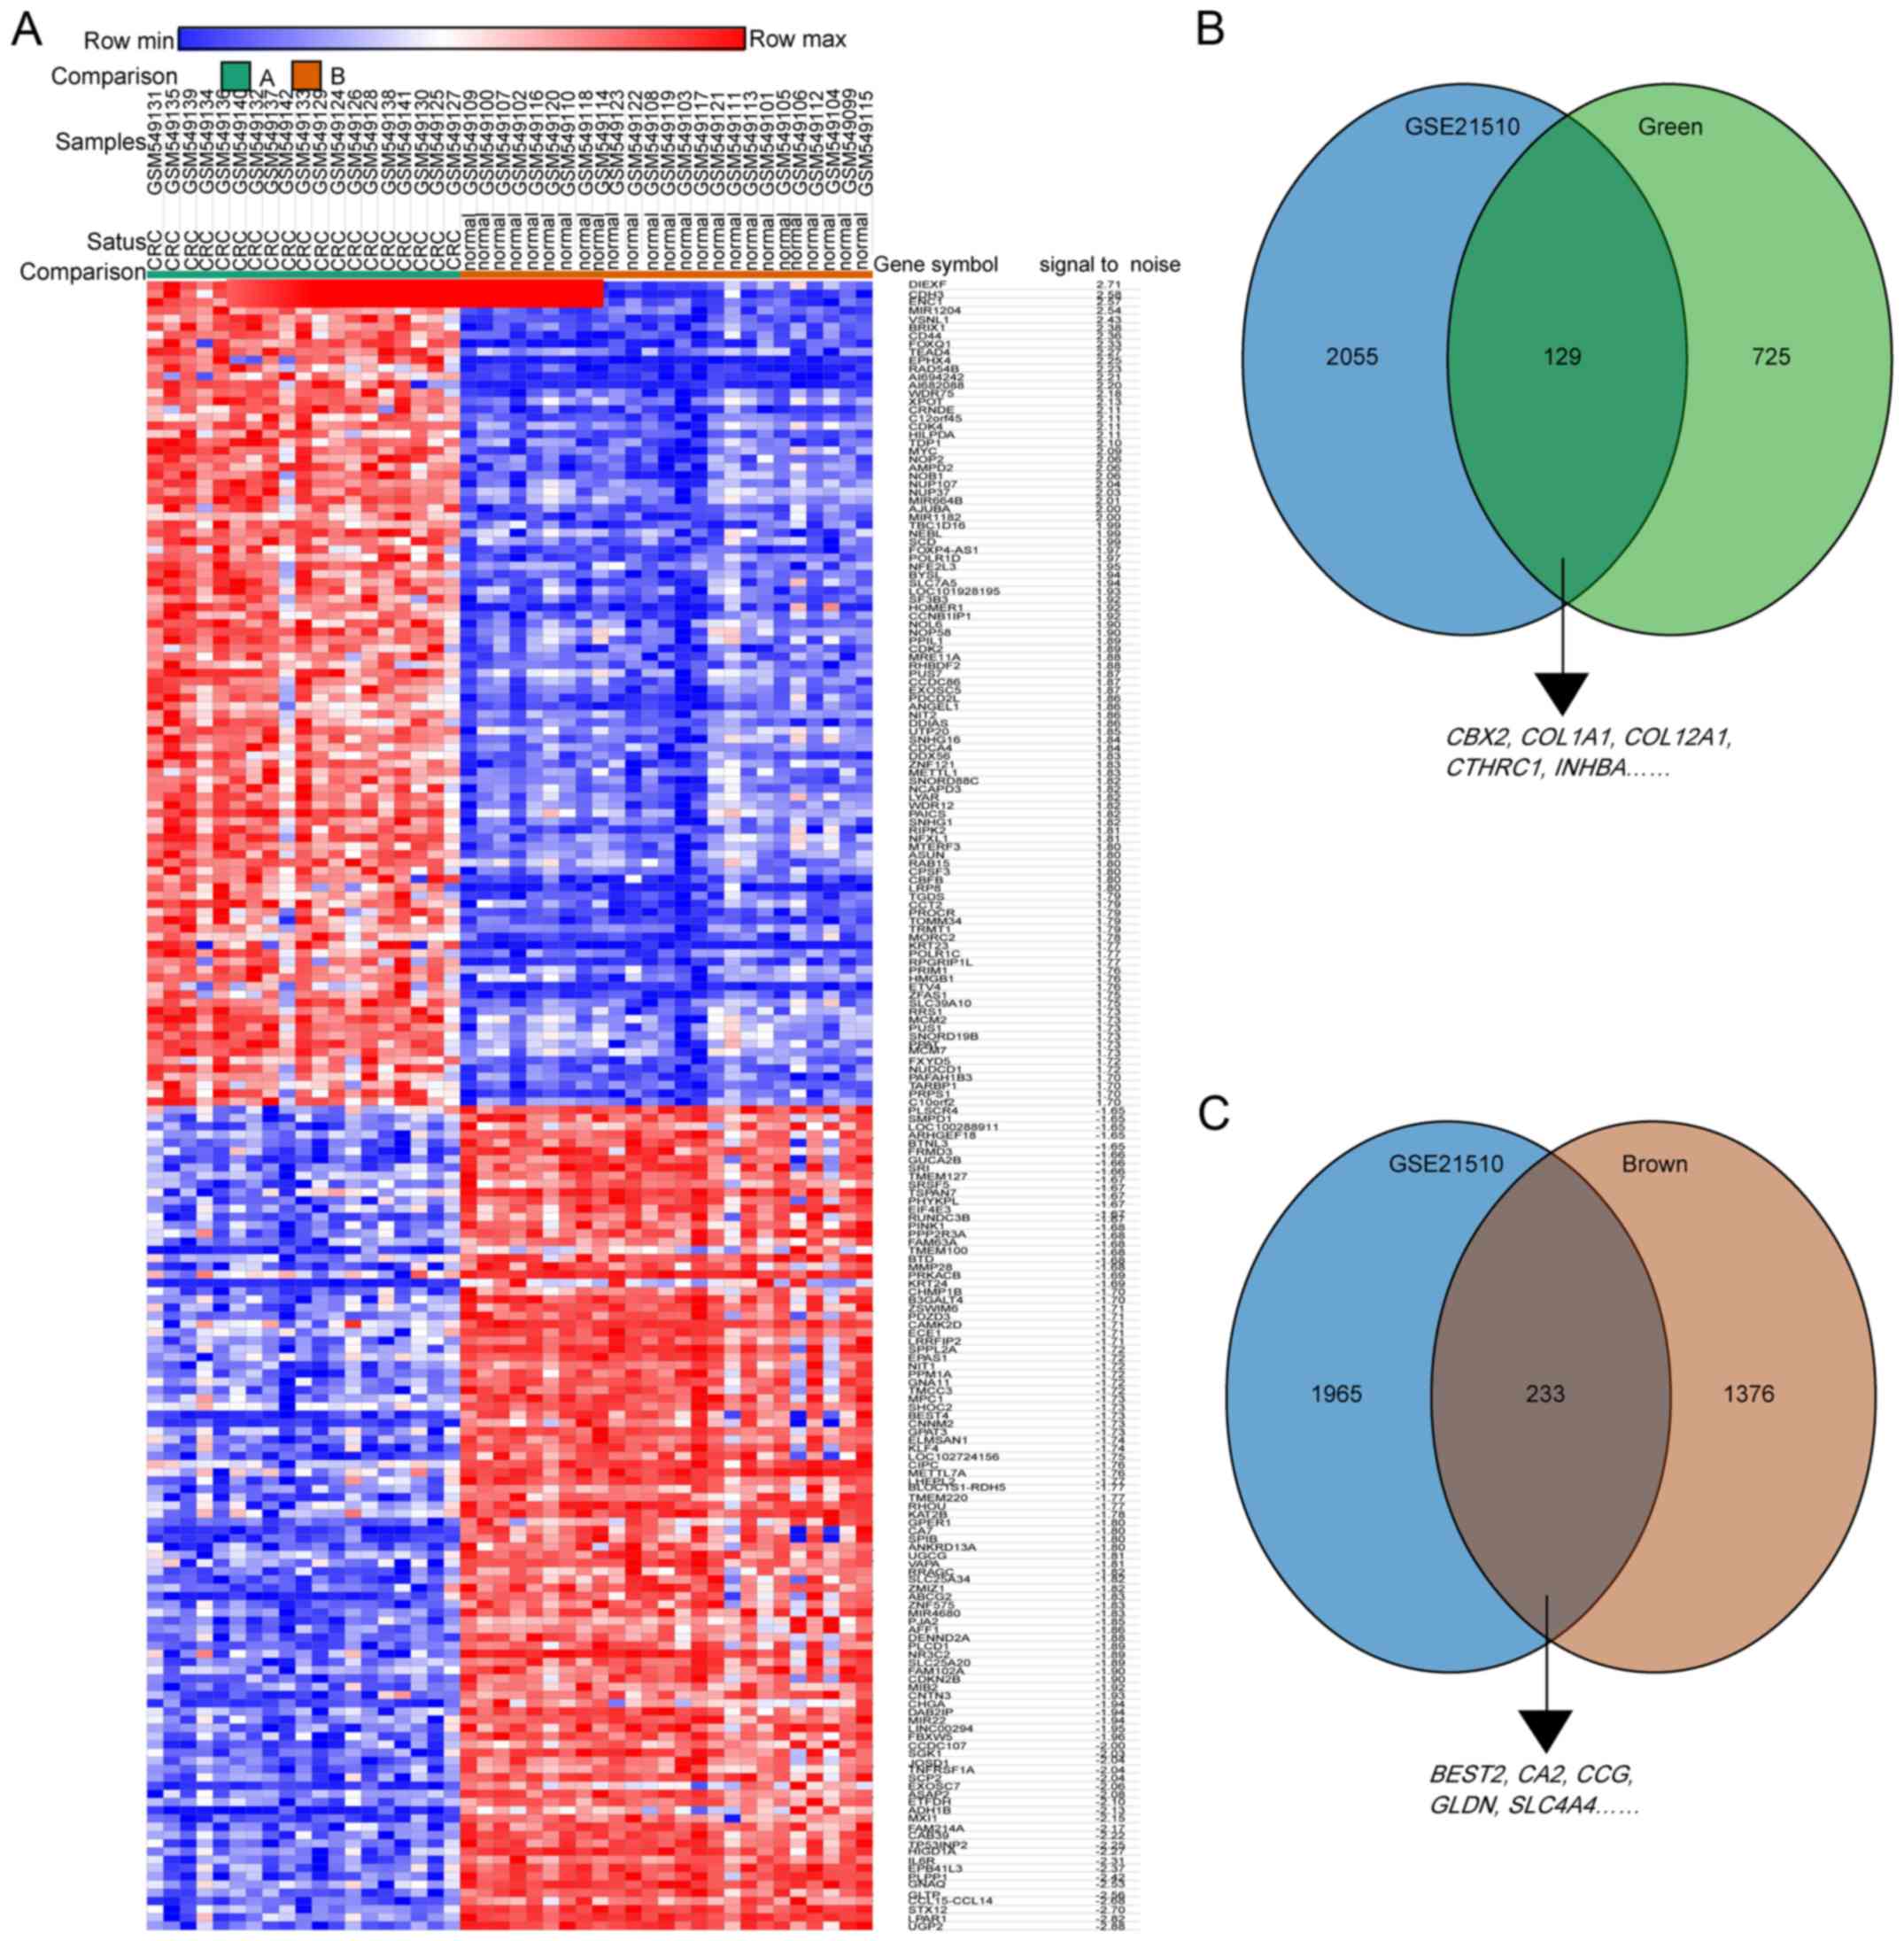 | Figure 5.Hub genes of GSE87211 were validated
in the GSE21510 dataset. (A) Heatmap hierarchical clustering
exhibiting DEGs between colorectal cancer and control groups in the
GSE21510 dataset. (B) Overlapping genes between DEGs from the
GSE21510 dataset and the green module from the GSE87211 dataset.
(C) Overlapping genes between the DEGs from the GSE21510 dataset
and the brown module from the GSE87211 dataset. DEGs,
differentially expressed genes. COL1A1, collagen type I α1 chain;
COL12A1, collagen type XII α1 chain; CTHRC1, collagen triple helix
repeat containing 1; INHBA, inhibin subunit βa; CBX2, chromobox 2;
BEST2, bestrophin 2; CA2, carbonic anhydrase 2; GCG, glucagon;
SLC4A4, solute carrier family 4 member 4; GLDN, gliomedin. |
To further validate the hub genes, GEPIA analysis
was conducted in TCGA data from patients with CRC. The results
demonstrated that the expression levels of the 5 hub genes in the
green module were all increased in CRC tissues, while those in the
brown module were all decreased (Fig.
6).
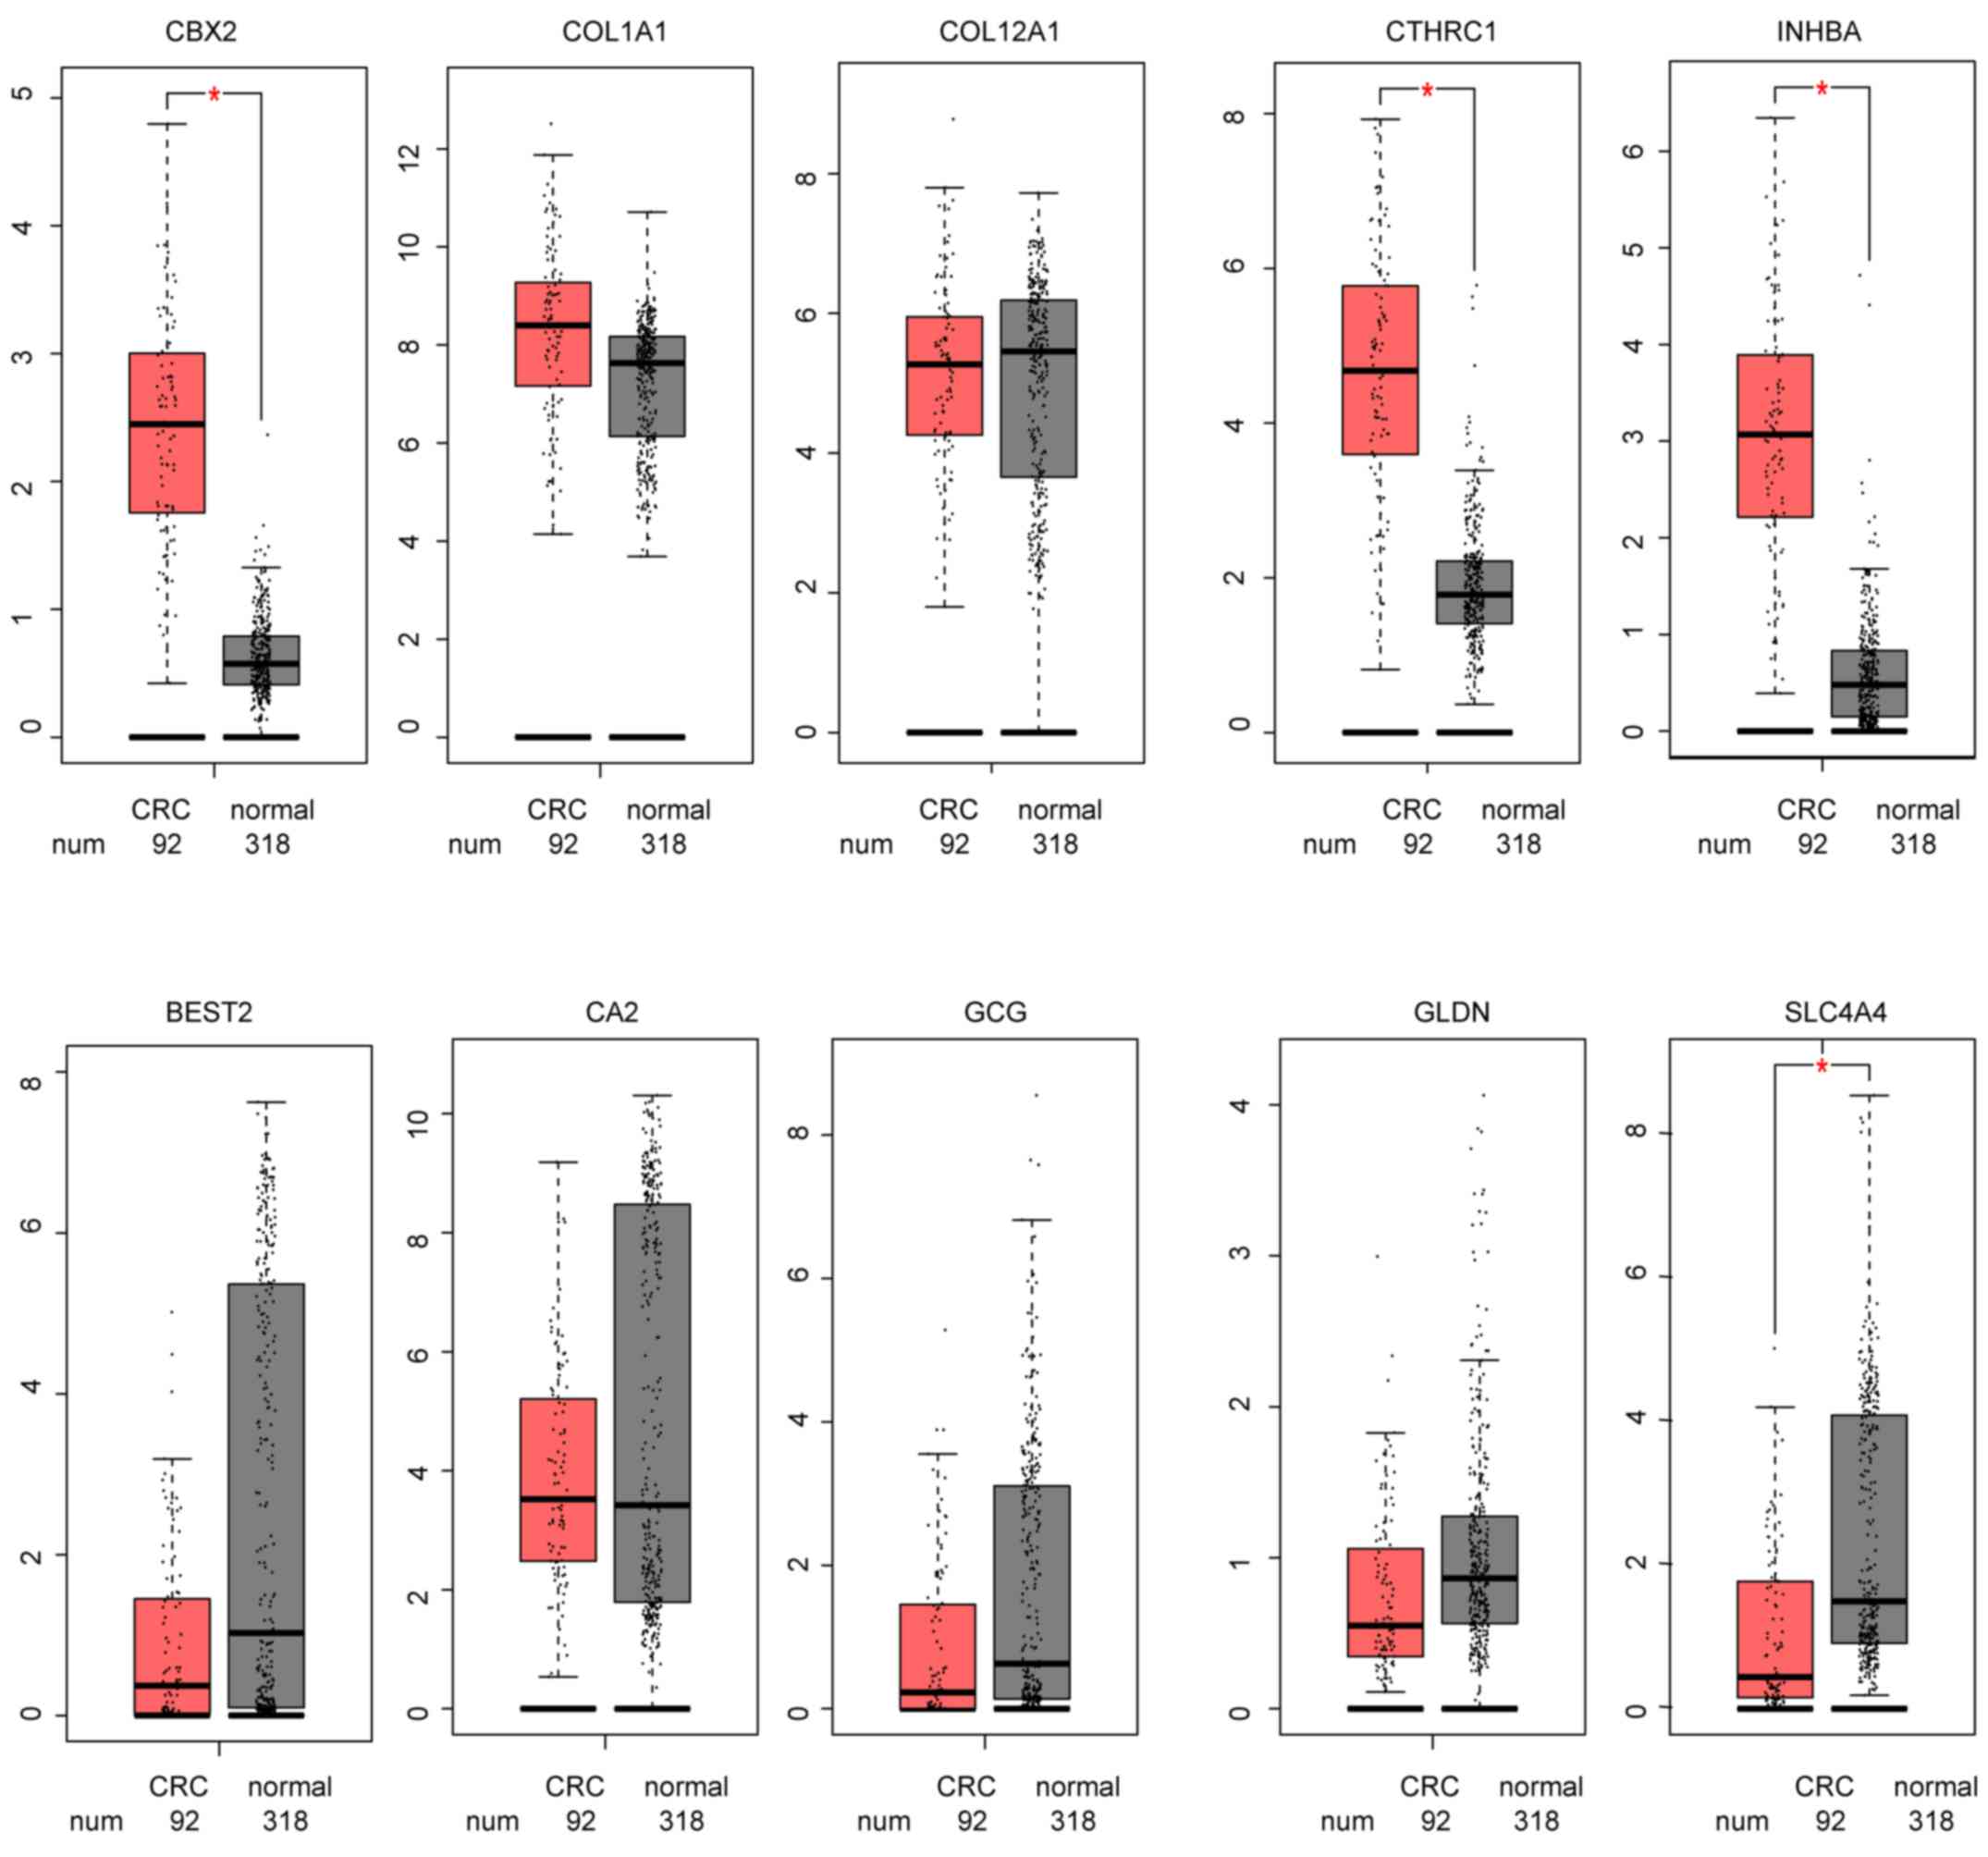 | Figure 6.Hub genes expression of The Cancer
Genome Atlas CRC data in GEPIA. *P<0.005. GEPIA, Gene Expression
Profiling Interactive Analysis; CRC, colorectal cancer; COL1A1,
collagen type I α1 chain; COL12A1, collagen type XII α1 chain;
CTHRC1, collagen triple helix repeat containing 1; INHBA, inhibin
subunit βa; CBX2, chromobox 2; BEST2, bestrophin 2; CA2, carbonic
anhydrase 2; GCG, glucagon; SLC4A4, solute carrier family 4 member
4; GLDN, gliomedin. |
Discussion
With the exception of patients with a family
history, the majority of cases of CRC are sporadic (22). Although the mortality of this
malignancy has been markedly decreased following the introduction
of routine examinations, its incidence remains high (23). The development of innovative
methods for the early diagnosis and treatment of CRC is essential
(24). Multiple molecular studies
have indicated that complex mechanisms are involved in CRC
pathology; however, studies into the molecular mechanism commonly
focus on individual signaling pathways in their attempt to
determine the mechanism of CRC (25–27).
WGCNA can be used to determine the expression of multiple genes in
large sample datasets; disease analysis using WGCNA can ensure the
investigation examines multiple signaling pathways and decreases
the likelihood of excluding factors within the complex pathological
mechanism (28).
In the present study, WGCNA was conducted in the GEO
dataset GSE87211, and 8 independent modules with classifiable
eigengenes were revealed. Following analyses of the correlations
between modules and disease status, the green module was identified
as the gene cluster most positively correlated with CRC status, and
the brown module as the most negatively correlated.
The green module genes were more enriched in
collagen catabolic process, cell adhesion, ECM organization,
chemotaxis and cell-cell signaling, and participated primarily in
the regulation of the ECM, and the PI3K-Akt and Chemokine signaling
pathways. By contrast, the brown module was negatively correlated
with CRC. Pathway analysis demonstrated that the brown module
contained genes that were involved in the regulation of the
chemokine-mediated signaling pathway, and negative regulation of
growth and steroid metabolic process, which oppose cancer tissue
expansion. CRC is an inflammation-associated type of cancer, and
the chemokine expression pattern in CRC is similar to the cellular
immune response involved in lymphocyte recirculation and the
directed migration of leukocytes into mucosal tissues, which was
consistent with the present results (29). A previous study has revealed that
collective cell invasion of CRC tissue depends on cell-intrinsic
mechanisms, but recently more evidence has indicated that it also
depends on extracellular mechanisms involving bidirectional
interplay between the tumor cell and the tumor environment, such as
the ECM (30). The results of the
present study emphasized the importance of the ECM in cancer. In
addition, the Wnt signaling pathway has been widely studied as an
important CRC pathway; however, its clinical application has a
limited effect, as the pathogenesis of CRC involves other signaling
pathways as well (9). The FDR
value of tumor necrosis factor and Wnt signaling pathways in KEGG
analysis of green module was not statistically significant. This
result indicated that the popular pathway in CRC, Wnt signaling
pathway, was unable to explain the pathological mechanism on its
own. According to screening genes of Cytoscape platform and
survival analysis in GEPIA, a total of 5 hub genes were identified
in the green module, including COL1A1, COL12A1, CTHRC1,
INHBA and CBX2, and 5 hub genes in the brown module,
including BEST2, CA2, GCG, SLC4A4 and GLDN. Survival
analysis indicated that the expression of all 10 hub genes was
significantly associated with the survival of patients with CRC.
The increased expression level of hub genes from the green module
and decreased expression level of hub genes from the brown module
in CRC were both verified by TCGA CRC data.
In light of previous studies, the correlation among
these 7/10 hub genes and CRC have been explored. The ECM, the
PI3K-Akt pathway and nitric oxide pathway served important roles in
tumor initiation, invasion and progression (31,32).
COL1A1 and CA2 genes contribute to ECM and the
PI3K-Akt pathways, and have been reported to be associated with CRC
metastasis (33). The CA2
gene encodes a member of the carbonic anhydrase family, which is
significantly downregulated in the majority of colorectal tumors
and associated with patient survival (34). The CA2 gene has been
demonstrated to be involved in the nitrogen metabolism pathway and
associated with lymph node metastasis in endometrial
adenocarcinoma, and lymph node metastasis in gastric cancer and
regulation of the pH regulatory system (35). Similarly, it has been reported that
CA2 is associated with metastasis in CRC (36). COL1A1 and its homologous
gene COL12A1 were revealed to be involved in ECM
organization, and were identified be significantly upregulated in
patients with CRC, which was consistent with previous studies
(37,38). The CTHRC1 gene encodes an
ECM-associated protein involved in extracellular space and
proteinaceous ECM, which may contribute to tissue repair by
limiting collagen matrix deposition and promoting cell migration
(39). The SLC4A4 gene
affects intracellular pH, which can regulate tumor progression in
the hypoxic and acidic tumor environment (40). As for GLDN, also known as
CRG-L2, it may serve an important role in extracellular
structure or intercellular signaling, and it has been associated
with CRC prognosis (41). The
GCG gene is hypothesized to be involve in the regulation of
incretin synthesis, secretion, inactivation and RET signaling,
while some studies have identified that GCG is downregulated in
both adenomas and CRC tissues (42,43).
Of note, a total of 3 hub genes (INHBA and
CBX2 from the green module, BEST2 from the brown
module) were identified in the present study, which had not been
previously reported to be involved in CRC pathology, to the best of
our knowledge. The INHBA protein belongs to the transforming growth
factor β superfamily, which is associated with several types of
human cancer (44). It has also
been reported that high expression of INHBA gene in CRC may
lead to poor survival (45). With
regard to the CBX2 gene, to the best of our knowledge, there have
been no studies on its association with CRC at present, although a
growing body of evidence has suggested that CBX2 is
overexpressed in breast cancer and advanced prostate cancer
(46). The BEST2 gene, is a
member of the bestrophin gene family of anion channels, which is
mainly expressed in the retinal pigment epithelium and colon
(47). To the best of our
knowledge, there is no published research on the BEST2 gene
in CRC at present.
The present study explored the potential pathogenic
genes of CRC using data mining and data analysis, rather than
focusing on a single signaling pathway. Multiple biological
processes were identified to be involved with CRC progression, and
the obtained hub genes provide a reference point for future
studies. The present study reaffirmed the role of ECM, and the
PI3K-Akt and chemokine signaling pathways in the development of
CRC. To the best of our knowledge, few studies have reported the
role of the INHBA, CBX2 and BEST2 genes in CRC; the
present study highlighted these 3 genes as candidates for research
of the molecular mechanism of CRC. To compensate for the
limitations of a single dataset, another dataset was used for
cross-validation, and the results were also validated in another
public database. To validate the present results, analysis based on
enlarged sample size and molecular research is under preparation.
Further investigation of the molecular mechanism of the identified
hub genes in CRC is recommended.
Acknowledgements
Not applicable.
Funding
This work was supported by the Natural Science
Foundation of Zhejiang Province, China (grant no. LQ18H110001) and
the National Natural Science Foundation of China (grant no.
81802771).
Availability of data and materials
All data generated or analyzed during this study are
included in this published article.
Authors contributions
LC and LW designed the project. LQ contributed to
data analysis and prepared the main manuscript. JZ and NS were
involved in revising the manuscript critically and analyzing the
data. All authors reviewed the manuscript. All authors read and
approved the final manuscript.
Ethics approval and consent to
participate
Not applicable.
Patient consent for publication
Not applicable.
Competing interests
The authors declare that they have no competing
interests.
References
|
1
|
Dekker E, Tanis PJ, Vleugels JLA, Kasi PM
and Wallace MB: Colorectal cancer. Lancet. 394:1467–1480. 2019.
View Article : Google Scholar : PubMed/NCBI
|
|
2
|
Janz T, Lu K, Povlow MR and Urso B: A
review of colorectal cancer detection modalities, stool DNA, and
fecal immunochemistry testing in adults over the age of 50. Cureus.
8:e9312016.PubMed/NCBI
|
|
3
|
Advani S and Kopetz S: Ongoing and future
directions in the management of metastatic colorectal cancer:
Update on clinical trials. J Surg Oncol. 119:642–652. 2019.
View Article : Google Scholar : PubMed/NCBI
|
|
4
|
Muller MF, Ibrahim AE and Arends MJ:
Molecular pathological classification of colorectal cancer.
Virchows Arch. 469:125–134. 2016. View Article : Google Scholar : PubMed/NCBI
|
|
5
|
Marmol I, Sanchez-de-Diego C, Pradilla
Dieste A, Cerrada E and Rodriguez Yoldi MJ: Colorectal carcinoma: A
general overview and future perspectives in colorectal cancer. Int
J Mol Sci. 18:E1972017. View Article : Google Scholar : PubMed/NCBI
|
|
6
|
Pino MS and Chung DC: The chromosomal
instability pathway in colon cancer. Gastroenterology.
138:2059–2072. 2010. View Article : Google Scholar : PubMed/NCBI
|
|
7
|
Cheng X, Xu X, Chen D, Zhao F and Wang W:
Therapeutic potential of targeting the Wnt/β-catenin signaling
pathway in colorectal cancer. Biomed Pharmacother. 110:473–481.
2019. View Article : Google Scholar : PubMed/NCBI
|
|
8
|
Aghabozorgi AS, Bahreyni A, Soleimani A,
Bahrami A, Khazaei M, Ferns GA, Avan A and Hassanian SM: Role of
adenomatous polyposis coli (APC) gene mutations in the pathogenesis
of colorectal cancer; current status and perspectives. Biochimie.
157:64–71. 2019. View Article : Google Scholar : PubMed/NCBI
|
|
9
|
Wang J, Shibayama Y, Zhang A, Ohsaki H,
Asano E, Suzuki Y, Kushida Y, Kobara H, Masaki T, Wang Z and
Nishiyama A: (Pro)renin receptor promotes colorectal cancer through
the Wnt/beta-catenin signalling pathway despite constitutive
pathway component mutations. Br J Cancer. 120:229–237. 2019.
View Article : Google Scholar : PubMed/NCBI
|
|
10
|
Xu M, Liu X, Xu Y, Zhu S and Gao Y:
Co-expression of Axin and APC gene fragments inhibits colorectal
cancer cell growth via regulation of the Wnt signaling pathway. Mol
Med Rep. 16:3783–3790. 2017. View Article : Google Scholar : PubMed/NCBI
|
|
11
|
Su YH, Tang WC, Cheng YW, Sia P, Huang CC,
Lee YC, Jiang HY, Wu MH, Lai IL, Lee JW and Lee KH: Targeting of
multiple oncogenic signaling pathways by Hsp90 inhibitor alone or
in combination with berberine for treatment of colorectal cancer.
Biochim Biophys Acta. 1853:2261–2272. 2015. View Article : Google Scholar : PubMed/NCBI
|
|
12
|
Hu Y, Gaedcke J, Emons G, Beissbarth T,
Grade M, Jo P, Yeager M, Chanock SJ, Wolff H, Camps J, et al:
Colorectal cancer susceptibility loci as predictive markers of
rectal cancer prognosis after surgery. Genes Chromosomes Cancer.
57:140–149. 2018. View Article : Google Scholar : PubMed/NCBI
|
|
13
|
Tsukamoto S, Ishikawa T, Iida S, Ishiguro
M, Mogushi K, Mizushima H, Uetake H, Tanaka H and Sugihara K:
Clinical significance of osteoprotegerin expression in human
colorectal cancer. Clin Cancer Res. 17:2444–2450. 2011. View Article : Google Scholar : PubMed/NCBI
|
|
14
|
Langfelder P and Horvath S: WGCNA: An R
package for weighted correlation network analysis. BMC
Bioinformatics. 9:5592008. View Article : Google Scholar : PubMed/NCBI
|
|
15
|
Ashburner M, Ball CA, Blake JA, Botstein
D, Butler H, Cherry JM, Davis AP, Dolinski K, Dwight SS, Eppig JT,
et al: Gene ontology: Tool for the unification of biology. The Gene
Ontology Consortium. Nat Genet. 25:25–29. 2000. View Article : Google Scholar : PubMed/NCBI
|
|
16
|
Kanehisa M and Goto S: KEGG: Kyoto
encyclopedia of genes and genomes. Nucleic Acids Res. 28:27–30.
2000. View Article : Google Scholar : PubMed/NCBI
|
|
17
|
The Gene Ontology Consortium, . The gene
ontology resource: 20 years and still GOing strong. Nucleic Acids
Res. 47:D330–D338. 2019. View Article : Google Scholar : PubMed/NCBI
|
|
18
|
Shannon P, Markiel A, Ozier O, Baliga NS,
Wang JT, Ramage D, Amin N, Schwikowski B and Ideker T: Cytoscape: A
software environment for integrated models of biomolecular
interaction networks. Genome Res. 13:2498–2504. 2003. View Article : Google Scholar : PubMed/NCBI
|
|
19
|
Ritchie ME, Phipson B, Wu D, Hu Y, Law CW,
Shi W and Smyth GK: Lim ma powers differential expression analyses
for RNA-sequencing and microarray studies. Nucleic Acids Res.
43:e472015. View Article : Google Scholar : PubMed/NCBI
|
|
20
|
Wickham H: ggplot2: Elegant Graphics for
Data Analysis. Springer International Publishing. (New York, NY).
2016.ISBN 978-3-319-24277-4.
|
|
21
|
Tang Z, Li C, Kang B, Gao G, Li C and
Zhang Z: GEPIA: A web server for cancer and normal gene expression
profiling and interactive analyses. Nucleic Acids Res. 45:W98–W102.
2017. View Article : Google Scholar : PubMed/NCBI
|
|
22
|
Fischer J, Walker LC, Robinson BA,
Frizelle FA, Church JM and Eglinton TW: Clinical implications of
the genetics of sporadic colorectal cancer. ANZ J Surg.
89:1224–1229. 2019. View Article : Google Scholar : PubMed/NCBI
|
|
23
|
Maida M, Macaluso FS, Ianiro G, Mangiola
F, Sinagra E, Hold G, Maida C, Cammarota G, Gasbarrini A and
Scarpulla G: Screening of colorectal cancer: Present and future.
Expert Rev Anticancer Ther. 17:1131–1146. 2017. View Article : Google Scholar : PubMed/NCBI
|
|
24
|
Willauer AN, Liu Y, Pereira AAL, Lam M,
Morris JS, Raghav KPS, Morris VK, Menter D, Broaddus R,
Meric-Bernstam F, et al: Clinical and molecular characterization of
early-onset colorectal cancer. Cancer. 125:2002–2010. 2019.
View Article : Google Scholar : PubMed/NCBI
|
|
25
|
Pancione M, Remo A and Colantuoni V:
Genetic and epigenetic events generate multiple pathways in
colorectal cancer progression. Patholog Res Int.
2012:5093482012.PubMed/NCBI
|
|
26
|
Hagland HR, Berg M, Jolma IW, Carlsen A
and Soreide K: Molecular pathways and cellular metabolism in
colorectal cancer. Dig Surg. 30:12–25. 2013. View Article : Google Scholar : PubMed/NCBI
|
|
27
|
Wang W, Kandimalla R, Huang H, Zhu L, Li
Y, Gao F, Goel A and Wang X: Molecular subtyping of colorectal
cancer: Recent progress, new challenges and emerging opportunities.
Semin Cancer Biol. 55:37–52. 2019. View Article : Google Scholar : PubMed/NCBI
|
|
28
|
Liu W, Li L, Ye H and Tu W: Weighted gene
co-expression network analysis in biomedicine research. Sheng Wu
Gong Cheng Xue Bao. 33:1791–1801. 2017.(In Chinese). PubMed/NCBI
|
|
29
|
Roy I, Veldkamp CT, Volkman BF and Dwinell
MB: Chemokines in colitis: MicroRNA control. Gut. 63:1202–1204.
2014. View Article : Google Scholar : PubMed/NCBI
|
|
30
|
Wu JS, Sheng SR, Liang XH and Tang YL: The
role of tumor microenvironment in collective tumor cell invasion.
Future Oncol. 13:991–1002. 2017. View Article : Google Scholar : PubMed/NCBI
|
|
31
|
Mandal P: Insight of nitric oxide
signaling: A potential biomarker with multifaceted complex
mechanism in colorectal carcinogenesis. Biochem Biophys Res Commun.
495:1766–1768. 2018. View Article : Google Scholar : PubMed/NCBI
|
|
32
|
Wu X, Cai J, Zuo Z and Li J: Collagen
facilitates the colorectal cancer stemness and metastasis through
an integrin/PI3K/AKT/Snail signaling pathway. Biomed Pharmacother.
114:1087082019. View Article : Google Scholar : PubMed/NCBI
|
|
33
|
Qi L and Ding Y: Construction of key
signal regulatory network in metastatic colorectal cancer.
Oncotarget. 9:6086–6094. 2018. View Article : Google Scholar : PubMed/NCBI
|
|
34
|
Viikila P, Kivela AJ, Mustonen H,
Koskensalo S, Waheed A, Sly WS, Pastorek J, Pastorekova S, Parkkila
S and Haglund C: Carbonic anhydrase enzymes II, VII, IX and XII in
colorectal carcinomas. World J Gastroenterol. 22:8168–8177. 2016.
View Article : Google Scholar : PubMed/NCBI
|
|
35
|
McDonald PC, Winum JY, Supuran CT and
Dedhar S: Recent developments in targeting carbonic anhydrase IX
for cancer therapeutics. Oncotarget. 3:84–97. 2012. View Article : Google Scholar : PubMed/NCBI
|
|
36
|
Qi C, Hong L, Cheng Z and Yin Q:
Identification of metastasis-associated genes in colorectal cancer
using metaDE and survival analysis. Oncol Lett. 11:568–574. 2016.
View Article : Google Scholar : PubMed/NCBI
|
|
37
|
Zou X, Feng B, Dong T, Yan G, Tan B, Shen
H, Huang A, Zhang X, Zhang M, Yang P, et al: Up-regulation of type
I collagen during tumorigenesis of colorectal cancer revealed by
quantitative proteomic analysis. J Proteomics. 94:473–485. 2013.
View Article : Google Scholar : PubMed/NCBI
|
|
38
|
Mikula M, Rubel T, Karczmarski J, Goryca
K, Dadlez M and Ostrowski J: Integrating proteomic and
transcriptomic high-throughput surveys for search of new biomarkers
of colon tumors. Funct Integr Genomics. 11:215–224. 2011.
View Article : Google Scholar : PubMed/NCBI
|
|
39
|
Yang XM, You HY, Li Q, Ma H, Wang YH,
Zhang YL, Zhu L, Nie HZ, Qin WX, Zhang ZG and Li J: CTHRC1 promotes
human colorectal cancer cell proliferation and invasiveness by
activating Wnt/PCP signaling. Int J Clin Exp Pathol. 8:12793–12801.
2015.PubMed/NCBI
|
|
40
|
Parks SK and Pouyssegur J: The
Na(+)/HCO3(−) co-transporter SLC4A4 plays a role in growth and
migration of colon and breast cancer cells. J Cell Physiol.
230:1954–1963. 2015. View Article : Google Scholar : PubMed/NCBI
|
|
41
|
Chen L, Lu D, Sun K, Xu Y, Hu P, Li X and
Xu F: Identification of biomarkers associated with diagnosis and
prognosis of colorectal cancer patients based on integrated
bioinformatics analysis. Gene. 692:119–125. 2019. View Article : Google Scholar : PubMed/NCBI
|
|
42
|
Spisak S, Kalmar A, Galamb O, Wichmann B,
Sipos F, Peterfia B, Csabai I, Kovalszky I, Semsey S, Tulassay Z
and Molnár B: Genome-wide screening of genes regulated by DNA
methylation in colon cancer development. PLoS One. 7:e462152012.
View Article : Google Scholar : PubMed/NCBI
|
|
43
|
Wu Z, Liu Z, Ge W, Shou J, You L, Pan H
and Han W: Analysis of potential genes and pathways associated with
the colorectal normal mucosa-adenoma-carcinoma sequence. Cancer
Med. 7:2555–2566. 2018. View Article : Google Scholar : PubMed/NCBI
|
|
44
|
Okano M, Yamamoto H, Ohkuma H, Kano Y, Kim
H, Nishikawa S, Konno M, Kawamoto K, Haraguchi N, Takemasa I, et
al: Significance of INHBA expression in human colorectal cancer.
Oncol Rep. 30:2903–2908. 2013. View Article : Google Scholar : PubMed/NCBI
|
|
45
|
Yokota M, Kojima M, Higuchi Y, Nishizawa
Y, Kobayashi A, Ito M, Saito N and Ochiai A: Gene expression
profile in the activation of subperitoneal fibroblasts reflects
prognosis of patients with colon cancer. Int J Cancer.
138:1422–1431. 2016. View Article : Google Scholar : PubMed/NCBI
|
|
46
|
Clermont PL, Crea F, Chiang YT, Lin D,
Zhang A, Wang JZ, Parolia A, Wu R, Xue H, Wang Y, et al:
Identification of the epigenetic reader CBX2 as a potential drug
target in advanced prostate cancer. Clin Epigenetics. 8:162016.
View Article : Google Scholar : PubMed/NCBI
|
|
47
|
Yu K, Lujan R, Marmorstein A, Gabriel S
and Hartzell HC: Bestrophin-2 mediates bicarbonate transport by
goblet cells in mouse colon. J Clin Invest. 120:1722–1735. 2010.
View Article : Google Scholar : PubMed/NCBI
|