Introduction
At present, transplantation is the best treatment
for end-stage renal disease. Survival and quality of life among
transplant patients are significantly better than in dialysis
patients (1). Despite the routine
use of immunosuppressive therapies in the care of post-transplant
patients, acute rejection (AR) of the renal allograft still occurs.
Sensitive and early detection of AR episodes in patients with renal
transplant is essential to preserve allograft function. The
majority of patients with AR are asymptomatic and the detection of
AR critically relies on regular monitoring for increases in serum
creatinine, an insensitive laboratory biomarker of renal injury, as
a sign of renal hypofunction (2,3). The
current best practice for diagnosis of AR is renal biopsy, but this
is invasive, time-consuming, costly and inconvenient. Therefore,
noninvasive and sensitive methods would be valuable for the early
detection of AR.
Biomarkers may be used for noninvasive prediction or
diagnosis of AR in patients with kidney transplantation (4). Suitable candidate biomarker(s) should
be based on a simple and cost-effective assay, requiring the
noninvasive collection of a test sample, yet it should be specific
and sensitive, as the results may prolong graft survival and
improve patient health. Proteomics have been widely employed in
numerous fields of medical research (5–7). It
is an interdisciplinary area for the discovery of candidate
biomarkers that may be applied for noninvasive diagnoses.
Isobaric tags for relative and absolute quantitation
(iTRAQ) is a multiplexed protein quantitative mass spectrometry
(MS) technology based on isobaric reagents (8). It may be used to measure eight
samples in one experiment (9). The
iTRAQ reagent consists of a reporter group, a balance group and a
peptide reactive group (PRG) (8).
The reporter group ions that are generated appear as peaks in the
low-mass region (113, 114, 115, 116, 117, 118, 119 and 121 Da)
(10,11). As this region is free of other
common fragment ions, signals found in this region are only due to
contributions from the reporter ions from the corresponding labeled
sample digests (12). Therefore,
the relationships can be quantified by comparing the peak area of
one reporter group peak with another. The ratio of one peak area to
another represents the relative amount of a given peptide in each
of the corresponding sample digests (12). The balance group ensures that an
iTRAQ reagent-labeled peptide, whether labeled with iTRAQ reagent
114, 115, 116 or 117, displays at the same mass (12). The PRG covalently links an iTRAQ
reagent isobaric tag with each lysine side chain and N-terminal
group of a peptide. Multiple peptides in a sample digest are
labeled (12). The advantage of
iTRAQ is that it allows for concurrent quantization of complex
samples but requires only a small amount of sample (13). Previous studies have indicated that
quantitative proteomics using iTRAQ technology has the potential
for diagnosis and treatment with AR after kidney transplantation
(14,15). Therefore, the present study
performed a quantitative proteomic analysis with an iTRAQ-based
liquid chromatography electrospray ionization tandem MS
(LC-ESI-MS/MS) approach to detect proteins differentially expressed
in the serum of patients with AR and healthy individuals with no
kidney transplant. Insight from the present study may help advance
the understanding of the pathogenic mechanisms of AR and identify
potential novel approaches for early diagnosis of AR.
Materials and methods
Serum sample collection
A total of 12 subjects, including patients with AR
(1 male and 2 females; age, 51–61 years) and 9 age and gender
matched healthy controls (6 males and 3 females; age, 40–55 years)
were enrolled in the present study. All healthy controls were
enrolled from the Guilin No. 924 Hospital (Guilin, China), with no
prior history of chronic disease. Their characteristics are listed
in Table I. The primary disease of
the patients with AR was chronic glomerulonephritis. All patients
with AR had received hemodialysis for >2 years prior to kidney
transplantation and had no infectious diseases (such as hepatitis
or tuberculosis) or autoimmune diseases. All kidney grafts were
from donation after cardiac death of the donors and the patients
had no history of organ transplantation. All patients with AR
received tacrolimus, methylprednisolone and mycophenolate mofetil,
to maintain triple immunosuppressive therapy. None of the subjects
had a history of smoking or drinking. Serum specimens were
collected from the Department of Nephrology at Guilin No. 924
Hospital (Guilin, China) between March and September in 2015. The
study was performed in accordance with the Declaration of Helsinki
and was approved by the Medical Ethics Committee of Guilin No. 924
Hospital (Guilin, China). Written informed consent was obtained
from all participants. The serum samples (5 ml) were collected in
serum separator Vacutainer tubes and were separated by
centrifugation at 250 × g at 20°C for 10 min. Serum was divided
into 0.5-ml aliquots and stored at −80°C until further
analysis.
 | Table I.Basic characteristics of patients and
healthy controls. |
Table I.
Basic characteristics of patients and
healthy controls.
| Characteristic | Patients with acute
rejection (n=3) | Healthy controls
(n=9) |
|---|
| Gender
(male/female) | 1/2 | 7/2 |
| Age (years) | 53.0±7.2 | 47.3±5.3 |
| Serum creatinine
(µmol/l) (42–130 µmol/la) | 222.7±82.5 | 89.4±10.3 |
| Blood urea nitrogen
(mmol/l) (2.5-8.2 mmol/la) | 20.3±4.9 | 4.6±0.8 |
| Uric acid (µmol/l)
(male, 208–440 mmol/l; female, 155–360 mmol/la) | 410.7±81.3 | 346.0±84.7 |
Protein preparation and tryptic
digestion
Serum samples were disrupted in lysis buffer (7 M
urea, 2 M thiourea, 0.2% SDS, 20 mM Tris) with enzyme inhibitors
(1X protease inhibitor Cocktail, 1 mM EDTA). After centrifuging the
mixtures at 25,000 × g at 4°C for 20 min, the supernatants were
mixed with 5 volumes of cold acetone and stored at −20°C for 2 h to
overnight. The mixtures were centrifuged at 25,000 × g for 20 min
at 4°C, and the protein pellets were dissolved with lysis buffer,
to which 10 mM dithiothreitol was added, prior to incubation at
56°C for 1 h in order to reduce the disulfide bonds of peptides.
Then 55 mM iodoacetamide was added to the solution prior to storage
in the dark for 45 min, followed by addition of 5 volumes of
chilled acetone and storage at −20°C for 2 h. The solution was
centrifuged at 25,000 × g for 20 min at 4°C and the pellet was
dissolved with lysis buffer to obtain the protein solution. The
protein concentration of the supernatant was determined with the
Bradford assay method.
For each sample, 100 µg protein was digested with
Trypsin Gold at a ratio of protein/trypsin of 20:1 at 37°C for 4 h.
Fresh Trypsin Gold was added with the ratio of protein/trypsin of
20:1 again and the mixture was incubated at 37°C for an additional
8 h.
iTRAQ labelling and peptide
fractionation
The peptides were vacuum centrifuged to dryness
after trypsin digestion. The product was redissolved with 0.5 M
triethylammonium bicarbonate and the iTRAQ labelling of peptide
samples was performed using iTRAQ Reagent 8-plex kit (AB SCIEX) in
accordance with the manufacturer's protocol. The peptides of the
healthy controls were labelled with iTRAQ-113 isobaric tags and
those from patients with AR with iTRAQ-121 isobaric tags and
incubated for 2 h at 20°C. The iTRAQ-labelled peptides were
fractionated using reversed-phase (RP) chromatography.
For RP chromatography using a Shimadzu LC-20AB HPLC
Pump system (Shimadzu Corp.), 100 µg digested peptides were
reconstituted with 2 ml buffer A [5% acetonitrile (ACN), 95%
H2O, adjusted to pH 9.8 with ammonia] and loaded onto a
4.6×250 mm Gemini C18 column containing 5-µm particles
(Phenomenex Inc.). The peptides were eluted at 20°C at a flow rate
of 1 ml/min with a gradient of 5% buffer B (5% H2O, 95%
ACN, adjusted to 9.8 with ammonia) for 10 min, followed by a 5–35%
buffer B gradient for 40 min and a 35–95% buffer B gradient for 1
min. The system was maintained in 95% buffer B for 3 min, which was
switched to 5% within 1 min prior to equilibrating with 5% buffer B
for 10 min. Elution was monitored by measuring the absorbance at
214 nm and a different vial was used every min. The eluted peptides
in 20 fractions were pooled and vacuum-dried.
LC-ESI-MS/MS analysis
Each fraction was resuspended in buffer A [5% ACN,
0.1% formic acid (FA)] and centrifuged at 20,000 × g for 10 min at
4°C, and the final concentration of peptides was ~0.5 g/l. The
supernatant was loaded on a LC-20AD nanoHPLC (Shimadzu Corp.) by an
autosampler onto a 2-cm C18 trap column. The peptides
were purified using an 18-cm analytical C18 column
(inner diameter 75 µm, packed in-house). The samples were loaded
and elution was performed in the following order: 8 µl/min for 4
min, 41 min gradient running at 300 nl/min from 5 to 35% B (95%
ACN, 0.1% FA), 5 min linear gradient to 80% buffer B (maintained
for 5 min), followed by a return to 5% within 1 min.
Data acquisition was performed with a TripleTOF 5600
System (AB SCIEX) fitted with a Nanospray III source (AB SCIEX) and
a pulled quartz tip as the emitter (New Objectives), and controlled
with Analyst 1.6 software (AB SCIEX). Data were acquired under the
following MS conditions: Ion spray voltage, 2.5 kV; curtain gas, 30
psi; nebulizer gas, 15 psi; and interface heater temperature,
150°C. The resolution was ~30,000. For information-dependent
acquisition, survey scans were acquired at 250 msec and 30
production scans were collected if exceeding a threshold of 120
counts/sec and with a 2+ to 5+ charge state. The total cycle time
was set to 3.3 sec. The Q2 transmission window was 100 Da for 100%.
A total of four time bins for each scan was performed at a pulse
frequency value of 11 kHz through monitoring of the 40 GHz
multichannel TDC detector with four-anode channel detection. An
iTRAQ adjust rolling collision energy was applied to all precursor
ions for collision-induced dissociation. The dynamic exclusion set
for 1/2 of peak width (15 sec).
Proteomics data analysis
After separating the peptides, identification and
quantification of detected proteins were performed. The MS/MS
spectra were searched using Mascot software (version 2.3.02; Matrix
Science, Ltd.). For protein identification, the search parameters
were as follows: Fragment mass tolerance of 0.1 Da, peptide mass
tolerance of 0.05 Da, MS/MS Ion as the type of search, trypsin as
the enzyme, mass values of monoisotopic, variable modifications of
iTRAQ8plex (Y) and oxidation (M), fixed modifications of iTRAQ8plex
(K), iTRAQ8plex (N-term) and carbamidomethyl (C) and database of
human201512 (132,191 sequences). Protein identifications were
considered reliable if they involved at least one unique peptide.
An automated software called IQuant (16) was used for quantitatively analyzing
the labeled peptides with isobaric tags. It integrates Mascot
Percolator (17) and advanced
statistical algorithms to process the MS/MS signals generated from
the peptides labeled by isobaric tags. The main IQuant quantitation
parameters were as follows: Quant_peptide of all unique peptides,
Quant_number of at least one unique spectrum, Variance
stabilization normalization, Protein_Ratio of weighted average and
permutation tests as Statistical Analysis. High-confidence peptide
identification was obtained by setting a false discovery rate of
<1% at the peptide level. At least one unique peptide per
protein group was required for identification of proteins and two
quantified peptides for quantification of proteins. Functional
enrichment analysis was performed using the Clusters of Orthologous
Groups of proteins (COGs) (https://www.ncbi.nlm.nih.gov/COG) and the Gene
Ontology (GO) (http://www.geneontology.org/) database. Pathway
analysis was also performed by Kyoto Encyclopedia of Genes and
Genomes (KEGG) mapping (http://www.genome.jp/kegg/). For biological pathway
analysis and GO term enrichment, P<0.05 was considered to
indicate a statistically significant difference.
Results
Protein identification and
quantification
Using Mascot Percolator (17), 1,399 proteins were identified and
quantified with the cutoff of Q≤0.01 (Table SI). A total of 604 identified
proteins contained >1 peptide, including 259 proteins with ≥5
peptides, 63 proteins with 4 peptides, 95 proteins with 3 peptides
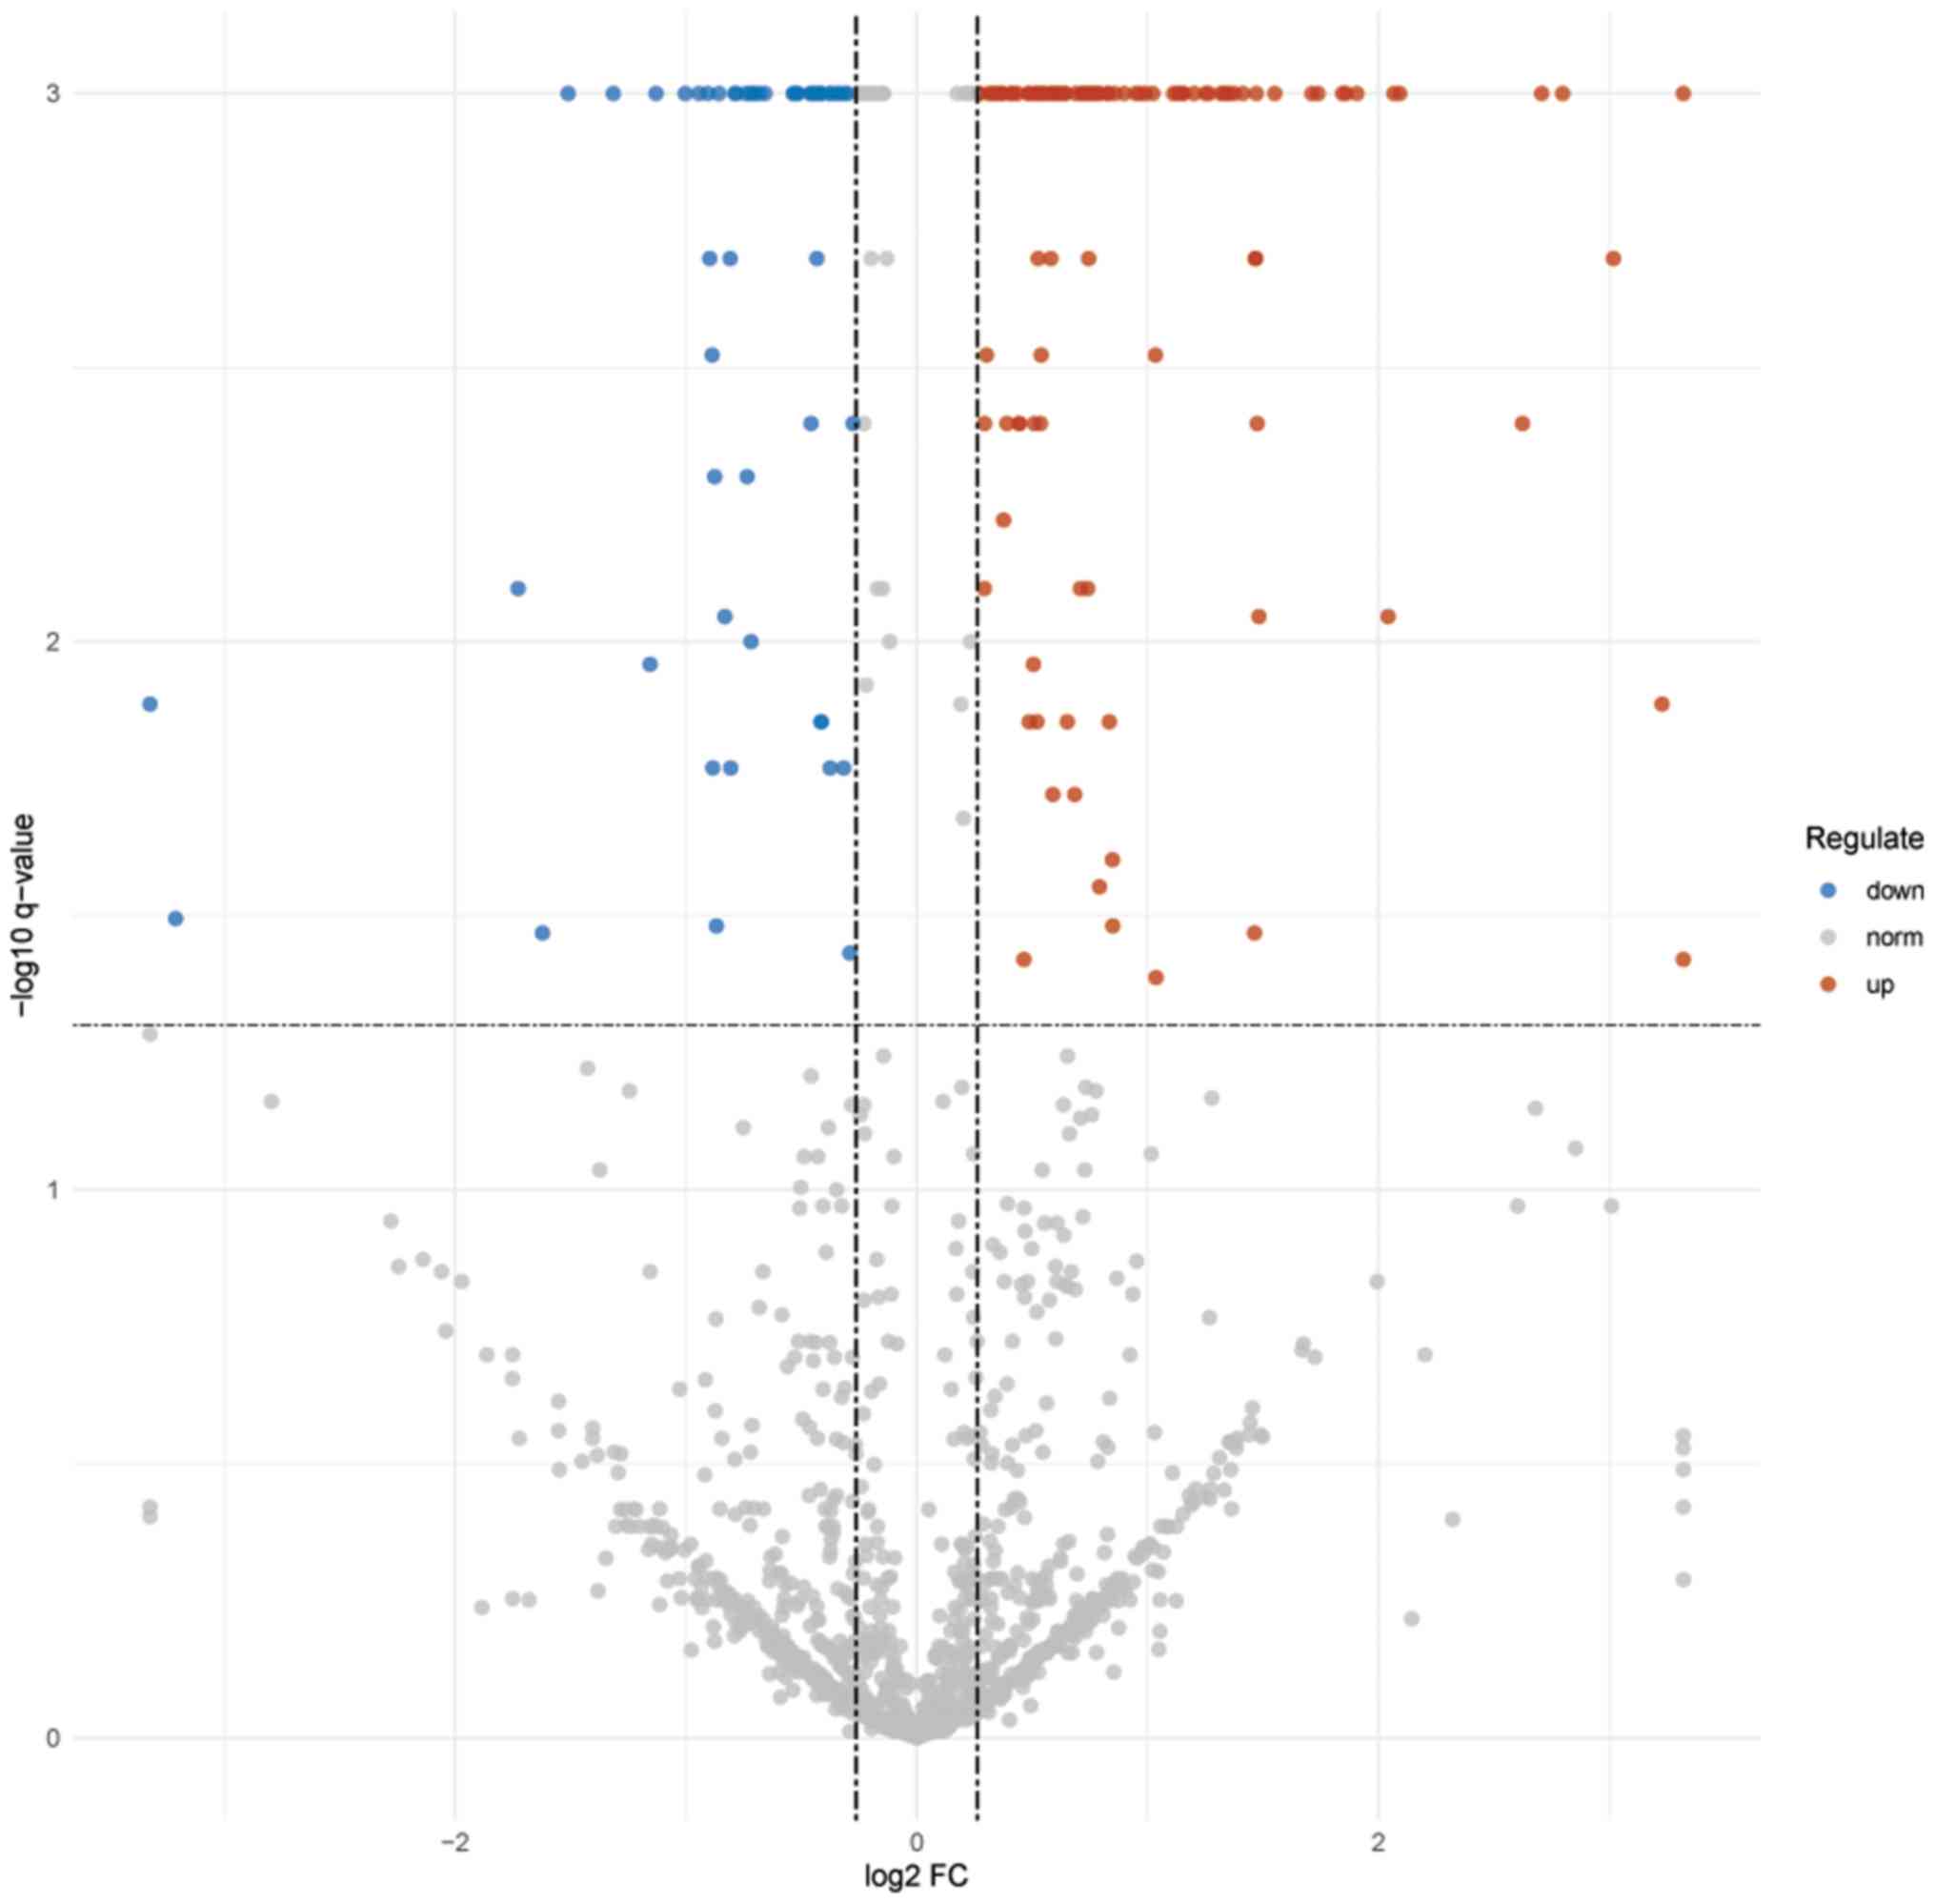
and 187 proteins with 2 peptides. Using a strict cut-off of a
1.2-fold change in expression and Q<0.05, 109 proteins
[including 72 upregulated proteins (Tables II and SII) and 37 downregulated proteins
(Tables III and SIII)] were found differentially
expressed in AR specimens compared with those in the control
samples. As presented in Fig. 1, a
volcano plot of the log2 fold-change (x-axis) vs. -log10 Q-value
(y-axis) was used to depict the differentially expressed proteins
(DEPs).
| Table II.Upregulated proteins in patients with
acute rejection and control subjects. |
Table II.
Upregulated proteins in patients with
acute rejection and control subjects.
| Protein | Description | Protein coverage
(%) | Unique
peptides | Q-value |
|---|
| P35908 | Keratin, type II
cytoskeletal 2 epidermal | 22.8 | 9 | 0.004 |
| P02741 | C-reactive
protein | 43.3 | 9 | 0.001 |
| Q14520 | Hyaluronan-binding
protein 2 | 19.6 | 10 | 0.001 |
| P27918 | Properdin | 25.4 | 8 | 0.001 |
| Q7L523 | Ras-related
GTP-binding protein A | 1.9 | 1 | 0.001 |
| Q53G71 | Calreticulin
variant (fragment) | 35.2 | 10 | 0.001 |
| P10645 | Chromogranin-A | 9.4 | 1 | 0.001 |
| Q1HP67 | Lipoprotein,
Lp(A) | 6.2 | 10 | 0.001 |
| B4DUV1 | Fibulin-1 | 40.1 | 7 | 0.001 |
| K7ER74 | Protein
APOC4-APOC2 | 55.6 | 5 | 0.001 |
| P12259 | Coagulation factor
V | 25.9 | 46 | 0.001 |
| P08311 | Cathepsin G | 26.7 | 6 | 0.001 |
| P04004 | Vitronectin | 57.5 | 16 | 0.001 |
| F5H6X6 | Neutral
alpha-glucosidase AB | 14.0 | 9 | 0.036 |
| P13645 | Keratin, type I
cytoskeletal 10 | 35.6 | 12 | 0.001 |
| P02790 | Hemopexin | 41.6 | 15 | 0.001 |
| P69905 | Alpha-2 globin
chain | 67.6 | 7 | 0.001 |
| Q12794 | Hyaluronidase | 26.4 | 7 | 0.001 |
| P20742 | Pregnancy zone
protein | 29.8 | 25 | 0.001 |
| A0A0C4DH43 | Uncharacterized
protein (Fragment) | 36.1 | 1 | 0.007 |
| H6VRG3 | Keratin 1 | 43.9 | 1 | 0.001 |
| P03950 | Ribonuclease A
A1 | 44.9 | 6 | 0.001 |
| P00450 | CP protein | 49.7 | 32 | 0.001 |
| D6RF35 | Vitamin D-binding
protein | 65.5 | 2 | 0.004 |
| P02675 | Epididymis
secretory sperm binding protein Li 78p | 67.2 | 22 | 0.001 |
| B4E380 | Histone H3 | 11.5 | 2 | 0.009 |
| P14618 | Pyruvate
kinase | 46.9 | 4 | 0.001 |
| B2RDW0 | cDNA, FLJ96792,
highly similar to Homo sapiens calmodulin 2 (phosphorylase
kinase, delta), mRNA | 53.0 | 5 | 0.038 |
| P00734 | Prothrombin | 93.2 | 36 | 0.001 |
| Q5NV62 | V3-4 protein
(fragment) | 18.2 | 1 | 0.001 |
| P01008 | Serpin peptidase
inhibitor, clade C (antithrombin), member 1, isoform CRA_a | 89.4 | 23 | 0.001 |
| P02656 | Apolipoprotein
C-III | 99.9 | 9 | 0.001 |
| P00451 | Coagulation factor
VIII | 10.3 | 13 | 0.001 |
| Q96IY4 | Carboxypeptidase
B2 | 25.8 | 11 | 0.001 |
| P61626 | C-type
lysozyme | 52.0 | 3 | 0.001 |
| Q8WVW5 | Putative
uncharacterized protein (fragment) | 65.8 | 5 | 0.001 |
| P62805 | Histone H4 | 69.9 | 7 | 0.001 |
| Q15113 | Procollagen
C-endopeptidase enhancer 1 | 41.4 | 12 | 0.001 |
| P34096 | Full-length cDNA
clone CS0DF032YM23 of fetal brain of Homo sapiens
(human) | 55.1 | 6 | 0.001 |
| B0YIW1 | Apolipoprotein A-V
variant 3 | 37.7 | 11 | 0.001 |
| B2R773 | cDNA, FLJ93312,
highly similar to Homo sapiens adipose most abundant gene
transcript 1, mRNA | 19.3 | 3 | 0.001 |
| P68871 | Hemoglobin,
beta | 84.4 | 2 | 0.004 |
| G8JLA2 | Myosin light
polypeptide 6 | 33.6 | 5 | 0.002 |
| P35527 | Keratin, type I
cytoskeletal 9 | 31.0 | 14 | 0.001 |
| O00391 | Sulfhydryl oxidase
1 | 46.7 | 28 | 0.001 |
| B2R9V7 | Superoxide
dismutase [Cu-Zn] | 17.1 | 4 | 0.001 |
| F2RM37 | Coagulation factor
IX | 32.1 | 12 | 0.001 |
| P08670 | Epididymis luminal
protein 113 | 27.3 | 8 | 0.001 |
| Q6N095 | Putative
uncharacterized protein DKFZp686K03196 | 37.7 | 1 | 0.002 |
| P55056 | Apolipoprotein
C-IV | 52.8 | 5 | 0.001 |
| P02649 | Apolipoprotein
E |
100 | 9 | 0.001 |
| P13798 |
N-acylaminoacyl-peptide hydrolase, isoform
CRA_b | 10.2 | 7 | 0.003 |
| P23142 | Fibulin-1 | 31.7 | 7 | 0.001 |
| B3KRF9 | cDNA FLJ34156 fis,
clone FCBBF3013266, highly similar to Tsukushi (leucine-rich
repeat-containing protein 54) | 31.2 | 7 | 0.037 |
| Q8NG19 | Multi-functional
protein MFP | 33.7 | 7 | 0.004 |
| Q86UD1 | Out at first
protein homolog | 31.1 | 6 | 0.001 |
| C9JEU5 | Fibrinogen gamma
chain | 31.5 | 2 | 0.019 |
| P20160 | Azurocidin | 22.3 | 5 | 0.040 |
| P55072 | Epididymis luminal
protein 220 | 33.7 | 6 | 0.001 |
| B2RA39 | cDNA, FLJ94686,
highly similar to Homo sapiens complement factor H-related
5, mRNA | 17.6 | 9 | 0.001 |
| A0A075B785 | LisH domain and
HEAT repeat-containing protein KIAA1468 | 1.2 | 1 | 0.003 |
| P02671 | Fibrinogen alpha
chain | 30.7 | 15 | 0.003 |
| P04406 | GAPDH | 57.0 | 14 | 0.001 |
| P11586 |
C-1-tetrahydrofolate synthase,
cytoplasmic | 6.1 | 5 | 0.017 |
| Q02818 | Nucleobindin-1 | 25.4 | 9 | 0.006 |
| P05164 |
Myeloperoxidase | 64.0 | 31 | 0.001 |
| B3KQ20 | cDNA FLJ32635 fis,
clone SYNOV2000178, highly similar to Proteoglycan-4 | 34.6 | 13 | 0.001 |
| A0A024R7F1 | Protein kinase C
substrate 80K-H, isoform CRA_a | 14.0 | 6 | 0.007 |
| H9KV75 |
Alpha-actinin-1 | 26.5 | 9 | 0.001 |
| B4DWH0 | cDNA FLJ55670,
highly similar to EGF-containing fibulin-like extracellular matrix
protein 1 | 42.9 | 10 | 0.001 |
| Q13103 | Secreted
phosphoprotein 24 | 32.2 | 6 | 0.001 |
| Q9UBX5 | Fibulin 5, isoform
CRA_b | 14.1 | 6 | 0.017 |
| Table III.Downregulated proteins in patients
with acute rejection and control subjects. |
Table III.
Downregulated proteins in patients
with acute rejection and control subjects.
| Protein | Description | Protein coverage
(%) | Unique
peptides | Q-value |
|---|
| B4DRV4 | cDNA FLJ55667,
highly similar to secreted protein acidic and rich in cysteine | 44.8 | 7 | 0.001 |
| H7C3N9 | Leucine-rich repeat
flightless-interacting protein 2 (fragment) | 8.2 | 1 | 0.036 |
| Q71M29 | Putative
uncharacterized protein FP3420 | 4.3 | 1 | 0.027 |
| P05109 | Protein
S100-A8 | 11.8 | 1 | 0.032 |
| P22792 | Carboxypeptidase N
subunit 2 | 27.2 | 11 | 0.001 |
| D3JV43 | C-X-C motif
chemokine (fragment) | 35.3 | 2 | 0.027 |
| B2R8I2 | cDNA, FLJ93914,
highly similar to Homo sapiens histidine-rich glycoprotein,
mRNA | 36.0 | 2 | 0.033 |
| B4DPP8 | cDNA FLJ53075,
highly similar to kininogen-1 | 44.1 | 16 | 0.001 |
| P02765 |
Alpha-2-HS-glycoprotein | 39.5 | 8 | 0.001 |
| Q6MZL2 | Putative
uncharacterized protein DKFZp686M0562 (fragment) | 28.0 | 4 | 0.001 |
| P00739 | Haptoglobin-related
protein | 72.1 | 9 | 0.016 |
| P09871 | Complement C1s
subcomponent | 37.9 | 18 | 0.001 |
| P06396 | Gelsolin | 35.2 | 1 | 0.001 |
| Q9UNU2 | Complement protein
C4B frameshift mutant (fragment) | 61.6 | 1 | 0.038 |
| P27169 | Serum
paraoxonase/arylesterase 1 | 52.1 | 11 | 0.001 |
| A4D1F6 | Leucine-rich repeat
and death domain-containing protein 1 | 0.7 | 1 | 0.017 |
| P02760 | Protein AMBP | 33.0 | 8 | 0.001 |
| F5GXQ5 | Glycine
N-acyltransferase-like protein 3 (fragment) | 3.2 | 1 | 0.001 |
| O95445 | Apolipoprotein
M | 60.1 | 6 | 0.001 |
| O43866 | CD5
antigen-like | 43.5 | 13 | 0.001 |
| V9H1C1 | Gelsolin exon 4
(fragment) | 46.4 | 1 | 0.017 |
| F1C4A7 | Monocyte
differentiation antigen CD14 | 29.6 | 9 | 0.020 |
| P01024 | Epididymis
secretory sperm binding protein Li 62p | 87.9 | 98 | 0.001 |
| Q5T985 | Inter-alpha-trypsin
inhibitor heavy chain H2 | 44.4 | 31 | 0.001 |
| B7Z539 | cDNA FLJ56954,
highly similar to Inter-alpha-trypsin inhibitor heavy chain H1 | 49.9 | 2 | 0.011 |
| B2R815 | cDNA, FLJ93695,
highly similar to Homo sapiens serpin peptidase inhibitor,
clade A (alpha-1 antiproteinase, antitrypsin), member 4, mRNA | 37.9 | 14 | 0.001 |
| A0A0A0MSP7 | FERM and PDZ
domain-containing protein 3 (fragment) | 0.3 | 1 | 0.010 |
| P80108 |
Phosphatidylinositol-glycan-specific
phospholipase D | 38.1 | 24 | 0.001 |
| P02652 | Apolipoprotein
A-II | 99.9 | 8 | 0.001 |
| P51884 | Lumican | 32.2 | 9 | 0.001 |
| B4DU16 | cDNA FLJ54550,
highly similar to Homo sapiens fibronectin 1, transcript
variant 6, mRNA | 78.7 | 1 | 0.004 |
| Q96PD5 |
N-acetylmuramoyl-L-alanine amidase | 35.1 | 10 | 0.001 |
| A0A087WXI2 | IgGFc-binding
protein | 2.6 | 9 | 0.010 |
| P01031 | Complement C5 | 50.1 | 69 | 0.001 |
| P15169 | Carboxypeptidase N
catalytic chain | 24.0 | 8 | 0.010 |
| A0A024R462 | Fibronectin 1,
isoform CRA_n | 69.7 | 50 | 0.001 |
| A8K1K1 | cDNA FLJ76342,
highly similar to Homo sapiens carnosine dipeptidase 1
(metallopeptidase M20 family), mRNA | 42.8 | 17 | 0.001 |
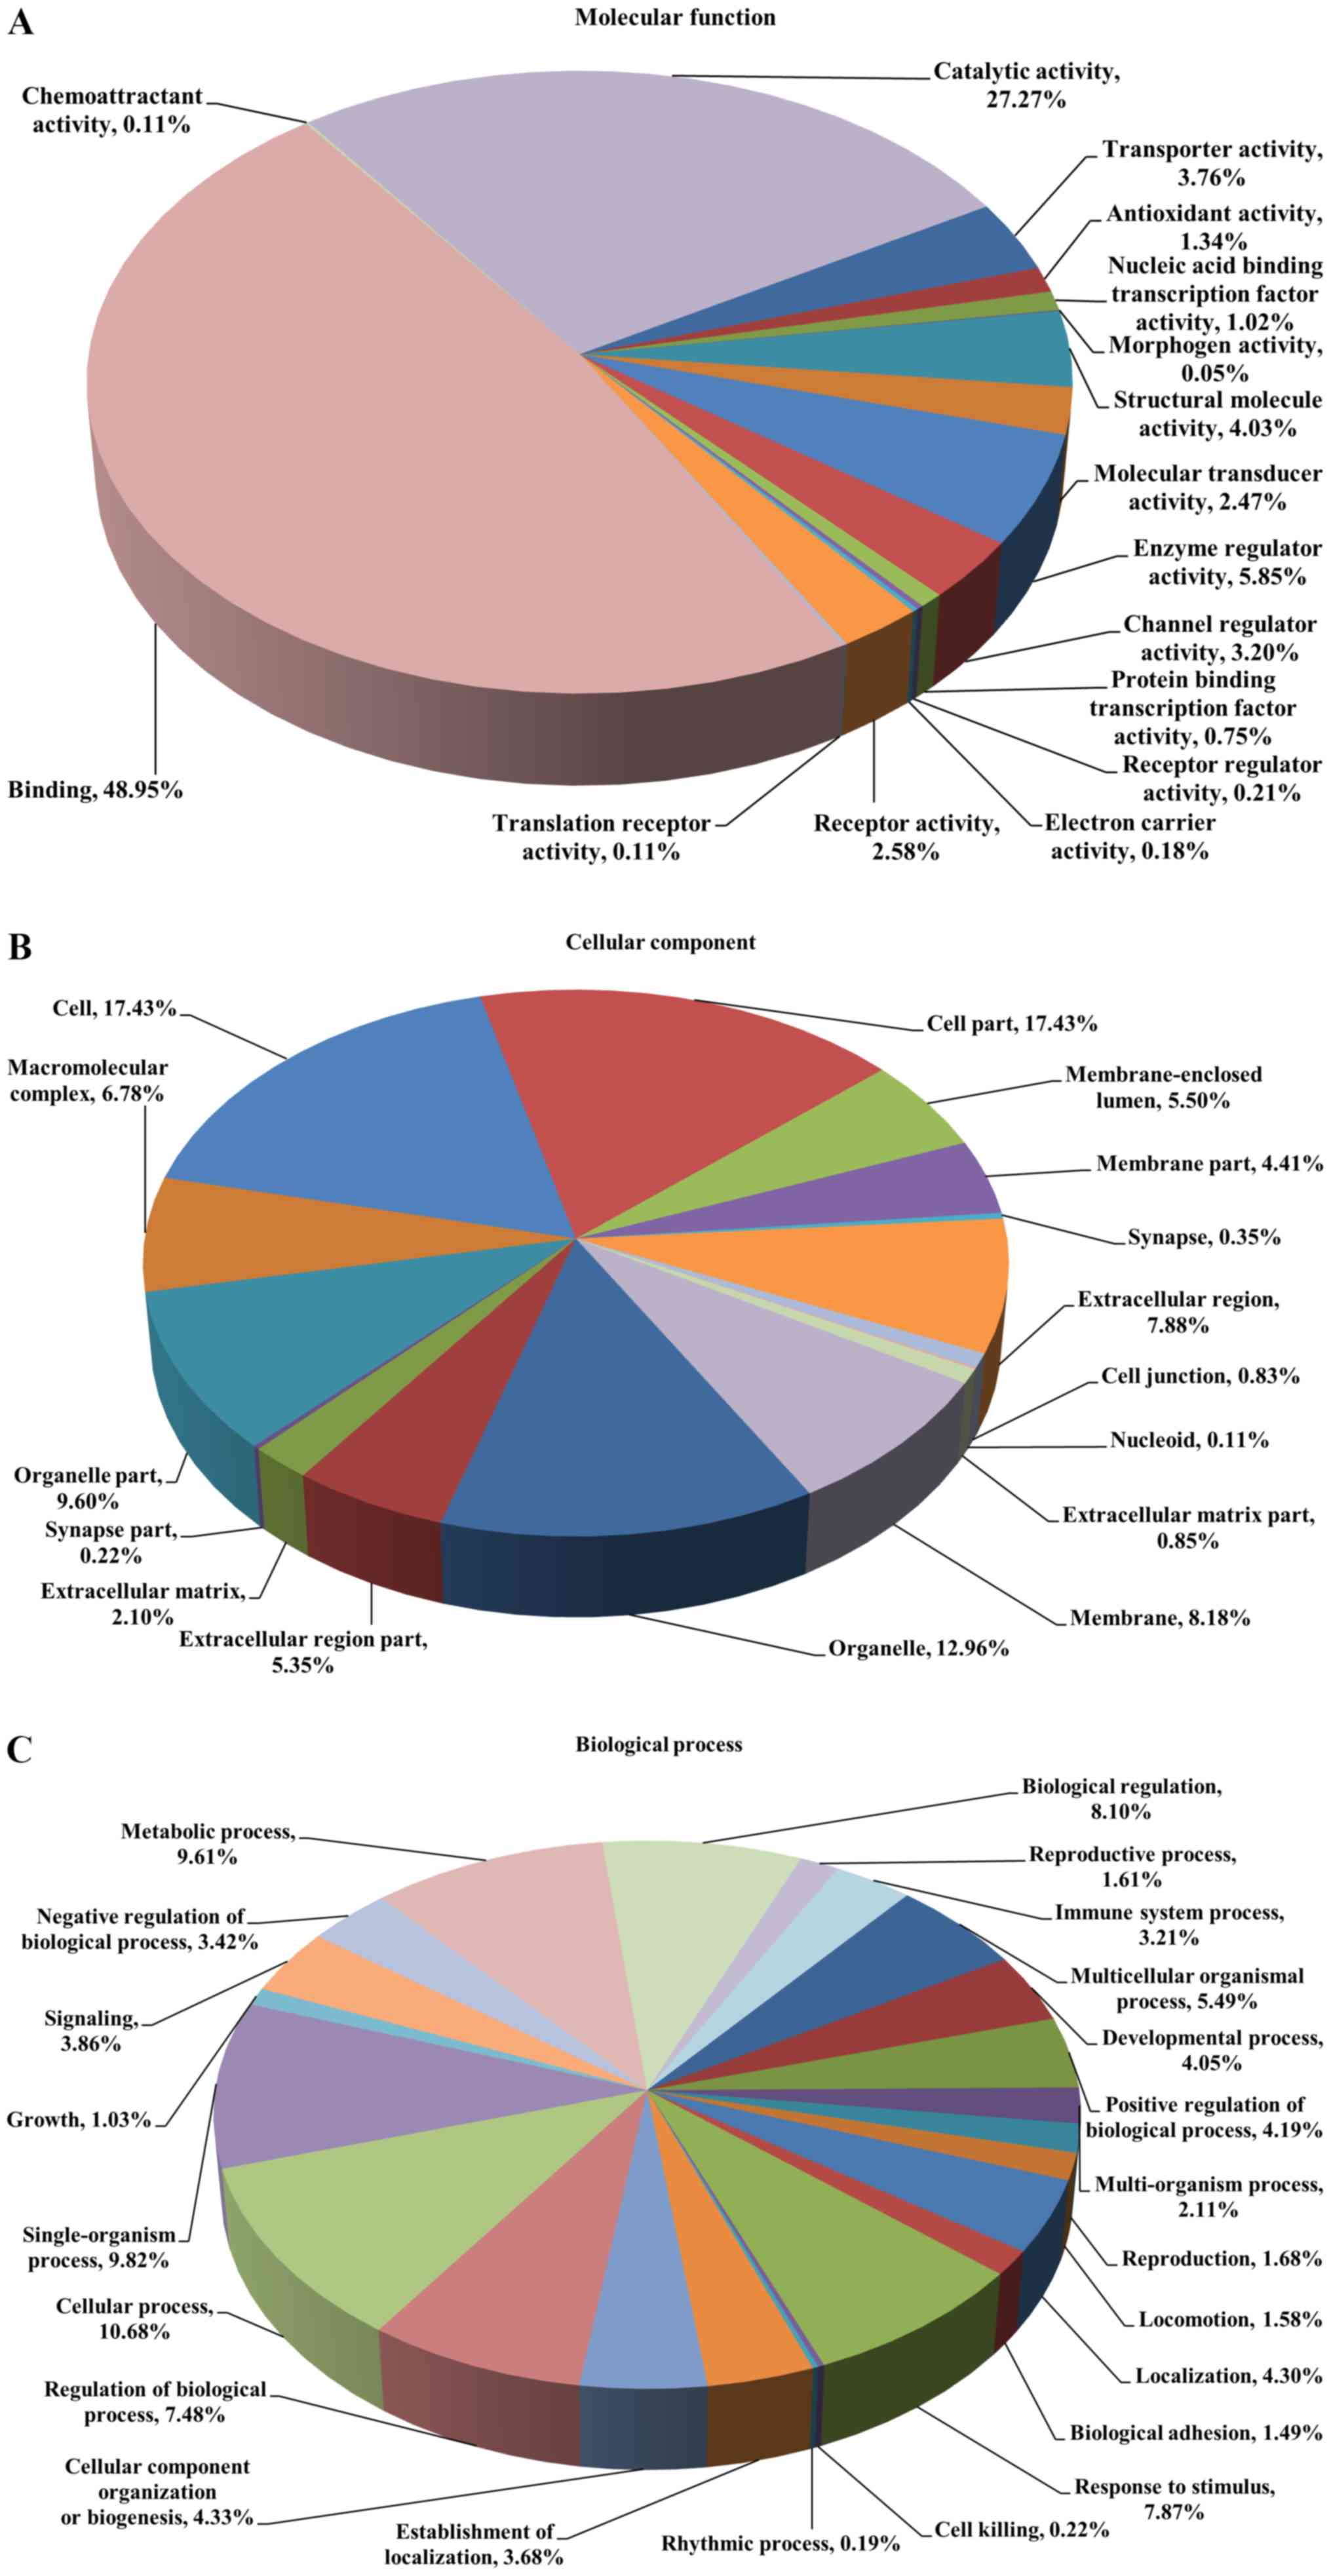
Gene ontology analysis
These DEPs were analyzed by GO annotation and
categorized into ‘molecular function’, ‘cellular component’ and
‘biological process’. ‘Molecular function’ describes activities,
such as catalysis or binding, that occur at the molecular level. In
this category, the proteins were indicated to be involved in 16
terms, including binding activity (48.95%), catalytic activity
(27.27%), enzyme regulator activity (5.85%) and structural molecule
activity (4.03%; Fig. 2A). In the
category ‘cellular component’, the proteins were enriched in 16
terms and the majority of them were located in the cell part
(17.43%), cell (17.43%), organelle (12.96%) and organelle part
(9.60%; Fig. 2B). In the category
‘biological process’, 23 terms were enriched, with 10.68% of the
proteins participating in the cellular process, followed by
single-organism process (9.82%), metabolic process (9.61%) and
biological regulation (8.10%; Fig.
2C).
COG analysis
COGs were delineated by comparing protein sequences
encoded in complete genomes, representing major phylogenetic
lineages. COGs comprise a framework for functional and evolutionary
genome analysis. In the analysis of COGs, all identified proteins
were classified into 23 functional categories (Table IV), including posttranslational
modification, protein turnover, chaperones (149 proteins, 20.67%),
general function prediction only (119 proteins, 16.50%), energy
production and conversion (56 proteins, 7.77%) and signal
transduction mechanisms (47 proteins, 6.52%).
| Table IV.Protein number for each Cluster of
Orthologous Groups of proteins function category. |
Table IV.
Protein number for each Cluster of
Orthologous Groups of proteins function category.
| Code | Functional
category | Number of
proteins |
|---|
| A | RNA processing and
modification | 1 |
| B | Chromatin structure
and dynamics | 9 |
| C | Energy production
and conversion | 56 |
| D | Cell cycle control,
cell division, chromosome partitioning | 19 |
| E | Amino acid
transport and metabolism | 42 |
| F | Nucleotide
transport and metabolism | 20 |
| G | Carbohydrate
transport and metabolism | 37 |
| H | Coenzyme transport
and metabolism | 12 |
| I | Lipid transport and
metabolism | 23 |
| J | Translation,
ribosomal structure and biogenesis | 26 |
| K | Transcription | 21 |
| L | Replication,
recombination and repair | 22 |
| M | Cell
wall/membrane/envelope biogenesis | 13 |
| N | Cell motility | 4 |
| O | Posttranslational
modification, protein turnover, chaperones | 149 |
| P | Inorganic ion
transport and metabolism | 7 |
| Q | Secondary
metabolites biosynthesis, transport and catabolism | 15 |
| R | General function
prediction only | 119 |
| S | Function
unknown | 24 |
| T | Signal transduction
mechanisms | 47 |
| U | Intracellular
trafficking, secretion, and vesicular transport | 9 |
| Y | Nuclear
structure | 1 |
| Z | Cytoskeleton | 45 |
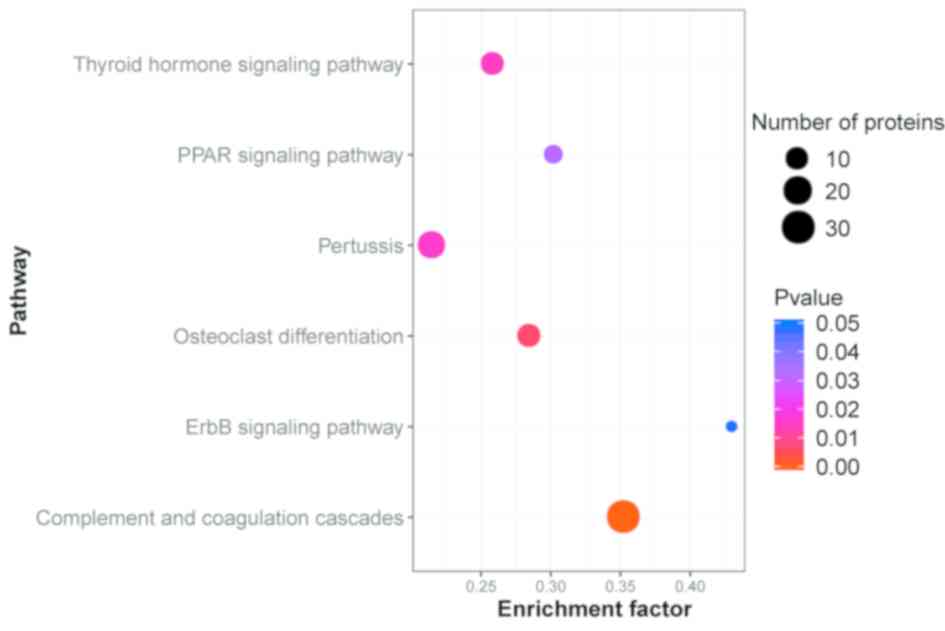
Pathway enrichment analysis
The KEGG database was used to identify the pathways
in which the DEPs were involved. The results indicated that of
these proteins were accumulated in 290 different pathways. The
majority of the proteins were involved in ‘Complement and
coagulation cascades’ (30 proteins, 18.18%), ‘Staphylococcus
aureus infection’ (23 proteins, 13.94%), ‘Systemic lupus
erythematosus’ (22 proteins, 13.33%) and ‘Amoebiasis’ (21 proteins,
12.73%). The top 30 DEPs in the KEGG pathway enrichment are
presented in Table V. Protein
interactions have an important role in certain biological
functions, including immune response, blood coagulation,
inflammatory response, ion homeostasis, cholesterol metabolism,
actin binding, cell motility, energy metabolism, RNA
post-transcriptional modification, amino acid metabolism, small
molecule biochemistry, cellular growth and proliferation (18–21).
A pathway enrichment analysis of DEPs was implemented based on the
KEGG database in AR patients and healthy controls (Fig. 3). All abbreviations are shown in
Table SIV.
| Table V.Top 30 DEPs mapped to pathways. |
Table V.
Top 30 DEPs mapped to pathways.
| Pathway | DEPs with pathway
annotation | All proteins with
pathway annotation | P-value | Pathway ID |
|---|
| Complement and
coagulation cascades | 30 (18.18) | 86 (6.63) |
2.940498e-08a | ko04610 |
| Osteoclast
differentiation | 11 (6.67) | 39 (3.00) |
0.006834358a | ko04380 |
| Thyroid hormone
signaling pathway | 11 (6.67) | 43 (3.31) |
0.01483172a | ko04919 |
| Pertussis | 18 (10.91) | 85 (6.55) |
0.01614457a | ko05133 |
| PPAR signaling
pathway | 6 (3.64) | 20 (1.54) |
0.03239792a | ko03320 |
| ErbB signaling
pathway | 3 (1.82) | 7 (0.54) |
0.04790133a | ko04012 |
| Systemic lupus
erythematosus | 22 (13.33) | 125 (9.63) | 0.06066206 | ko05322 |
| Malaria | 9 (5.45) | 41 (3.16) | 0.06572233 | ko05144 |
| Salivary
secretion | 3 (1.82) | 8 (0.62) | 0.0696401 | ko04970 |
| VEGF signaling
pathway | 3 (1.82) | 8 (0.62) | 0.0696401 | ko04370 |
| Regulation of actin
cytoskeleton | 18 (10.91) | 100 (7.70) | 0.07168303 | ko04810 |
| mTOR signaling
pathway | 2 (1.21) | 4 (0.31) | 0.08102746 | ko04150 |
| Herpes simplex
infection | 5 (3.03) | 19 (1.46) | 0.08226199 | ko05168 |
| Chagas disease
(American trypanosomiasis) | 4 (2.42) | 14 (1.08) | 0.090641 | ko05142 |
| Staphylococcus
aureus infection | 23 (13.94) | 139 (10.71) | 0.09910894 | ko05150 |
| Glucagon signaling
pathway | 4 (2.42) | 15 (1.16) | 0.1118566 | ko04922 |
| MicroRNAs in
cancer | 10 (6.06) | 52 (4.01) | 0.1129492 | ko05206 |
| Phototransduction -
fly | 2 (1.21) | 5 (0.39) | 0.1239715 | ko04745 |
| Protein export | 1 (0.61) | 1 (0.08) | 0.1271186 | ko03060 |
|
Glycosylphosphatidylinositol(GPI)-anchor
biosynthesis | 1 (0.61) | 1 (0.08) | 0.1271186 | ko00563 |
| Leukocyte
transendothelial migration | 15 (9.09) | 87 (6.70) | 0.1274251 | ko04670 |
| Proteoglycans in
cancer | 15 (9.09) | 88 (6.78) | 0.1370228 | ko05205 |
| Rap1 signaling
pathway | 14 (8.48) | 82 (6.32) | 0.1463614 | ko04015 |
| Amoebiasis | 21 (12.73) | 132 (10.17) | 0.1525601 | ko05146 |
| Focal adhesion | 16 (9.70) | 97 (7.47) | 0.1572612 | ko04510 |
| HIF-1 signaling
pathway | 5 (3.03) | 23 (1.77) | 0.1576914 | ko04066 |
| Hippo signaling
pathway | 7 (4.24) | 36 (2.77) | 0.1626743 | ko04390 |
| Renin
secretion | 2 (1.21) | 6 (0.46) | 0.1708845 | ko04924 |
| Type II diabetes
mellitus | 2 (1.21) | 6 (0.46) | 0.1708845 | ko04930 |
| Renin-angiotensin
system | 2 (1.21) | 6 (0.46) | 0.1708845 | ko04614 |
Discussion
The major impediment to success in kidney graft is
acute graft rejection, which leads to loss of the organ occur
mainly in the first year after transplantation (22). The lack of applicable biomarkers to
predict rejection is the biggest challenge in AR. Renal biopsy
offers an accurate detection method for AR but the invasiveness of
this procedure and other adverse effects may limit its use in
certain patients (23–25). Therefore, the reliable and timely
identification of potential early biomarkers for rejection is
essential. A number of studies have been performed over the past
decade (26–29); the majority of them depend on the
combination of stable isotopes for obtaining mass spectrometric
ordering and relative quantification (30,31).
Of these, iTRAQ technology, which is based on the labelling of
peptides in up to 8 proteomes at the MS/MS level for relative and
absolute quantization, is the most widely used for numerous types
of diseases (18–20,32–34).
Wu et al (14) used iTRAQ
technology to detect DEPs in the plasma of patients with acute
renal allograft rejection. The results demonstrated that NF-κB, and
signal transducer and activator of transcription 1 and 3, are
potential markers for AR and may lead to novel strategies for
diagnosis and treatment. Freue et al (15) quantitated the relative plasma
concentrations of proteins in patients with acute renal allograft
rejection by using iTRAQ labeling and quantitative proteomic
technology. The study indicated that the profiling of the plasma
proteome provided a promising method to monitor the immunological
course in patients with AR following renal allograft. The present
study performed a proteomics analysis using iTRAQ technology and
several proteins were identified as potential candidate biomarkers
for the accurate diagnosis of AR. In the present study, 109
proteins with a fold change ≥1.2 were identified, 72 of which were
upregulated and 37 were downregulated. GO analysis in the category
‘biological process’ revealed that alterations in the expression of
identified proteins in patients with AR were involved in diverse
biological processes, including a single-organism process, cellular
process, biological regulation and metabolic process, confirming
that the pathogenesis of AR is associated with different molecular
mechanisms. Some of these proteins, including properdin and keratin
1 (KRT1), may have the potential to be used as a serum biomarker in
the diagnosis of AR.
Complement proteins have an important role in the
ischemia/reperfusion injury (IRI) (35), which prominently contributes to
morbidity and mortality in acute renal allograft failure (36). Properdin is a γ-globulin protein
made up of multiple identical monomeric subunits and is a
stabilizer of surface-bound C3bBb. It facilitates the complement
alternative pathway for C3-convertase formation (37). Properdin is the only known positive
regulator of complement activation (38). Miwa et al (39) suggested that properdin has a major
pathogenic role during early renal IRI and anti-properdin therapy
may have a beneficial effect in human IRI. Consistent with the
literature, properdin was also significantly upregulated in the
serum of patients with AR in the present study. According to these
results, it may be hypothesized that high levels of properdin may
be significantly involved in the development of AR. However, its
specific roles in AR have not been well studied and require to be
further investigated.
Another significantly upregulated protein in AR
identified in the present study was KRT1, which belongs to the
keratin family. KRT1 is polymorphic (40) and has been reported to be expressed
in endothelial cells (41). KRT1
is involved in the lectin complement pathway caused by oxidative
stress in endothelial cells (42).
Transplant recipients may have antibodies to endothelial cells
(43–47). Guo et al (48) indicated that KRT1 antibodies were
probably autoantibodies and the presence of KRT1 antibodies is
significantly associated with deterioration of kidney allograft
function. Analysis of the LC-ESI-MS/MS data indicated that KRT1 was
differentially expressed between AR patients and healthy controls.
This protein may be a valuable diagnostic marker for monitoring
patients' conditions but its possible role in allograft rejection
requires further investigation.
In addition, certain novel candidate protein markers
identified in the present study, including lipoprotein (a) [Lp(a)]
and vitamin D-binding protein (VDBP), were significantly
upregulated between AR patients and healthy controls. Previous
studies have revealed that Lp(a) promotes atherosclerotic diseases,
including stroke and coronary heart disease (49,50).
Shimoyamada et al (51)
reported that smooth muscle cell proliferation could be induced by
Lp(a) as a mechanism of atherosclerosis in the rejected kidney. The
deposition of Lp(a) in lesions in vascular rejection of
transplanted kidneys is similar to that in atherosclerotic lesions.
VDBP is a multifunctional protein (52,53)
that occurs in serum, cerebrospinal fluid and ascitic fluid, and is
characterized as being capable of binding various forms of vitamin
D (54).
1,25-dihydroxycholecalciferol [1,25-(OH)2D3;
also known as calcitriol] is one of the active forms of vitamin D
in the kidney. Previous studies have revealed that
1,25-(OH)2D3 has an essential role in
immunoregulation and allograft rejection (55,56),
and VDBP may be one of the serum biomarker candidates of acute
renal allograft rejection. These candidate proteins may provide a
scientific foundation for the pathogenic mechanisms and potential
therapeutic approach for AR that warrant further research.
The proteins identified as differentially expressed
in patients with AR may be involved in the process of AR and have
an important role in the development of the condition. In this
study, the healthy controls were healthy individuals with no kidney
transplant. Patients with kidney transplant but no AR were not
included in the control group because these patients had other
health conditions that were unsuitable for the control group. In
future studies, it would be ideal to collect adequate specimens
from patients with kidney transplant but no AR and with no other
health conditions. One limitation of the present study was the
small population due to AR being rare in the clinic and the number
of patients with AR that met the selection requirements being
small. The low sample numbers limit the ability to classify stages
of acute renal allograft rejection. Due to the small sample size,
it was not possible to determine the correlations of the levels of
DEPs with multifarious risk factors or with a specific immune
response in detail. If the number of samples was to be increased,
different stages of acute renal allograft rejection would be able
to be observed, different factors such as gender or age would be
considered, and a more objective evaluation could be made for the
iTRAQ labelling technique in acute renal allograft rejection. In
addition, further validation studies are required to elucidate the
mechanisms of the DEPs involved in the biological processes of
acute renal allograft rejection, facilitating the development of
novel biomarkers for rejection. Therefore, increasing the number of
samples will be necessary in further research to obtain more
objective and reliable results.
In conclusion, iTRAQ combined with LC-ESI-MS/MS has
proven to be a potential and efficient quantitative proteomic
technique. The iTRAQ labelling technique was applied to explore the
pathogenic mechanisms of AR. The results proved that different
protein profile alternations and different pathways were involved
in AR. Certain representative candidates, including properdin,
KRT1, Lp(a) and VDBP, may serve as potential and novel biomarkers
for the early detection of AR.
Supplementary Material
Supporting Data
Supporting Data
Supporting Data
Supporting Data
Acknowledgements
Not applicable.
Funding
This study was supported by the National Natural
Science Foundation of China (grant no. 81670596), the Natural
Science Foundation of Guangxi (grant no. 2017GXNSFAA198185), the
Science and Technology Development Project of Guangxi (grant no.
14124003-8) and the Scientific Research and Technology Development
Project of Guilin (grant no. 20170117-1).
Availability of data and materials
The mass spectrometry proteomics data were deposited
with the ProteomeXchange Consortium via the PRIDE partner
repository (https://www.ebi.ac.uk/pride/archive) with the dataset
identifier PXD015336.
Authors' contributions
The present study was conceived by YD and QY; the
experiments were planned by YZ, MO, HL and LL; sample collection
and experiments were performed by YZ, HL, HC, JC, WX, RZ, QG, DT,
XS and JD; data analysis and interpretation were performed by YZ,
MO, LL and WS; the manuscript was drafted by YZ, MO and HL. All
aspects of the work were supervised by YD and QY. All authors read
and approved the final manuscript.
Ethics approval and consent to
participate
This study was performed according to the
Declaration of Helsinki and was approved by the Medical Ethical
Committee of Guilin No. 924 Hospital (Guilin, China). Written
informed consent was obtained from all participants.
Patient consent for publication
Not applicable.
Competing interests
The authors declare that they have no competing
interests.
Glossary
Abbreviations
Abbreviations:
|
AR
|
acute rejection
|
|
GO
|
Gene Ontology
|
|
COGs
|
Clusters of Orthologous Groups of
proteins
|
|
iTRAQ
|
isobaric tags with related and
absolute quantitation
|
|
LC-ESI-MS/MS
|
liquid chromatography electrospray
ionization tandem mass spectrometry
|
|
KRT1
|
keratin 1
|
|
Lp(a)
|
lipoprotein (a)
|
|
VDBP
|
vitamin D-binding protein
|
References
|
1
|
Wolfe RA, Ashby VB, Milford EL, Ojo AO,
Ettenger RE, Agodoa LY, Held PJ and Port FK: Comparison of
mortality in all patients on dialysis, patients on dialysis
awaiting transplantation, and recipients of a first cadaveric
transplant. N Engl J Med. 341:1725–1730. 1999. View Article : Google Scholar : PubMed/NCBI
|
|
2
|
Hariharan S, Kasiske B, Matas A, Cohen A,
Harmon W and Rabb H: Surrogate markers for long-term renal
allograft survival. Am J Transplant. 4:1179–1183. 2004. View Article : Google Scholar : PubMed/NCBI
|
|
3
|
Josephson MA: Monitoring and managing
graft health in the kidney transplant recipient. Clin J Am Soc
Nephrol. 6:1774–1780. 2011. View Article : Google Scholar : PubMed/NCBI
|
|
4
|
Saundh BK, Baker R, Harris M, Welberry
Smith MP, Cherukuri A and Hale A: Early BK polyomavirus (BKV)
reactivation in donor kidney is a risk factor for development of
BKV-associated nephropathy. J Infect Dis. 207:137–141. 2013.
View Article : Google Scholar : PubMed/NCBI
|
|
5
|
Sui W, Zhang R, Chen J, He H, Cui Z, Ou M,
Li W, Qi S, Wen J, Lin X and Dai Y: Quantitative proteomic analysis
of Down syndrome in the umbilical cord blood using iTRAQ. Mol Med
Rep. 11:1391–1399. 2015. View Article : Google Scholar : PubMed/NCBI
|
|
6
|
Tremlett H, Dai DL, Hollander Z, Kapanen
A, Aziz T, Wilson-McManus JE, Tebbutt SJ, Borchers CH, Oger J and
Cohen Freue GV: Serum proteomics in multiple sclerosis disease
progression. J Proteomics. 118:2–11. 2015. View Article : Google Scholar : PubMed/NCBI
|
|
7
|
Lin XC, Sui WG, Qi SW, Tang DE, Cong S,
Zou GM, Zhang Y, Li H, Chen WB, Cheng ZQ and Dai Y: Quantitative
proteomic profiling of renal tissue in human chronic rejection
biopsy samples after renal transplantation. Transplant Proc.
47:323–331. 2015. View Article : Google Scholar : PubMed/NCBI
|
|
8
|
Ross PL, Huang YN, Marchese JN, Williamson
B, Parker K, Hattan S, Khainovski N, Pillai S, Dey S, Daniels S, et
al: Multiplexed protein quantitation in Saccharomyces cerevisiae
using amine-reactive isobaric tagging reagents. Mol Cell
Proteomics. 3:1154–1169. 2004. View Article : Google Scholar : PubMed/NCBI
|
|
9
|
Choe L, D'Ascenzo M, Relkin NR, Pappin D,
Ross P, Williamson B, Guertin S, Pribil P and Lee KH: 8-plex
quantitation of changes in cerebrospinal fluid protein expression
in subjects undergoing intravenous immunoglobulin treatment for
Alzheimer's disease. Proteomics. 7:3651–3660. 2007. View Article : Google Scholar : PubMed/NCBI
|
|
10
|
Spanos C and Moore JB: Sample preparation
approaches for iTRAQ labeling and quantitative proteomic analyses
in systems biology. Methods Mol Biol. 1394:15–24. 2016. View Article : Google Scholar : PubMed/NCBI
|
|
11
|
Desouza LV, Voisin SN and Siu KW:
iTRAQ-labeling for biomarker discovery. Methods Mol Biol.
1002:105–114. 2013. View Article : Google Scholar : PubMed/NCBI
|
|
12
|
Applied Biosystems iTRAQ™ Reagents
Amine-modifying labeling reagents for multiplexed relative and
absolute protein quantification chemistry reference guide. Applied
Biosystems. Part Number 4351918 Rev. A. 2004.
|
|
13
|
Zhang L, Jiang H, Xu G, Chu N, Xu N, Wen
H, Gu B, Liu J, Mao S, Na R, et al: iTRAQ-based quantitative
proteomic analysis reveals potential early diagnostic markers of
clear-cell Renal cell carcinoma. Biosci Trends. 10:210–219. 2016.
View Article : Google Scholar : PubMed/NCBI
|
|
14
|
Wu D, Zhu D, Xu M, Rong R, Tang Q, Wang X
and Zhu T: Analysis of transcriptional factors and regulation
networks in patients with acute renal allograft rejection. J
Proteome Res. 10:175–181. 2011. View Article : Google Scholar : PubMed/NCBI
|
|
15
|
Freue GV, Sasaki M, Meredith A, Günther
OP, Bergman A, Takhar M, Mui A, Balshaw RF, Ng RT, Opushneva N, et
al: Proteomic signatures in plasma during early acute renal
allograft rejection. Mol Cell Proteomics. 9:1954–1967. 2010.
View Article : Google Scholar : PubMed/NCBI
|
|
16
|
Wen B, Zhou R, Feng Q, Wang Q, Wang J and
Liu S: IQuant: An automated pipeline for quantitative proteomics
based upon isobaric tags. Proteomics. 14:2280–2285. 2014.
View Article : Google Scholar : PubMed/NCBI
|
|
17
|
Brosch M, Yu L, Hubbard T and Choudhary J:
Accurate and sensitive peptide identification with mascot
percolator. J Proteome Res. 8:3176–3181. 2009. View Article : Google Scholar : PubMed/NCBI
|
|
18
|
Shen L, Liao L, Chen C, Guo Y, Song D,
Wang Y, Chen Y, Zhang K, Ying M, Li S, et al: Proteomics Analysis
of Blood Serums from Alzheimer's Disease Patients Using iTRAQ
Labeling Technology. J Alzheimers Dis. 56:361–378. 2017. View Article : Google Scholar : PubMed/NCBI
|
|
19
|
Wang J, Yu L, Huang X, Wang Y and Zhao J:
Comparative proteome analysis of saccular intracranial aneurysms
with iTRAQ quantitative proteomics. J Proteomics. 130:120–128.
2016. View Article : Google Scholar : PubMed/NCBI
|
|
20
|
Wang X, Zhi Q, Liu S, Xue SL, Shen C, Li
Y, Wu C, Tang Z, Chen W, Song JL, et al: Identifcation of specifc
biomarkers for gastric adenocarcinoma by ITRAQ proteomic approach.
Sci Rep. 6:388712016. View Article : Google Scholar : PubMed/NCBI
|
|
21
|
Chen J, Ge L, Liu A, Yuan Y, Ye J, Zhong
J, Liu L and Chen X: Identification of pathways related to FAF1/H.
pylori-associated gastric carcinogenesis through an integrated
approach based on iTRAQ quantification and literature review. J
Proteomics. 131:163–176. 2016. View Article : Google Scholar : PubMed/NCBI
|
|
22
|
Perez JD, Sakata MM, Colucci JA, Spinelli
GA, Felipe CR, Carvalho VM, Cardozo KH, Medina-Pestana JO,
Tedesco-Silva H Jr, Schor N and Casarini DE: Plasma proteomics for
the assessment of acute renal transplant rejection. Life Sci.
158:111–120. 2016. View Article : Google Scholar : PubMed/NCBI
|
|
23
|
Williams WW, Taheri D, Tolkoff-Rubin N and
Colvin RB: Clinical role of the renal transplant biopsy. Nat Rev
Nephrol. 8:110–121. 2012. View Article : Google Scholar : PubMed/NCBI
|
|
24
|
Nankivell BJ and Alexander SI: Rejection
of the kidney allograft. N Engl J Med. 363:1451–1462. 2010.
View Article : Google Scholar : PubMed/NCBI
|
|
25
|
Schwarz A, Gwinner W, Hiss M, Radermacher
J, Mengel M and Haller H: Safety and adequacy of renal transplant
protocol biopsies. Am J Transplant. 5:1992–1996. 2005. View Article : Google Scholar : PubMed/NCBI
|
|
26
|
Muenchhoff J, Poljak A, Song F, Raftery M,
Brodaty H, Duncan M, McEvoy M, Attia J, Schofield PW and Sachdev
PS: Plasma protein profiling of mild cognitive impairment and
Alzheimer's disease across two independent cohorts. J Alzheimers
Dis. 43:1355–1373. 2015. View Article : Google Scholar : PubMed/NCBI
|
|
27
|
Feng X, Zhang J, Chen WN and Ching CB:
Proteome profiling of Epstein-Barr virus infected nasopharyngeal
carcinoma cell line: Identification of potential biomarkers by
comparative iTRAQ-coupled 2D LC/MS-MS analysis. J Proteomics.
74:567–576. 2011. View Article : Google Scholar : PubMed/NCBI
|
|
28
|
Jing L, Parker CE, Seo D, Hines MW,
Dicheva N, Yu Y, Schwinn D, Ginsburg GS and Chen X: Discovery of
biomarker candidates for coronary artery disease from an APOE-knock
out mouse model using iTRAQ-based multiplex quantitative
proteomics. Proteomics. 11:2763–2776. 2011. View Article : Google Scholar : PubMed/NCBI
|
|
29
|
Ye H, Sun L, Huang X, Zhang P and Zhao X:
A proteomic approach for plasma biomarker discovery with 8-plex
iTRAQ labeling and SCX-LC-MS/MS. Mol Cell Biochem. 343:91–99. 2010.
View Article : Google Scholar : PubMed/NCBI
|
|
30
|
Couttas TA, Raftery MJ, Erce MA and
Wilkins MR: Monitoring cytoplasmic protein complexes with blue
native gel electrophoresis and stable isotope labelling with amino
acids in cell culture: Analysis of changes in the 20S proteasome.
Electrophoresis. 32:1819–1823. 2011. View Article : Google Scholar : PubMed/NCBI
|
|
31
|
Albaum SP, Hahne H, Otto A, Haußmann U,
Becher D, Poetsch A, Goesmann A and Nattkemper TW: A guide through
the computational analysis of isotope-labeled mass
spectrometry-based quantitative proteomics data: An application
study. Proteome Sci. 9:302011. View Article : Google Scholar : PubMed/NCBI
|
|
32
|
Jin J, Ku YH and Kim Y and Kim Y, Kim K,
Lee JY, Cho YM, Lee HK, Park KS and Kim Y: Differential proteome
profiling using iTRAQ in microalbuminuric and normoalbuminuric type
2 diabetic patients. Exp Diabetes Res. 2012:1686022012. View Article : Google Scholar : PubMed/NCBI
|
|
33
|
Leong S, Nunez AC, Lin MZ, Crossett B,
Christopherson RI and Baxter RC: iTRAQ-based proteomic profiling of
breast cancer cell response to doxorubicin and TRAIL. J Proteome
Res. 11:3561–3572. 2012. View Article : Google Scholar : PubMed/NCBI
|
|
34
|
Ou M, Zhang X, Dai Y, Gao J, Zhu M, Yang
X, Li Y, Yang T and Ding M: Identification of potential
microRNA-target pairs associated with osteopetrosis by deep
sequencing, iTRAQ proteomics and bioinformatics. Eur J Hum Genet.
22:625–632. 2014. View Article : Google Scholar : PubMed/NCBI
|
|
35
|
Cernoch M and Viklicky O: Complement in
kidney transplantation. Front Med (Lausanne). 4:662017. View Article : Google Scholar : PubMed/NCBI
|
|
36
|
Thadhani R, Pascual M and Bonventre JV:
Acute renal failure. N Engl J Med. 334:1448–1460. 1996. View Article : Google Scholar : PubMed/NCBI
|
|
37
|
Hourcade DE: The role of properdin in the
assembly of the alternative pathway C3 convertases of complement. J
Biol Chem. 281:2128–2132. 2006. View Article : Google Scholar : PubMed/NCBI
|
|
38
|
Lesher AM, Nilsson B and Song WC:
Properdin in complement activation and tissue injury. Mol Immunol.
56:191–198. 2013. View Article : Google Scholar : PubMed/NCBI
|
|
39
|
Miwa T, Sato S, Gullipalli D, Nangaku M
and Song WC: Blocking properdin, the alternative pathway, and
anaphylatoxin receptors ameliorates renal ischemia-reperfusion
injury in decay-accelerating factor and CD59 doubleknockout mice. J
Immunol. 190:3552–3559. 2013. View Article : Google Scholar : PubMed/NCBI
|
|
40
|
Han M, Fan L, Qin Z, Lavingia B and
Stastny P: Alleles of keratin 1 in families and populations. Hum
Immunol. 74:1453–1458. 2013. View Article : Google Scholar : PubMed/NCBI
|
|
41
|
Remotti F, Fetsch JF and Miettinen M:
Keratin 1 expression in endothelia and mesenchymal tumors: An
immunohistochemical analysis of healthy and neoplastic tissues. Hum
Pathol. 32:873–879. 2001. View Article : Google Scholar : PubMed/NCBI
|
|
42
|
Collard CD, Montalto MC, Reenstra WR,
Buras JA and Stahl GL: Endothelial oxidative stress activates the
lectin complement pathway: Role of cytokeratin 1. Am J Pathol.
159:1045–1054. 2001. View Article : Google Scholar : PubMed/NCBI
|
|
43
|
Sun Q, Liu Z, Chen J, Chen H, Wen J, Cheng
D and Li L: Circulating anti-endothelial cell antibodies are
associated with poor outcome in renal allograft recipients with
acute rejection. Clin J Am Soc Nephrol. 3:1479–1486. 2008.
View Article : Google Scholar : PubMed/NCBI
|
|
44
|
Sun Q, Cheng Z, Cheng D, Chen J, Ji S, Wen
J, Zheng C and Liu Z: De novo development of circulating
anti-endothelial cell antibodies rather than pre-existing
antibodies is associated with post-transplant allograft rejection.
Kidney Int. 79:655–662. 2011. View Article : Google Scholar : PubMed/NCBI
|
|
45
|
Sun Q, Liu Z, Yin G, Chen H, Chen J and Li
L: Detectable circulating antiendothelial cell antibodies in renal
allograft recipients with C4d-positive acute rejection: A report of
three cases. Transplantation. 79:1759–1762. 2005. View Article : Google Scholar : PubMed/NCBI
|
|
46
|
Glotz D, Lucchiari N, Pegaz-Fiornet B and
Suberbielle-Boissel C: Endothelial cells as targets of allograft
rejection. Transplantation. 82 (Suppl 1):S19–S21. 2006. View Article : Google Scholar : PubMed/NCBI
|
|
47
|
Qin Z, Zou Y, Lavingia B and Stastny P:
Identification of endothelial cell surface antigens encoded by
genes other than HLA. A combined immunoprecipitation and proteomic
approach for the identification of antigens recognized by
antibodies against endothelial cells in transplant recipients. Hum
Immunol. 74:1445–1452. 2013. View Article : Google Scholar : PubMed/NCBI
|
|
48
|
Guo X, Hu J, Luo W, Luo Q, Guo J, Tian F,
Ming Y and Zou Y: Analysis of sera of recipients with allograft
rejection indicates that keratin 1 is the target of
anti-endothelial antibodies. J Immunol Res. 2017:86798412017.
View Article : Google Scholar : PubMed/NCBI
|
|
49
|
Nordestgaard BG, Chapman MJ, Ray K, Borén
J, Andreotti F, Watts GF, Ginsberg H, Amarenco P, Catapano A,
Descamps OS, et al: Lipoprotein (a) as a cardiovascular risk
factor: Current status. Eur Heart J. 31:2844–2853. 2010. View Article : Google Scholar : PubMed/NCBI
|
|
50
|
Smolders B, Lemmens R and Thijs V:
Lipoprotein (a) and stroke: A meta-analysis of observational
studies. Stroke. 38:1959–1966. 2007. View Article : Google Scholar : PubMed/NCBI
|
|
51
|
Shimoyamada H, Fan J, Watanabe T and
Nagata M: Accelerated atherosclerosis with apoLipoprotein (a) and
oxidized low-density lipoprotein deposition in acute rejection of
transplanted kidney analogous to atherosclerosis. Clin Transplant.
16 (Suppl 8):S35–S39. 2002. View Article : Google Scholar
|
|
52
|
White P and Cooke N: The multifunctional
properties and characteristics of vitamin D-binding protein. Trends
Endocrinol Metab. 11:320–327. 2000. View Article : Google Scholar : PubMed/NCBI
|
|
53
|
Speeckaert M, Huang G, Delanghe JR and
Taes YE: Biological and clinical aspects of the vitamin D binding
protein (Gc-globulin) and its polymorphism. Clin Chim Acta.
372:33–42. 2006. View Article : Google Scholar : PubMed/NCBI
|
|
54
|
Daiger SP, Schanfield MS and
Cavalli-Sforza LL: Group-specific component (Gc) proteins bind
vitamin D and 25-hydroxyvitamin D. Proc Natl Acad Sci USA.
72:2076–2080. 1975. View Article : Google Scholar : PubMed/NCBI
|
|
55
|
Mathieu C and Jafari M: Immunomodulation
by 1,25-dihydroxyvitamin D3: Therapeutic implications in
hemodialysis and renal transplantation. Clin Nephrol. 66:275–283.
2006. View Article : Google Scholar : PubMed/NCBI
|
|
56
|
Gao Y, Wu K, Xu Y, Zhou H, He W, Zhang W,
Cai L, Lin X, Fang Z, Luo Z, et al: Characterization of acute renal
allograft rejection by human serum proteomic analysis. J Huazhong
Univ Sci Technolog Med Sci. 29:585–591. 2009. View Article : Google Scholar : PubMed/NCBI
|