Introduction
Osteoporosis (OP) is an age-related skeletal disease
characterized by bone loss, which increases the skeletal fragility
and risk of fracture. Remodeling of the bone serves an important
role in the maintenance of the microarchitecture of the skeleton,
which involves a balance between bone formation (mediated by
osteoblasts) and bone resorption (conducted by osteoclasts)
(1). It has been suggested that
osteoporosis may result from underlying defects in bone stem cell
populations, particularly bone marrow stromal cells (BMSCs) and
circulating mesenchymal stem cells (PB-MSCs) (2,3).
Studying the peripheral blood MSCs is of particular importance as
it utilizes patient samples. Samples derived from patients with OP
displayed a higher number of PB-MSCs compared with healthy donors.
However, osteogenic gene markers, such as RUNX2 and secreted
protein acidic and cysteine rich (SPARC), were lower in
patient PB-MSCs compared with PB-MSCs isolated from healthy donors
(2). In addition, the role of BMP
signalling in osteogenic differentiation is not completely
understood.
Bone morphogenetic proteins (BMPs) are acidic
proteins located in the bone matrix that belong to the TGF-β
superfamily. BMPs serve important roles in skeletal development,
bone formation and MSC differentiation. Currently, at least 15
different BMPs have been identified in humans (4). The osteogenesis induction properties
of BMPs were identified when it was determined that demineralized
bone could induce de novo bone formation, which was
attributed to BMPs present in the extract (5). Disruption in BMP signalling causes
skeletal and vascular abnormalities (6). Moreover, BMP signalling serves a
crucial role in the differentiation of MSCs into osteoblasts and
eventual bone formation. MSCs undergo early and late stages of
differentiation, which also involve proliferation and maturation.
These processes are characterized by the expression of several
genes, including alkaline phosphatase (ALP), osteocalcin
(OCN) and osteopontin (OPN) (4).
BMP-2 and BMP-4 knockout mice were found to be
embryonically lethal. These proteins were also identified as master
regulators of the differentiation of osteoblasts and chondrocytes
(7). The two BMPs have gained
momentum due to their use in the repair of various bone and
cartilaginous defects. BMP2 has also been used as a protein-based
substitute for autograft bone (8).
Several studies have used BMP2 to induce osteogenesis in various
animal models (9–11) but none have examined osteogenic gene
expression on a global scale. A recent report on the transcriptomic
profile from adipose stem cells induced into osteogenesis
demonstrated that genes involved in extracellular matrix (ECM) and
angiogenesis were enriched during osteogenesis (12). The clinical implication of both BMP2
and MSCs demands more high-throughput-based studies to understand
the molecular mechanism underlying osteogenesis and bone
formation.
The aim of the present study was to understand the
role of BMP2 in osteogenesis from the proteomic perspective. By
overexpressing BMP2 in hMSCs and then performing iTRAQ-based
proteomic profiling, several differentially expressed proteins were
identified. BMP2 overexpression leads to increased osteogenesis
along with alterations in the expression levels of several
important metabolic and signalling proteins, including N-cadherin
(CDH2). Small intefering RNA (siRNA)-mediated knockdown of
N-cadherin led to a reduction in osteogenic markers, which were
otherwise significantly upregulated in cells overexpressing BMP2.
Therefore, the findings of the present study bring to the forefront
the role of several key proteins for the field of bone tissue
engineering and repair.
Materials and methods
BMP2 cloning and plasmid
construction
BMP2 CDS (gene ID:1191) was cloned in the
pcDNA3.1(+) vector using the restriction sites for BamHI
(GGATCC)-EcoRI (GAATTC) with an insert size of 1203 bp. This
insert was validated by sequencing.
Cell culture and transfections
Human MSCs (hMSCs) were purchased from Saiye
Biotechnology Co., Ltd. (cat. no. HUXMA-01001) and maintained
according to the manufacturer's protocol. BMP2 overexpression in
hMSCs was carried out by plasmid transfection using
Lipofectamine® 2000 (Invitrogen; Thermo Fisher
Scientific, Inc.; cat. no. 11668019) according to the
manufacturer's instructions. Transfection solution along with the
plasmid was incubated with cells at 37°C for 4 h and then the
medium was changed. Transfected cells were collected after 48 h of
transfection. siRNAs against CDH2 gene (Table I) were also transfected using
Lipofectamine 2000 and cells were collected 48 h
post-transfection.
 | Table I.siRNA sequences for control and CDH2
mRNA. |
Table I.
siRNA sequences for control and CDH2
mRNA.
| siRNA | 5′-3′ sequence |
|---|
| si-NC |
UUCUCCGAACGUGUCACGUTT |
| si-CDH2-1 |
GUGCAACAGUAUACGUUAAUATT |
| si-CDH2-2 |
GCAUUCAGAAGCUAGGCUUUATT |
| si-CDH2-3 |
GGAACGCUGCAGAUCUAUUUATT |
| si-CDH2-4 |
CCACCAUAUGACUCCCUGUUATT |
Alizarin staining
Alizarin Red S staining was carried out in 24-well
plates. The hMSCs were transfected with plasmid and/or siRNA for 21
days, and fixed with 70% ethanol for 10 min at room temperature and
washed with 1X PBS. To confirm osteogenic differentiation, the
cells were stained with 0.5% Alizarin Red solution for 1 h at room
temperature and images were captured under an E100 light microscope
(Nikon Corporation; magnification, X40-1,500) (13).
RNA extraction and quantitative
PCR
Total RNA was extracted from hMSCs by using
TRIzol® (Ambion; Thermo Fisher Scientific, Inc.). RNA
was further purified with two phenol-chloroform treatments and then
treated with RQ1 DNase (Promega Corporation) to remove DNA. The
quality and quantity of the purified RNA were determined by
measuring the absorbance at wavelengths of 260/280 nm (A260/A280)
using Smartspec Plus (BioRad Laboratories, Inc.). The integrity of
RNA was further verified by 1.5% agarose gel electrophoresis.
Reverse transcription-quantitative PCR (RT-qPCR) was
performed to detect gene expressions using the primers listed in
Table II. Total RNA was reverse
transcribed into cDNA using the ReverTra Ace® qPCR RT
kit (Toyobo Life Science) and the following temperature protocol:
65°C for 5 min; 37°C for 15 min; and 98°C for 5 min. Subsequently,
qPCR was performed on the S1000 thermocycler (Bio-Rad Laboratories,
Inc.) with Bestar SYBR-Green RT-PCR Master Mix (DBI Bioscience).
The following thermocycling conditions were used for qPCR:
Denaturing at 95°C for 10 min, 40 cycles of denaturing at 95°C for
15 sec, annealing and extension at 60°C for 1 min. qPCR
amplifications were performed in triplicate for each sample.
Transcript levels for the genes analyzed were measured in
comparison with the housekeeping gene GAPDH as an internal
reference standard, using the 2−ΔΔCq method (14).
| Table II.Primer sequences for quantitative
PCR. |
Table II.
Primer sequences for quantitative
PCR.
| Target | 5′-3′ sequence |
|---|
| BMP2 | F
AATGCAAGCAGGTGGGAAAG |
| BMP2 | R
GCTGTGTTCATCTTGGTGCA |
| CDH2 | F
AATCGTGTCTCAGGCTCCAA |
| CDH2 | R
TGCCTTCCATGTCTGTAGCT |
| FN1 | F
ACAGCTCATCCGTGGTTGTA |
| FN1 | R
TCTTGGTGGGCTGACATTCT |
| HMOX1 | F
CTTTCAGAAGGGCCAGGTGA |
| HMOX1 | R
AAGTAGACAGGGGCGAAGAC |
| HSPG2 | F
CCACTTCTACCTGGAGCACA |
| HSPG2 | R
TGAAGTCATCGGGTTGGTCA |
| SPARC | F
GTTTGAGAAGGTGTGCAGCA |
| SPARC | R
TGTATTTGCAAGGCCCGATG |
| COL-II | F
TCCAGATGACCTTCCTACGC |
| COL-II | R
CTTCTTGAGGTTGCCAGCTG |
| OCN | F
GTGCAGAGTCCAGCAAAGGT |
| OCN | R
TCAGCCAACTCGTCACAGTC |
| OPN | F
TTGCAGTGATTTGCTTTTGC |
| OPN | R
GCCACAGCATCTGGGTATTT |
| RUNX2 | F
TGTCATGGCGGGTAACGAT |
| RUNX2 | R
AAGACGGTTATGGTCAAGGTGAA |
Western blot analysis
BMP-2 overexpression was detected by western
blotting of cell samples. hMSCs transfected with pCDNA3.1 or
pCDNA3.1-BMP2 were lysed using cell lysis buffer (cat. no. P0013B;
Beyotime Institute of Biotechnology) followed by centrifugation at
14,000 × g for 1 min at 4°C. The protein concentration of the
supernatant was detected using the BCA protein concentration
determination kit (cat. no. P0011; Beyotime Institute of
Biotechnology). Proteins (50 mg) were separated via 15% SDS-PAGE
and transferred onto a PVDF membrane (EMD Millipore; cat. no.
ISEQ00010). The membrane was then blocked with non-fat milk (5% in
TBST) for 4°C 1 h, followed by incubation with anti-BMP-2 antibody
(ProteinTech Group, Inc.; cat. no. 18933-1-AP; 1:500) for 4°C 1 h.
The immunoblot was then incubated with secondary anti-rabbit HRP
antibody (ProteinTech Group, Inc.; cat. no. SA00013-2; 1:500) for
4°C 1 h and then developed using enhanced chemiluminescent
substrate (Aspen Biotechnology; cat. no. AS1027). Quantification
was performed using ImageJ software (version 1.46; National
Institutes of Health) to scan the gray value of each western blot
signal, and compare the two groups of gray values.
Protein digestion
For protein extraction, extraction buffer (7 M
Urea/2 M Thiourea/4% SDS/40 mM Tris-HCl, pH 8.5/1 mM PMSF/2 mM
EDTA) was added to the sample, mixed and incubated on ice for 5
min, and DTT was added to a final concentration of 10 mM. The
sample then underwent ultrasound sonification in an ice bath for 15
min, and then centrifuged at 13,000 × g for 20 min at 4°C. The
supernatant was transferred to a new centrifuge tube and protein
precipitation was carried out by acetone precipitation. The protein
pellet was re-dissolved by adding 8 M urea/100 mM TEAB (pH 8.0)
solution, and DTT was added to a final concentration of 10 mM, and
a reduction reaction was carried out in a water bath at 56°C for 30
min. Subsequently, iodoacetamide (IAM) was added to a final
concentration of 55 mM, and the alkylation reaction was carried out
by allowing to stand at room temperature for 30 min in the dark.
The protein concentration was determined by the Bradford method. An
equal amount of protein from each sample was used for trypsin
digestion at 37°C overnight. Peptides obtained were desalted on a
C18 column and the dehydrated peptide was dried under vacuum.
iTRAQ labeling
The peptide was solubilized with 0.5 M TEAB, labeled
according to the iTRAQ-8 standard kit (SCIEX), mixed after
labeling, and the peptides were fractioned using the Ultimate 3000
HPLC system (Thermo Scientific™ Dionex™). Separation of the
peptides was achieved using a gradually increasing ACN
concentration under alkaline conditions at a flow rate of 1 ml/min
and one tube was collected per minute. The fractions collected were
desalted using the Strata-X desalting column and dried under
vacuum.
LC-MS/MS analysis and data
screening
The mass spectrometry data were collected using a
TripleTOF 5600+ LC/MS system (SCIEX). The polypeptide sample was
dissolved in 2% acetonitrile 0.1% formic acid, and using an
Eksigent nano LC system (SCIEX) coupled to the TripleTOF 5600+ mass
spectrometers. The polypeptide solution was added to C18 trapping
column (0.5 µm, 100 µm × 20 mm), and subjected to 90 min time
gradient, 300 nl/min flow rate on C18 analytical column (0.3 µm, 75
µm × 150 mm) with progress row gradient. The two mobile phases used
were buffer A (2% acetonitrile/0.1% formic acid/98% H2O)
and buffer B (98% acetonitrile/0.1% formic acid/2% H2O).
For Information Dependent Acquisition (IDA), a first-order mass
spectrum was scanned with an ion accumulation time of 250 msec, and
a secondary mass spectrum of 30 precursor ions was acquired with an
ion accumulation time of 50 msec. The MS1 spectrum was acquired in
the range of 350–1,500 m/z, and the MS2 spectrum was acquired in
the range of 100–1,500 m/z. The precursor ion dynamic exclusion
time was set to 15 sec.
Bioinformatic analysis
For protein identification, the search engine
associated with the AB Sciex 5600+-Proteinpilot TMV4.5 was used.
For the identification using Proteinpilot, a further filter, for
the identified protein, was applied considering unused scores ≥1.3
(with a confidence level >95%), each protein contained at least
one unique peptide, while peptides that did not meet this condition
were not included. Protein quantification was also carried out
using Proteinplot software. For experimental designs containing
biological replicates or technical replicates, the mean of the
ratios of the comparisons between replicates was first normalized
by the median as the difference multiple of the sample to be
compared, and then the duplicated sample was used to compare the
single-sample. The minimum ratio was used to determine P-values for
screening the differential expressed proteins using the Student's
t-test. Finally, the differential proteins were screened based on
the difference multiples and P-value. When the fold difference
reached 1.2-fold or more (i.e., upregulated ≥1.2 and downregulated
≤0.83), and after a statistical significance test with P-value
≤0.05, the protein was considered to be significantly
different.
The GO function significant enrichment analysis
yielded a significant enrichment of GO function entries in the
differential proteins compared to all identified protein
backgrounds, giving a significant correlation to which biological
functions differed. The analysis of all different protein was
conducted using the Gene Ontology database (http://www.geneontology.org/ each) the term
mapping.
Statistical analysis
Data were analyzed statistically using Microsoft
Excel (2007) and further statistical analysis was performed on
GraphPad Prism5 software. Data are presented as the mean ± standard
deviation. For comparisons between two groups, statistically
significant differences between means were identified by the
Student's t-test (paired). P<0.05 was considered to indicate a
statistically significant difference. For comparisons among
multiple groups, one-way ANOVA followed by Tukey's post hoc test
was used. P<0.05 was considered to indicate a statistically
significant difference.
Results
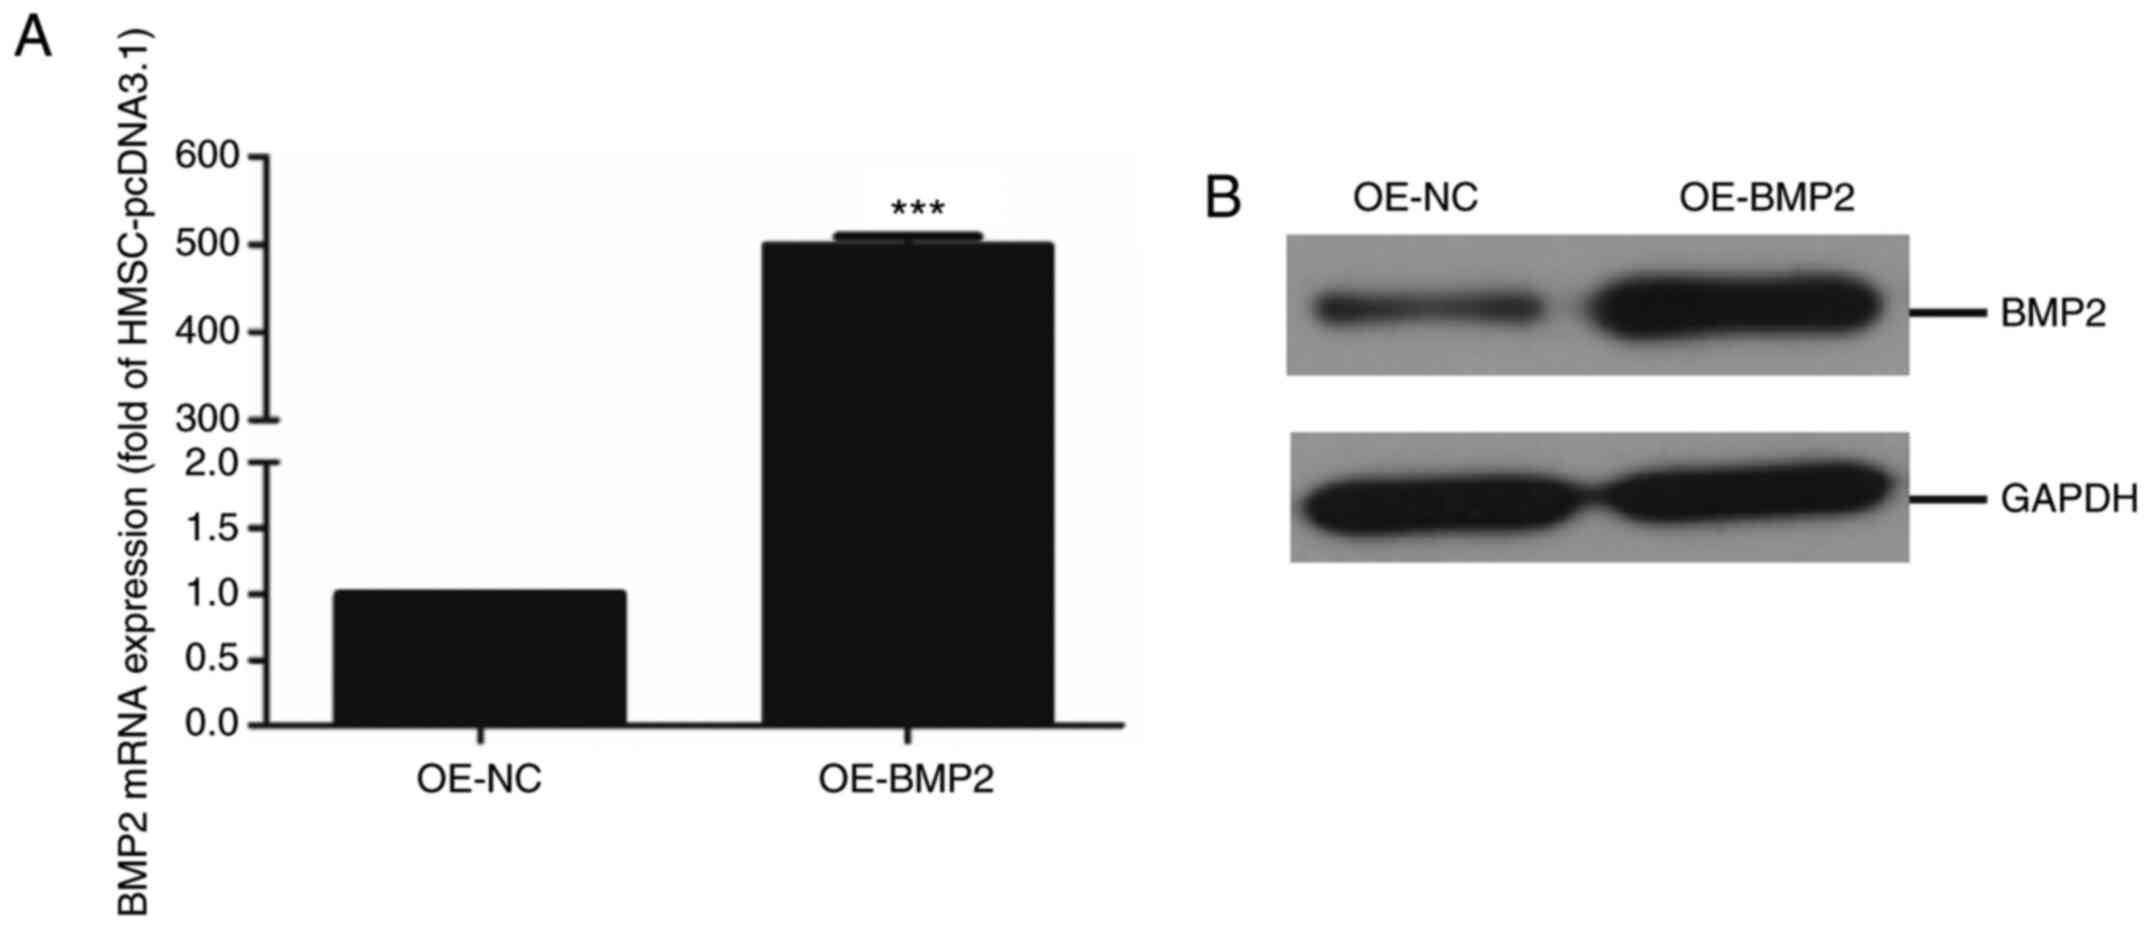
Overexpression of BMP2 in hMSC
To determine the role of BMP2 in the differentiation
of hMSCs to osteogenic lineage, BMP-2 protein was overexpressed in
cells using an overexpression vector containing the BMP-2
gene. The overexpression of BMP-2 was quantified at both the gene
level by qPCR and at the protein level by immunoblotting. RT-qPCR
analysis and quantification revealed successful overexpression
where BMP2 mRNA levels in overexpressing cells were about 500-fold
higher compared with control cells (Fig. 1A). Additionally, the immunoblotting
assay showed a significant upregulation of BMP-2 protein in
overexpressing cells compared with control cells (Fig. 1B). These results indicate a
successful establishment of the human mesenchymal stem cell line
with BMP2 overexpression.
Proteomic analysis of BMP-2
overexpressing cells
To examine the effect of BMP2 overexpression on the
proteomic profile of cells harbouring BMP2 protein, we labelled and
identified differentially expressed proteins through the iTRAQ
labeling kit followed by mass spectrometry. A total of 455,131
spectra were obtained, of which 131,592 spectra were identified
using Uniprot-Swissprot-database for Homo sapiens. A total of 4102
proteins were identified during analysis and when filtered by at
least two unique peptides, a total of 3,329 proteins were
identified (Table III). These
results indicate that the iTRAQ has high sensitivity, with a
spectral identification rate of 28.91%.
| Table III.Summary of protein identification
information statistics. |
Table III.
Summary of protein identification
information statistics.
| Sample name | Total number of
spectra | Identification
spectrum numbera | Spectral
identification rate | Identify the number
of peptidesa | Identification of
protein number |
Unique-2b |
|---|
| ALL | 455131 | 131592 | 28.91% | 25040 | 4102 | 3329 |
Distribution of the proteomic
results
Before analysing the proteins identified from the
high throughput assay, we first examined the quality of the data
obtained from the mass spectrometry. Similarly, we looked at
features such as the distribution of unique peptide number, peptide
length, the distribution of coverage identified, and repeatability
using parameters such as coefficient of variation. The unique
peptide is defined as the peptide that is found only for one
protein. From the presence of this type of peptide, the presence of
the corresponding protein can be uniquely determined. Fig. 2A shows the coordinate distribution
of the number of unique peptides contained in all the proteins
identified in this assay. The x-axis depicts the number of unique
peptides contained in the protein, the left y-axis is the number of
proteins corresponding to the x-axis and the right y-axis
corresponds to the ratio of total protein. For example, there are
720 proteins with 2 as the unique number of peptides, which is
36.40% of the total number of proteins obtained. Such deductions
can be carried out further for an increasing number of unique
peptides. Next, the distribution of peptide length was analysed
(Fig. 2B). As is evident from the
figure, the average length of the polypeptide identified in the
assay was 12.01, which was within a reasonable range of the peptide
length. The figure also shows that the length of the peptide is
mainly concentrated between 6 and 19 with a length of 9 peptides
number showing the maximum number of peptides. For an identified
protein, the greater the number of peptides that support the
protein, the higher the confidence of the protein. Therefore, the
identification coverage of the protein indirectly reflects the
overall accuracy of the identification results (Fig. 2C). Sectors of different colours in
the pie chart represent the percentage of protein with different
ranges of identified coverage. It is clear from the figure that
~50% of the identified proteins had equal to or more than 10% of
the peptide coverage, and 26.55% have equal to or more than 20% of
the peptide coverage. Repeatability analysis was conducted to
confirm the reproducibility of the biological replicates (Fig. 2D) from the perspective of the
coefficient of variance (CV). It can be observed from the figure
that when the threshold of CV is set at 20%, the cumulative
percentage of a CV of the two groups of samples [HCP-control (Human
mesenchymal stem cells + pCDNA 3.1), HCPB (Human mesenchymal stem
cells + pCDNA 3.1-BMP2 over expression)] was 84.98 and 86.37%,
respectively, indicating that the HCPB samples are more
reproducible.
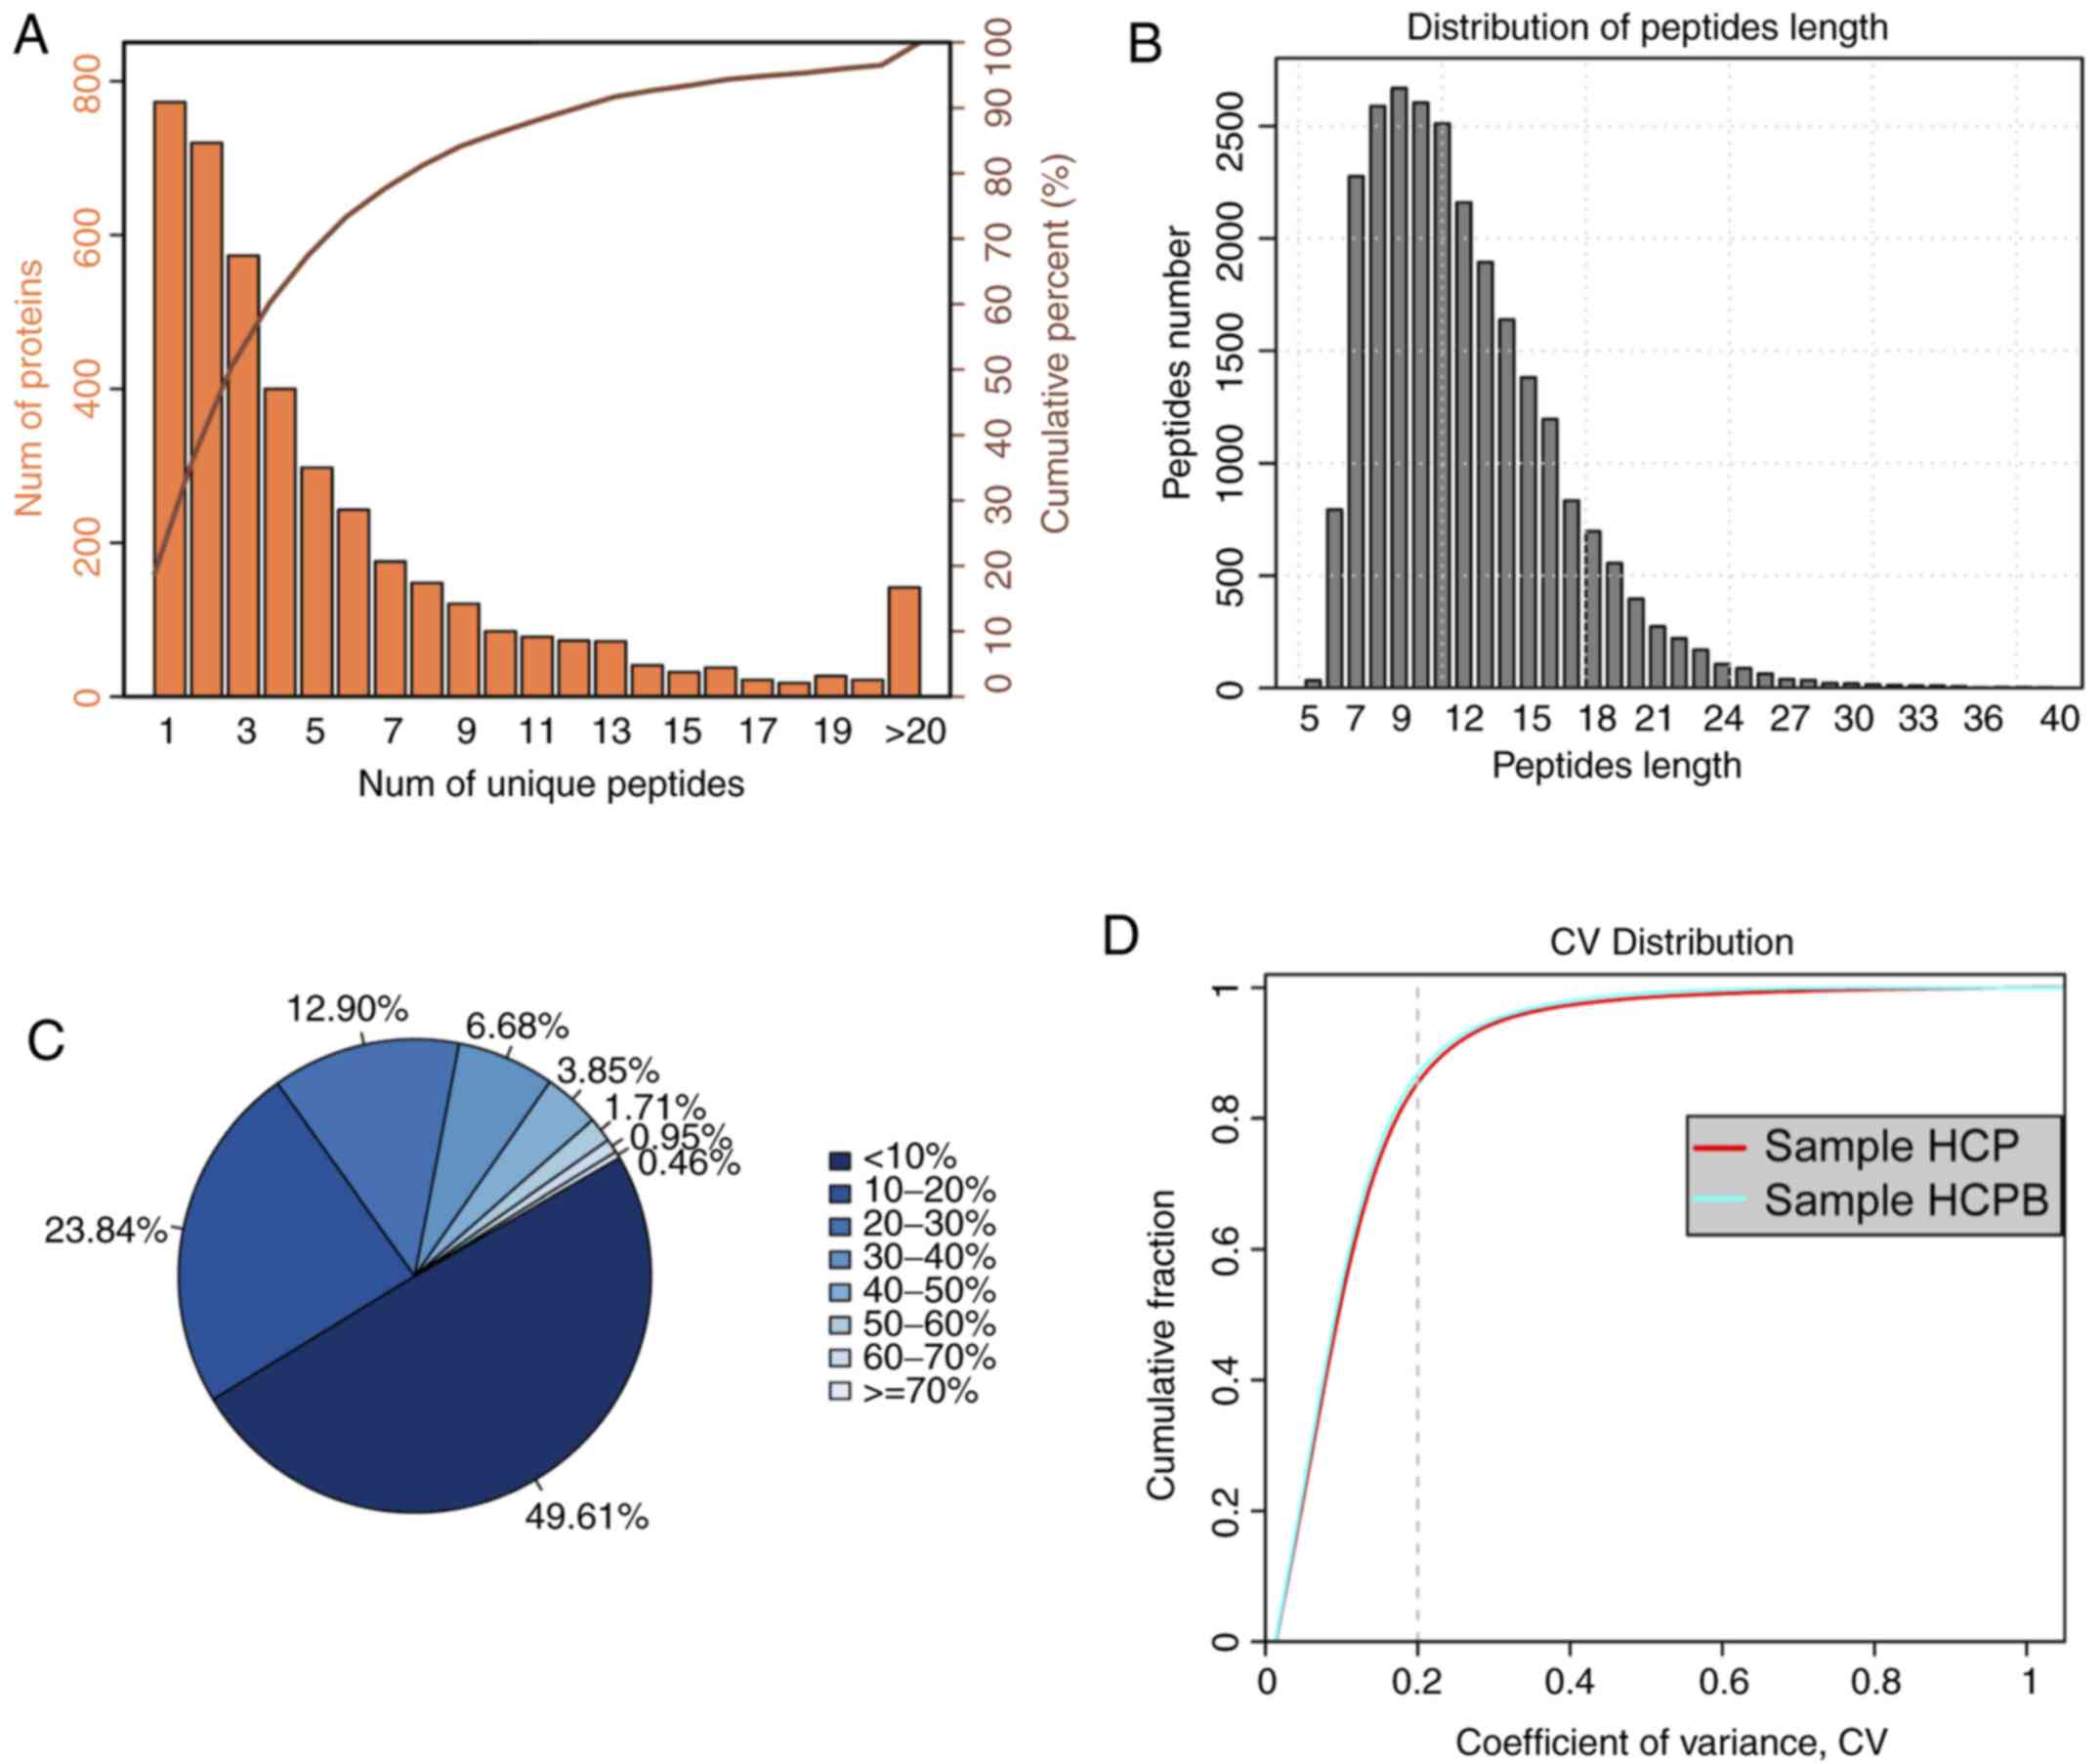 | Figure 2.Summary of iTRAQ-Based proteomic
analysis for OE-BMP2 and OE-NC in hMSCs. (A) Distribution of the
number of unique peptides obtained for all the proteins identified
in this assay. (B) Peptide length distribution map of the
identified peptides. (C) Sectors of different colors in the pie
chart representing the percentage of protein with different ranges
of identified coverage. (D) Repeatability analysis by plotting CV
vs. cumulative fraction, with 0.2 as the CV threshold for samples,
HCP and HCPB. iTRAQ, isobaric tags for relative and absolute
quantification; OE, overexpression; BMP2, bone morphogenetic
protein 2; NC, negative control; hMSC, human mesenchymal stem
cells; CV, coefficient of variation; HCP, human mesenchymal stem
cells transfected with pCDNA 3.1; HCPB, human mesenchymal stem
cells transfected with pCDNA 3.1-BMP2. |
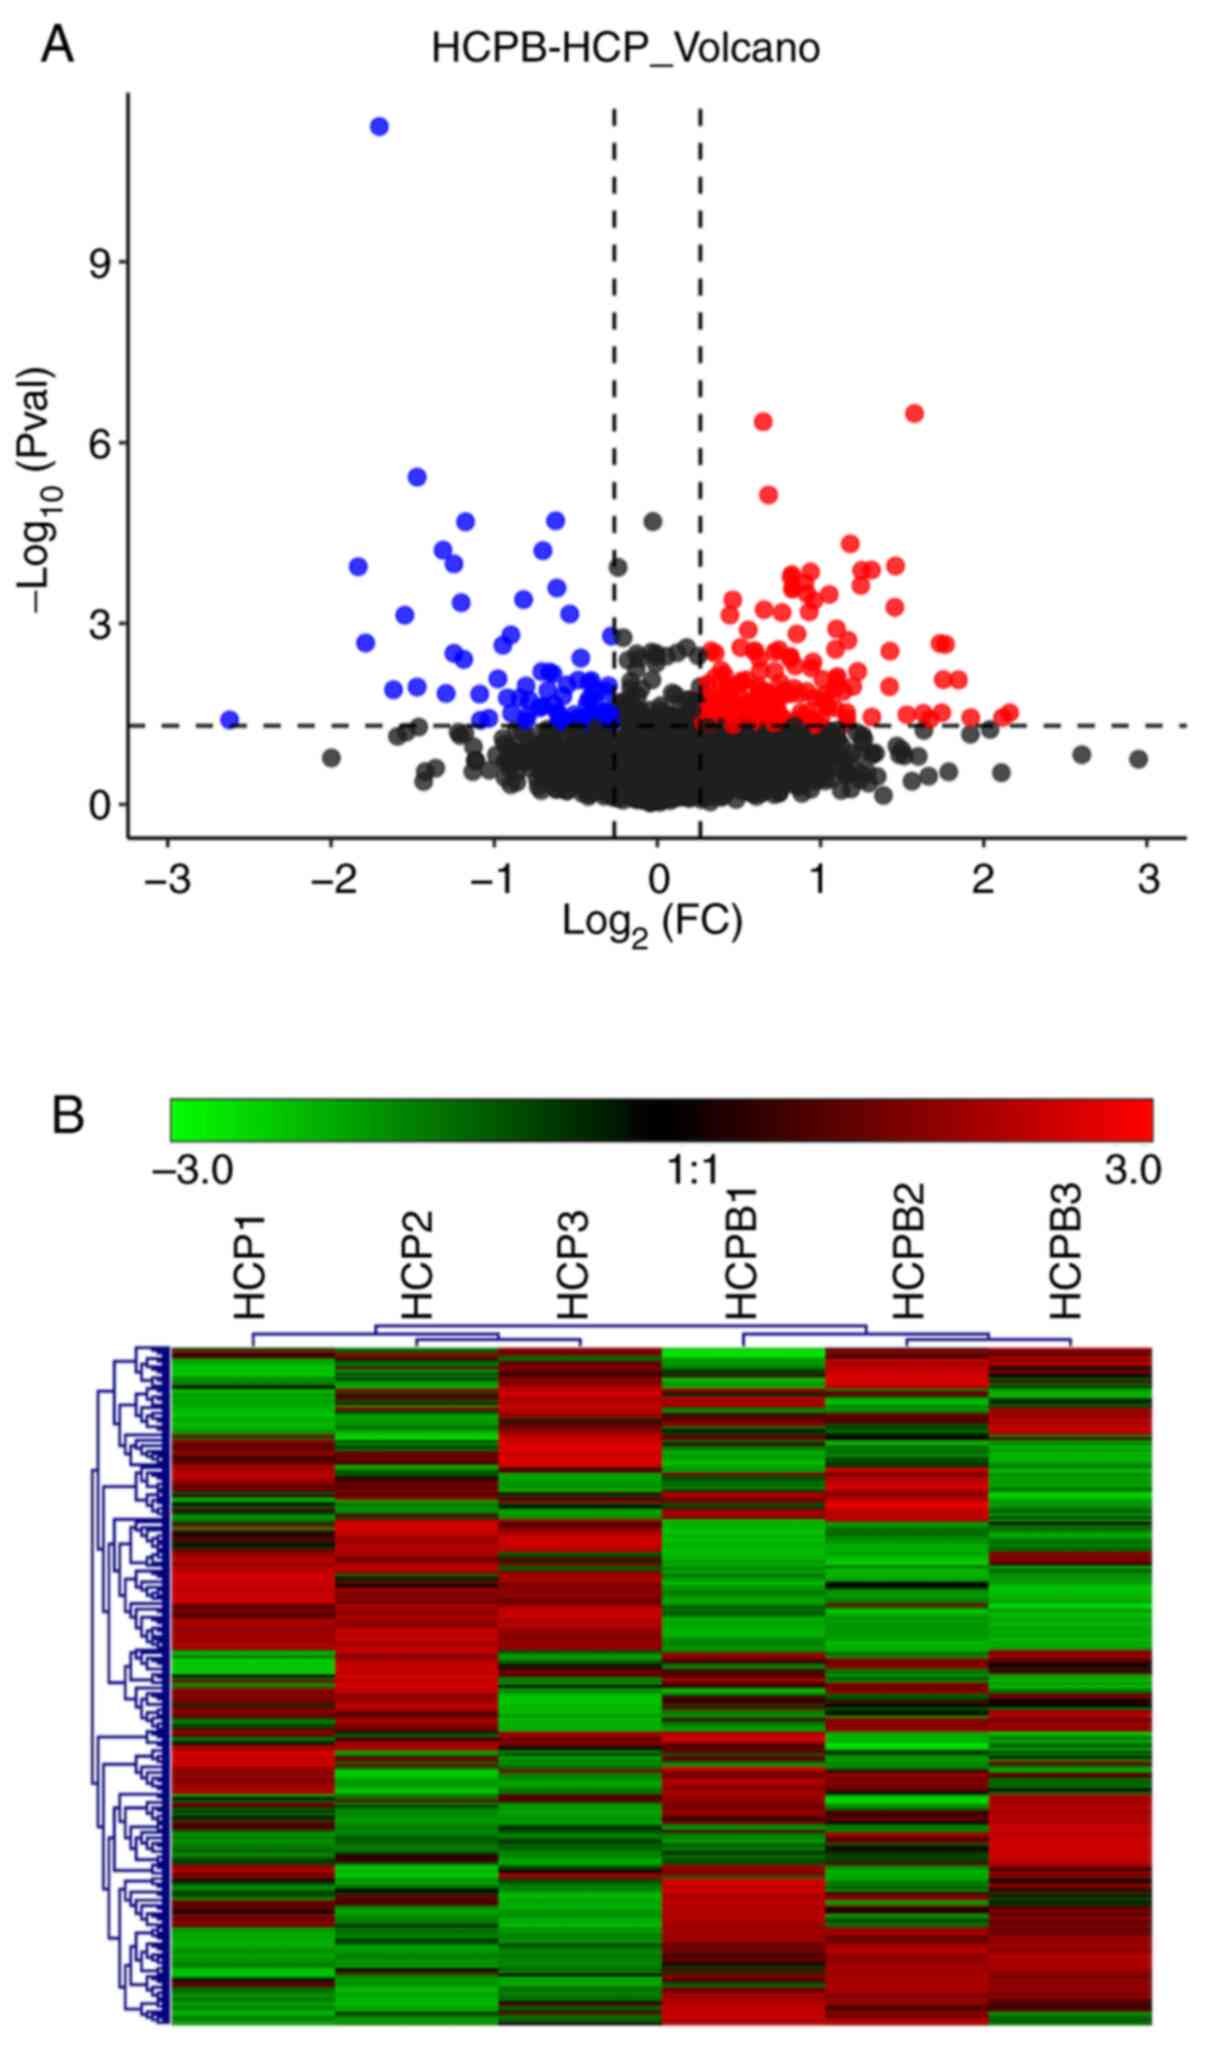
Protein quantification and cluster
analysis
As discussed earlier, a total of 4,102 proteins were
identified through mass spectrometric analysis (filtered by at
least two unique peptides, a total of 3,329 proteins were
identified), and the relative quantified protein number for the
comparison group (HCPB: HCP) was 4051. In the relative quantitative
results, we found that the number of proteins with significant
differences in the comparison group (HCPB: HCP) was 249 [the number
of significant differences in protein was correspondingly filtered
according to fold change (FC) restrictions: For upregulation FC
≥1.2 and for downregulated ≤0.83, with P-value ≤0.05] (Table SI). Of the 249 proteins, 173 showed
significant upregulation and 76 proteins showed significant
downregulation. The volcano plot (Fig.
3A) depicts the proportion of differentially expressed proteins
in the total identified proteins. Further, we performed a cluster
analysis to identify similarities and differences in the
experimental groups and their respective biological replicates
(Fig. 3B) with the color denoting
the change in the protein abundance of the differentially expressed
proteins, numbered at 249.
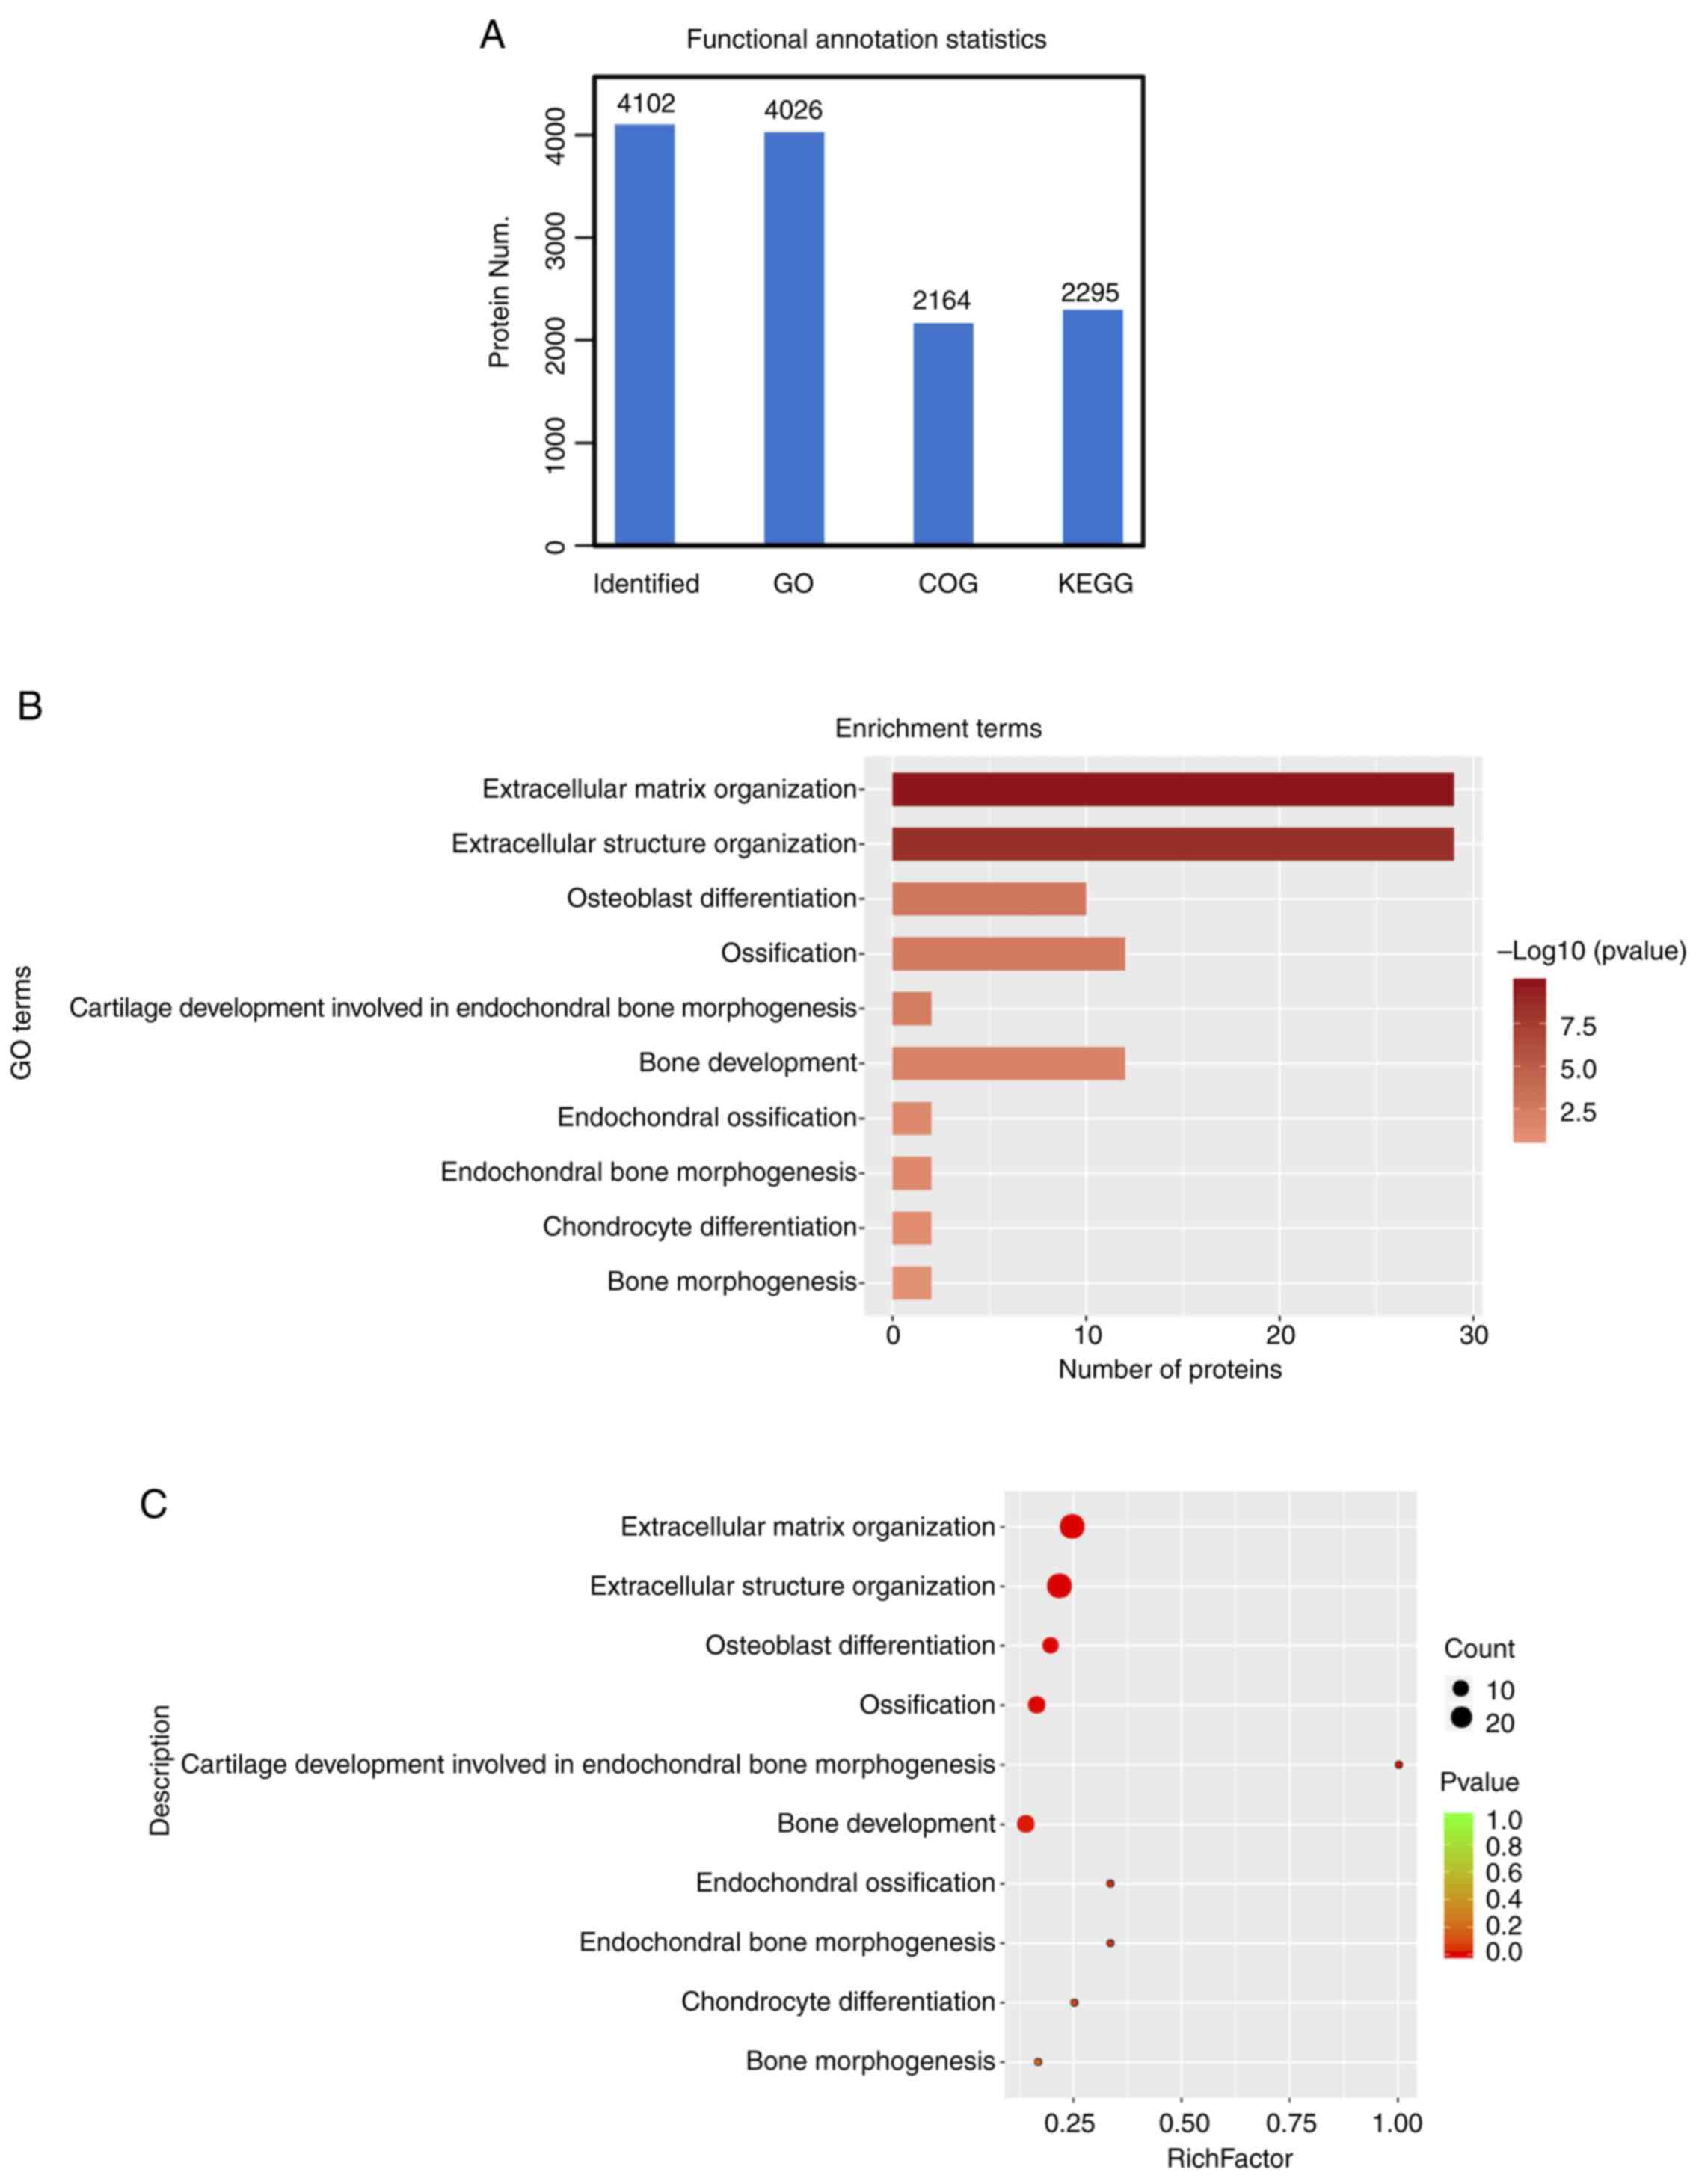
Functional annotation analysis
We also performed functional annotation [including
Gene Ontology (GO), Clusters of Orthologous Groups of protein
(COG), Pathway analysis] for all identified and significantly
differentiated proteins. After the functional annotation of the
4,102 proteins was identified, it was evident from Fig. 4A that due to the limitations of the
background annotation library, in some databases, not all proteins
had annotation information. Proteins annotated by the Gene Ontology
function were 4026, 2,164 proteins were COG annotated and Kyoto
Encyclopedia of Genes and Genomes (KEGG) were annotated at 2,295
proteins (15). Functional
annotation of the upregulated proteins showed enrichment for
extracellular matrix organization, extracellular structure
organization, and terms related to bone development (Fig. 4B). A similar analysis by bubble
chart with enrichment factor showed >20 proteins were included
in an extracellular matrix organization (Fig. 4C).
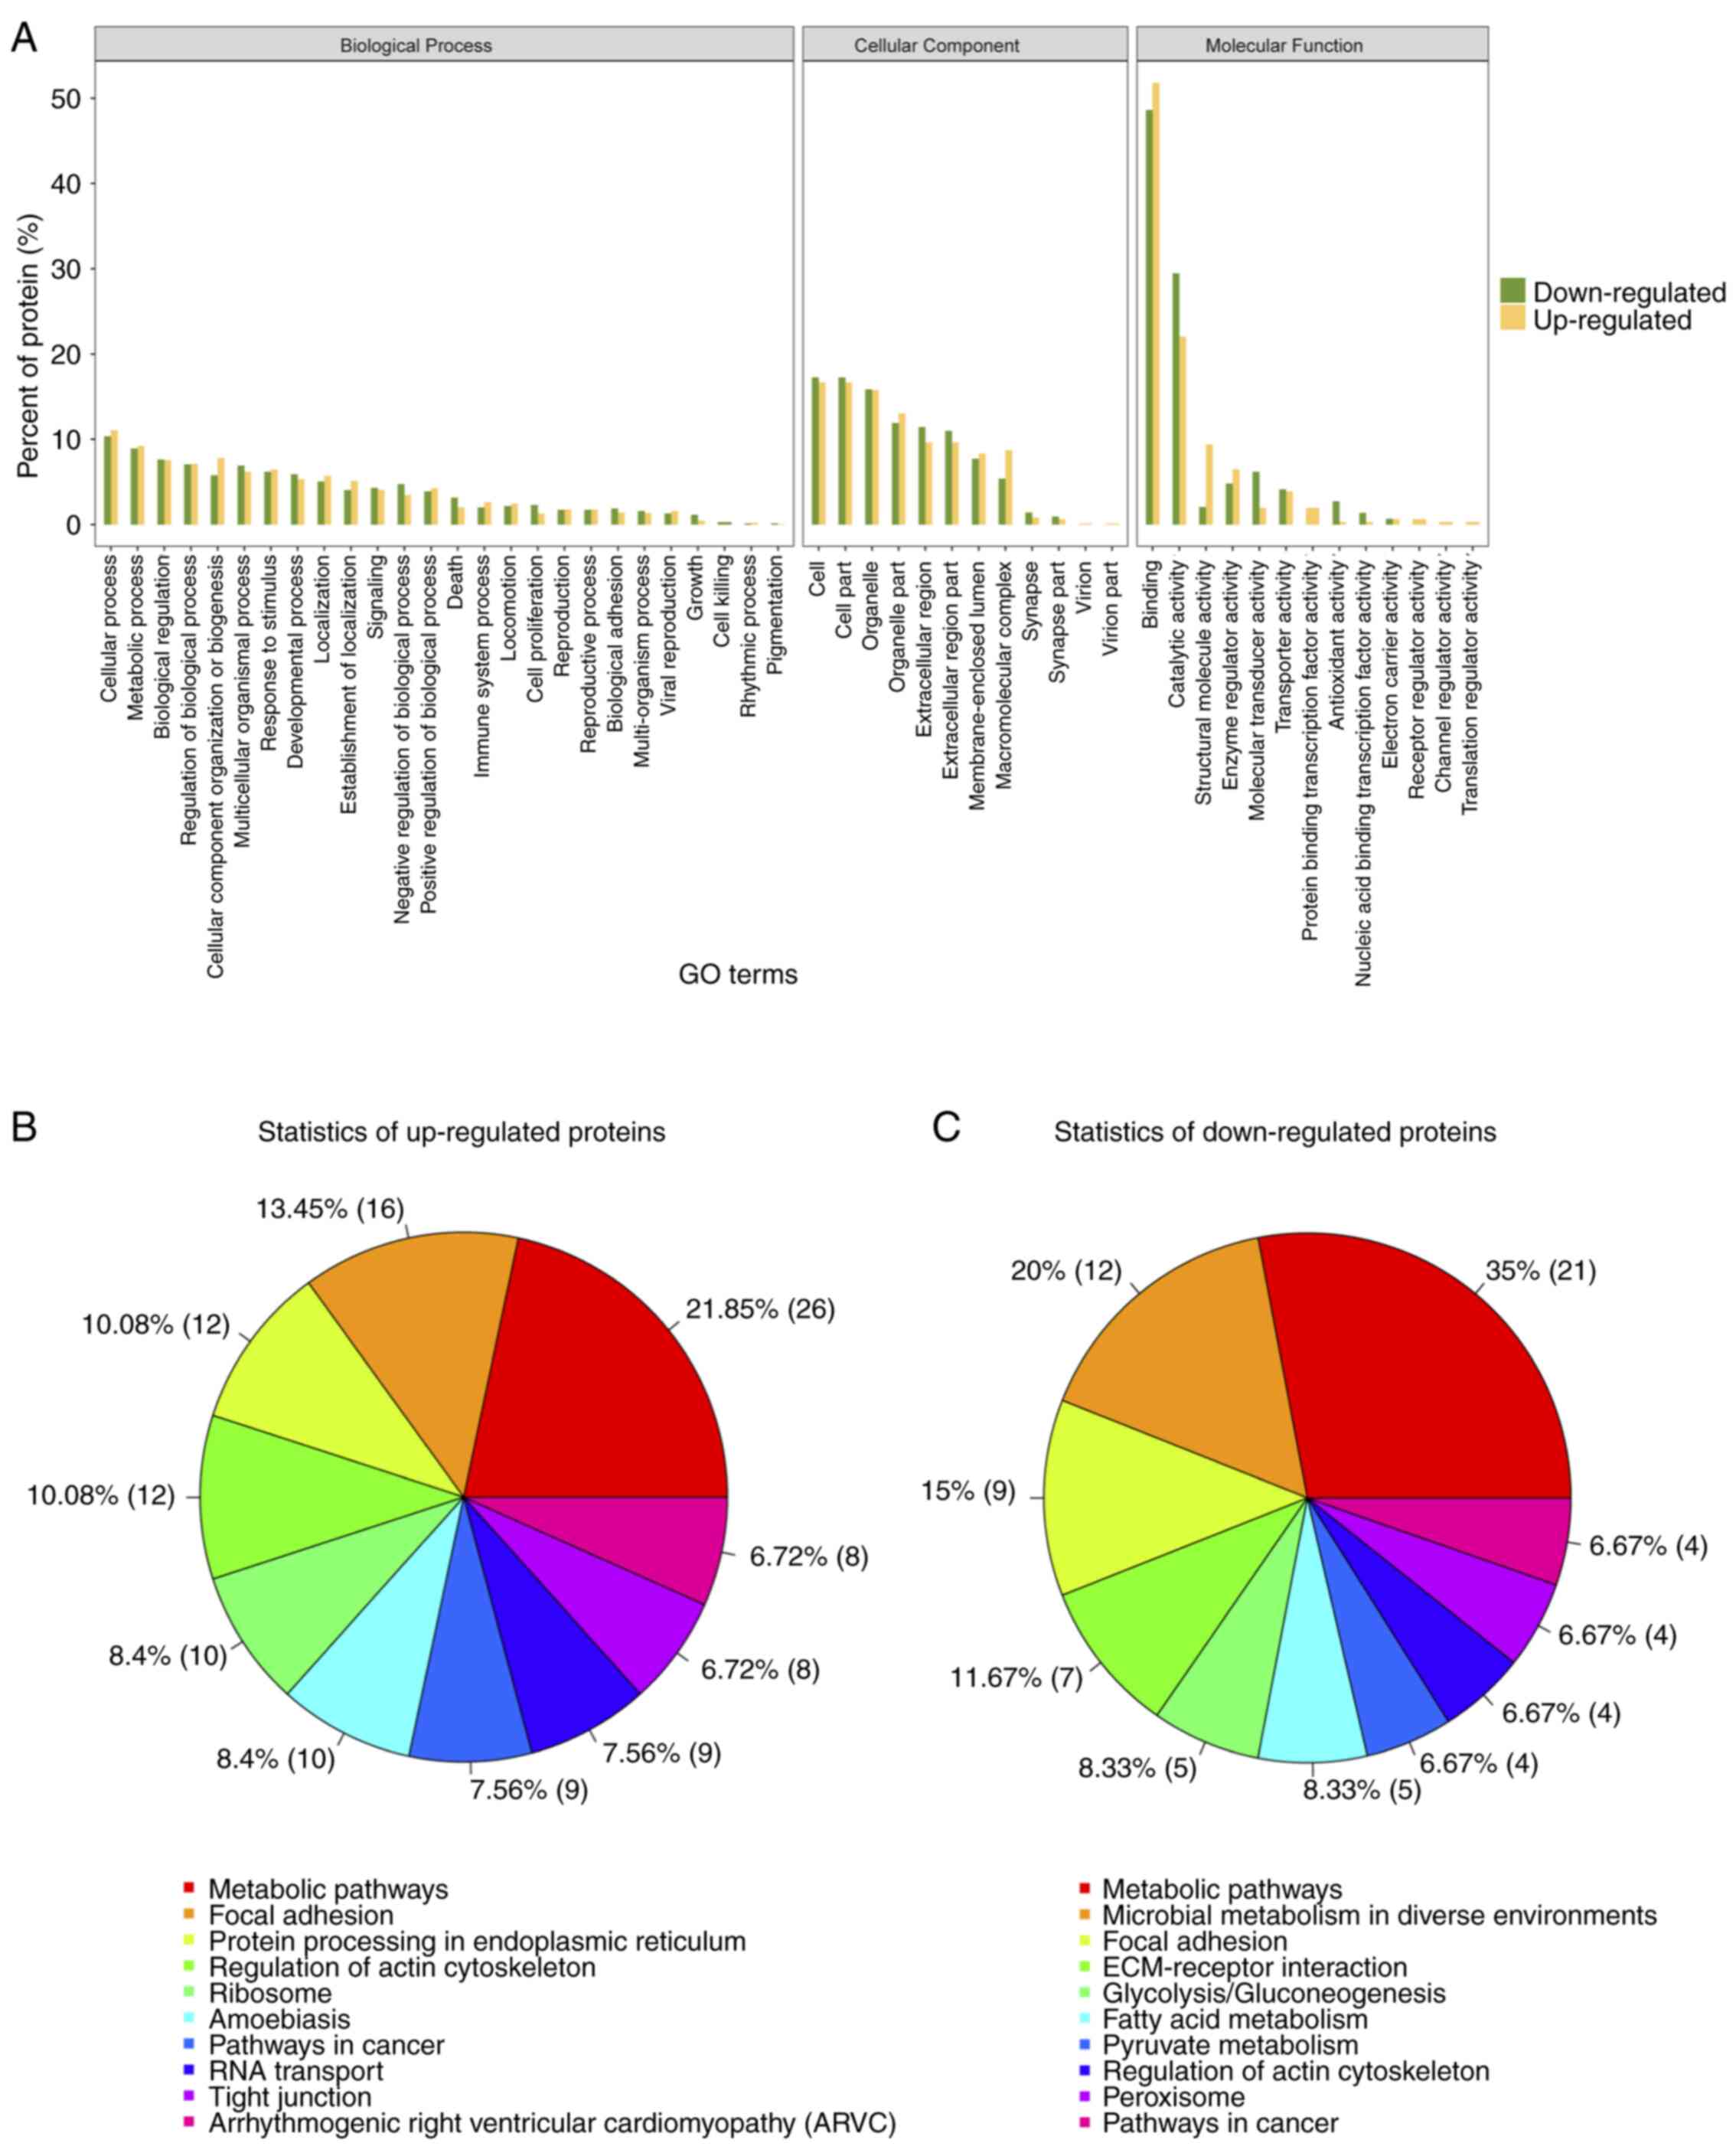
Gene ontology (GO) analysis for
differential expressed proteins
To further understand the cellular localization,
molecular functions and biological processes of the differential
expressed proteins, we performed gene ontology analysis for the 249
proteins (Fig. 5A). Over 50% of the
proteins identified and differentially expressed were annotated to
the molecular function category, under the protein binding,
catalytic activity, and structural activity terms. Pathway analysis
of the up- and downregulated proteins revealed that 21.85 and 35%
of identified proteins fit into the metabolic pathways function
respectively (Fig. 5B). Thus for
further analysis, we chose proteins that are associated with
extracellular matrix organization and metabolic pathways, which is
also in concordance with our initial objective.
Quantitative validation of
differential expressed proteins
To understand the role of BMP2 protein in osteogenic
differentiation, we validated those candidate proteins that were
involved in ECM remodelling from the proteomic data. We observed
that CDH2 and SPARC were significantly upregulated in the proteomic
assay. CDH2 and SPARC are known to be involved in osteogenesis
through signaling and maintaining the ECM organization respectively
(16–18). On the other hand, proteins that were
significantly downregulated such as fibronectin (FN), heme
oxygenase 1 (HMOX1) and heparin sulfate proteoglycan 2 (HSPG2) are
known to inhibit osteogenesis (19–21).
These candidates were validated through RT-qPCR using their
specific primers (Table II) from
BMP-2 overexpressing hMSCs. CDH2 and SPARC mRNAs showed more than
2-fold upregulation as compared to control cells (Fig. 6A and B). By contrast, HMOX1, FN1,
and HSPG2 showed 2-fold downregulation in BMP-2 overexpressing
cells as compared to those found in control cells (Fig. 6C-E). These results conform to the
high throughput data and it can be inferred that BMP2 leads to
changes in the cellular proteome that helps in osteogenic
differentiation.
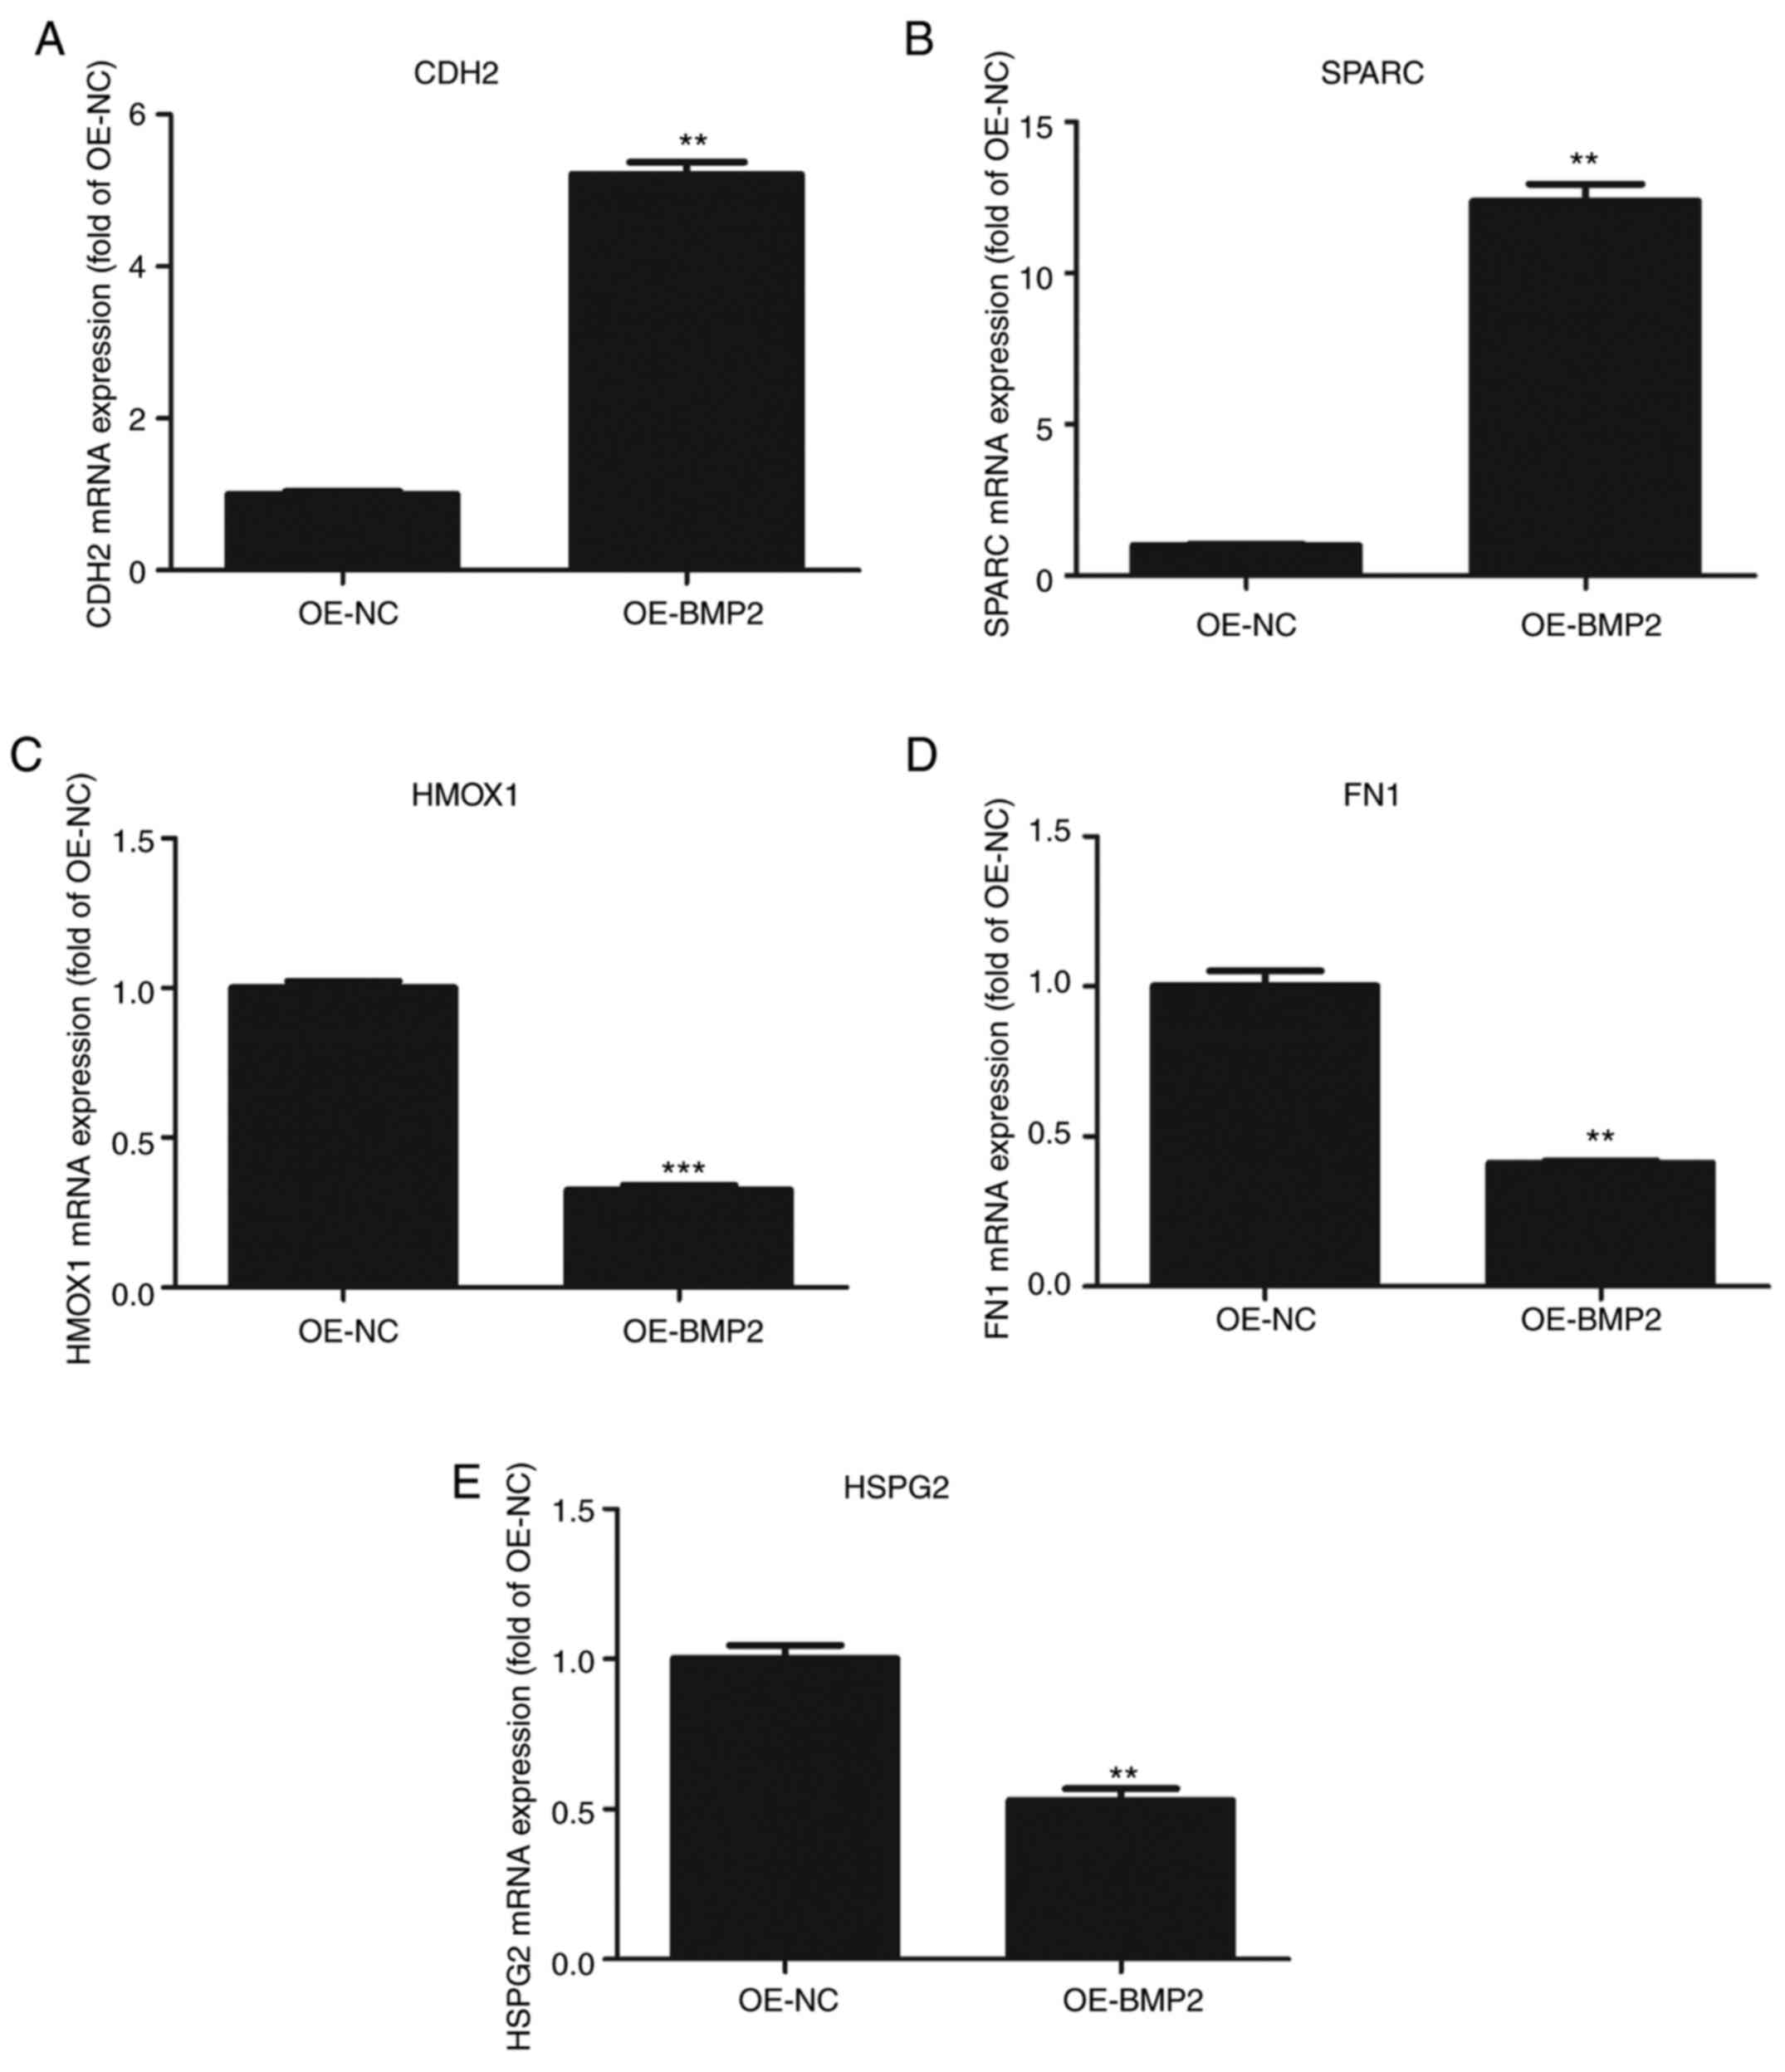 | Figure 6.Validation of proteomic data by
quantitative PCR. (A-E) Quantitative analysis of (A) N-Cadherin
(CDH2), (B) SPARC, (C) HMOX1, (D) FN1 and (E) HSPG2 mRNAs on
overexpression of BMP2 protein as compared to control vector.
Values are normalized to those from cells with control vector. n=3,
paired Student's t-test, mean ± SD. **P<0.05, ***P<0.01 vs.
OE-NC. CDH2, N-Cadherin; SPARC, secreted protein acidic and
cysteine rich; HMOX1, heme oxygenase 1; FN1, fibronectin; HSPG2,
heparin sulfate proteoglycan 2; BMP2, bone morphogenetic protein 2;
OE, overexpression; NC, negative control. |
To confirm the role of CDH2 protein in osteogenesis,
we examined hMSC differentiation in the overexpression of BMP2 but
in the absence of CDH2 protein. For the knockdown of CDH2, we
employed four different siRNAs against the CDH2 gene
(Fig. 7A and Table I). We observed the maximum reduction
of CDH2 mRNA for the second siRNA, which was used further for
knockdown assays. To check for osteogenic differentiation Alizarin
red staining was used, which binds to calcium deposits in ECM. On
overexpression of BMP2, we observed increased staining for Alizarin
red (Fig. 7C) as compared to
control cells (Fig. 7B). At the
same, we observed an increase in osteogenic markers such as
osteocalcin (OCN), collagen type II (COL-II), Runt-related
transcription factor 2 (RUNX2) and osteopontin (OPN) through
RT-qPCR analysis (Fig. 7F-I). No
change in alizarin staining was observed on the transfection of
scrambled siRNA accompanied by BMP2 overexpression as compared to
just overexpression of BMP2 (Fig.
7D). However, when CDH2 levels were perturbed by siRNA-mediated
knockdown in the backdrop of BMP2 overexpression, a stark reduction
in alizarin red staining was observed (Fig. 7E) confirming the role of CDH2 in
osteogenic differentiation of hMSCs. Simultaneously, we observed a
decrease in the osteogenic markers such as OCN, COL-II, RUNX2, OPN
on knockdown of CDH2. Thus, BMP2 induces the expression of CDH2
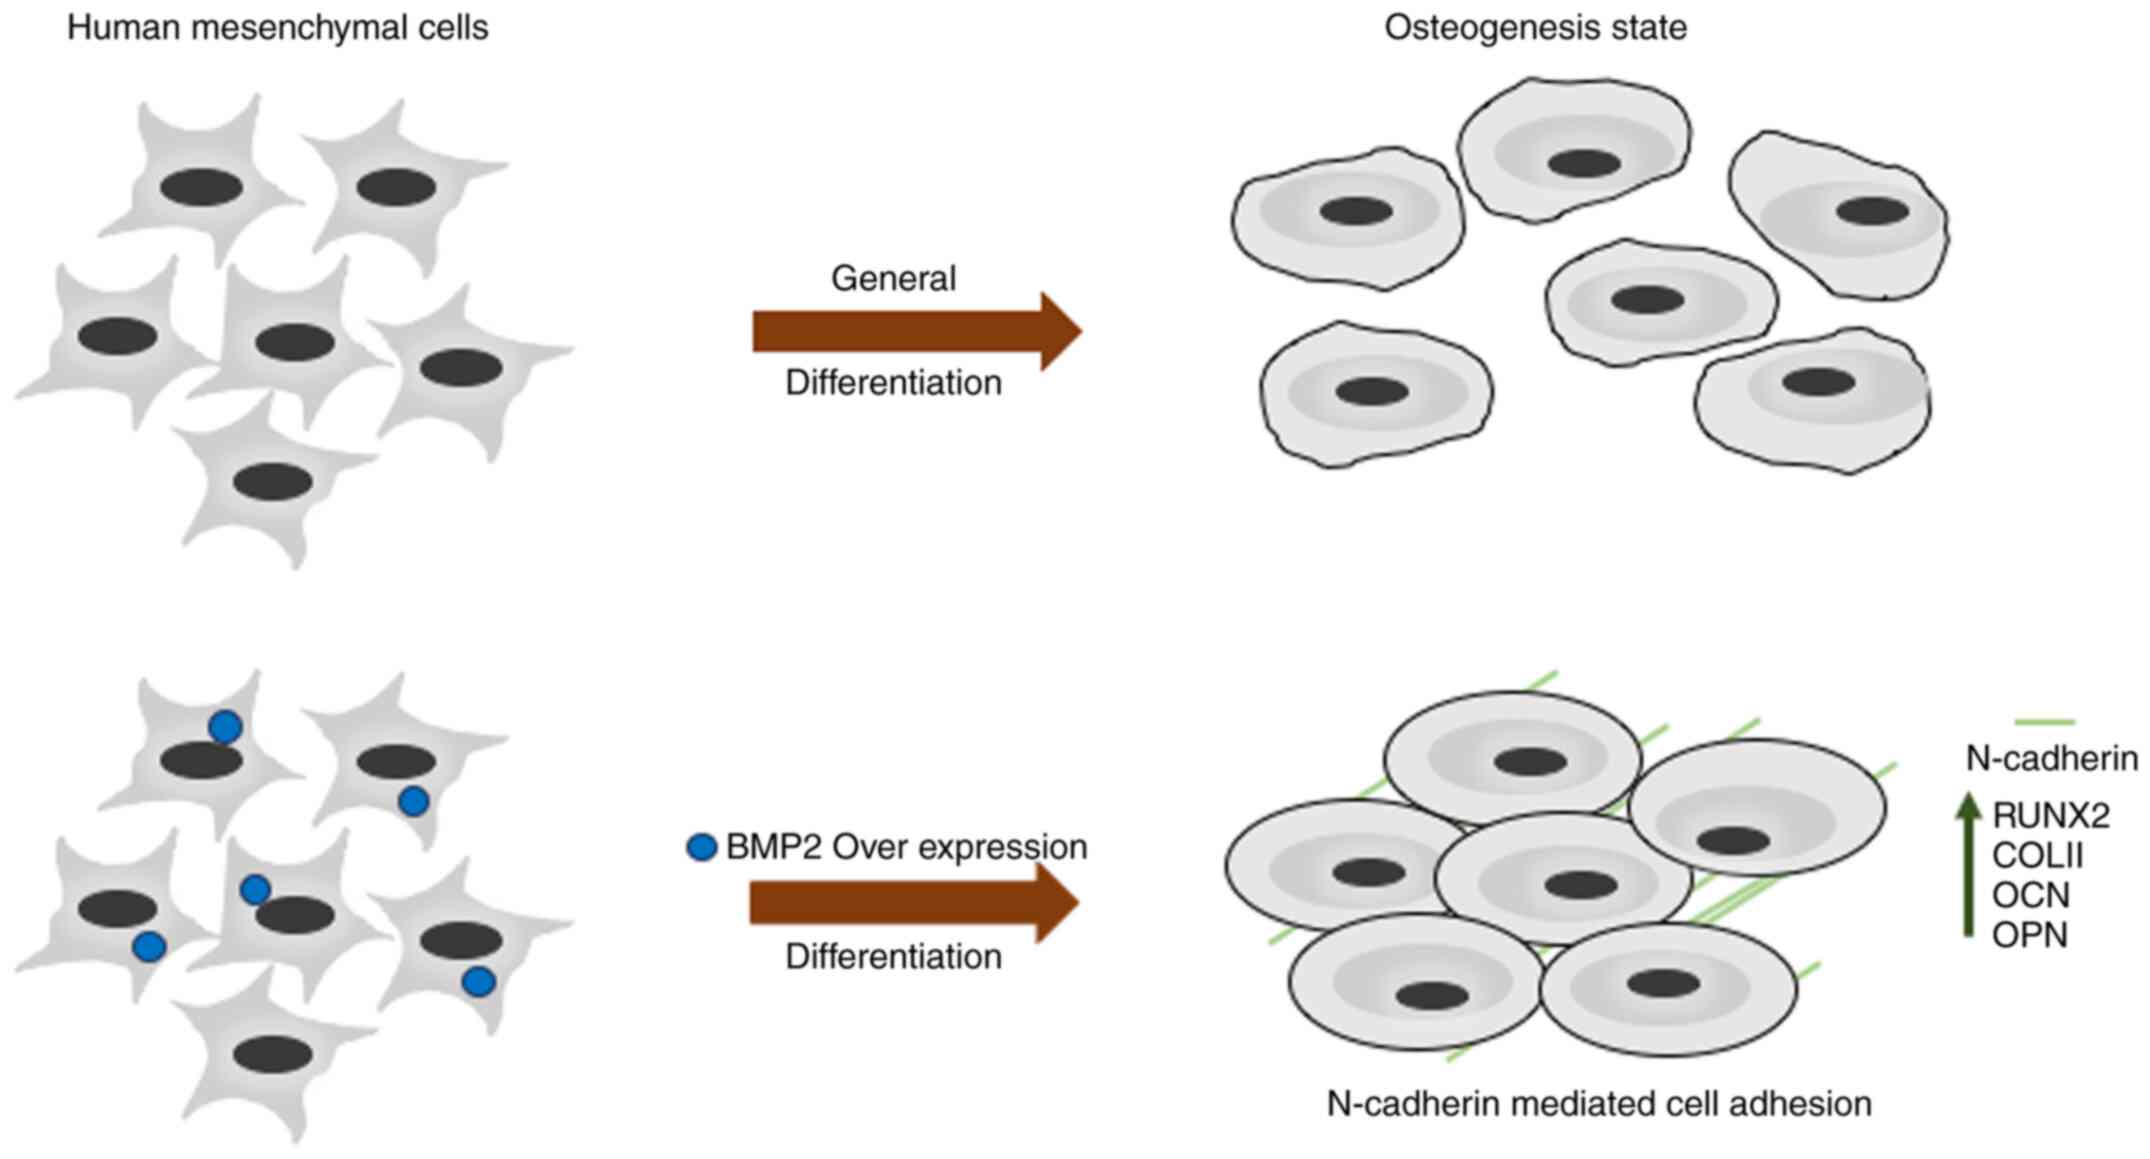
leading to increased osteogenesis in hMSCs (Fig. 8).
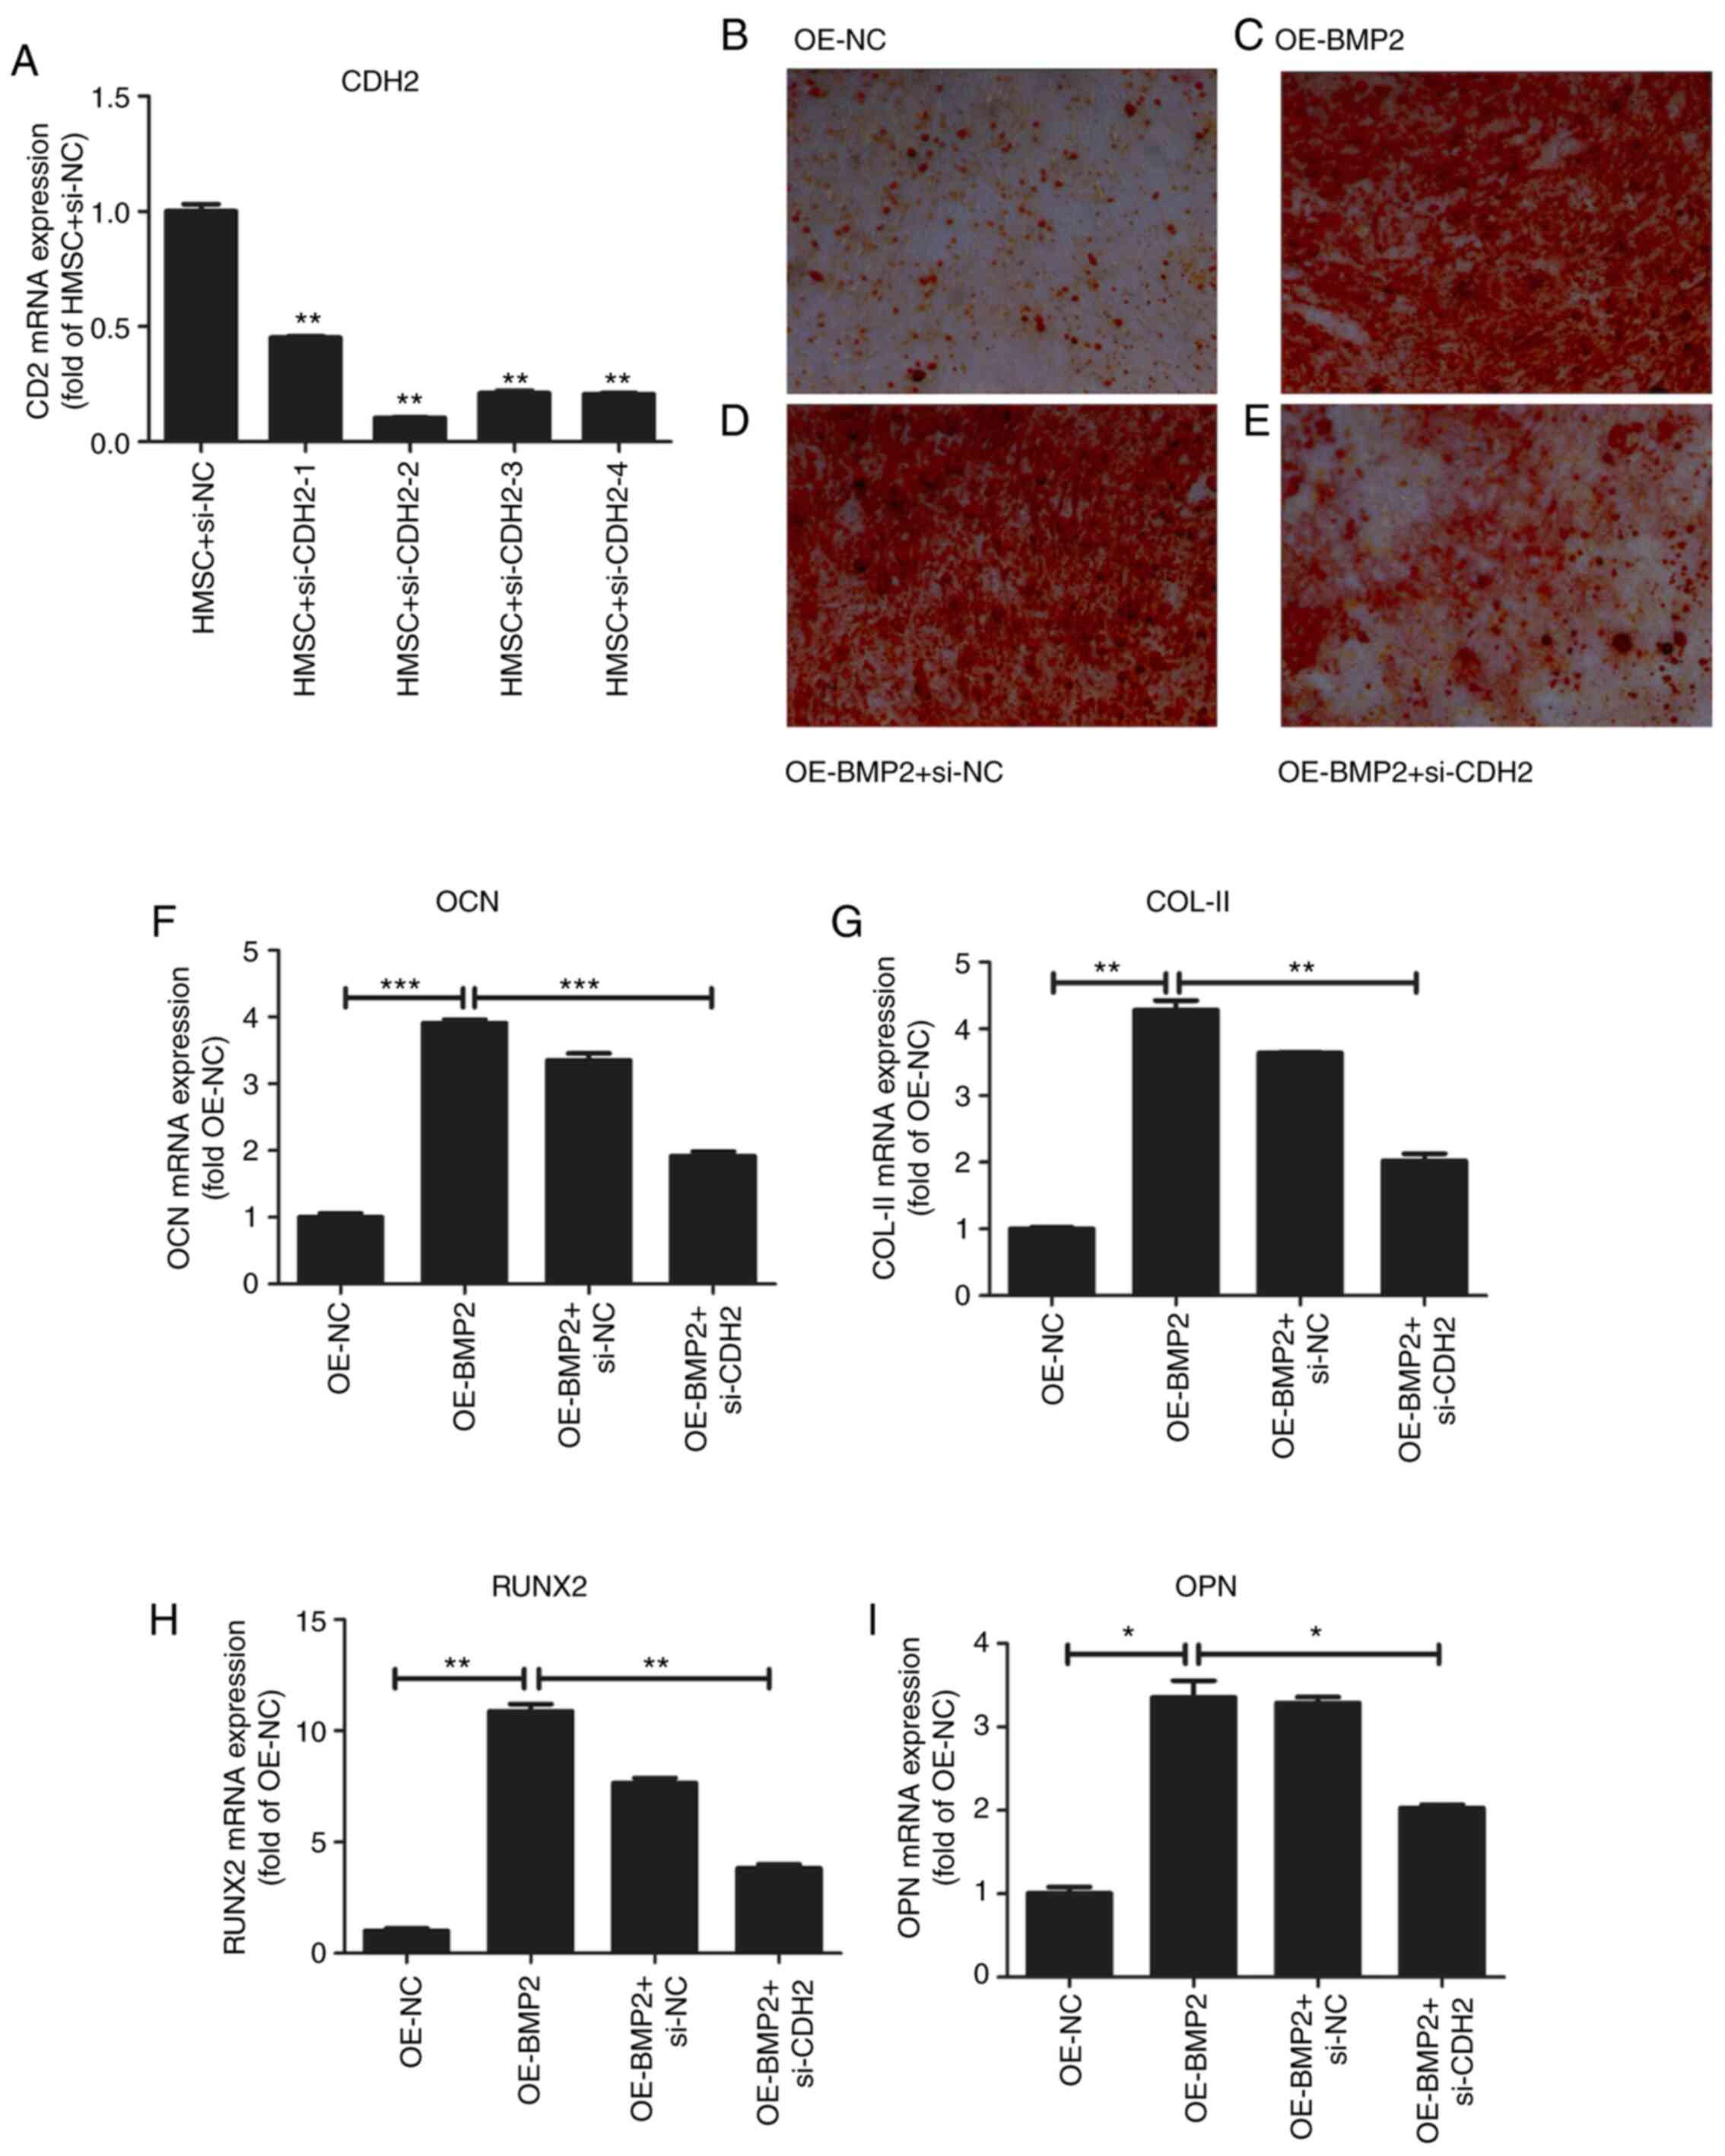 | Figure 7.Effect of overexpression of BMP-2 on
osteogenesis of hMSCs. (A) Quantitative analysis of CDH2 mRNA
levels after transfection of four different siRNAs. Values are
normalized to those from cells with control vector. N=3. (B)
Osteogenic staining by Alizarin Red in hMSCs overexpressing control
pcDNA3.1. (C) Osteogenic staining by Alizarin Red in hMSCs
overexpressing BMP-2 protein. (D) Osteogenic staining by Alizarin
Red in hMSCs overexpressing BMP-2 protein in the presence of
control siRNAs. (E) Osteogenic staining by Alizarin Red in hMSCs
overexpressing BMP-2 protein in the presence of siRNA against CDH2.
(F-I) Quantitative analysis of osteogenic markers such as OCN (F),
COL-II (G), RUNX2 (H), and OPN (I) on overexpression of BMP-2
protein and rescued by simultaneous knockdown of CDH2 gene.
Values are normalized to those from cells with control vector. N=3.
Where applicable we have used ANOVA statistical analysis and
applied Tukey's post hoc test. *P<0.05, **P<0.01 and
***P<0.001. BMP2, bone morphogenetic protein 2; hMSC, human
mesenchymal stem cells; CDH2, N-Cadherin; siRNA, small interfering
RNA; OCN, osteocalcin; COL-II, Collagen type 2; RUNX2, Runt-related
transcription factor 2; OPN, osteopontin; OE, overexpression; NC,
negative control. |
Discussion
In the present study, we have attempted to
understand the molecular effects of BMP2 overexpression in MSCs
through iTRAQ labellingl and mass spectrometric analysis. Although
there are many reports on the use of BMP2 overexpression to attain
osteogenesis in MSCs (9,11,22,23),
the exact mechanism of BMP2-mediated osteogenesis is not well
studied. In addition, no studies have yet shown the transcriptomic
or proteomic profile from MSCs post-exposure to BMP2 or even after
osteogenesis. A recent report using transcriptome profiling of
adipose stem cell-mediated osteogenesis, showed enrichment of ECM
and angiogenic genes (12). Even
though a transcriptomic profile is useful, it always does not
reflect the exact proteomic profile of the system and can be
misleading if not well-validated (24). Therefore, to the best of our
knowledge, the present study has, for the first time, created a
complete high throughput proteomic profile and bioinformatics
analysis from cells overexpressing BMP2 as compared to the vector
control cells which is novel in the field of stem cell
differentiation and bone tissue engineering.
iTRAQ-based protein quantification and bioinformatic
analysis of the cells expressing BMP2 gave us statistically
significant and reproducible results which were validated by
immunoblotting and perturbation experiments. Although the gene
ontology assessment of the proteomic high-throughput was in
concordance with the gene enrichment analysis of a study performed
by Shaik et al (12), we
also found a protein required for early osteogenesis, CDH2. CDH2 is
required for the maintenance of bone marrow progenitor cells via
cell-cell adhesion and may play a role in early osteoblastic
differentiation (25).
Overexpression of BMP2 may cause the upregulation of CDH2
gene expression via the R-Smad-dependent pathway (6) during early osteogenesis. Overall
outcomes of the present study are summarized in Fig. 8; overexpression of BMP2 may promote
the early osteogenesis that is coordinated by CDH2-mediated cell
adhesion. Upregulation of CDH2 in the early osteoblasts is
speculated to form β-catenin mediated transcriptional upregulation
of osteogenic genes such as RUNX2 (16). By knocking down CDH2 levels in the
backdrop of BMP2 overexpression, we could show that several of the
osteogenic markers such as RUNX2, OCN, OPN were also reduced.
Findings of the present study suggest a crucial role for CDH2 in
the field of osteogenesis and opens up several new avenues in the
field of osteogenesis and bone tissue engineering.
Supplementary Material
Supporting Data
Acknowledgements
Not applicable.
Funding
The authors would like to thank Wuhan Young and
Middle-aged Medical Personnel Training Project for the funding
(grant no. 201987).
Availability of data and materials
The datasets used and/or analyzed during the current
study are available from the corresponding author on reasonable
request.
Authors' contributions
HC was involved in the conception of the study and
was responsible for data curation, as well as drafting the
manuscript. JZ made substantial contributions to the conception and
design of the study, and the acquisition, analysis and
interpretation of the data. WW participated in the conception and
design of the study, and contributed to writing and revising the
manuscript for important intellectual content. AY made substantial
contributions to the conception and design of the study, and
contributed to the final approval and editing of the manuscript.
All authors read and approved the final manuscript.
Ethics approval and consent to
participate
Not applicable.
Patient consent for publication
Not applicable.
Competing interests
The authors declare that they have no competing
interests.
References
|
1
|
Kawelke N, Bentmann A, Hackl N, Hager HD,
Feick P, Geursen A, Singer MV and Nakchbandi IA: Isoform of
fibronectin mediates bone loss in patients with primary biliary
cirrhosis by suppressing bone formation. J Bone Miner Res.
23:1278–1286. 2008. View Article : Google Scholar : PubMed/NCBI
|
|
2
|
Dalle Carbonare L, Valenti MT, Zanatta M,
Donatelli L and Lo Cascio V: Circulating mesenchymal stem cells
with abnormal osteogenic differentiation in patients with
osteoporosis. Arthritis Rheum. 60:3356–3365. 2009. View Article : Google Scholar : PubMed/NCBI
|
|
3
|
Miura Y, Miura M, Gronthos S, Allen MR,
Cao C, Uveges TE, Bi Y, Ehirchiou D, Kortesidis A, Shi S and Zhang
L: Defective osteogenesis of the stromal stem cells predisposes
CD18-null mice to osteoporosis. Proc Natl Acad Sci USA.
102:14022–14027. 2005. View Article : Google Scholar : PubMed/NCBI
|
|
4
|
Beederman M, Lamplot JD, Nan G, Wang J,
Liu X, Yin L, Li R, Shui W, Zhang H, Kim SH, et al: BMP signaling
in mesenchymal stem cell differentiation and bone formation. J
Biomed Sci Eng. 6:32–52. 2013. View Article : Google Scholar : PubMed/NCBI
|
|
5
|
Wozney JM, Rosen V, Celeste AJ, Mitsock
LM, Whitters MJ, Kriz RW, Hewick RM and Wang EA: Novel regulators
of bone formation: Molecular clones and activities. Science.
242:1528–1534. 1988. View Article : Google Scholar : PubMed/NCBI
|
|
6
|
Miyazono K, Kamiya Y and Morikawa M: Bone
morphogenetic protein receptors and signal transduction. J Biochem.
147:35–51. 2010. View Article : Google Scholar : PubMed/NCBI
|
|
7
|
Scarfì S: Use of bone morphogenetic
proteins in mesenchymal stem cell stimulation of cartilage and bone
repair. World J Stem Cells. 8:1–12. 2016. View Article : Google Scholar : PubMed/NCBI
|
|
8
|
Nguyen V, Meyers CA, Yan N, Agarwal S,
Levi B and James AW: BMP-2-induced bone formation and neural
inflammation. J Orthop. 14:252–256. 2017. View Article : Google Scholar : PubMed/NCBI
|
|
9
|
Buehrer G, Balzer A, Arnold I, Beier JP,
Koerner C, Bleiziffer O, Brandl A, Weis C, Horch RE, Kneser U and
Arkudas A: Combination of BMP2 and MSCs significantly increases
bone formation in the rat arterio-venous loop model. Tissue Eng
Part A. 21:96–105. 2015. View Article : Google Scholar : PubMed/NCBI
|
|
10
|
Ishikawa H, Kitoh H, Sugiura F and
Ishiguro N: The effect of recombinant human bone morphogenetic
protein-2 on the osteogenic potential of rat mesenchymal stem cells
after several passages. Acta Orthop. 78:285–292. 2007. View Article : Google Scholar : PubMed/NCBI
|
|
11
|
Wu CC, Wang F, Rong S, Ren J, Wan JS, Shi
LX, Wu Z, Liu T and Li Q: Enhancement of osteogenesis of rabbit
bone marrow derived mesenchymal stem cells by transfection of human
BMP-2 and EGFP recombinant adenovirus via Wnt signaling pathway.
Exp Ther Med. 16:4030–4036. 2018.PubMed/NCBI
|
|
12
|
Shaik S, Martin EC, Hayes DJ, Gimble JM
and Devireddy RV: Transcriptomic profiling of adipose derived stem
cells undergoing osteogenesis by RNA-Seq. Sci Rep. 9:118002019.
View Article : Google Scholar : PubMed/NCBI
|
|
13
|
Cui Q, Xing J, Yu M, Wang Y, Xu J, Gu Y,
Nan X, Ma W, Liu H and Zhao H: Mmu-miR-185 depletion promotes
osteogenic differentiation and suppresses bone loss in osteoporosis
through the Bgn-mediated BMP/Smad pathway. Cell Death Dis.
10:1722019. View Article : Google Scholar : PubMed/NCBI
|
|
14
|
Livak KJ and Schmittgen TD: Analysis of
relative gene expression data using real-time quantitative PCR and
the 2(-Delta Delta C(T)) method. Methods. 25:402–408. 2001.
View Article : Google Scholar : PubMed/NCBI
|
|
15
|
Kanehisa M and Goto S: KEGG: Kyoto
encyclopedia of genes and genomes. Nucleic Acids Res. 28:27–30.
2000. View Article : Google Scholar : PubMed/NCBI
|
|
16
|
Arnsdorf EJ, Tummala P and Jacobs CR:
Non-canonical Wnt signaling and N-cadherin related beta-catenin
signaling play a role in mechanically induced osteogenic cell fate.
PLoS One. 4:e53882009. View Article : Google Scholar : PubMed/NCBI
|
|
17
|
Delany AM, Amling M, Priemel M, Howe C,
Baron R and Canalis E: Osteopenia and decreased bone formation in
osteonectin-deficient mice. J Clin Invest. 105:915–923. 2000.
View Article : Google Scholar : PubMed/NCBI
|
|
18
|
Haÿ E, Nouraud A and Marie PJ: N-cadherin
negatively regulates osteoblast proliferation and survival by
antagonizing Wnt, ERK and PI3K/Akt signalling. PLoS One.
4:e82842009. View Article : Google Scholar : PubMed/NCBI
|
|
19
|
Gramoun A, Azizi N, Sodek J, Heersche JN,
Nakchbandi I and Manolson MF: Fibronectin inhibits
osteoclastogenesis while enhancing osteoclast activity via nitric
oxide and interleukin-1β-mediated signaling pathways. J Cell
Biochem. 111:1020–1034. 2010. View Article : Google Scholar : PubMed/NCBI
|
|
20
|
Kanzaki H, Shinohara F, Kanako I,
Yamaguchi Y, Fukaya S, Miyamoto Y, Wada S and Nakamura Y: Molecular
regulatory mechanisms of osteoclastogenesis through cytoprotective
enzymes. Redox Biol. 8:186–191. 2016. View Article : Google Scholar : PubMed/NCBI
|
|
21
|
Lowe DA, Lepori-Bui N, Fomin PV, Sloofman
LG, Zhou X, Farach-Carson MC, Wang L and Kirn-Safran CB: Deficiency
in perlecan/HSPG2 during bone development enhances osteogenesis and
decreases quality of adult bone in mice. Calcif Tissue Int.
95:29–38. 2014. View Article : Google Scholar : PubMed/NCBI
|
|
22
|
Davis HE, Case EM, Miller SL, Genetos DC
and Leach JK: Osteogenic response to BMP-2 of hMSCs grown on
apatite-coated scaffolds. Biotechnol Bioeng. 108:2727–2735. 2011.
View Article : Google Scholar : PubMed/NCBI
|
|
23
|
Jung T, Lee JH, Park S, Kim YJ, Seo J,
Shim HE, Kim KS, Jang HS, Chung HM, Oh SG, et al: Effect of BMP-2
delivery mode on osteogenic differentiation of stem cells. Stem
Cells Int. 2017:78591842017. View Article : Google Scholar : PubMed/NCBI
|
|
24
|
Vogel C and Marcotte EM: Insights into the
regulation of protein abundance from proteomic and transcriptomic
analyses. Nat Rev Genet. 13:227–232. 2012. View Article : Google Scholar : PubMed/NCBI
|
|
25
|
Li H, Daculsi R, Grellier M, Bareille R,
Bourget C and Amedee J: Role of neural-cadherin in early
osteoblastic differentiation of human bone marrow stromal cells
cocultured with human umbilical vein endothelial cells. Am J
Physiol Cell Physiol. 299:422–430. 2010. View Article : Google Scholar
|