Introduction
Hepatic fibrosis is a pathophysiological process that results from the wound-healing response as a consequence of chronic liver injury from such conditions as viral hepatitis, metabolic disorder, alcohol abuse, cholestasis and autoimmune diseases (1). It is an early sign of cirrhosis, which can lead to liver failure or liver cancer, especially hepatocellular carcinoma (2). Hepatic stellate cells (HSCs) are considered the main precursor of myofibroblasts. Activated HSCs produce a large amount of extracellular matrix (ECM) and are the major driver of liver fibrogenesis (3). The antifibrosis effect can be achieved by inhibiting the activation of HSCs, preventing ECM deposition or accelerating ECM degradation (4). Mechanistic studies in experimental models of liver fibrosis have shown that sorafenib treatment reduced ECM deposition and reduced hepatic stellate cell activation (5,6). Sorafenib is an approved and widely used drug for liver cancer and has been shown to have antifibrosis activity in preclinical and clinical studies (7). However, the molecular mechanisms behind HSC activation in liver fibrosis remain largely unknown.
Human protein-coding genes account for <2% of the entire genome and most transcripts consist of non-coding RNAs (ncRNAs), such as microRNAs (miRNAs/miRs), circular RNAs and long non-coding RNAs (lncRNAs) (8). Advanced genomic analysis has revealed that lncRNAs are key regulatory players in global gene expression and in the pathophysiology and development of various diseases (9,10). Through multiple mechanisms, lncRNAs can serve a role in numerous liver diseases, such as fatty liver disease, cholestasis, fibrosis and cancer (11–13). The involvement of the lncRNAs, such as H19 (11), metastasis-associated lung adenocarcinoma transcript (MALAT) 1 (12) and HOX antisense intergenic RNA (10), in the development and progression of fibrosis associated with chronic liver disease has been reported. Maternally expressed gene 3 (MEG3) is associated with an inhibitory effect on liver fibrosis (13). The expression levels of MEG3 were reduce in fibrotic animals, and the restoration of MEG3 expression causes the downregulation of α-smooth muscle actin (α-SMA) and collagen type 1 α1 (COL1A1) expression levels (13). Activated HSCs express large amounts of α-SMA, secrete collagens and transdifferentiate into myofibroblast-like cells, which are the major ECM-secreting cells that secrete abundant amounts of ECM into the liver tissue interspace, resulting in liver architecture remodelling (2,14). HSCs account for 80% of COL1A1 in the fibrotic liver (15). Chen et al (16) reported that the serum MEG3 levels in patients with chronic hepatitis B (CHB) were lower compared with those of healthy controls, which was negatively correlated with the degree of liver fibrosis. Together, these studies suggest an important role for MEG3 in liver fibrosis progression and MEG3 may serve as a potential diagnostic biomarker and therapeutic target for liver fibrosis.
In addition, lncRNAs can function as competitive endogenous RNAs (ceRNAs), which mainly sponge miRNAs and protect mRNAs from miRNA-mediated post-translational regulation (17). Previous studies have investigated MALAT/miR-101b/Rac1 (18), nuclear paraspeckle assembly transcript 1/miR-29b/autophagy-related protein 9a (19) and MEG3/miR-212/smoothened (15) signaling pathways in hepatic liver fibrosis or injury. These studies demonstrate that lncRNA/miRNA/mRNA interactions increase the complexity of the co-regulatory network, especially in liver fibrosis (20). The present study aimed to explore the mechanism underlying MEG3-related liver fibrosis to provide novel strategies for its clinical treatment. The results demonstrated that the loss of MEG3 expression in liver fibrosis and restoration of MEG3 expression suppressed the trigger of HSC activation in vitro. The results indicated a novel mechanism of MEG3-mediated inhibition on liver fibrosis via the MEG3/miR-145/peroxisome proliferator-activated receptor γ (PPARγ) axis.
Materials and methods
Specimen collection
Healthy patients (n=25) and patients with liver fibrosis (mild and severe; n=25) were recruited between January and September 2020. Hepatic fibrosis was evaluated, according to the fibrosis index based on the 4 factor (FIB-4) index, which can be used for the diagnosis and staging of liver fibrosis (21). Patients were divided into mild (F<2; n=12) and moderate to severe (2≤F<4; n=13) fibrosis groups. The healthy control group included patients with normal transaminase activity, no history of liver disease or alcohol abuse and no history of hepatitis B, hepatitis C or HIV infection. The study protocol was in line with the standards set by the Declaration of Helsinki and was approved by the Ethics Committee of Yan'an Hospital of Kunming (Kunming, China; approval no. YXLL-AF-SC-022/01). All participants signed an informed consent form. The clinicopathological characteristics of all patients are shown in Table I. A peripheral blood sample (8 ml) was collected from patients with liver fibrosis and healthy volunteers during their first admission to the hospital. Serum isolated from peripheral blood was stored at −80°C.
 |
Table I.
Pathological characteristics of patients with hepatic fibrosis.
|
Table I.
Pathological characteristics of patients with hepatic fibrosis.
| Characteristic |
Healthy donors, n=25 |
Patients (F<2), n=12 |
Patients (2≤F<4), n=13 |
| Age, n (range) |
55.44 (23–84) |
55.83 (25–80) |
56.92 (31–77) |
| Sex, n (%) |
|
|
|
| Male |
14 (56) |
7 (58.3) |
5 (38.5) |
| Female |
11 (44) |
5 (41.7) |
8 (61.5) |
| HCV, n (%) |
|
|
|
| With |
n/a |
2 (16.7) |
3 (23) |
| Without |
n/a |
10 (83.3) |
10 (77) |
| Serum ALT, U/l |
35.40±16.92 |
90.92±53.68 |
134.8±86 |
| Serum AST, U/l |
37.52±19.92 |
97.25±64.62 |
150.6±74.8 |
Cell culture
The LX-2 human hepatic stellate cell line was obtained from The Cell Bank of Type Culture Collection of the Chinese Academy of Sciences. Cells were cultured in RPMI-1640 medium (Gibco; Thermo Fisher Scientific, Inc.) supplemented with 1% penicillin-streptomycin solution (Beijing Solarbio Science & Technology Co., Ltd.) and 10% fetal bovine serum (Invitrogen; Thermo Fisher Scientific, Inc.). Cells were cultured in a humidified 37°C incubator with 5% CO2. For certain experiments, cells were cultured at 37°C for 8–12 h and then incubated with 10 ng/ml human recombinant TGF-β1 (R&D Systems, Inc.) for 24 h (22).
Cell transfection
Short hairpin RNAs (shRNAs/sh) targeting MEG3 (forward, 5′-CCGGATAGAGGAGGTGATCAGCAAACTCGAGTTTGCTGATCACCTCCTCTATTTTTTG-3′ and reverse, 5′-AATTCAAAAAATAGAGGAGGTGATCAGCAAACTCGAGTTTGCTGATCACCTCCTCTAT-3′), miR-145 mimic (forward, 5′-GUCCAGUUUUCCCAGGAAUCCCU-3′ and reverse, 5′-AGGGAUUCCUGGGAAAACUGGAC-3′) and negative control (NC)-mimic (forward, 5′-UCACAACCUCCUAGAAAGAGUAGA-3′ and reverse, 5′-UCUACUCUUUCUAGGAGGUUGUGA-3′), miR-145 inhibitor (5′-AGGGAUUCCUGGGAAAACUGGAC-3′) and NC-inhibitor (5′-UCUACUCUUUCUAGGAGGUUGUGA-3′) were obtained from Shanghai GenePharma Co. Ltd. An empty plasmid cloning (pc)DNA3.1(+) vector (Addgene, Inc.) was used as a control for MEG3 and PPARγ overexpression pcDNA3.1(+) constructs. LX-2 cells (5×10⁵ cells/well) were seeded into 6-well plates for 24 h, and then transfected with the aforementioned recombinant vectors (2 µg), shRNA (1 µg), miR-145 mimic (20 nM), miR-145 inhibitor (20 nM) or the controls, at 40–60% confluence using Lipofectamine® 2000 (Invitrogen; Thermo Fisher Scientific, Inc.) according to the manufacturer's protocol. Transfected cells were harvested 48 h after transfection.
Reverse transcription-quantitative PCR (RT-qPCR)
LX-2 cells and peripheral blood samples were harvested and total RNA was extracted using TRIzol® reagent (Invitrogen; Thermo Fisher Scientific, Inc.) according to the manufacturer's protocol. Total RNA was reverse transcribed into cDNA using an iScript™ cDNA Synthesis kit (Bio-Rad Laboratories, Inc.) according to the manufacturer's protocol. qPCR was subsequently performed using the SYBR Green Real-Time PCR Assay kit (Takara Bio, Inc.) according to the manufacturer's protocol. qPCR thermocycling conditions were as follows: Initial denaturation at 95°C for 10 min, followed by 45 cycles of denaturation at 95°C for 15 sec and annealing/extension at 60°C for 1 min. The relative expression levels were quantified using the 2−ΔΔCq method and normalized to the internal reference genes GAPDH or U6 (23). Primer sequences are listed in Table II.
|
Table II.
Sequences of primers used for reverse transcription--quantitative PCR.
|
Table II.
Sequences of primers used for reverse transcription--quantitative PCR.
| Gene |
Primer sequence (5′→3′) |
| PPARγ |
F: ATTTTCTGGAGAGCTTGGC |
| |
R: GTGAGGGTCTCTCTCTTCCT |
| α-SMA |
F: GACGAAGCACAGAGCAAAAG |
| |
R: ACAGCACCGCCTGGATAG |
| COL1A1 |
F: GAGGCATGTCTGGTTCGG |
| |
R: TGGTAGGTGATGTTCTGGGAG |
| MEG3 |
F: CCTGCTGCCCATCTACACCTC |
| |
R: CCTCTTCATCCTTTGCCATCCTGG |
| miR-145 |
F: ATATCTCGAGGGAGAGAGATGCCTTCAGCA |
| |
R: ATTTATAAGCTTGGAATCCTTCTCAACACTGAATATCTAC |
| U6 |
F: CTCGCTTCGGCAGCACA |
| |
R: AACGCTTCACGAATTTGCGT |
| GAPDH |
F: AATCCCATCACCATCTTC |
| |
R: AGGCTGTTGTCATACTTC |
Cell Counting Kit-8 (CCK-8) assay
LX-2 cells were seeded at a density of 5×10³ cells/well into 96-well plates and placed in a 5% CO2 incubator at 37°C. Following incubation for various durations (1, 2, 3, 4 and 5 days), 10 µl CCK-8 reagent (Shanghai Obio Technology Corp., Ltd.) was added to each well. Following incubation for 4 h, the optical density at 450 nm was quantified using a microplate reader (Bio-Tek Instruments, Inc.).
Immunofluorescence
To detect α-SMA and COL1A1 expression, LX-2 cells were seeded at a density of 5×10⁵ cells/well into 12-well culture plates with poly-D-lysine-coated glass coverslips on the bottom. The cells were fixed with 4% paraformaldehyde (dissolved in PBS, pH 7.4) for 10 min at room temperature. The cells were then washed three times with cooled PBS. Following cell attachment, a blocking solution of 5% BSA (Shanghai Lianmai Biological Engineering Co., Ltd.) was applied for 1 h at room temperature and washed twice with PBS for 10 min. Subsequently, cells were incubated with primary antibodies targeting α-SMA (1:500; Abcam; cat. no. ab7817) or COL1A1 (1:500; Abcam; cat. no. ab260043) at 37°C for 30 min. Cells were than incubated with the following secondary antibodies: Alexa Fluor 488-conjugated goat anti-mouse IgG (Invitrogen; Thermo Fisher Scientific, Inc. cat. no. SA510212) or Alexa Fluor 594-conjugated goat anti-rabbit IgG (Invitrogen; Thermo Fisher Scientific, Inc. cat. no. A-11012) at 37°C for 30 min. DAPI (Sigma-Aldrich; Merck KGaA) staining was performed at room temperature for 15 min, then the cells were rinsed with 0.1% Tween-20 PBS at room temperature three times for 10 min each. Images were captured under fluorescence microscopy (Leica Microsystems GmbH; magnification, ×100).
Western blotting
LX-2 cells and patient serum were cytolyzed to obtain the total protein using RIPA lysis buffer (Beyotime Institute of Biotechnology) on ice for 30 min. Total protein was quantified using a BCA Protein Assay Reagent kit (Thermo Fisher Scientific, Inc.) and 50 µg total protein/lane was separated by SDS-PAGE on a 10% gel. The separated proteins were subsequently transferred onto a PVDF membrane. Membranes were blocked using 5% skimmed milk at room temperature for 1 h and incubated with the following specific primary antibodies overnight at 4°C: α-SMA (1:1,000; Abcam; cat. no. ab7817), COL1A1 (1:1,000; Abcam; cat. no. ab260043), PPARγ (1:1,000; Abcam; cat. no. EPR21244) and β-actin (1:3,000; Abcam; cat. no. ab8226). Membranes were washed three times with TBS containing 0.1% Tween-20. Following the primary antibody incubation, membranes were incubated with HRP-labeled secondary antibody goat anti-mouse IgG (1:5,000; Sigma-Aldrich; Merck KGaA; cat. no. 12-349) or goat anti-rabbit IgG (1:5,000; Sigma-Aldrich; Merck KGaA; cat. no. 12-348) at room temperature for 2 h. Protein bands were visualized using Clarity™ Western ECL substrate (Bio-Rad Laboratories, Inc.). Semi-quantitative densitometry of the immunoblot images was analyzed using ImageJ software (National Institutes of Health; 1.8.0 version). β-actin was used as the internal reference gene.
Prediction of miRNA targets
The potential binding sites of MEG3 and miR-145 were predicted using miRBase (http://www.mirbase.org). The potential binding sites between miR-145 and PPARγ were predicted using starBase database (http://starbase.sysu.edu.cn/index.php).
Dual-luciferase reporter assay. The lncRNA MEG3 and PPARγ 3′UTR fragments containing the wild-type (WT) or mutant (MUT) miR-145 putative binding sites were amplified by PCR from human genomic DNA and cloned into the psi-CHECK2 reporter vector (Promega Corporation). The WT or MUT reporter vector were co-transfected with miR-145 mimic or mimic negative control into LX-2 cells (5×10⁴ cells/well) using Lipofectamine 2000 at room temperature. At 48 h after transfection, luciferase activity was detected using a Dual-Luciferase Reporter Assay System (Promega Corporation) according to the manufacturer's protocol. Firefly luciferase activity was normalized to Renilla luciferase activity.
Statistical analysis
Data are presented as the mean ± standard deviation or median + interquartile range. At least three times experiments were performed independently. SPSS 16.0 software (SPSS, Inc.) was used for statistical analysis. An unpaired Student's t-test was used to draw statistical comparisons between two groups, and one-way ANOVA followed by a Tukey's post hoc test was used to make comparisons between multiple groups. P<0.05 was considered to indicate a statistically significant difference.
Results
lncRNA MEG3 expression level is associated with the progression of liver fibrosis
To determine whether MEG3 participated in the progression of liver fibrosis, peripheral blood samples from healthy patients (25 samples) and patients with liver fibrosis were obtained (12 mild fibrosis samples and 13 severe fibrosis samples). MEG3 expression levels were determined using RT-qPCR, and the results demonstrated that MEG3 expression was significantly decreased in the mild and severe fibrosis groups compared with the healthy group (Fig. 1A). Furthermore, MEG3 expression levels were significantly lower in the severe fibrosis group compared with the mild fibrosis group (Fig. 1A). TGF-β1 can activate HSCs to produce excessive ECM to participate in liver fibrosis (24), thus, in the present study, TGF-β1 was used to induce LX-2 cells to mimic the state of liver fibrosis. To investigate the association between MEG3 expression levels and liver fibrosis in vitro, LX-2 cells were treated with 10 ng/ml TGF-β1 for 24 h. Compared with the control group, TGF-β1 treatment significantly inhibited MEG3 expression in LX-2 cells (Fig. 1B).
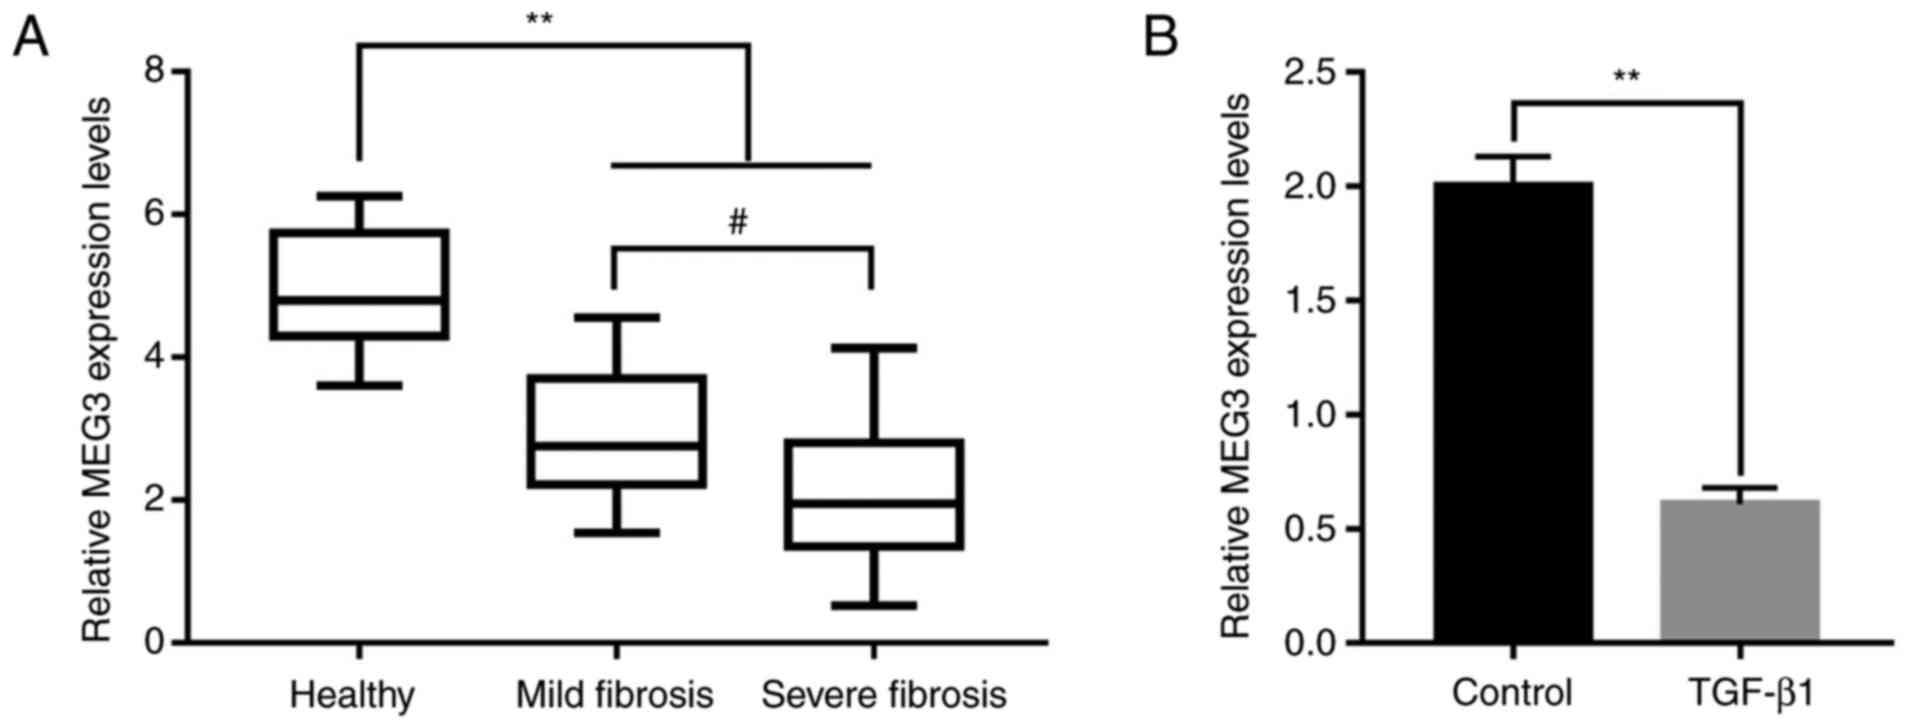 |
Figure 1.
Long non-coding RNA MEG3 expression level is associated with the progression of liver fibrosis. (A) MEG3 expression levels in the serum of healthy volunteers and in patients with mild or severe hepatic fibrosis. (B) MEG3 expression levels in LX-2 cells were quantified by reverse transcription-quantitative PCR. **P<0.01; #P<0.05. MEG3, maternally expressed gene 3.
|
Overexpression of MEG3 alleviates TGF-β1-stimulated HSC activation
To investigate the role of MEG3 in HSC activation, LX-cells were transfected with pcMEG3 overexpression vector. RT-qPCR demonstrated that MEG3 expression levels were significantly increased by pcMEG3 in LX-2 cells in the absence or presence of TGF-β1 stimulation compared with the vector and TGF-β1+vector controls, respectively (Fig. 2A and B). The effect of MEG3 overexpression on LX-2 cell proliferation was also assessed. Cell proliferation was significantly increased by TGF-β1 treatment compared with the control group, whereas pcMEG3 significantly reversed this effect compared with TGF-β1+vector (Fig. 2C). Immunofluorescence results demonstrated that TGF-β1 treatment markedly increased the expression of liver fibrosis markers, α-SMA and COL1A1, and these expression levels were notably decreased when MEG3 was overexpressed in LX-2 cells (Fig. 2D). Western blotting also supported this conclusion. TGF-β1 treatment could significantly upregulate the expression of α-SMA and COL1A1 compared with the control group; however, when MEG3 was overexpressed in LX-2 cells, these expression levels were significantly downregulated (Fig. 2E).
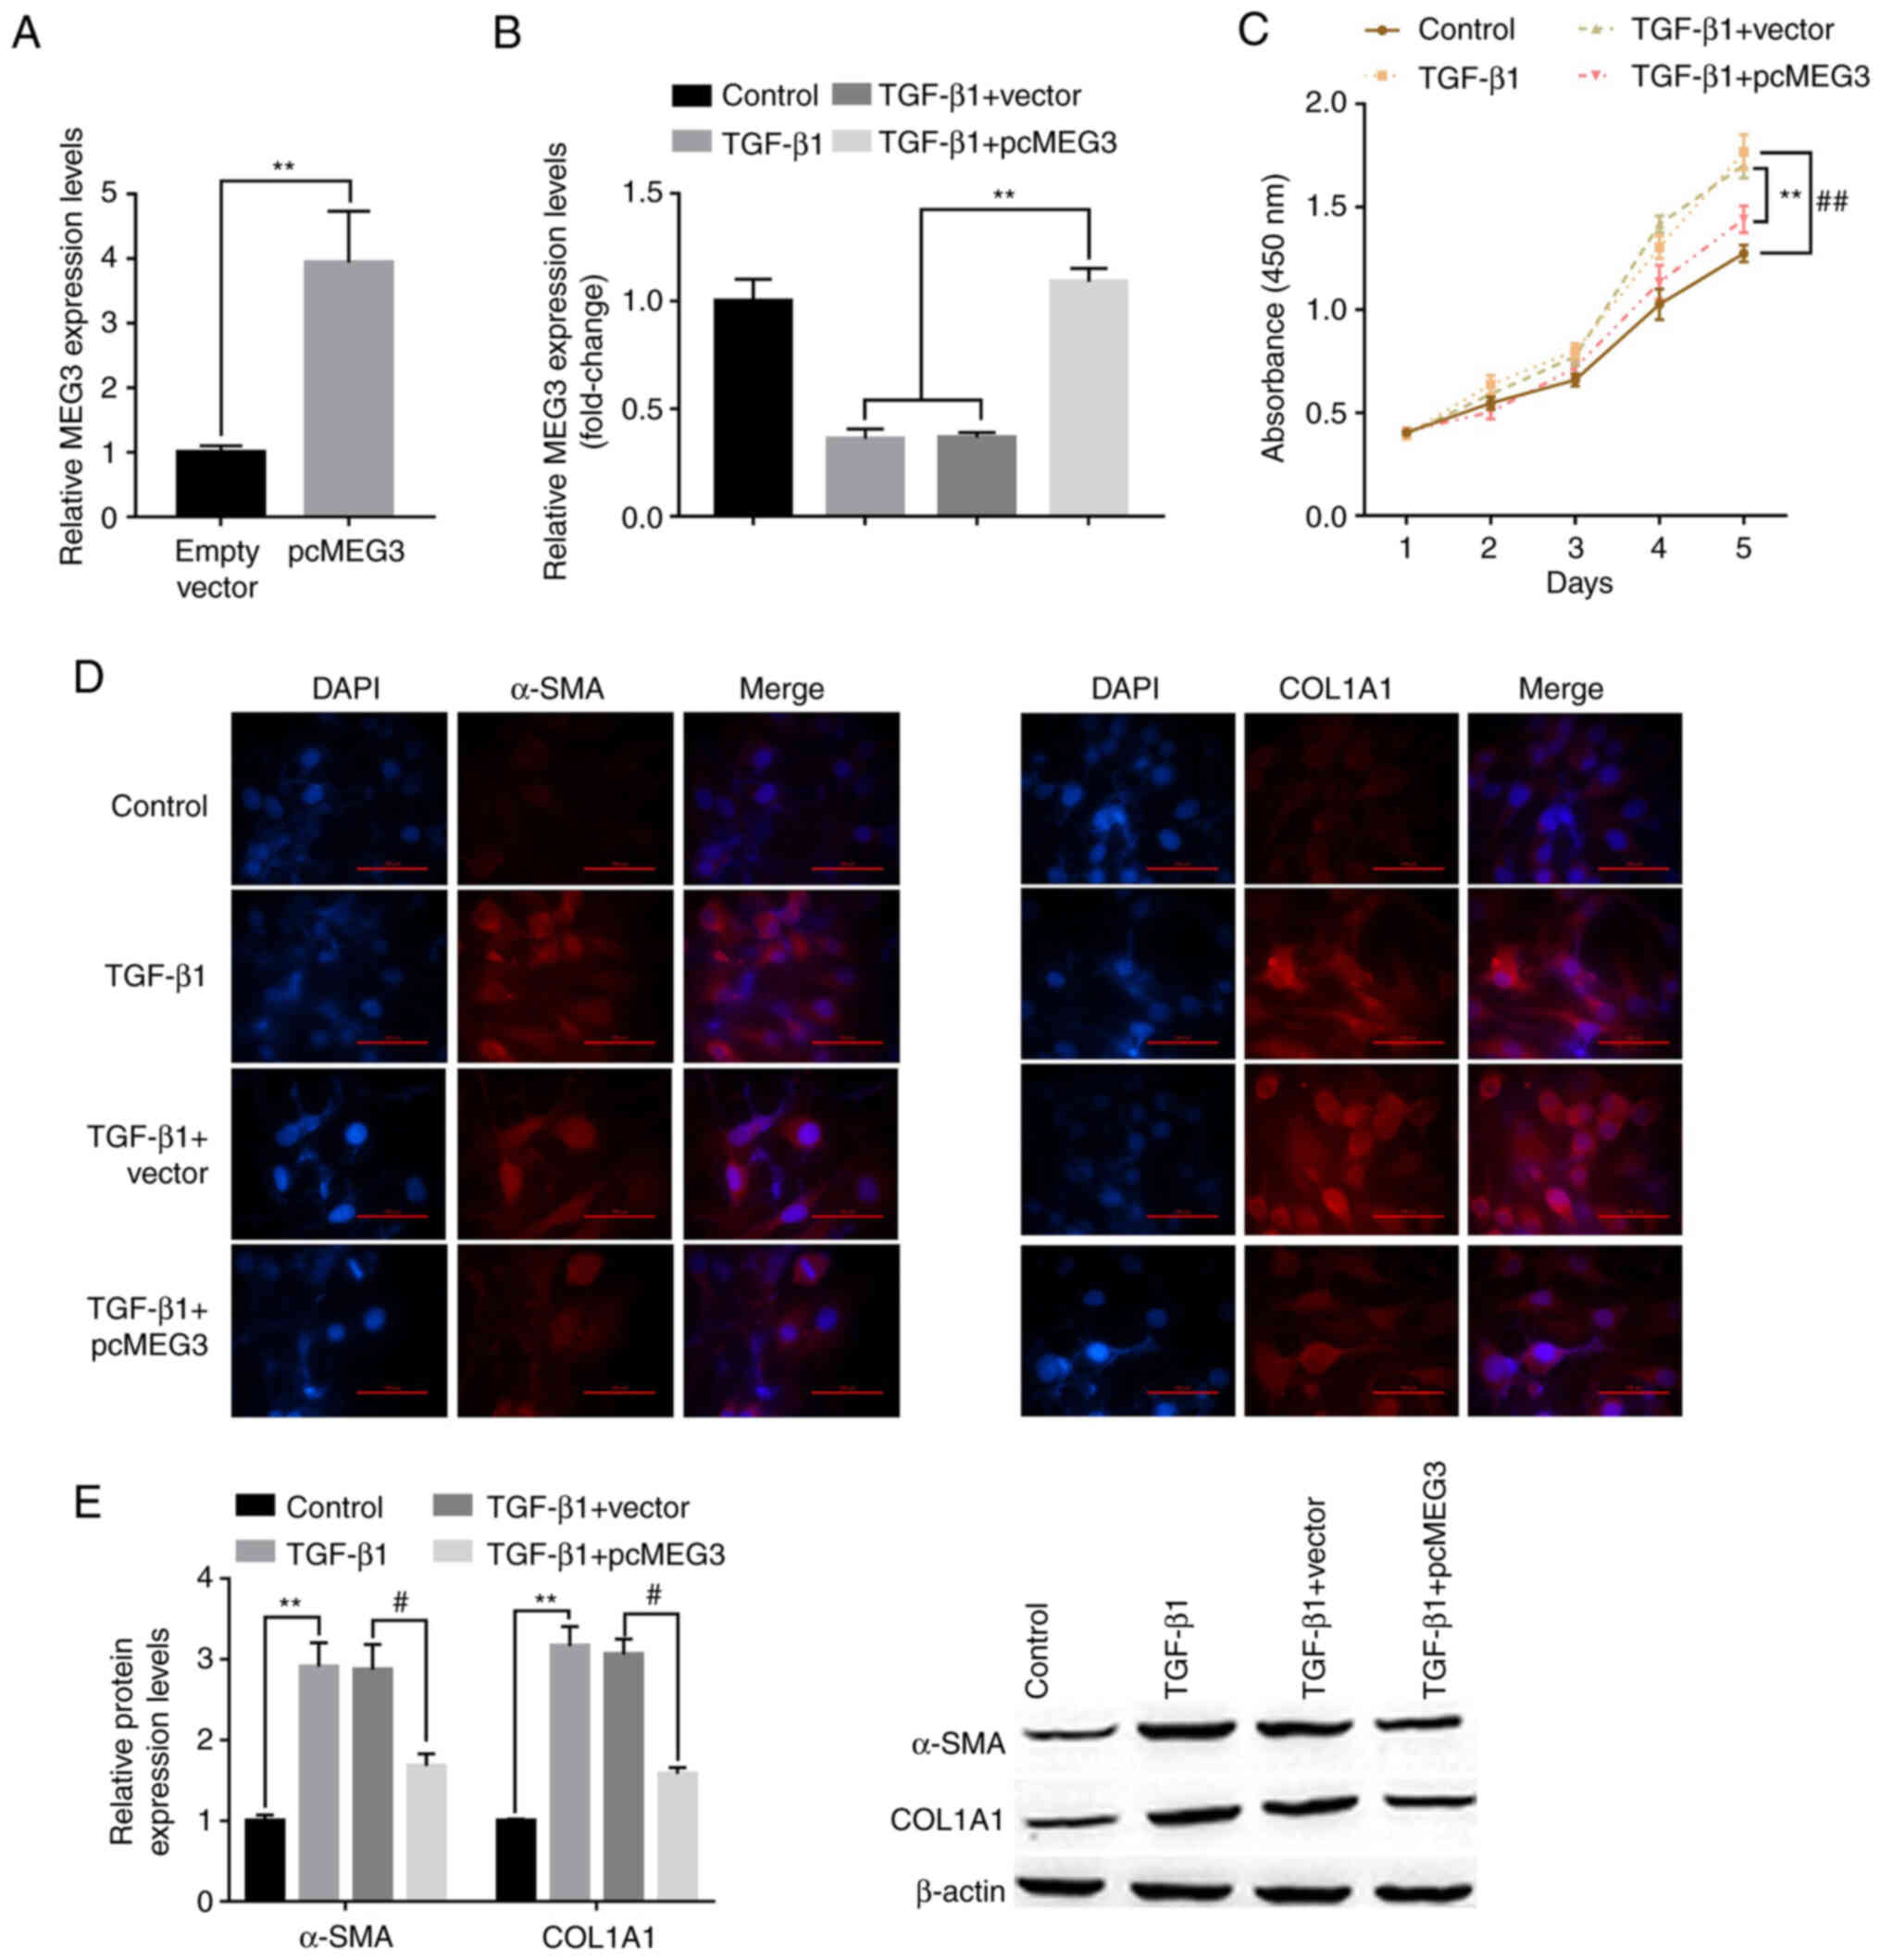 |
Figure 2.
Overexpression of MEG3 alleviates TGF-β1-stimulated hepatic stellate cell activation. (A) Following overexpression vector transfection, MEG3 expression levels in LX-2 cells were detected by RT-qPCR. (B) Following MEG3 overexpression and TGF-β1 treatment, MEG3 expression levels in LX-2 cells were detected by RT-qPCR. (C) LX-2 cell proliferation was quantified using the Cell Counting Kit-8 assay. ##P<0.01 vs. control, **P<0.01 vs. TGF-β1+vector. (D) Immunofluorescence was used to determine α-SMA and COL1A1 expression in LX-2 cells. Representative images from each group are presented (magnification, ×100). (E) Protein expression levels of α-SMA and COL1A1 in LX-2 cells were detected by western blotting. **P<0.01 vs. Control; #P<0.05 vs. TGF-β1+vector. α-SMA, α-smooth muscle actin; COL1A1, collagen type 1 α1; MEG3, maternally expressed gene 3; RT-qPCR, reverse transcription-quantitative PCR.
|
MEG3 acts as a sponge for miR-145
lncRNAs were reported to function as regulators of miRNAs (20). miR-145 was reported to be involved in the regulation of fibrosis and could accelerate the progression of liver fibrosis (25). The potential binding sites of MEG3 and miR-145 were predicted using miRBase (http://www.mirbase.org) (Fig. 3A). miR-145 expression levels were detected in peripheral blood samples collected from healthy patients and patients with liver fibrosis. Compared with healthy control samples, miR-145 was significantly increased in mild and severe fibrosis samples. In addition, the expression of miR-145 was increased to a greater extent in severe fibrosis compared with mild fibrosis samples (Fig. 3B). TGF-β1 treatment induced significantly higher miR-145 expression levels in LX-2 cells compared with the control (Fig. 3C). To investigate the relationship of MEG3 and miR-145 in liver fibrosis the dual-luciferase reporter assay was performed. The relative luciferase activity in cells co-transfected with the MEG3 WT UTR and miR-145 mimic was significantly reduced compared with the NC mimic group, whereas no statistically significant change was observed in cells co-transfected with the MUT and miR-145 mimic compared with the MUT+NC mimic group (Fig. 3D). To further determine the regulatory relationship between MEG3 and miR-145, a MEG3 knockdown experiment was designed. MEG3 expression levels were significantly decreased in the shMEG3 transfected group compared with the sh-NC, demonstrating the knockdown experiment was successful (Fig. 3E). Subsequently, the effect of MEG3 overexpression on miR-145 expression levels was detected; pcMEG3 transfection significantly reduced miR-145 expression levels compared with the control (pcDNA3.1 empty vector), whereas shMEG3 significantly increased miR-145 expression levels compared with pcMEG3 (Fig. 3F). These results indicated that miR-145 may be downregulated by MEG3.
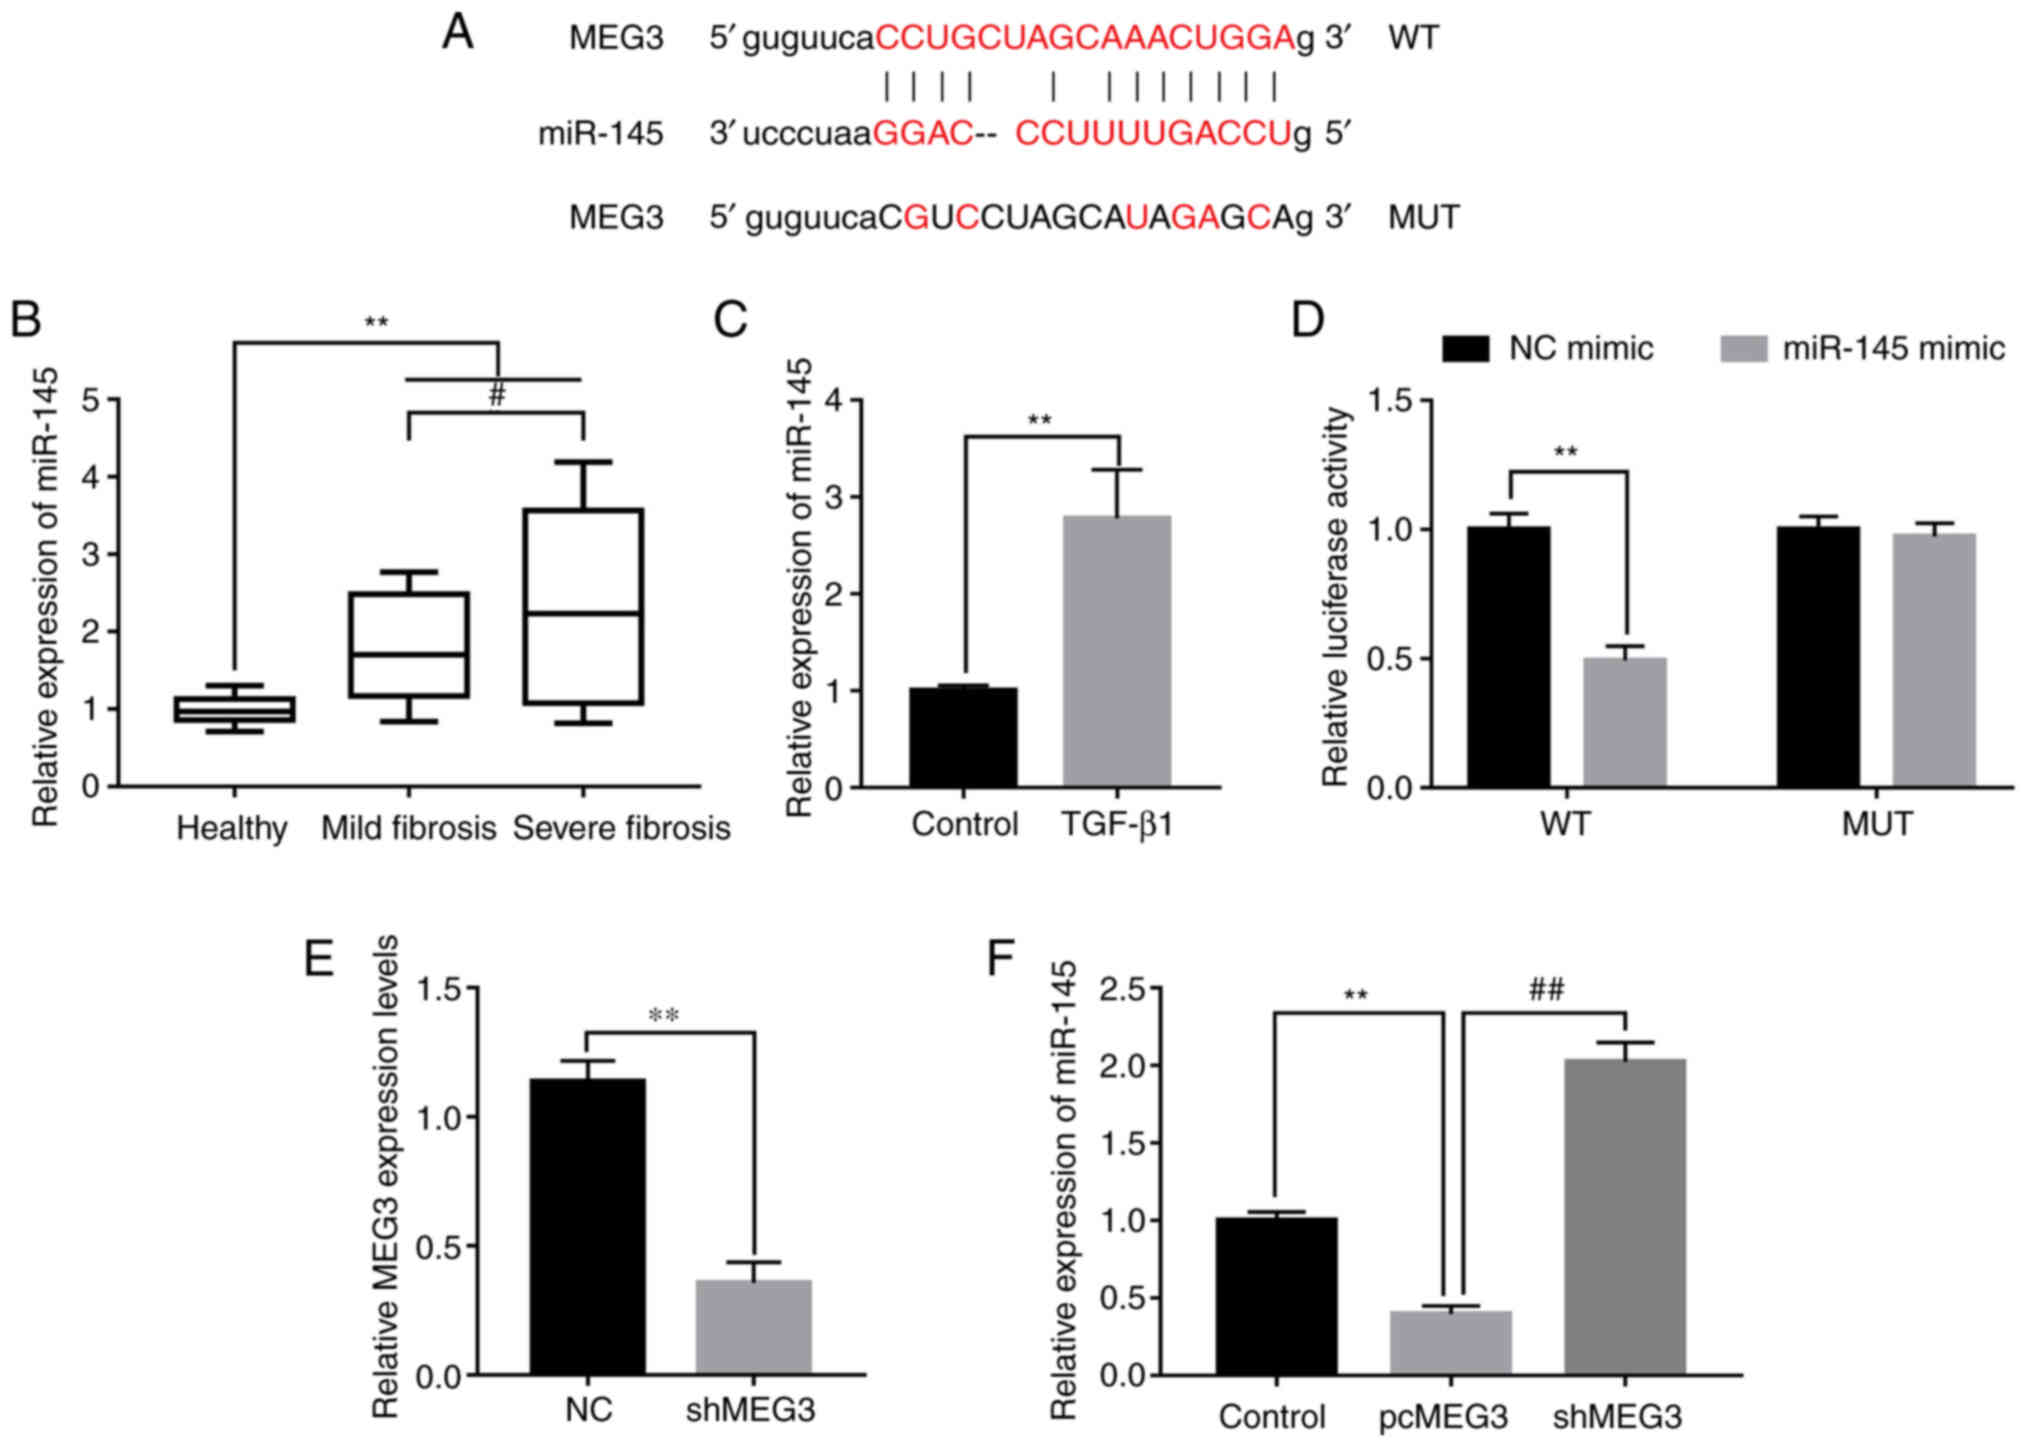 |
Figure 3.
MEG3 acts as a sponge of miR-145. (A) Predicted miR-145 binding sites on MEG3. (B) miR-145 expression levels in serum from healthy patients and patients with mild and severe fibrosis were detected by RT-qPCR. (C) miR-145 expression levels in LX-2 cells following TGF-β1 treatment were detected by RT-qPCR. (D) Dual-luciferase reporter assays were performed to verify the relationship between miR-145 and MEG3. (E) Verification of MEG3 knock down following shMEG3 transfection. (F) Following transfection with pcMEG3 or shMEG3, miR-145 expression levels in LX-2 cells was detected by RT-qPCR. **P<0.01; #P<0.05, ##P<0.01. MEG3, maternally expressed gene 3; miR, microRNA; MUT, mutant; NC, negative control; pc, plasmid cloning DNA3.1 overexpression vector; RT-qPCR, reverse transcription-quantitative PCR; sh, short hairpin RNA; WT, wild-type.
|
miR-145 promotes HSC activation and is susceptible to MEG3
To explore the role of miR-145 in HSCs, LX-2 cells were transfected with miR-145 inhibitor with or without shMEG3 co-transfection. miR-145 expression levels in LX-2 cells were significantly decreased by the miR-145 inhibitor compared with the NC-inhibitor. Downregulation of MEG3 significantly reversed the decrease in miR-145 expression levels compared with miR-145 inhibitor (Fig. 4A). Co-transfection with the miR-145 inhibitor attenuated the effect of TGF-β1. Notably, shMEG3 co-transfection significantly reversed this effect compared with the TGF-β1+miR-145 inhibitor group (Fig. 4B). The CCK-8 assay results demonstrated that miR-145 knockdown significantly inhibited the proliferation of LX-2 cells compared with the TGF-β1 group, whereas shMEG3 co-transfection significantly reversed this effect compared with the TGF-β1+miR-145 inhibitor group (Fig. 4C). Moreover, markedly reduced α-SMA and COL1A1 protein expression in LX-2 cells was observed when miR-145 was suppressed in TGF-β1-treated cells compared with TGF-β1 alone (Fig. 4D). By comparison, the TGF-β1+miR-145 inhibitor+shMEG3 group demonstrated markedly higher expression of α-SMA and COL1A1 compared with the miR-145 inhibitor group. α-SMA and COL1A1 protein expression levels in LX-2 cells were also detected by western blotting. miR-145-inhibitor significantly downregulated α-SMA and COL1A1 protein expression levels compared with the TGF-β1 group, and this effect was significantly alleviated by shMEG3 transfection (Fig. 4E).
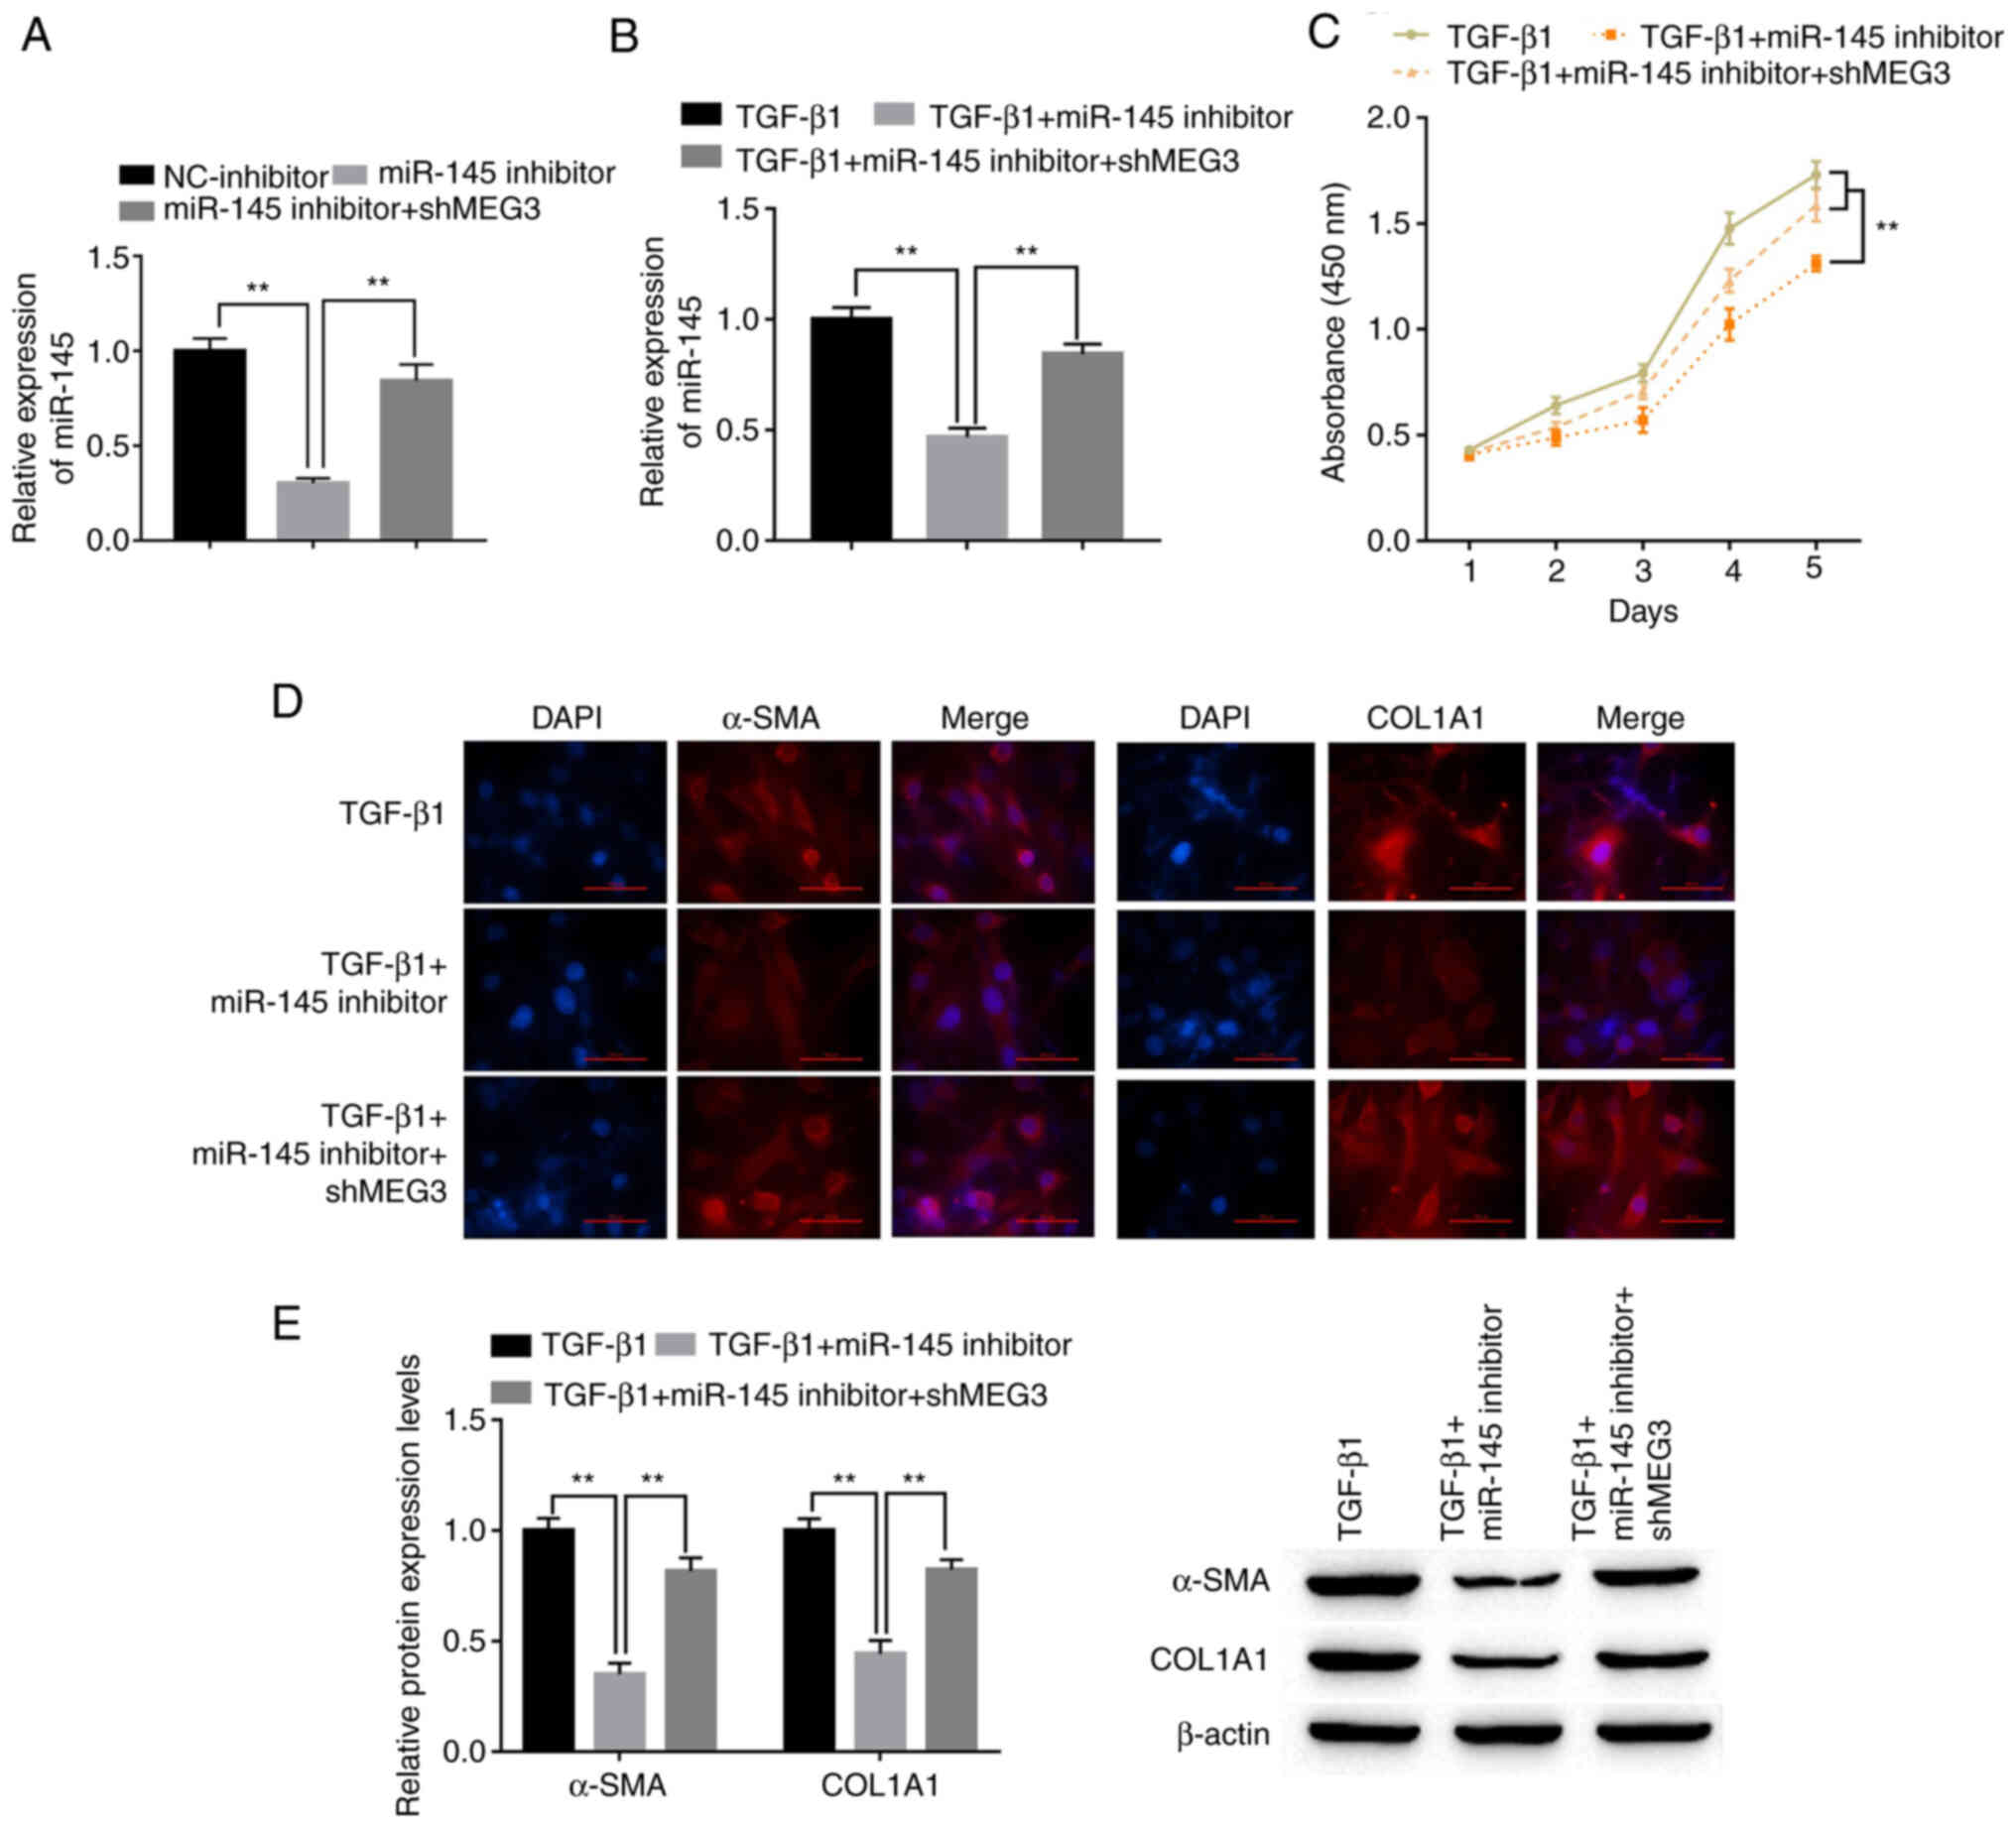 |
Figure 4.
miR-145 promotes hepatic stellate cell activation and is susceptible to MEG3. (A) Following transfection, miR-145 expression levels in LX-2 cells were detected by RT-qPCR. (B) Following transfection and TGF-β1 treatment, miR-145 expression levels in LX-2 cells were detected by RT-qPCR. (C) LX-2 cell proliferation was quantified using the Cell Counting Kit-8 assay. (D) Immunofluorescence was used to determine α-SMA and COL1A1 expression in LX-2 cells. Representative images from each group are presented; magnification, ×100. (E) α-SMA and COL1A1 protein expression levels in LX-2 cells were detected by western blotting. **P<0.01. α-SMA, α-smooth muscle actin; COL1A1, collagen type 1 α1; MEG3, maternally expressed gene 3; miR, microRNA; NC, negative control; RT-qPCR, reverse transcription-quantitative PCR; sh, short hairpin RNA.
|
miR-145 negatively regulates PPARγ in LX-2 cells
The putative targets of miR-145 were investigated using the starBase prediction tool. The results indicated that PPARγ was a possible miR-145 target; the putative miR-145 target sites in PPARγ-WT and the designed mutant sequence, PPARγ-MUT, are indicated in Fig. 5A. The dual-luciferase reporter assay results demonstrated that the miR-145 mimic significantly decreased luciferase activity in the PPARγ-WT compared with the mimic NC group, whereas no statistically significant effect on luciferase activity was seen for PPARγ-MUT (Fig. 5B). Furthermore, significantly decreased PPARγ protein and mRNA expression levels were observed in patients with mild fibrosis and severe fibrosis compared with healthy patients. Notably, the expression of PPARγ was further decreased in severe fibrosis compared with mild fibrosis samples (Fig. 5C and D, respectively). To identify whether miR-145 affected the PPARγ protein expression level, miR-145 mimic and miR-145 inhibitor were transfected into LX-2 cells. The results demonstrated that miR-145 expression levels significantly increased following transfection of miR-145 mimic compared with NC-mimic, whereas miR-145 expression levels significantly decreased following transfection with miR-145 inhibitor compared with NC-inhibitor (Fig. 5E), which demonstrated that the transfection experiment was successful. Western blotting results revealed negative regulation of PPARγ by miR-145. After transfection with the miR-145 mimic, the expression of PPARγ was significantly decreased compared with the NC-mimic group, while after transfection of the miR-145 inhibitor, the expression of PPARγ was significantly increased compared with the NC-inhibitor group (Fig. 5F).
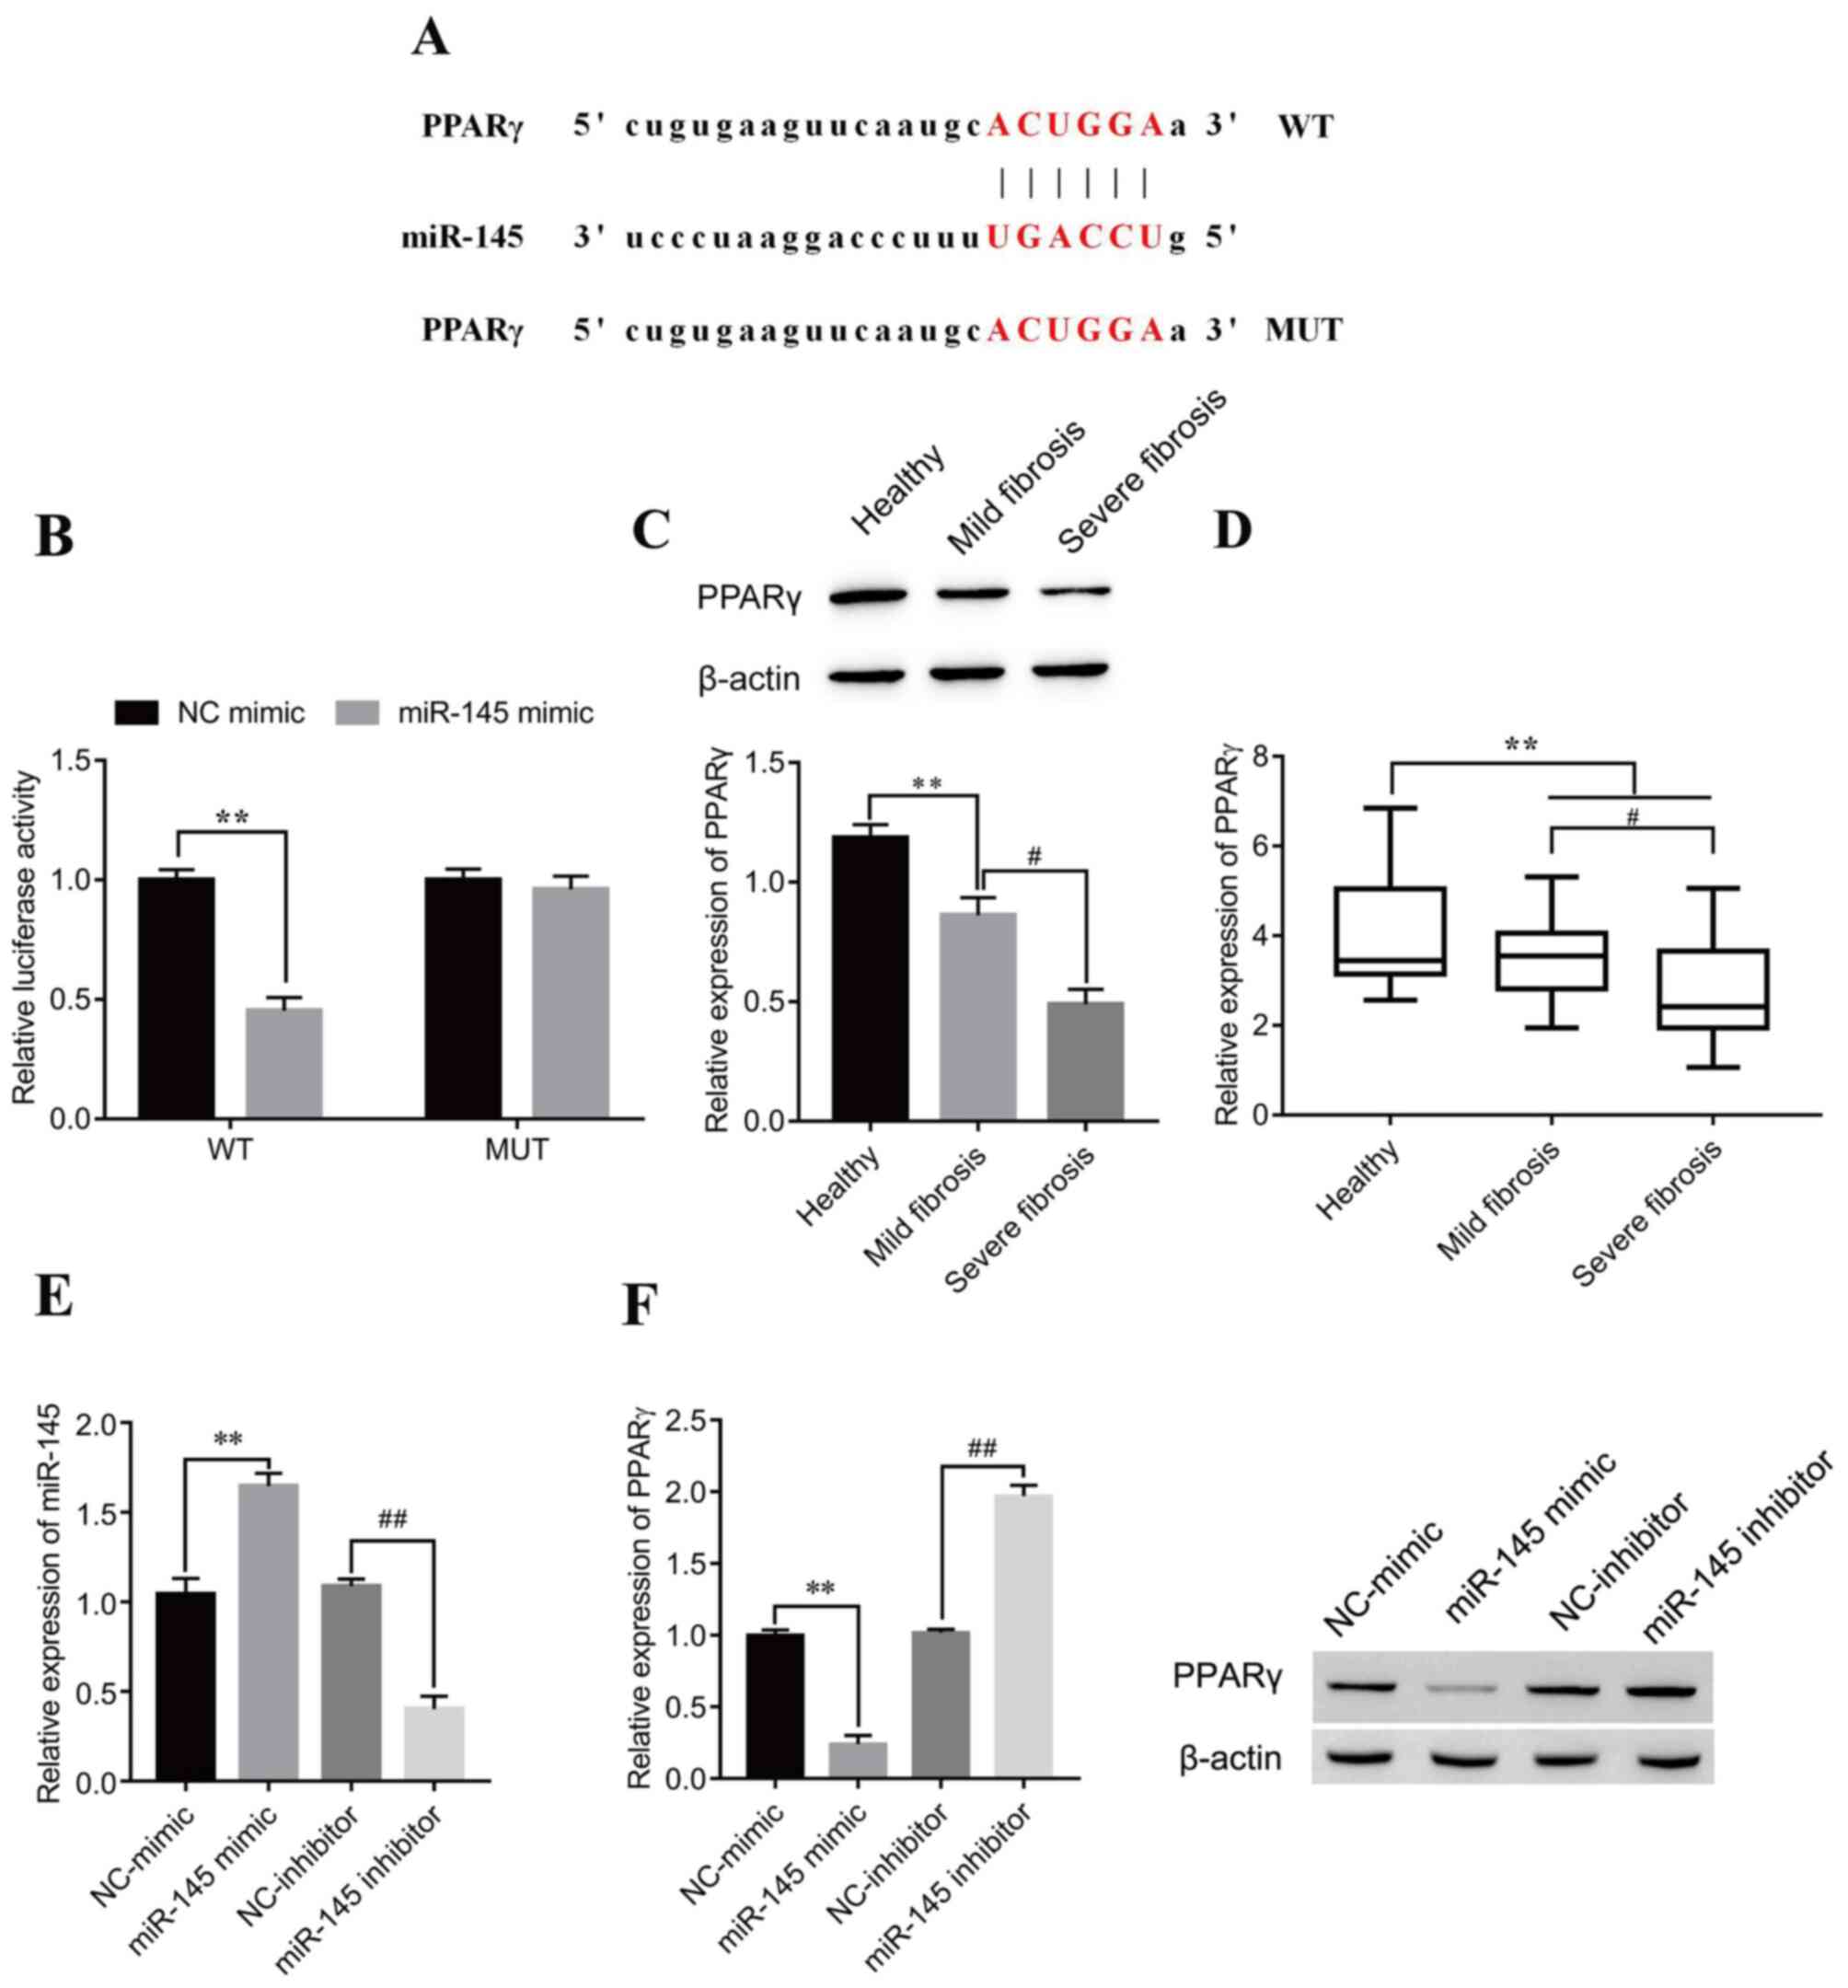 |
Figure 5.
miR-145 negatively regulates PPARγ in LX-2 cells. (A) Predicted miR-145 target sites on PPARγ 3′untranslated region. (B) Dual-luciferase reporter assays were performed to verify the relationship between miR-145 and PPARγ. **P<0.01. PPARγ (C) protein and (D) mRNA expression levels in serum from healthy patients and patients with mild and severe fibrosis were detected by western blotting and reverse transcription-quantitative PCR, respectively. **P<0.01; #P<0.05. (E) Verification of miR-145 mimic and inhibitor transfection efficiency. **P<0.01 vs. NC-mimic; ##P<0.01 vs. NC-inhibitor. (F) Following transfection with miR-145 mimic or inhibitor, PPARγ protein expression levels in LX-2 cells were detected by western blotting. **P<0.01 vs. NC-mimic; ##P<0.01 vs. NC-inhibitor. miR, microRNA; MUT, mutant; NC, negative control; PPARγ, peroxisome proliferator-activated receptor γ; WT, wild-type.
|
MEG3/miR-145/PPARγ axis regulates TGF-β1-stimulated HSC activation
To determine whether PPARγ is involved in MEG3/miR-145-mediated activation of HSCs, LX-2 cells were transfected with pcPPARγ, miR-145 mimic and shMEG3. Following transfection with pcPPARγ, PPARγ mRNA expression levels significantly increased compared with the empty vector group (Fig. 6A). RT-qPCR and western blot nalysis showed that an increase in PPARγ mRNA and protein expression levels, respectively, was induced by PPARγ overexpression and was diminished when in combination with miR-145 overexpression or MEG3 knockdown (Fig. 6B and C). Under TGF-β1 stimulation conditions, pcPPARγ transfection significantly suppressed TGF-β1-induced HSC proliferation compared with the TGF-β1 only group (Fig. 6D). Overexpression of miR-145 or MEG3 knockdown could partially abolish the inhibition of HSC proliferation induced by transfection of pcPPARγ. The immunofluorescence results demonstrated that the PPARγ downregulation of α-SMA and COL1A1 was reversed by miR-145 overexpression or MEG3 knockdown in LX-2 ells treated with TGF-β (Fig. 6E). This was confirmed by the western blotting results; the pcPPARγ-induced downregulation of α-SMA and COL1A1 was reversed by miR-145 overexpression or MEG3 knockdown in LX-2 cells treated with TGF-β (Fig. 6F). Overall, MEG3 inhibited the TGF-β1-induced activation of LX-2 cells through miR-145 regulation of PPARγ.
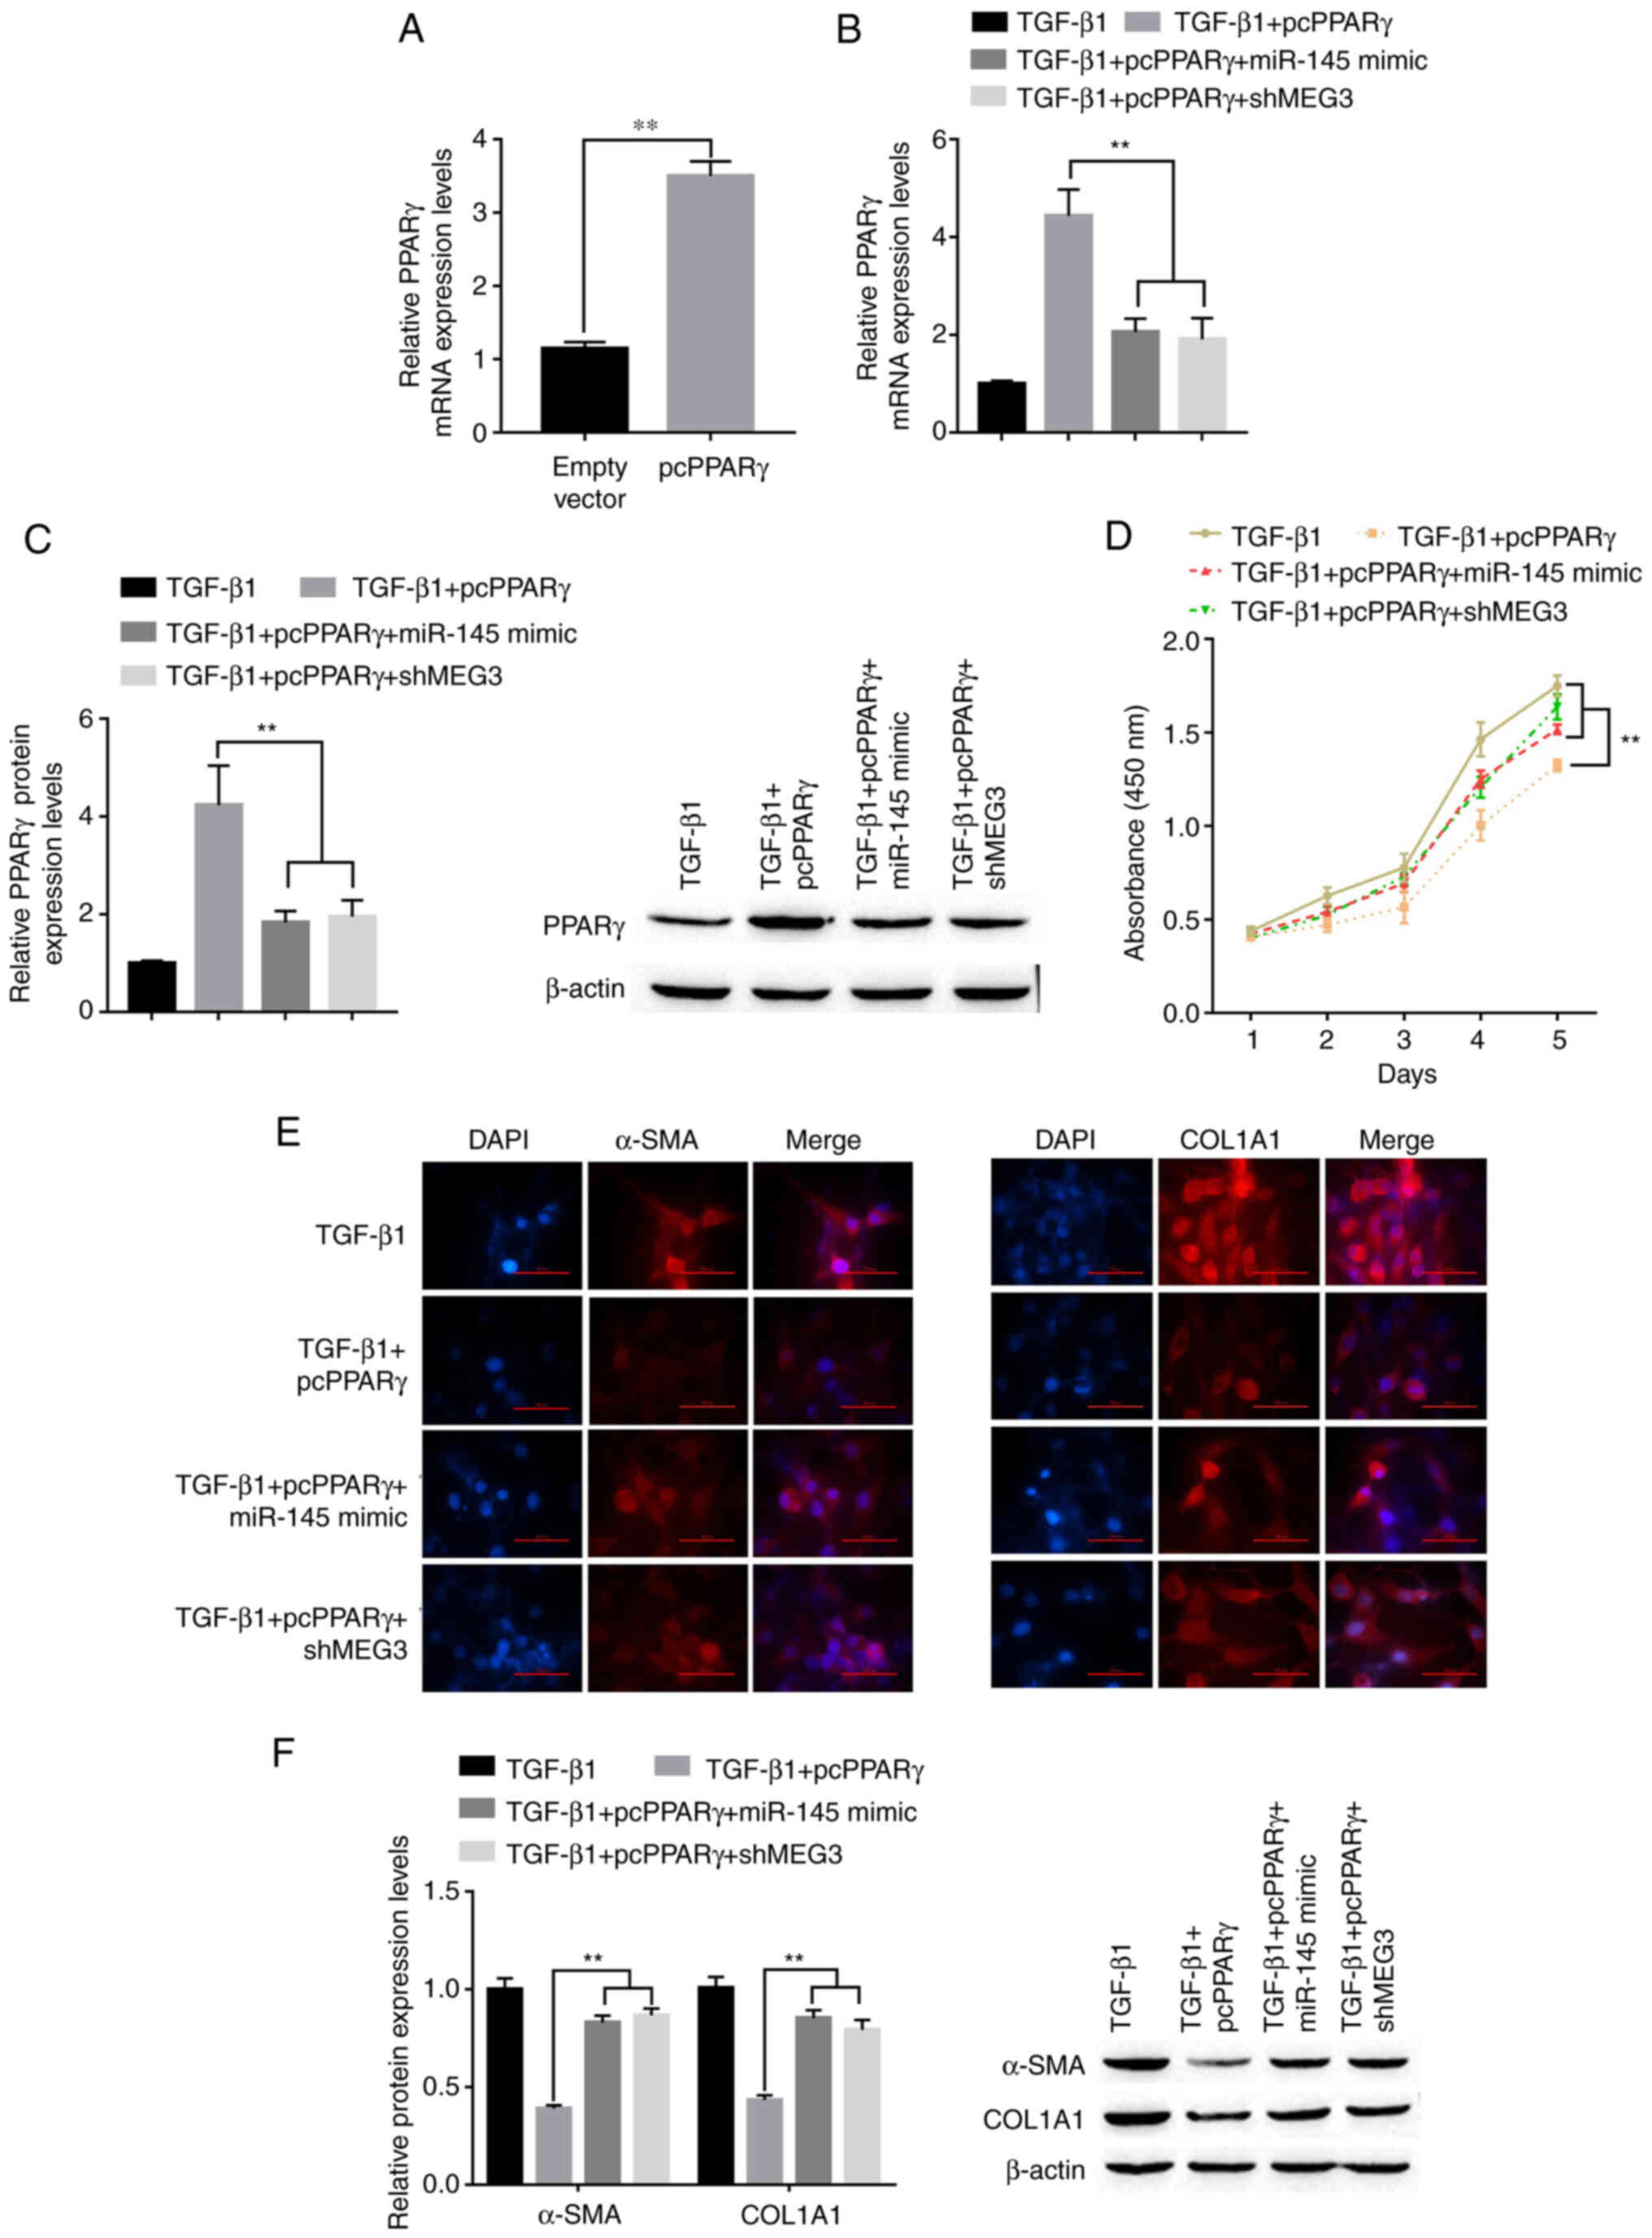 |
Figure 6.
MEG3/miR-145/PPARγ axis regulates TGF-β1-stimulated hepatic stellate cell activation. (A) Following transfection with pcPPARγ, the expression of pcPPARγ was detected by RT-qPCR. **P<0.01 vs. empty vector. (B) Following transfection, PPARγ mRNA expression levels in LX-2 cells were detected by reverse transcription-quantitative PCR. **P<0.01 vs. TGF-β1+pcPPARγ. (C) Following transfection and TGF-β1 treatment, PPARγ protein expression levels in LX-2 cells were detected by western blotting. **P<0.01 vs. TGF-β1+pcPPARγ. (D) LX-2 cell proliferation was quantified using the Cell Counting Kit-8 assay. **P<0.01 vs. TGF-β1+pcPPARγ. (E) Immunofluorescence was used to determine α-SMA and COL1A1 expression in LX-2 cells. Representative images from each group are presented; magnification, ×100. (F) Protein expression levels of α-SMA in LX-2 cells were detected by western blotting. **P<0.01 vs. TGF-β1+pcPPARγ. α-SMA, α-smooth muscle actin; COL1A1, collagen type 1 α1; MEG3, maternally expressed gene 3; miR, microRNA; PPARγ, peroxisome proliferator-activated receptor γ; pc, plasmid cloning DNA3.1 overexpression vector; sh, short hairpin RNA.
|
Discussion
Liver fibrosis occurs in most types of chronic liver disease. Following persistent liver injury, HSCs are the main collagen-producing cells activated by damaged hepatocytes; they release TGF-β1 and reactive oxygen species, whereas Kupffer cells release TNF-α and TGF-β1 (1). Activated HSCs differentiate into myofibroblast-like cells, which proliferate and produce a network of ECM that represents the primary driving force for promoting the progression of liver fibrosis (3). Therefore, the suppression of HSC activation is important for the prevention of liver fibrosis. A growing number of studies suggest that ncRNAs serve an important role in the development of liver fibrosis (26). Previous studies also indicate that lncRNAs may participate in the progression of numerous diseases, including cancer and diabetes (27,28). Nevertheless, the function of lncRNAs in liver fibrosis is not completely understood. Results from the present study demonstrated that low MEG3 expression was associated with liver fibrosis. TGF-β1-induced LX-2 cells were used to explore the role of MEG3 in liver fibrogenesis, and it was demonstrated that MEG3 overexpression suppressed TGF-β1-induced HSC activation, indicated by the inhibition of LX-2 proliferation and α-SMA and COL1A1 expression.
MEG3, part of the Delta-like homolog 1-MEG3 imprinting locus located at human chromosome 14q32 and at mouse distal chromosome 12, is expressed in a number of healthy tissues (29,30). Previous studies have demonstrated MEG3 to be a tumor suppressor in various human cancers, including colorectal cancer, gastric cancer, glioma and hepatocellular carcinoma (31,32). Overexpression of MEG3 may contribute to the suppression of tumor cell proliferation and the induction of cell apoptosis (33). Chen et al (16) reported that MEG3 serum levels were low in patients with CHB and negatively correlated with the degree of liver fibrosis. Other studies have investigated the role of MEG3 in liver fibrosis and showed that MEG3 expression is reduced in fibrotic animals, and the recovery of MEG3 expression caused downregulation of α-SMA and COL1A1 expression (13,15). By contrast, Zhang et al (34) reported that hepatic MEG3 levels were significantly increased in human fibrotic non-alcoholic steatohepatitis cirrhotic livers. The present study demonstrated that MEG3 may function as a suppressor of HSC activation. In vitro MEG3 restoration reversed the effects of TGF-β1 treatment on HSCs by inhibiting cell proliferation. The present study also reported that MEG3 may act as a ceRNA involved in the regulation of PPARγ by miR-145.
Emerging evidence indicates that certain lncRNAs may participate in the ceRNA regulatory circuit. For example, it has been reported that MEG3 negatively regulates miR-145 in diabetic nephropathy (35) and in diabetic cardiomyopathy (36). The present study confirmed the direct binding ability of miR-145 to MEG3. miR-145 serves a crucial role in various fibrotic diseases. For example, miR-145 promotion of myofibroblast differentiation and lung fibrosis has previously been reported (37). Men et al (38) suggested that miR-145 targets Krüppel-like factor 4, a negative regulator of fibrosis, and induces α-SMA and COL1A1 expression in primary HSCs. A recent study found that overexpression of miR-145 in dermal fibroblasts enhances TGF-β1-promoted activity of xylosyltransferase-I, the initial and rate-limiting enzyme of proteoglycan biosynthesis and one of several myofibroblast markers (39). Furthermore, PPARγ is involved in the pathogenesis of liver fibrosis. In vitro and in vivo studies have demonstrated that activation of the PPARγ regulatory system depresses liver fibrogenesis (40,41). A previous study demonstrated that PPARγ inhibits hepatic stellate cell activation (42), but PPARγ was also reported to be regulated by miR-942 (43), miR-27b (44) and miR-155 (45) in liver fibrosis caused by a number of diseases. However, the role of lncRNAs in regulating PPARγ in liver fibrosis remains unclear. Therefore, more research on the post-transcriptional regulatory mechanism of PPARγ in HSCs is needed. The present study demonstrated that PPARγ expression is regulated by MEG3/miR-145. Further analysis determined that PPARγ overexpression significantly downregulated the proliferation and expression of activation markers in HSCs, which could be recovered by miR-145 overexpression or MEG3 knockdown.
In conclusion, the present study demonstrated that MEG3 was downregulated in patients with liver fibrosis and that TGF-β1-induced HSC activation was depressed by MEG3 in vitro. Furthermore, MEG3 acted as a ceRNA of miR-145, which negatively targeted and regulated PPARγ, forming a MEG3/miR-145/PPARγ axis to regulate TGF-β1-induced HSC activation. The present study demonstrated a novel mechanism of MEG3 inhibition of HSC activation and may provide new insights into the pathogenesis and possible therapeutic targets of liver fibrosis. However, there are several limitations to the present study. For example, the study failed to perform further verification of the hypothesized mechanism in animal models. Therefore, future studies should aim to verify the mechanism in cell lines, animal in vivo experiments and patient clinical studies. In addition, further focus should be paid to understanding the role of MEG3 in the development of liver fibrosis. Based on the observed capabilities of MEG3, drugs that target MEG3 for the treatment of liver disease should be investigated.
Acknowledgements
Not applicable.
Funding
This research was supported by The Health Research Project of Kunming Municipal Health Commission (Kunming, China; grant nos. 2020-03-03-113, 2020-03-03-111 and 2019-03-10-001), the Science and Technology Plan Project of Yunnan Provincial Science and Technology Department-Kunming Medical Joint Special Project (grant no. 202001AY070001-266) and Kunming Health Science and Technology Talents Training Project: 2019-sw (Backup)-05
Availability of data and materials
The datasets used and/or analyzed during the current study are available from the corresponding author on reasonable request.
Authors' contributions
RQ conceived the study, wrote the manuscript and performed the experiments. WH conceived the study, wrote the manuscript and performed the data analysis. YH participated in the experiments and data collection. ZZ performed the data analysis and assembled the figures. YS performed the experiments. SC performed the statistical analysis and summarized the experimental results. HW designed and supervised the study and edited the manuscript. RQ and HW confirm the authenticity of all the raw data. All authors read and approved the final manuscript.
Ethics approval and consent to participate
Written informed consent was obtained from all patients. The present study was approved by the Ethics Committee of Yan'an Hospital of Kunming (Kunming, China; approval no. YXLL-AF-SC-022/01).
Patient consent for publication
Not applicable.
Competing interests
The authors declare that they have no competing interests.
References
|
1
|
Hernandez-Gea V and Friedman SL: Pathogenesis of liver fibrosis. Annu Rev Pathol. 6:425–456. 2011. View Article : Google Scholar : PubMed/NCBI
|
|
2
|
Zhang CY, Yuan WG, He P, Lei JH and Wang CX: Liver fibrosis and hepatic stellate cells: Etiology, pathological hallmarks and therapeutic targets. World J Gastroenterol. 22:10512–10522. 2016. View Article : Google Scholar : PubMed/NCBI
|
|
3
|
Higashi T, Friedman SL and Hoshida Y: Hepatic stellate cells as key target in liver fibrosis. Adv Drug Deliv Rev. 121:27–42. 2017. View Article : Google Scholar : PubMed/NCBI
|
|
4
|
Schuppan D and Kim YO: Evolving therapies for liver fibrosis. J Clin Invest. 123:1887–1901. 2013. View Article : Google Scholar : PubMed/NCBI
|
|
5
|
Hong F, Chou H, Fiel MI and Friedman SL: Antifibrotic activity of sorafenib in experimental hepatic fibrosis: Refinement of inhibitory targets, dosing, and window of efficacy in vivo. Dig Dis Sci. 58:257–264. 2013.PubMed/NCBI
|
|
6
|
Deng YR, Ma HD, Tsuneyama K, Yang W, Wang YH, Lu FT, Liu CH, Liu P, He XS, Diehl AM, et al: STAT3-mediated attenuation of CCl4-induced mouse liver fibrosis by the protein kinase inhibitor sorafenib. J Autoimmun. 46:25–34. 2013. View Article : Google Scholar : PubMed/NCBI
|
|
7
|
Hennenberg M, Trebicka J, Kohistani Z, Stark C, Nischalke HD, Krämer B, Körner C, Klein S, Granzow M, Fischer HP, et al: Hepatic and HSC-specific sorafenib effects in rats with established secondary biliary cirrhosis. Lab Invest. 91:241–251. 2011. View Article : Google Scholar : PubMed/NCBI
|
|
8
|
ENCODE Project Consortium, ; Birney E, Stamatoyannopoulos JA, Dutta A, Guigó R, Gingeras TR, Margulies EH, Weng Z, Snyder M, Dermitzakis ET, et al: Identification and analysis of functional elements in 1% of the human genome by ENCODE pilot project. Nature. 447:799–816. 2007. View Article : Google Scholar : PubMed/NCBI
|
|
9
|
Kim YA, Park KK and Lee SJ: lncRNAs Act as a link between chronic liver disease and hepatocellular carcinoma. Int J Mol Sci. 21:28832020. View Article : Google Scholar : PubMed/NCBI
|
|
10
|
Hanson A, Wilhelmsen D and DiStefano JK: The role of long non-coding RNAs (lncRNAs) in the development and progression of fibrosis associated with nonalcoholic fatty liver disease (NAFLD). Noncoding RNA. 4:182018.PubMed/NCBI
|
|
11
|
Li X and Liu R: Long non-coding RNA H19 in the liver-gut axis: A diagnostic marker and therapeutic target for liver diseases. Exp Mol Pathol. 115:1044722020. View Article : Google Scholar : PubMed/NCBI
|
|
12
|
Leti F, Legendre C, Still CD, Chu X, Petrick A, Gerhard GS and DiStefano JK: Altered expression of MALAT1 lncRNA in nonalcoholic steatohepatitis fibrosis regulates CXCL5 in hepatic stellate cells. Transl Res. 190:25–39.e21. 2017. View Article : Google Scholar : PubMed/NCBI
|
|
13
|
He Y, Wu YT, Huang C, Meng XM, Ma TT, Wu BM, Xu FY, Zhang L, Lv XW and Li J: Inhibitory effects of long noncoding RNA MEG3 on hepatic stellate cells activation and liver fibrogenesis. Biochim Biophys Acta. 1842:2204–2215. 2014. View Article : Google Scholar : PubMed/NCBI
|
|
14
|
Tsuchida T and Friedman SL: Mechanisms of hepatic stellate cell activation. Nat Rev Gastroenterol Hepatol. 14:397–411. 2017. View Article : Google Scholar : PubMed/NCBI
|
|
15
|
Yu F, Geng W, Dong P, Huang Z and Zheng J: lncRNA-MEG3 inhibits activation of hepatic stellate cells through SMO protein and miR-212. Cell Death Dis. 9:10142018. View Article : Google Scholar : PubMed/NCBI
|
|
16
|
Chen MJ, Wang XG, Sun ZX and Liu XC: Diagnostic value of lncRNA-MEG3 as a serum biomarker in patients with hepatitis B complicated with liver fibrosis. Eur Rev Med Pharmacol Sci. 23:4360–4367. 2019.PubMed/NCBI
|
|
17
|
Cesana M, Cacchiarelli D, Legnini I, Santini T, Sthandier O, Chinappi M, Tramontano A and Bozzoni I: A long noncoding RNA controls muscle differentiation by functioning as a competing endogenous RNA. Cell. 147:358–369. 2011. View Article : Google Scholar : PubMed/NCBI
|
|
18
|
Yu F, Lu Z, Cai J, Huang K, Chen B, Li G, Dong P and Zheng J: MALAT1 functions as a competing endogenous RNA to mediate Rac1 expression by sequestering miR-101b in liver fibrosis. Cell Cycle. 14:3885–3896. 2015. View Article : Google Scholar : PubMed/NCBI
|
|
19
|
Kong Y, Huang T, Zhang H, Zhang Q, Ren J, Guo X, Fan H and Liu L: The lncRNA NEAT1/miR-29b/Atg9a axis regulates IGFBPrP1-induced autophagy and activation of mouse hepatic stellate cells. Life Sci. 237:1169022019. View Article : Google Scholar : PubMed/NCBI
|
|
20
|
Sulaiman SA, Muhsin NIA and Jamal R: Regulatory Non-coding RNAs Network in Non-alcoholic fatty liver disease. Front Physiol. 10:2792019. View Article : Google Scholar : PubMed/NCBI
|
|
21
|
Sterling RK, Lissen E, Clumeck N, Sola R, Correa MC, Montaner J, S Sulkowski M, Torriani FJ, Dieterich DT, Thomas DL, et al: Development of a simple noninvasive index to predict significant fibrosis in patients with HIV/HCV coinfection. Hepatology. 43:1317–1325. 2006. View Article : Google Scholar : PubMed/NCBI
|
|
22
|
Li C, Liu YF, Huang C, Chen YX, Xu CY and Chen Y: Long noncoding RNA NEAT1 sponges miR-129 to modulate renal fibrosis by regulation of collagen type I. Am J Physiol Renal Physiol. 319:F93–F105. 2020. View Article : Google Scholar : PubMed/NCBI
|
|
23
|
Livak KJ and Schmittgen TD: Analysis of relative gene expression data using real-time quantitative PCR and the 2(-Delta Delta C(T)) Method. Methods. 25:402–408. 2001. View Article : Google Scholar : PubMed/NCBI
|
|
24
|
Lee UE and Friedman SL: Mechanisms of hepatic fibrogenesis. Best Practice Res Clin Gastroenterol. 25:195–206. 2011. View Article : Google Scholar : PubMed/NCBI
|
|
25
|
Men R, Wen M, Zhao M, Dan X, Yang Z, Wu W, Wang MH, Liu X and Yang L: MircoRNA-145 promotes activation of hepatic stellate cells via targeting krüppel-like factor 4. Sci Rep. 7:404682017. View Article : Google Scholar : PubMed/NCBI
|
|
26
|
He Z, Yang D, Fan X, Zhang M, Li Y, Gu X and Yang M: The roles and mechanisms of lncRNAs in liver fibrosis. Int J Mol Sci. 21:14822020. View Article : Google Scholar : PubMed/NCBI
|
|
27
|
Chi Y, Wang D, Wang J, Yu W and Yang J: Long Non-Coding RNA in the pathogenesis of cancers. Cells1. 8:10152019. View Article : Google Scholar
|
|
28
|
Zhang W, Xu W, Feng Y, Feng Y and Zhou X: Non-coding RNA involvement in the pathogenesis of diabetic cardiomyopathy. J Cell Mol Med. 23:5859–5867. 2019. View Article : Google Scholar : PubMed/NCBI
|
|
29
|
Zhang X, Rice K, Wang Y, Chen W, Zhong Y, Nakayama Y, Zhou Y and Klibanski A: Maternally expressed gene 3 (MEG3) noncoding ribonucleic acid: Isoform structure, expression, and functions. Endocrinology. 151:939–947. 2010. View Article : Google Scholar : PubMed/NCBI
|
|
30
|
Anwar SL, Krech T, Hasemeier B, Schipper E, Schweitzer N, Vogel A, Kreipe H and Lehmann U: Loss of imprinting and allelic switching at the DLK1-MEG3 locus in human hepatocellular carcinoma. PLoS One. 7:e494622012. View Article : Google Scholar : PubMed/NCBI
|
|
31
|
He Y, Luo Y, Liang B, Ye L, Lu G and He W: Potential applications of MEG3 in cancer diagnosis and prognosis. Oncotarget. 8:73282–73295. 2017. View Article : Google Scholar : PubMed/NCBI
|
|
32
|
Cui X, Jing X, Long C, Tian J and Zhu J: Long noncoding RNA MEG3, a potential novel biomarker to predict the clinical outcome of cancer patients: A meta-analysis. Oncotarget. 8:19049–19056. 2017. View Article : Google Scholar : PubMed/NCBI
|
|
33
|
Zhang CY, Yu MS, Li X, Zhang Z, Han CR and Yan B: Overexpression of long non-coding RNA MEG3 suppresses breast cancer cell proliferation, invasion, and angiogenesis through AKT pathway. Tumour Biol. 39:10104283177013112017.PubMed/NCBI
|
|
34
|
Zhang L, Yang Z, Trottier J, Barbier O and Wang L: Long noncoding RNA MEG3 induces cholestatic liver injury by interaction with PTBP1 to facilitate shp mRNA decay. Hepatology. 65:604–615. 2017. View Article : Google Scholar : PubMed/NCBI
|
|
35
|
Li J, Jiang X, Duan L and Wang W: Long non-coding RNA MEG3 impacts diabetic nephropathy progression through sponging miR-145. Am J Transl Res. 11:6691–6698. 2019.PubMed/NCBI
|
|
36
|
Chen Y, Zhang Z, Zhu D, Zhao W and Li F: Long non-coding RNA MEG3 serves as a ceRNA for microRNA-145 to induce apoptosis of AC16 cardiomyocytes under high glucose condition. Biosci Rep. 39:BSR201904442019. View Article : Google Scholar : PubMed/NCBI
|
|
37
|
Yang S, Cui H, Xie N, Icyuz M, Banerjee S, Antony VB, Abraham E, Thannickal VJ and Liu G: miR-145 regulates myofibroblast differentiation and lung fibrosis. FASEB J. 27:2382–2391. 2013. View Article : Google Scholar : PubMed/NCBI
|
|
38
|
Men R, Wen M, Zhao M, Dan X, Yang Z, Wu W, Wang MH, Liu X and Yang L: MircoRNA-145 promotes activation of hepatic stellate cells via targeting krüppel-like factor 4. Sci Rep. 7:404682017. View Article : Google Scholar : PubMed/NCBI
|
|
39
|
Ly T, Riedel L, Fischer B, Schmidt V, Hendig D, Distler J, Kuhn J, Knabbe C and Faust I: microRNA-145 mediates xylosyltransferase-I induction in myofibroblasts via suppression of transcription factor KLF4. Biochem Biophys Res Commun. 523:1001–1006. 2020. View Article : Google Scholar : PubMed/NCBI
|
|
40
|
Zeybel M, Hardy T, Wong Y, Mathers JC, Fox CR, Gackowska A, Oakley F, Burt AD, Wilson CL, Anstee QM, et al: Multigenera-tional epigenetic adaptation of the hepatic wound-healing response. Nat Med. 18:1369–1377. 2012. View Article : Google Scholar : PubMed/NCBI
|
|
41
|
Liu X, Xu J, Rosenthal S, Zhang LJ, McCubbin R, Meshgin N, Shang L, Koyama Y, Ma HY, Sharma S, et al: Identification of Lineage-specific transcription factors that prevent activation of hepatic stellate cells and promote fibrosis resolution. Gastroenterology. 158:1728–1744.e14. 2020. View Article : Google Scholar : PubMed/NCBI
|
|
42
|
Park JK, Ki MR, Lee HR, Hong IH, Ji AR, Ishigami A, Park SI, Kim JM, Chung HY, Yoo SE and Jeong KS: Vitamin C deficiency attenuates liver fibrosis by way of up-regulated peroxisome proliferator-activated receptor-gamma expression in senescence marker protein 30 knockout mice. Hepatology. 51:1766–1777. 2010. View Article : Google Scholar : PubMed/NCBI
|
|
43
|
Tao L, Wu L, Zhang W, Ma WT, Yang GY, Zhang J, Xue DY, Chen B and Liu C: Peroxisome proliferator-activated receptor γ inhibits hepatic stellate cell activation regulated by miR-942 in chronic hepatitis B liver fibrosis. Life Sci. 253:1175722020. View Article : Google Scholar : PubMed/NCBI
|
|
44
|
Zhu D, Lyu L, Shen P, Wang J, Chen J, Sun X, Chen L, Zhang L, Zhou Q and Duan Y: rSjP40 protein promotes PPARγ expression in LX-2 cells through microRNA-27b. FASEB J. 32:4798–4803. 2018. View Article : Google Scholar : PubMed/NCBI
|
|
45
|
Bala S, Csak T, Saha B, Zatsiorsky J, Kodys K, Catalano D, Satishchandran A and Szabo G: The pro-inflammatory effects of miR-155 promote liver fibrosis and alcohol-induced steatohepatitis. J Hepatol. 64:1378–1387. 2016. View Article : Google Scholar : PubMed/NCBI
|


