Introduction
The global prevalence of diabetes continues to
increase every year since 1980 (1). In 2019, ~463 million individuals
were diagnosed with diabetes, which accounted for 9.3% of the
global adult population (2). Type
2 diabetes mellitus (T2DM) is the most common type of diabetes,
where β-cell apoptosis is one of the main causes of T2DM (3). Therefore, further studies on the
mechanism underlying β-cell apoptosis are essential for developing
treatment strategies for T2DM.
Sigma-1 receptor (Sig-1R) is a class of orphan
receptors that has been reported to serve unique physiological
functions due to the lack of homology with other mammalian proteins
(4,5). Sig-1R agonists has a protective
effect on Alzheimer's disease (AD), Parkinson's disease (PD), heart
disease, retinal dysfunction, perinatal and traumatic brain
injuries, depression and psychostimulant addiction (6). Sig-1R agonists are effective
neuroprotective agents (7) and
have been applied for treating various neurodegenerative diseases,
such as AD, PD and amyotrophic lateral sclerosis (8). In human lens cells, Sig-1R
antagonists can inhibit cell proliferation (9), suggesting that Sig-1R can exert
regulatory effects on cell proliferation. In addition, Sig-1R
receptor agonists have been found to increase the viability of
human retinal pigment epithelial cells following oxidative damage
(10). Treatment of mice with
Sig-1R agonists following transient middle cerebral artery
occlusion was reported to improve the extent of cerebral ischemic
injury by relieving endoplasmic reticulum (ER) stress (11). Sig-1R receptor agonists can also
reduce C/EBP homologous protein (CHOP) expression in HEK cells to
attenuate the ER stress-mediated apoptotic pathway (12). Finding from these previous studies
implicated regulatory effects of Sig-1R on ER stress. Since ER
stress has been demonstrated to be an important mechanism of islet
cell apoptosis in patients with T1DM and T2DM (13,14), it is speculated that Sig-1R
activation can also mediate protective effects on islet cells.
However, the role of Sig-1R in pancreatic islet cells remains
poorly understood. Therefore, the present study investigated the
potential link between Sig-1R and islet cell function, by
investigating the effects of Sig-1R overexpression on
β-cellphysiology.
Materials and methods
Cell culture
Pancreatic MIN6 beta-cells were cultured in modified
RPMI-1640 (HyClone; Cytiva) containing 11.1 mM glucose and 10%
(v/v) FBS (Gibco; Thermo Fisher Scientific, Inc.), 2
mM L-glutamine and 1% penicillin/streptomycin in a humidified
atmosphere under 5% CO2 and 95% air at 37°C.
Sig-1R overexpression in MIN6 cell
lines
Lentiviral vectors harboring the cloned Sig-1R gene
(accession no. NM_011014) or scrambled sequences were designed and
synthesized by Shanghai GeneChem Co., Ltd. The plasmid backbone
used was Ubi-MCS-3FLAG-CBh-gcGFP-IRES-puromycin (Shanghai GeneChem
Co., Ltd.). Lentivirus packaging was cotransfected with 293T cells
of three vectors. A total of 1 ml DNA mixture (target gene GV
vector 20 µg, Phelper 1.0 vector 15 µg, Phelper 2.0 vector 10 µg)
was prepared and added to 293T cells. The cells were cultured at
37°C for 6 h, then the medium was changed and cultured at 37°C for
another 48 h. The supernatant of 293T cells was collected and
centrifuged at 4,000 × g at 4°C for 10 min. The supernatant was
filtered by 0.45 µm filter and centrifuged at 54,000 × g at 4°C for
2 h. After discarding supernatant and resuspending in PBS,
centrifugation was continued at 8,600 × g at 4°C for 5 min to
obtain supernatant containing lentiviral particles. Suspensions of
MIN6 cells during the growth phase were made and counted using a
cell counting plate. In total, 2×10⁵ cells were
inoculated in each well of six-well plates. On day 2, the cells
attached the six-well plates before they were transfected with the
corresponding lentiviral vectors at a multiplicity of infection of
10. The six-well plates were then gently shaken after adding the
virus solution and Hitrans A infection booster solution (Shanghai
GeneChem Co., Ltd.) for adequate mixing. The cells were incubated
for 8 at 37°C before the medium was replaced and the cells were
incubated for an additional 48 hat 37°C. Subsequently, the cells
were cultured at 37°C in a medium containing 10 µg/ml puromycin
(Biofroxx) to obtain stably transfected cell lines, which were
named as Lv-Sig-1R cells and Lv-Ctrl cells. The mRNA and protein
expression levels of Sig-1R were measured using reverse
transcription-quantitative PCR (RT-qPCR) and western blotting,
respectively.
RT-qPCR
A EASY spin Cell RNA Rapid Extraction Kit (RN0702,
Aidlab) was used to extract the total RNA. The reverse
transcription kit ReverTra Ace™ qPCR RT Kit (Toyobo Life Science)
was used to synthesize double-stranded DNA. The reaction was 65°C
for 5 min, then 37°C for 15 min and finally 98°C for 5 min. qPCR
was performed using the Magic SYBR Mixture (CoWin Biosciences) in
the CFX96 RT-qPCR Detection System (Bio-Rad Laboratories, Inc.).
RT-PCR was programmed as follows: at 95°C for 30 sec, 40 cycles at
95°C for 5 sec, 60°C for 30 sec, and 72°C for 30 sec, and a 5 sec
incubation at 65°C. Quantification was controlled by normalization
of β-actin. Relative abundance of mRNA expression was calculated by
the 2−ΔΔCq method (15). The sequences of primers for PCR
were as follows: β-actin forward, 5′-CTGAGAGGGAAATCGTGCGT-3′ and
reverse, 5′-CCACAGGATTCCATACCCAAGA-3′ and Sig-1R forward,
5′-TGAGCTTACCACCTACCTCTTTG-3′ and reverse,
5′-GGTATACGCTGCTGTCTGAATATG-3′.
Western blot analysis
RIPA buffer (Beyotime Institute of Biotechnology)
was added to the treated cells to obtain the total protein samples.
Protein concentration was then determined by BCA kit (Beyotime
Institute of Biotechnology). Then, 10% SDS-PAGE was prepared,
subjected to electrophoresis and transferred to PVDF membranes.
Blots were blocked with 5% skim milk for 1 h at room temperature,
followed by incubation with antibodies separately. The membranes
were incubated in the primary antibody overnight at 4°C, washed by
TBST containing 0.1% Tween-20 and soaked in the secondary antibody
for 1 h at room temperature. The primary antibodies used were as
follows: anti-β-actin (1:10,000; Abcam; cat. no. ab179467),
anti-Sig-1R (1:500; ProteinTech Group, Inc. 15168-1-AP), anti-CHOP
(1:1,000; Affinity Biosciences, DF6025), anti-glucose-regulated
protein 78 (GRP78) (1:1,000; Affinity Biosciences, AF5366),
anti-Bax (1:1,000; Affinity Biosciences, AF0120), anti-Bcl-2
(1:1,000; BIOSS, bs-4563R) and anti-cytochrome c (1:5,000;
Abcam, ab133504). The secondary antibody used was the goat
anti-rabbit conjugated with HRP (1:10,000; Abcam, ab6721). The
immunoreactive bands were visualized with an automatic
chemiluminescence image analysis system (Tanon 5200, China) The
Bandscan 4.3 software (Glyko) was used to analyze the gray value of
the protein.
5-ethynyl-2′-deoxyuridine (EdU)
incorporation assay
A BeyoClick EdU-555 kit (Beyotime Institute of
Biotechnology; cat. no. C0075S) was used to measure the
proliferation rate of cells. Firstly, 2×10⁵ cells were
inoculated into a 6-well plate and cultured in a cell incubator
overnight at 37°C. EdU was added to the medium so that the final
concentration of EdU was 20 µM and cells was incubated for another
3 h at 37°C. Subsequently, 4% paraformaldehyde was used to fix the
cells for 15 min at indoor temperature and 0.3% Triton X-100 was
used for permeabilization. The cells were washed using PBS with 3%
BSA (Biofroxx, Germany) twice. The Click Additive solution was then
prepared to incubate the cells for 30 min at indoor temperature.
The cells were washed again and resuspended in PBS. The
fluorescence intensity of 10,000 cells was recorded using a
CytoFLEX S flow cytometer (Beckman Coulter, Inc.), before the
percentage of EdU-positive cells in each sample was calculated by
CytExpert2.3 (Beckman Coulter, Inc.) as follows: FITC positive
represents the cells successfully transferred into lentivirus (GFP
was detected by FITC). PE-positive represents the EdU-positive
cellsand PE-negative represents the EdU-negative cells (EdU was
detected by PE).
Cell cycle analysis
The cells were digested with trypsin before the cell
suspension was washed with PBS. Ice-cold 70% ethanol was used to
fix the cells overnight. The next day, the cells were washed twice
with PBS. Propidium Iodide (PI)/RNase A (9/1, v/v)
(Nanjing KeyGen Biotech Co., Ltd., cat. no. KGA512) staining
solution was prepared and added to incubate the cells for 30 min at
room temperature. Red fluorescence was then recorded for 10,000
cells at 488 nm using the CytoFLEX S flow cytometer (Beckman
Coulter, Inc.). Since the DNA content is different during different
phases of the cell cycle, the fluorescence intensity detected by
the flow cytometer would also be expected to be different by
CytExpert 2.3 (Beckman Coulter, Inc.). Therefore, the number of
cells in the three different phases (G1, S and
G2 phases) of the cell cycle was obtained.
Determination of cell apoptosis
An Annexin V-APC/PI apoptosis detection kit (Nanjing
KeyGen Biotech Co., Ltd.KGA1030) was used to detect the cell
apoptosis rate. After the cells were digested with trypsin, 5 µl
Annexin V-APC and 5 µl PI dyes were added to cell suspension. The
cell apoptosis rate was detected using the CytoFLEX S flow
cytometer (Beckman Coulter, Inc.) after 1 h incubation at indoor
temperature. A total of 10,000 cells were recorded and the results
were analyzed by CytExpert 2.3 (Beckman Coulter, Inc.) as follows:
Annexin V-APC-positive and PI-negative, early apoptotic cells;
Annexin V-APC-positive and PI-positive, late apoptotic cells. Cell
apoptosis rate=(early apoptosis + late apoptosis)/total number of
cells per well.
Insulin secretion assay
A total of 2×10⁵ cells was seeded into
6-well plates. The next day, palmitic acid (PA; Sigma-Aldrich;
Merck KGaA) was added to incubated for 24 h at 37°C after the cells
adhered to the wall. And then, the cells were rinsed with PBS once
and RPMI-1640 (HyClone; Cytiva) without glucose was added and
incubated for 30 min at 37°C. HEPES-buffered Krebs-Ringer
bicarbonate buffer (KRBB) (16)
containing 0.1% BSA and 2.5 mmol/l glucose was then added for
incubation for 1 h at 37°C. The supernatant was collected for the
detection of basal insulin secretion. Subsequently, KRBB solution
containing 0.1% BSA and 20 mmol/l glucose was added and incubated
for 1 h at 37°C. The supernatant was then collected to detect
insulin secretion after glucose stimulation. The insulin
concentration was measured using a mouse insulin ELISA kit
(Elabscience Biotechnology Inc. PI602).
Measurement of adenosine triphosphate
(ATP) production
2×10⁵ cells were seeded into 6-well
plates. The next day, PA was added to incubated for 24 h at 37°C
after the cells adhered to the wall. Afterwards, ATP generation was
measured using an ATP Assay Kit (Beyotime Institute of
Biotechnology, cat. no. S0026). The cells were lysed, and the
supernatant was obtained after centrifugation at 12,000 × g at 4°C
for 5 min. The standard curve was established using ATP standard
solution. The working fluid was configured and finally the ATP
concentration was measured in a multi-purpose microplate reader
(Enspire; PerkinElmer, Inc.).
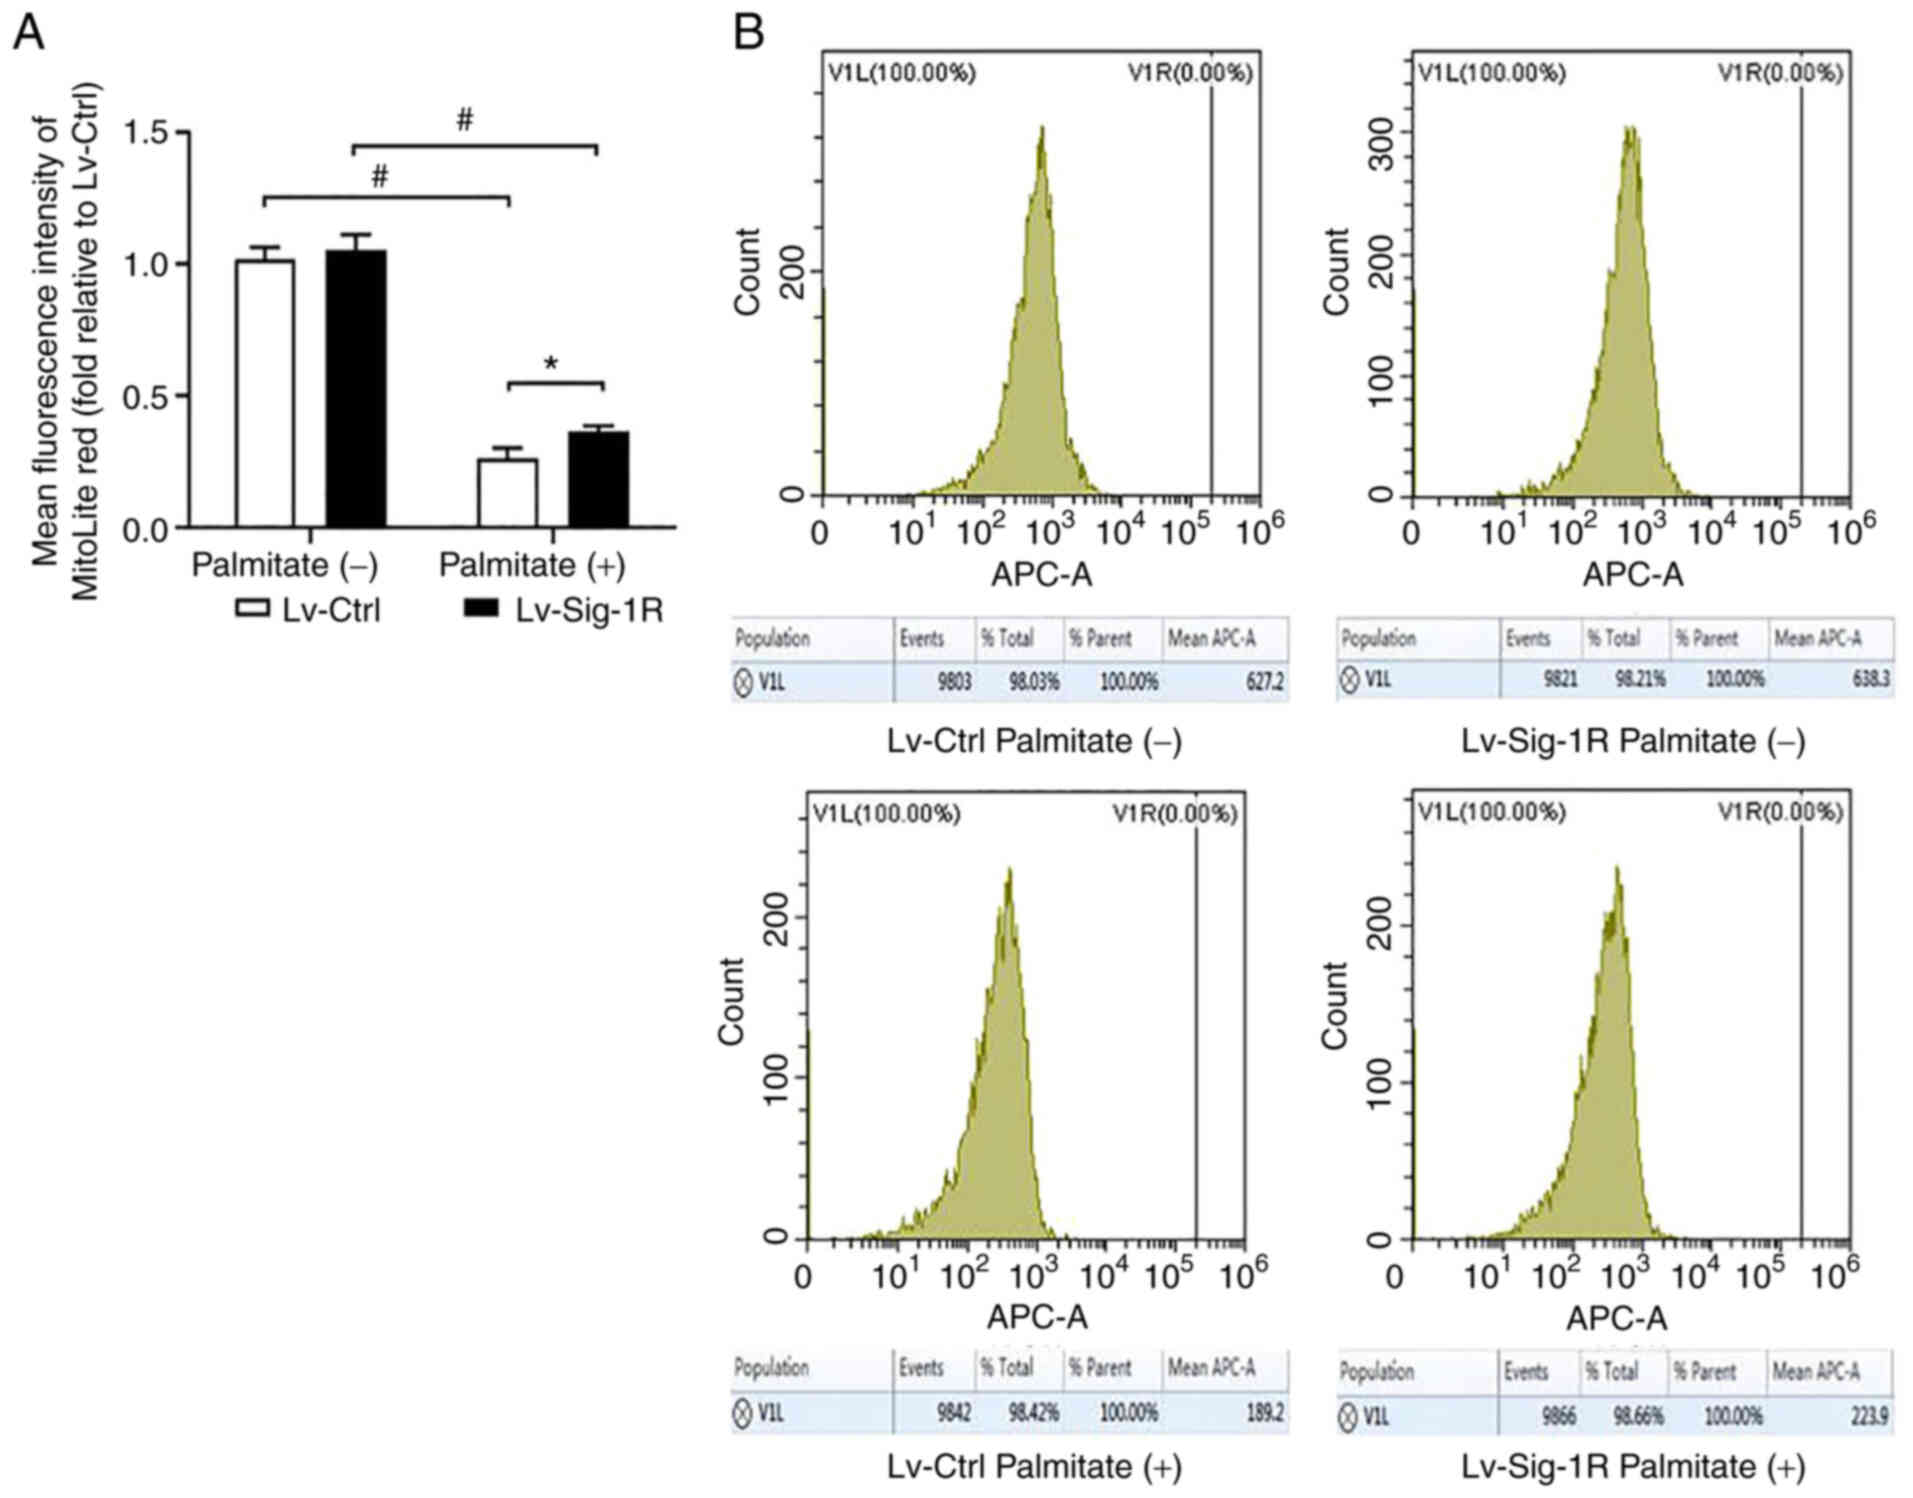
Measurement of mitochondrial membrane
potential (MMP)
Cell Meter™ Kit (ATT Bioquest, Inc., 22806) was used
to detect the MMP. The cell suspension was prepared and 1 µl 500X
MitoTell Red was added to the 0.5 ml cell solution. The cells were
then incubated at 37°C under 5% CO2 for 30 min, before
they were precipitated at 200 × g at 4°C for 5 min and resuspended
in 0.5 ml detection buffer. The cells were finally analyzed using
the cytoFLEX S flow cytometer (Beckman Coulter, Inc.). A total of
10,000 cells were recorded, and the average fluorescence intensity
value of each sample was calculated by CytExpert 2.3 (Beckman
Coulter, Inc.).
Transmission electronic microscopy
(TEM)
Lv-Sig-1R cells and Lv-Ctrl cells were fixed with an
electron microscope stationary liquid (2.5% Glutaraldehyde
(Solarbio, China, P1126) for 1 h at 4°C, before an ascending ethyl
alcohol gradient was used for dehydration. The cells were permeated
overnight at 37°C using SPI-Pon 812 (SPI, America, 90529-77-4) and
polymerized in oven at 60°C for 48 h. After cutting into slices of
60–80 nm, the cells were stained using uranium-lead double staining
(2% uranium acetate and 2.6% lead citrate) for 15 min at room
temperature. The images were analyzed usinga transmission electron
microscope. Mitochondria and ER were delimited using Image-pro plus
6.0 (National Institutes of Health) before the fraction of the
mitochondrial membrane in contact with ER within a 50-nm range was
marked (17).
Immunofluorescence
2×10⁵ cells was first seeded onto the
coverslip in 6-well plates. The next day, 0.5 mM PA was added to
incubated for 24 h at 37°C after the cells adhered to the coverslip
before 4% paraformaldehyde was used to fix the cells for 30 min at
indoor temperature and PBS was used to wash them. The membrane
breaking solution (1% Triton X-100) and 3% hydrogen peroxide
solution were added to incubate the cells for 30 min at room
temperature, before PBS was used to wash the cells again. Then they
were blocked with 5% BSA (Biofroxx, Germany) for 10 min at room
temperature. Next, the cells were incubated in the primary antibody
overnight and washed and soaked in the secondary antibody for 50
min at indoor temperature. The primary antibodies used were as
follows: Anti-protein disulfide isomerase (PDI; 1:200; Proteintech
Group, Inc. 66422-1-l g), anti-inositol 1,4,5-trisphosphate
receptor (IP3R; 1:100; ABclonal Biotech Co., Ltd. A4436), and
anti-voltage-dependent anion channel 1 (VDAC1; 1:100; ABclonal
Biotech Co., Ltd., A19707). The secondary antibody used was the
goat anti-mouse conjugated with Cy3 (1:50; cat. no. AS-1111; Wuhan
Aspen Biotechnology Co., Ltd.) and Cy5 (1:200; Wuhan Bioqiandu
Technology Co., Ltd.; cat. no. B100810). Finally, 100 µl 10 µg/ml
DAPI per well was added to incubate cells for 5 min at room
temperature. After washing the cells with PBS, the coverslips were
sealed by anti-fade mounting medium (Biosharp; cat. no. BL701A) and
the cells were observed under a fluorescence at 400 magnification
or confocal microscope at 630 magnification.
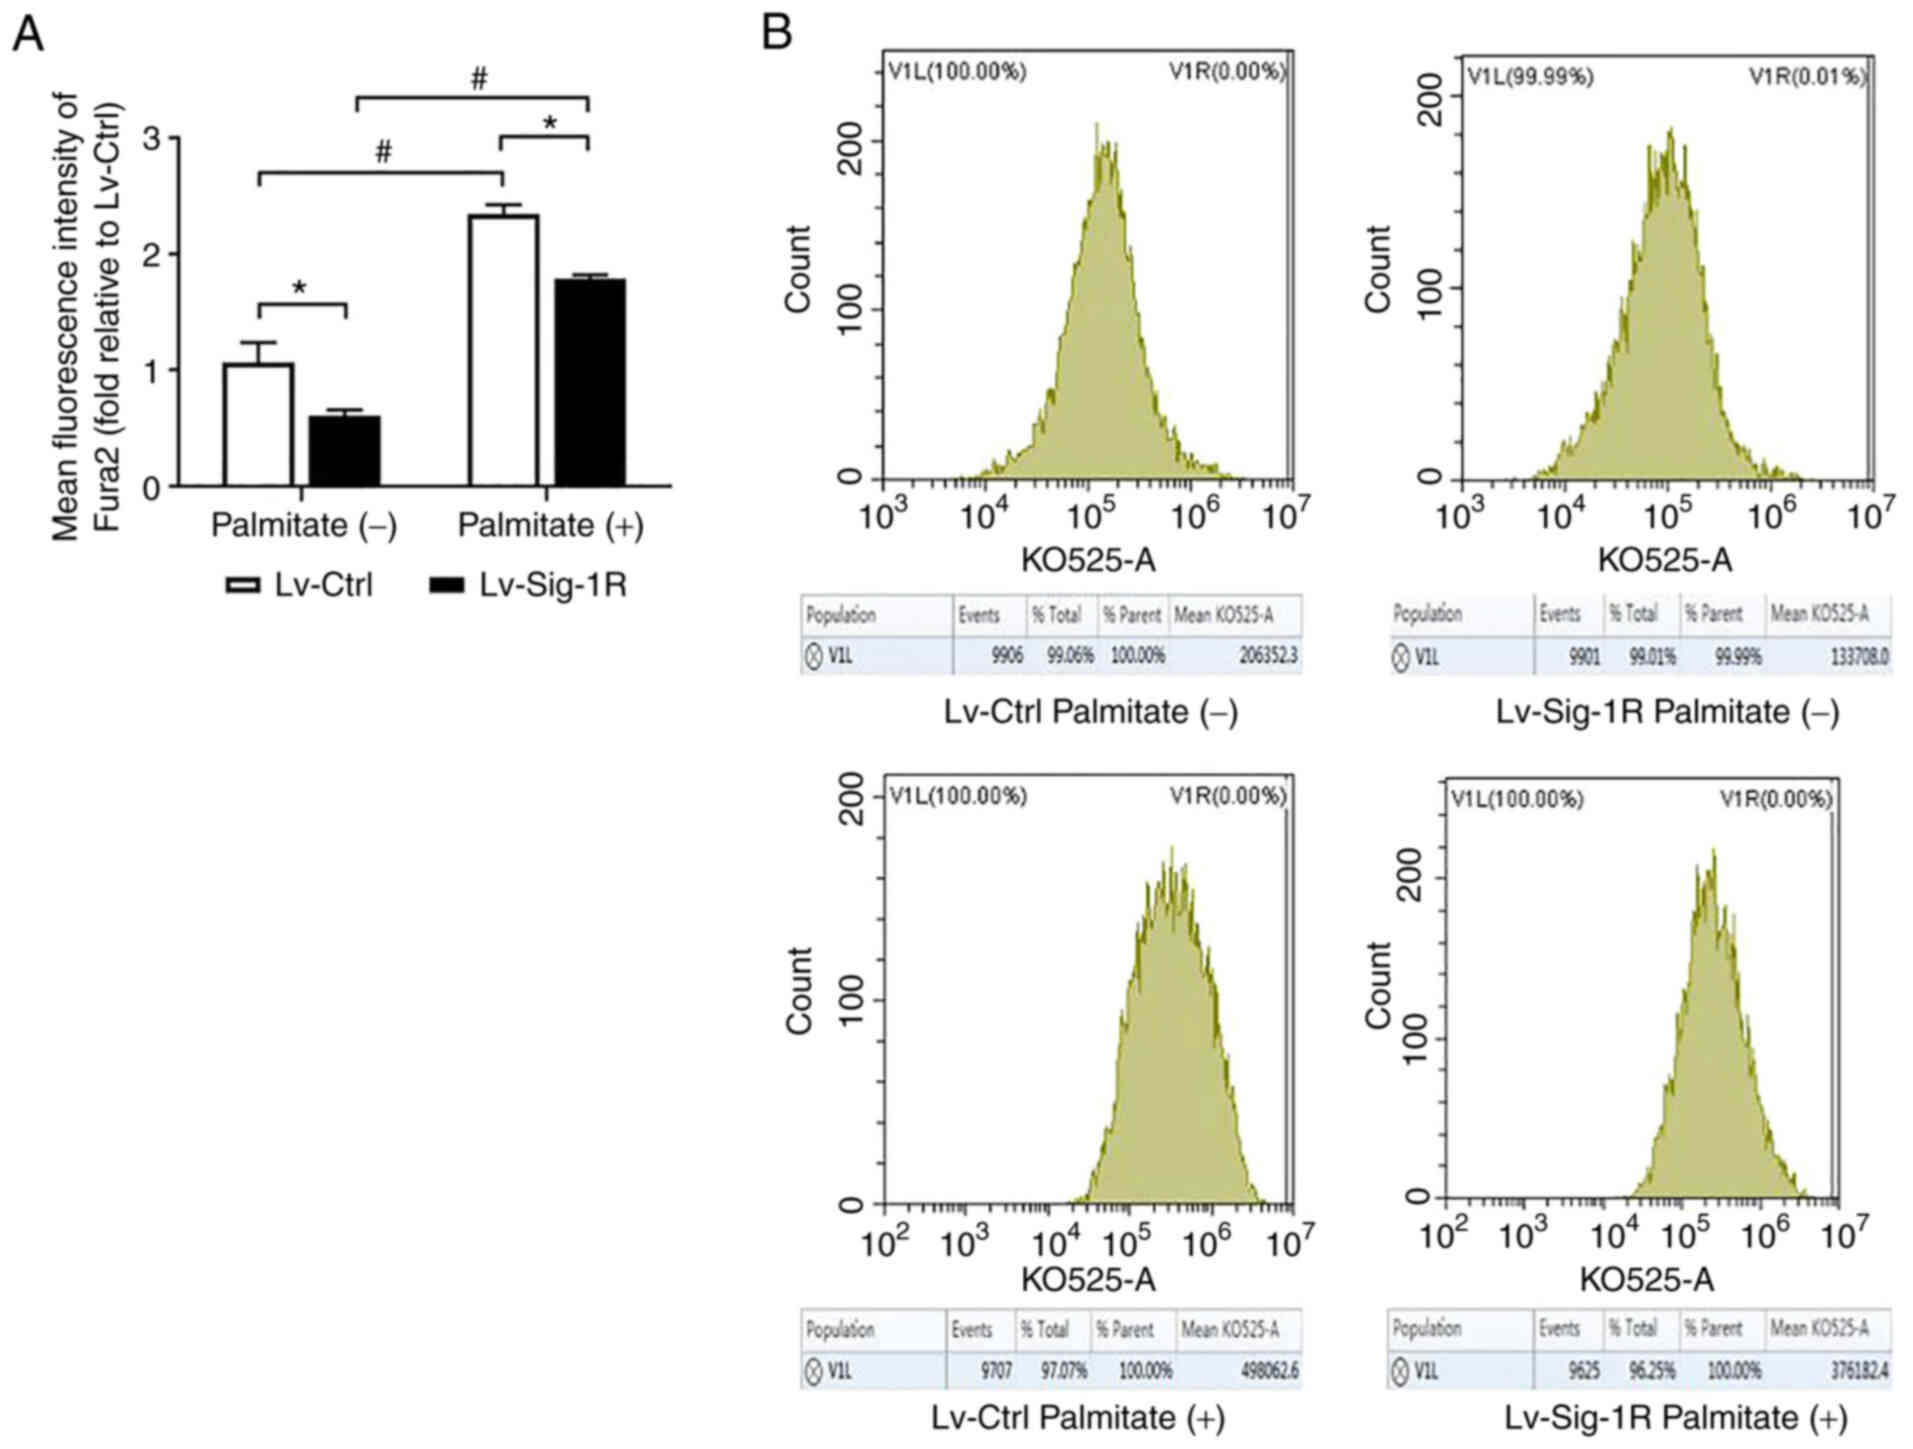
Cell calcium detection
Fura-2/AM (ATT Bioquest, Inc.) was used to detect
the intracellular cell calcium levels. A 4 mM stock solution was
prepared by dissolving Fura-2/AM in DMSO. This Fura-2/AM dye was
then diluted to a 4 µM working solution using D-Hank's buffer
(Biosharp, BL559A). A total of 2×10⁵ cells were seeded
into 6-well plates. The next day, 0.5 mM PA was added to incubated
for 24 h at 37°C after the cells adhered to the wall. The medium in
pre-cultured cells was first removed and the cells were washed
three times with Hank's buffer. The Fura-2/AM dye was then added to
the cells for 60 min at 37°C before the dye was removed. The cells
were then washed three times with Hank's buffer. Finally, the cells
were processed using a cytoFLEX S flow cytometer (Beckman Coulter,
Inc.) in UV excitation (405/10) (channel 505–545 nm, dye KO525). A
total of 10,000 cells were recorded and the average fluorescence
intensity value of each sample was calculated by CytExpert 2.3
(Beckman Coulter, Inc.). Fura-2/AM is a calcium fluorescence probe,
which can specifically bind cytoplasmic Ca2+ (binding
ratio is 1:1). The increase or decrease of fluorescence signal can
indicate that the treatment causes the increase or decrease of
intracellular calcium. The average fluorescence intensity can
reflect the changes of the overall calcium level of cells.
Statistical analysis
The results were expressed as the mean ± standard
deviation of three experimental repeats. All data were analyzed
using the SPSS20.0 software (IBM Corp). Graphs were drawn using
GraphPad Prism 8 software (Graphpad Software, Inc.). Statistical
significance between two experimental conditions was analyzed using
the Student's t test whereas two-way ANOVA followed by Sidak's post
hoc test was used for comparisons among >two groups. P<0.05
was considered to indicate a statistically significant
difference.
Results
Generation of Sig-1R-overexpressing
cells
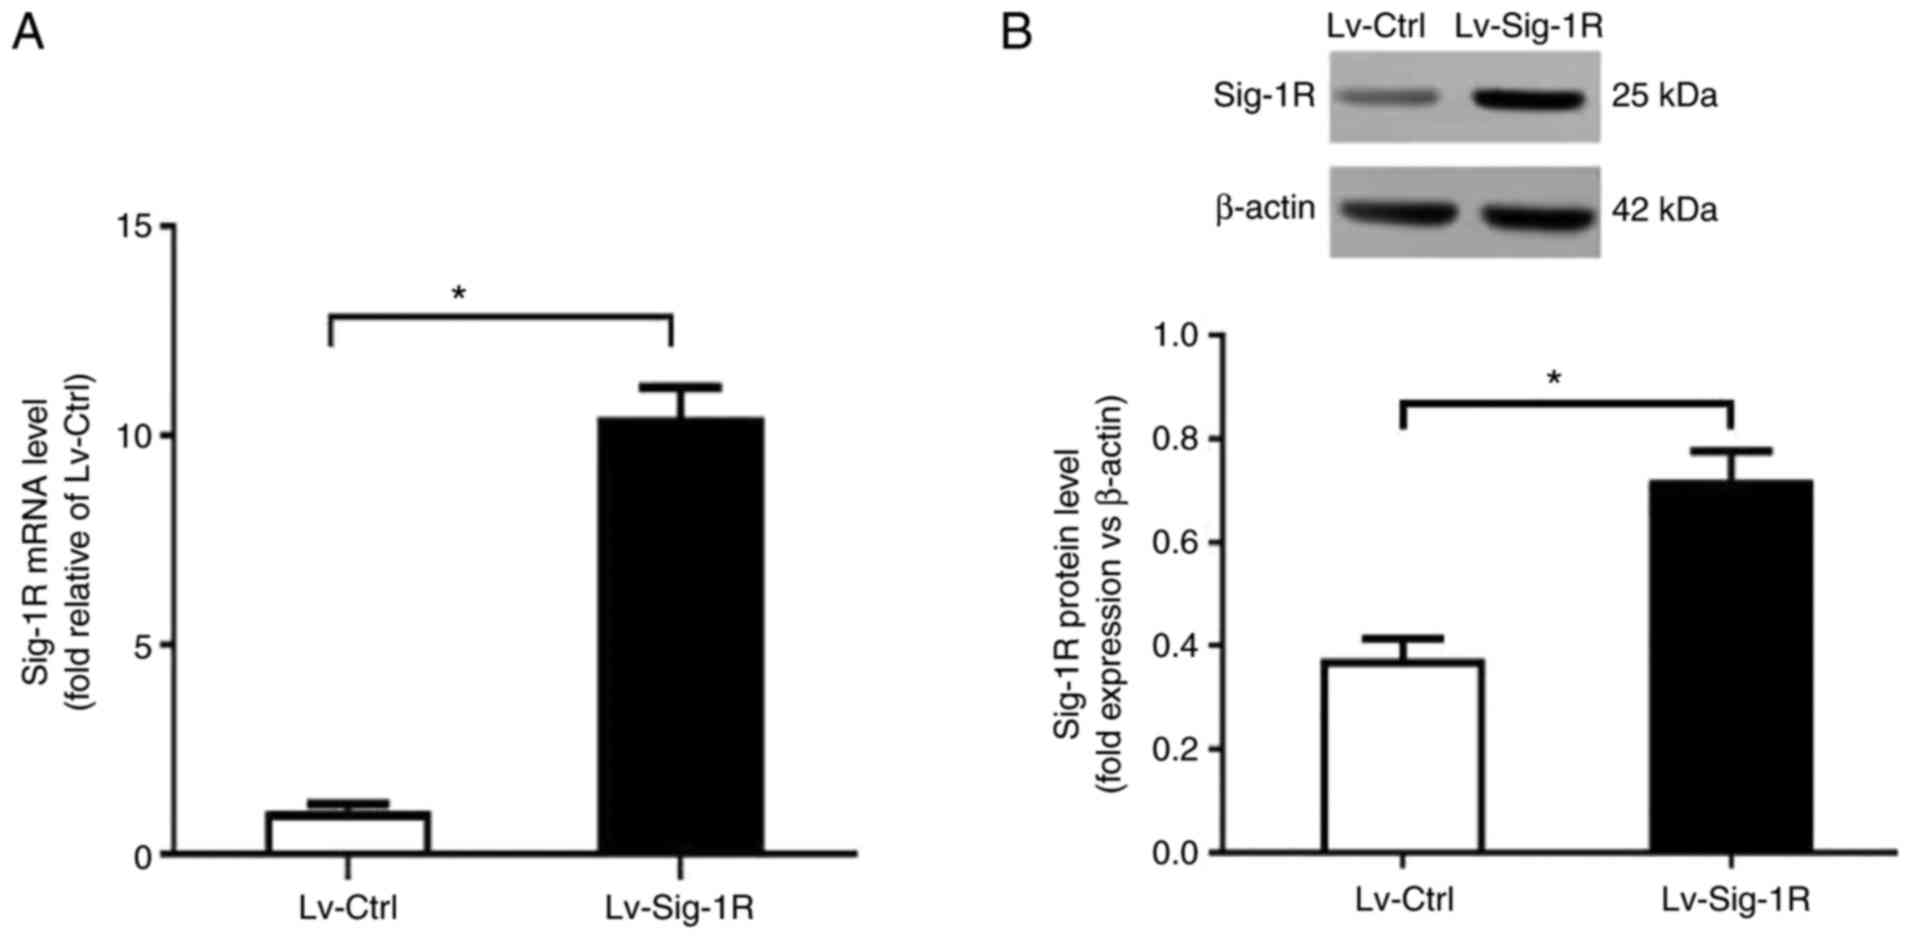
Lentiviral vectors were used to transfect MIN6 cells
to create the Sig-1R-overexpressing Lv-Sig-1R cells. RT-qPCR
revealed a significant increase in Sig-1R mRNA expression in
Lv-Sig-1R cells compared with that in the Lv-control cells
(P<0.05; Fig. 1A). Subsequent
western blot analysis also showed a significant increase in Sig-1R
protein expression in Lv-Sig-1R cells compared with that in
Lv-control cells (P<0.05; Fig.
1B).
Sig-1R overexpression promotes
proliferation and cell cycle progression
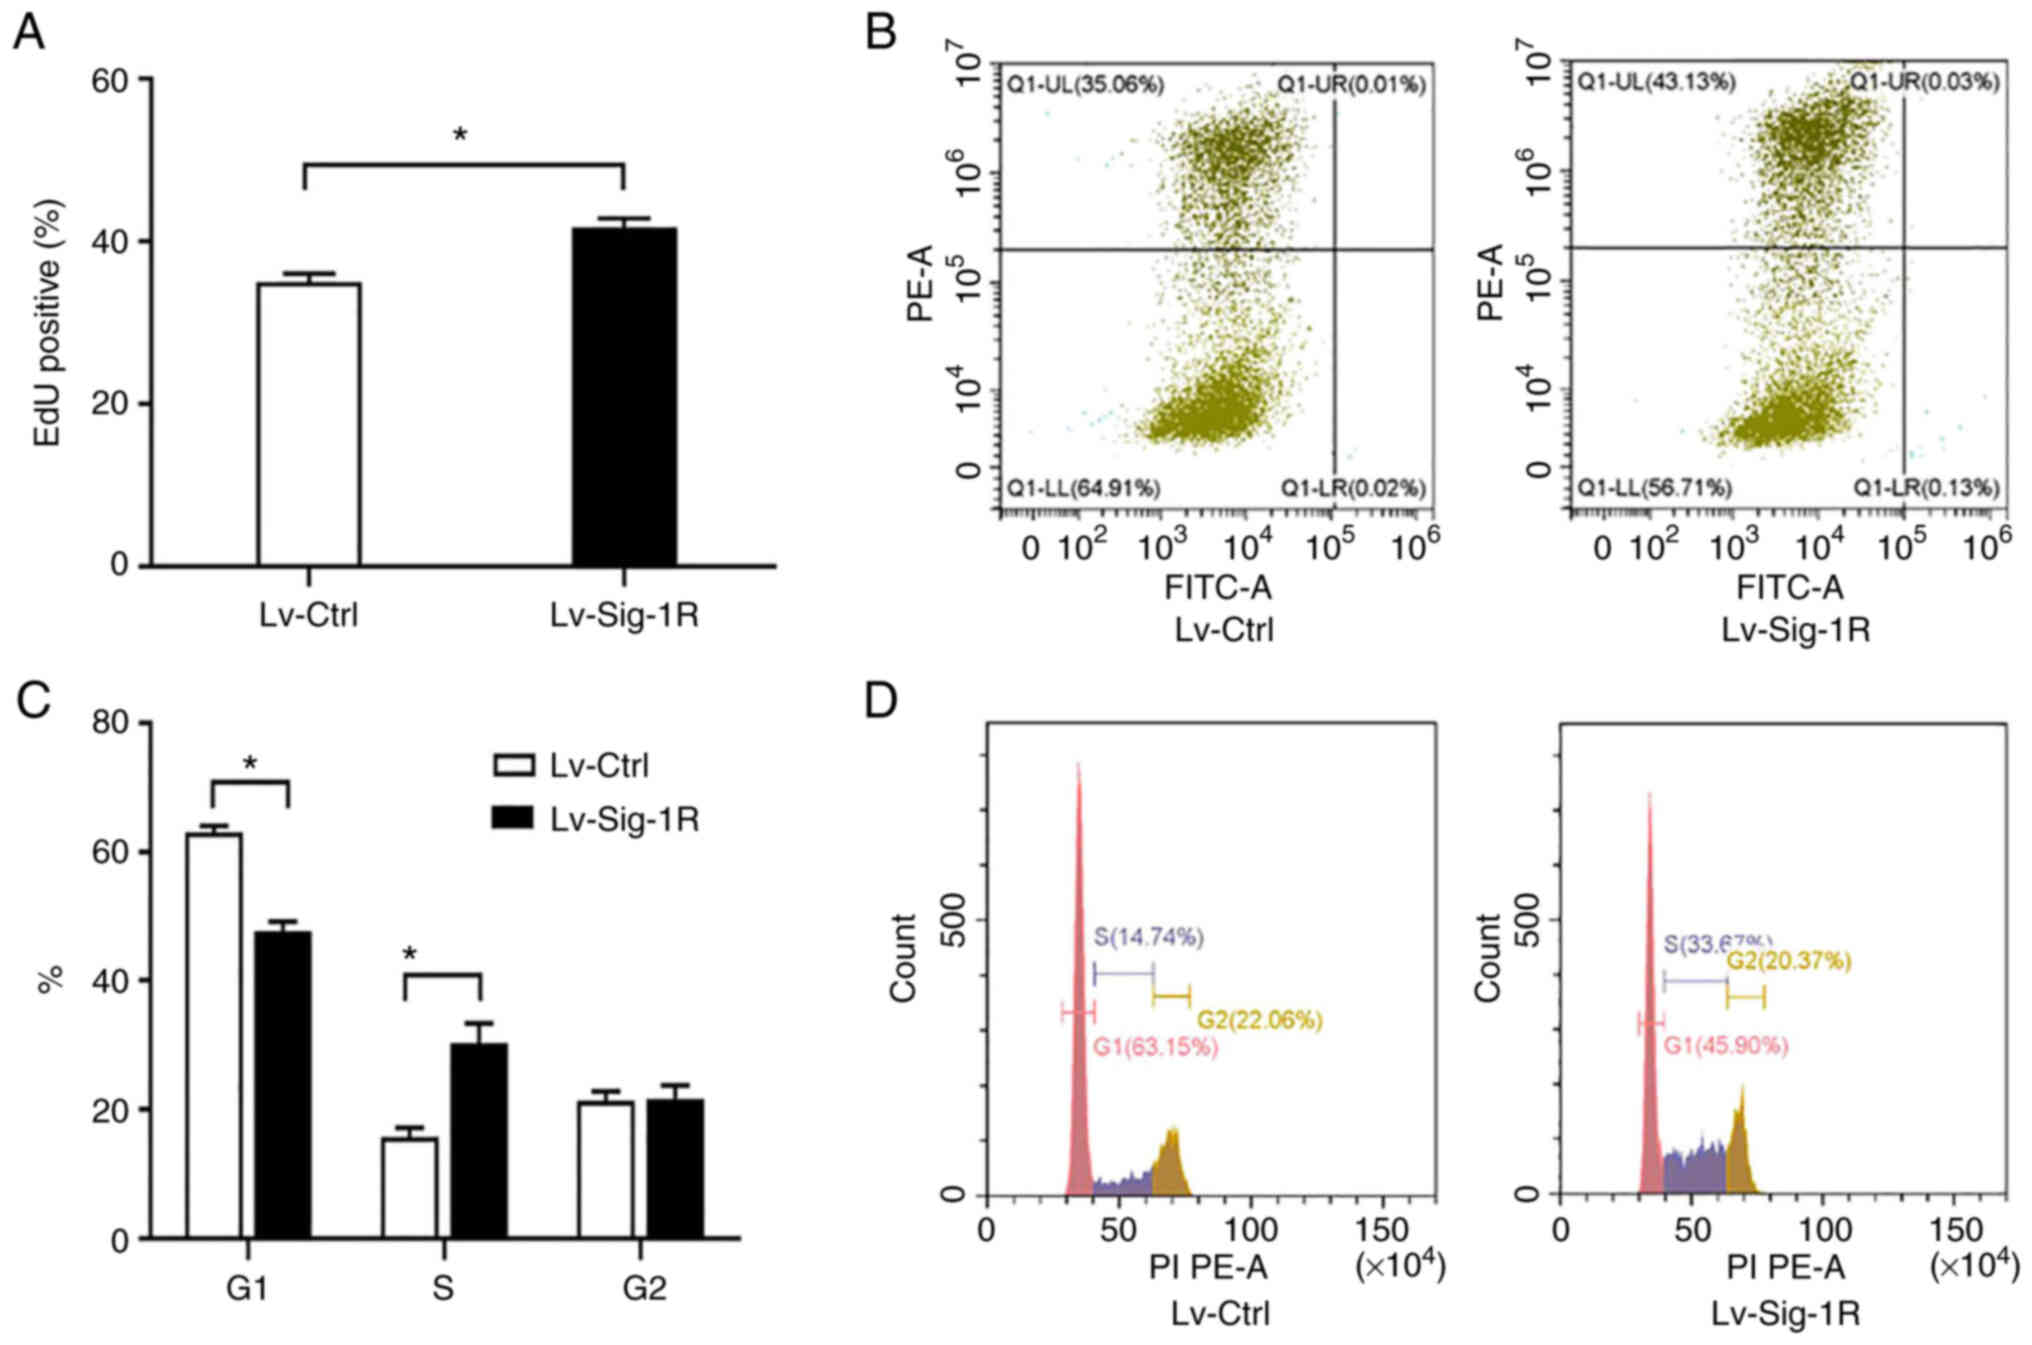
EdU incorporation assay showed that Lv-Sig-1R cells
had a significantly increased percentage of EdU-positive cells
compared with that in the Lv-Ctrl cells (P<0.05; Fig. 2A and B), suggesting that Sig-1R
overexpression promoted MIN6 cell proliferation. Cell cycle
analysis demonstrated that the percentage of cells in G1
phase was significantly decreased whereas that in S phase was
significantly increased, in Lv-Sig-1R cells compared with that in
Lv-Ctrl cells (P<0.05; Fig. 2C and
D). These results suggest that Sig-1R overexpression promoted
β-cell proliferation resulting from the potentiation of cell cycle
progression.
Sig-1R overexpression prevents
apoptosis and impairs PA-induced insulin secretion in MIN6
cells
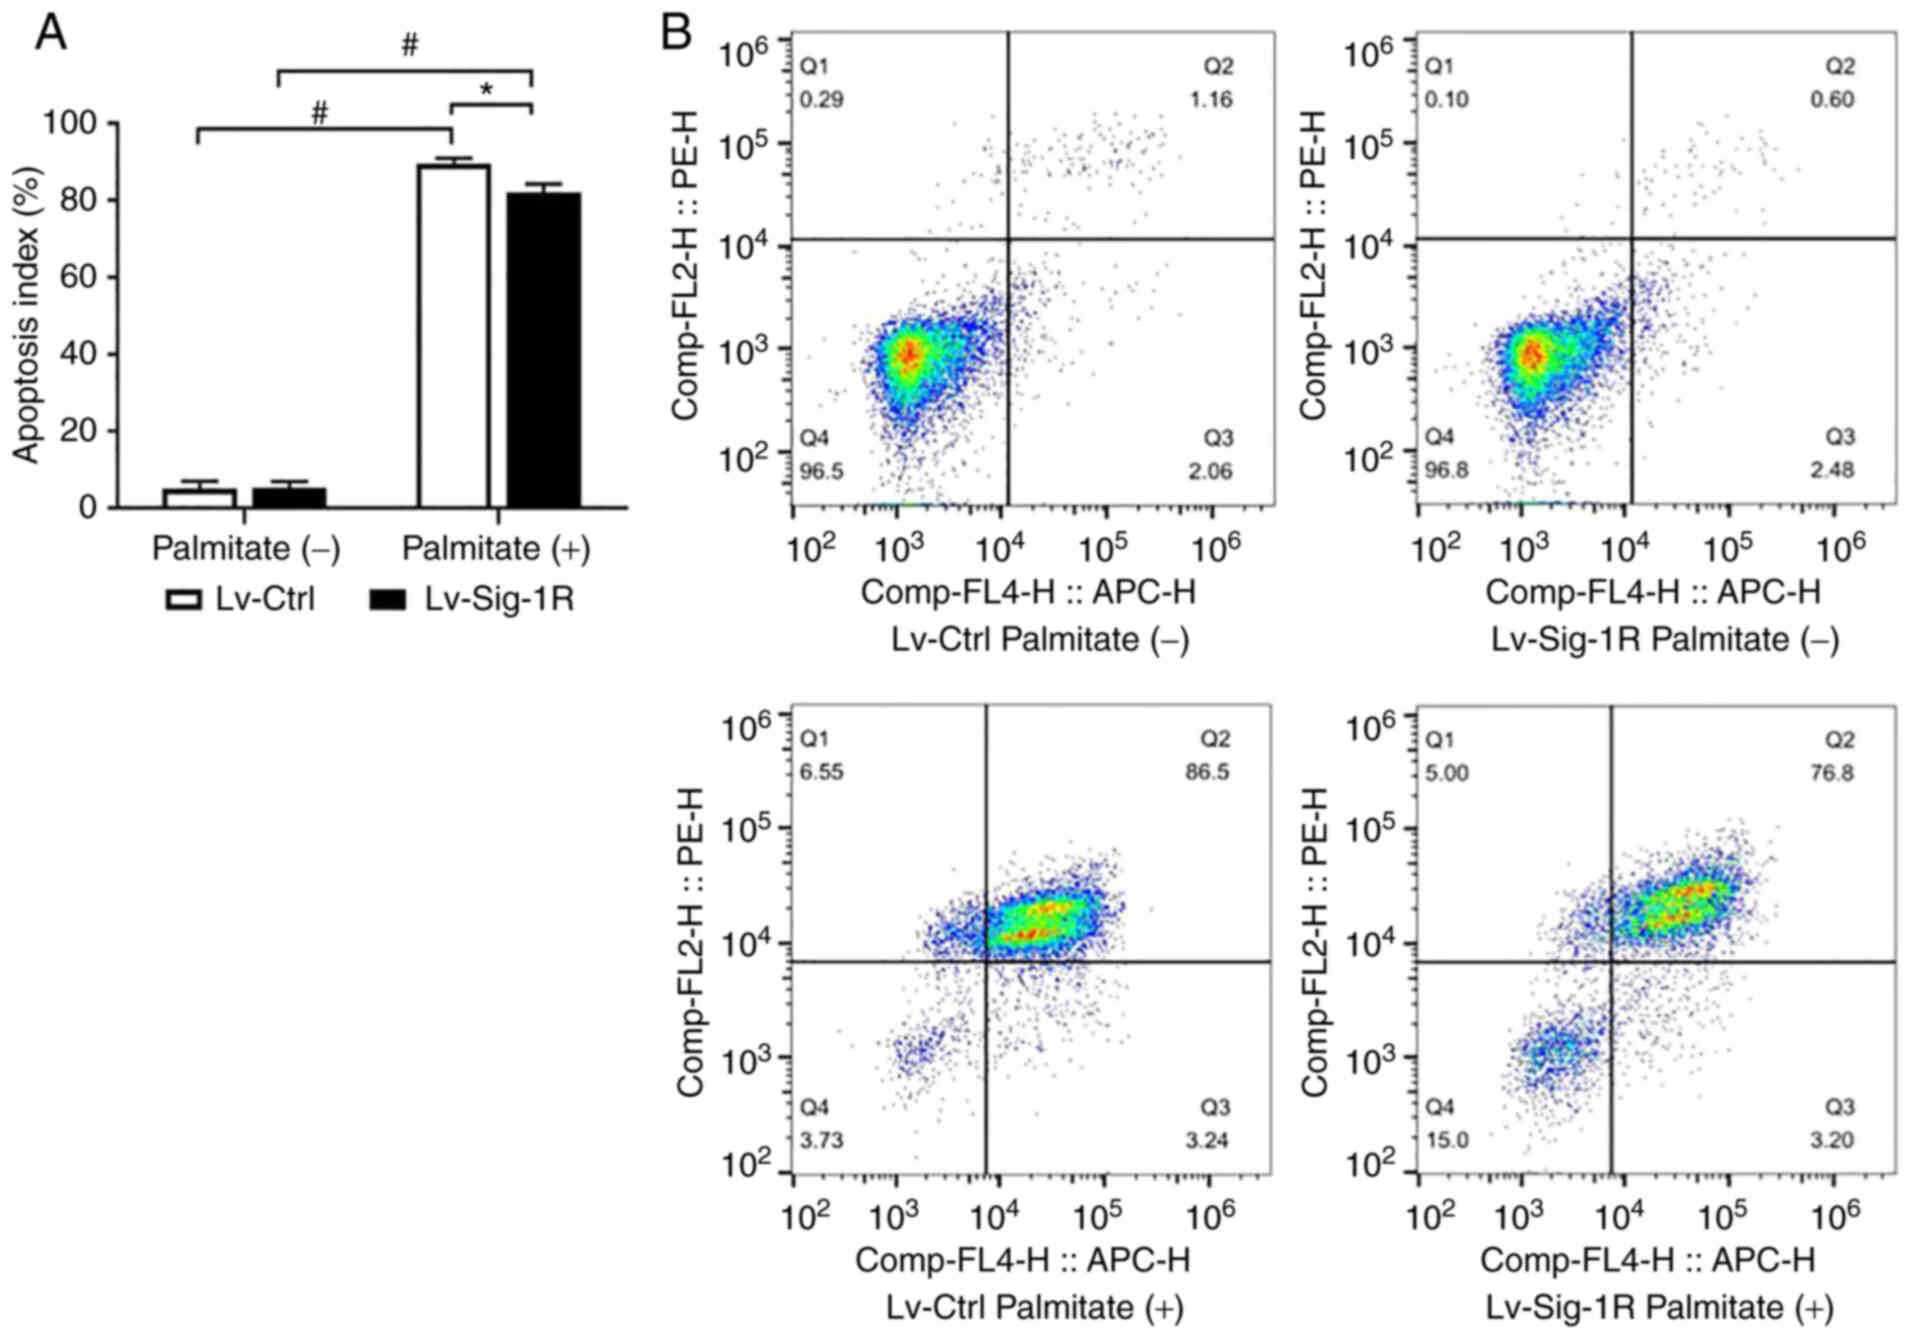
Cell apoptosis assay revealed similar cell apoptosis
rates under basal conditions in both Lv-Ctrl and Lv-Sig-1R cells.
However, the apoptosis rate significantly increased after PA was
added in both groups of these cells (P<0.05; Fig. 3). In particular, the cell
apoptosis rate increased by a larger extent in Lv-Ctrl cells
compared with that in Lv-Sig-1R cells after exposure to PA
(P<0.05; Fig. 3).
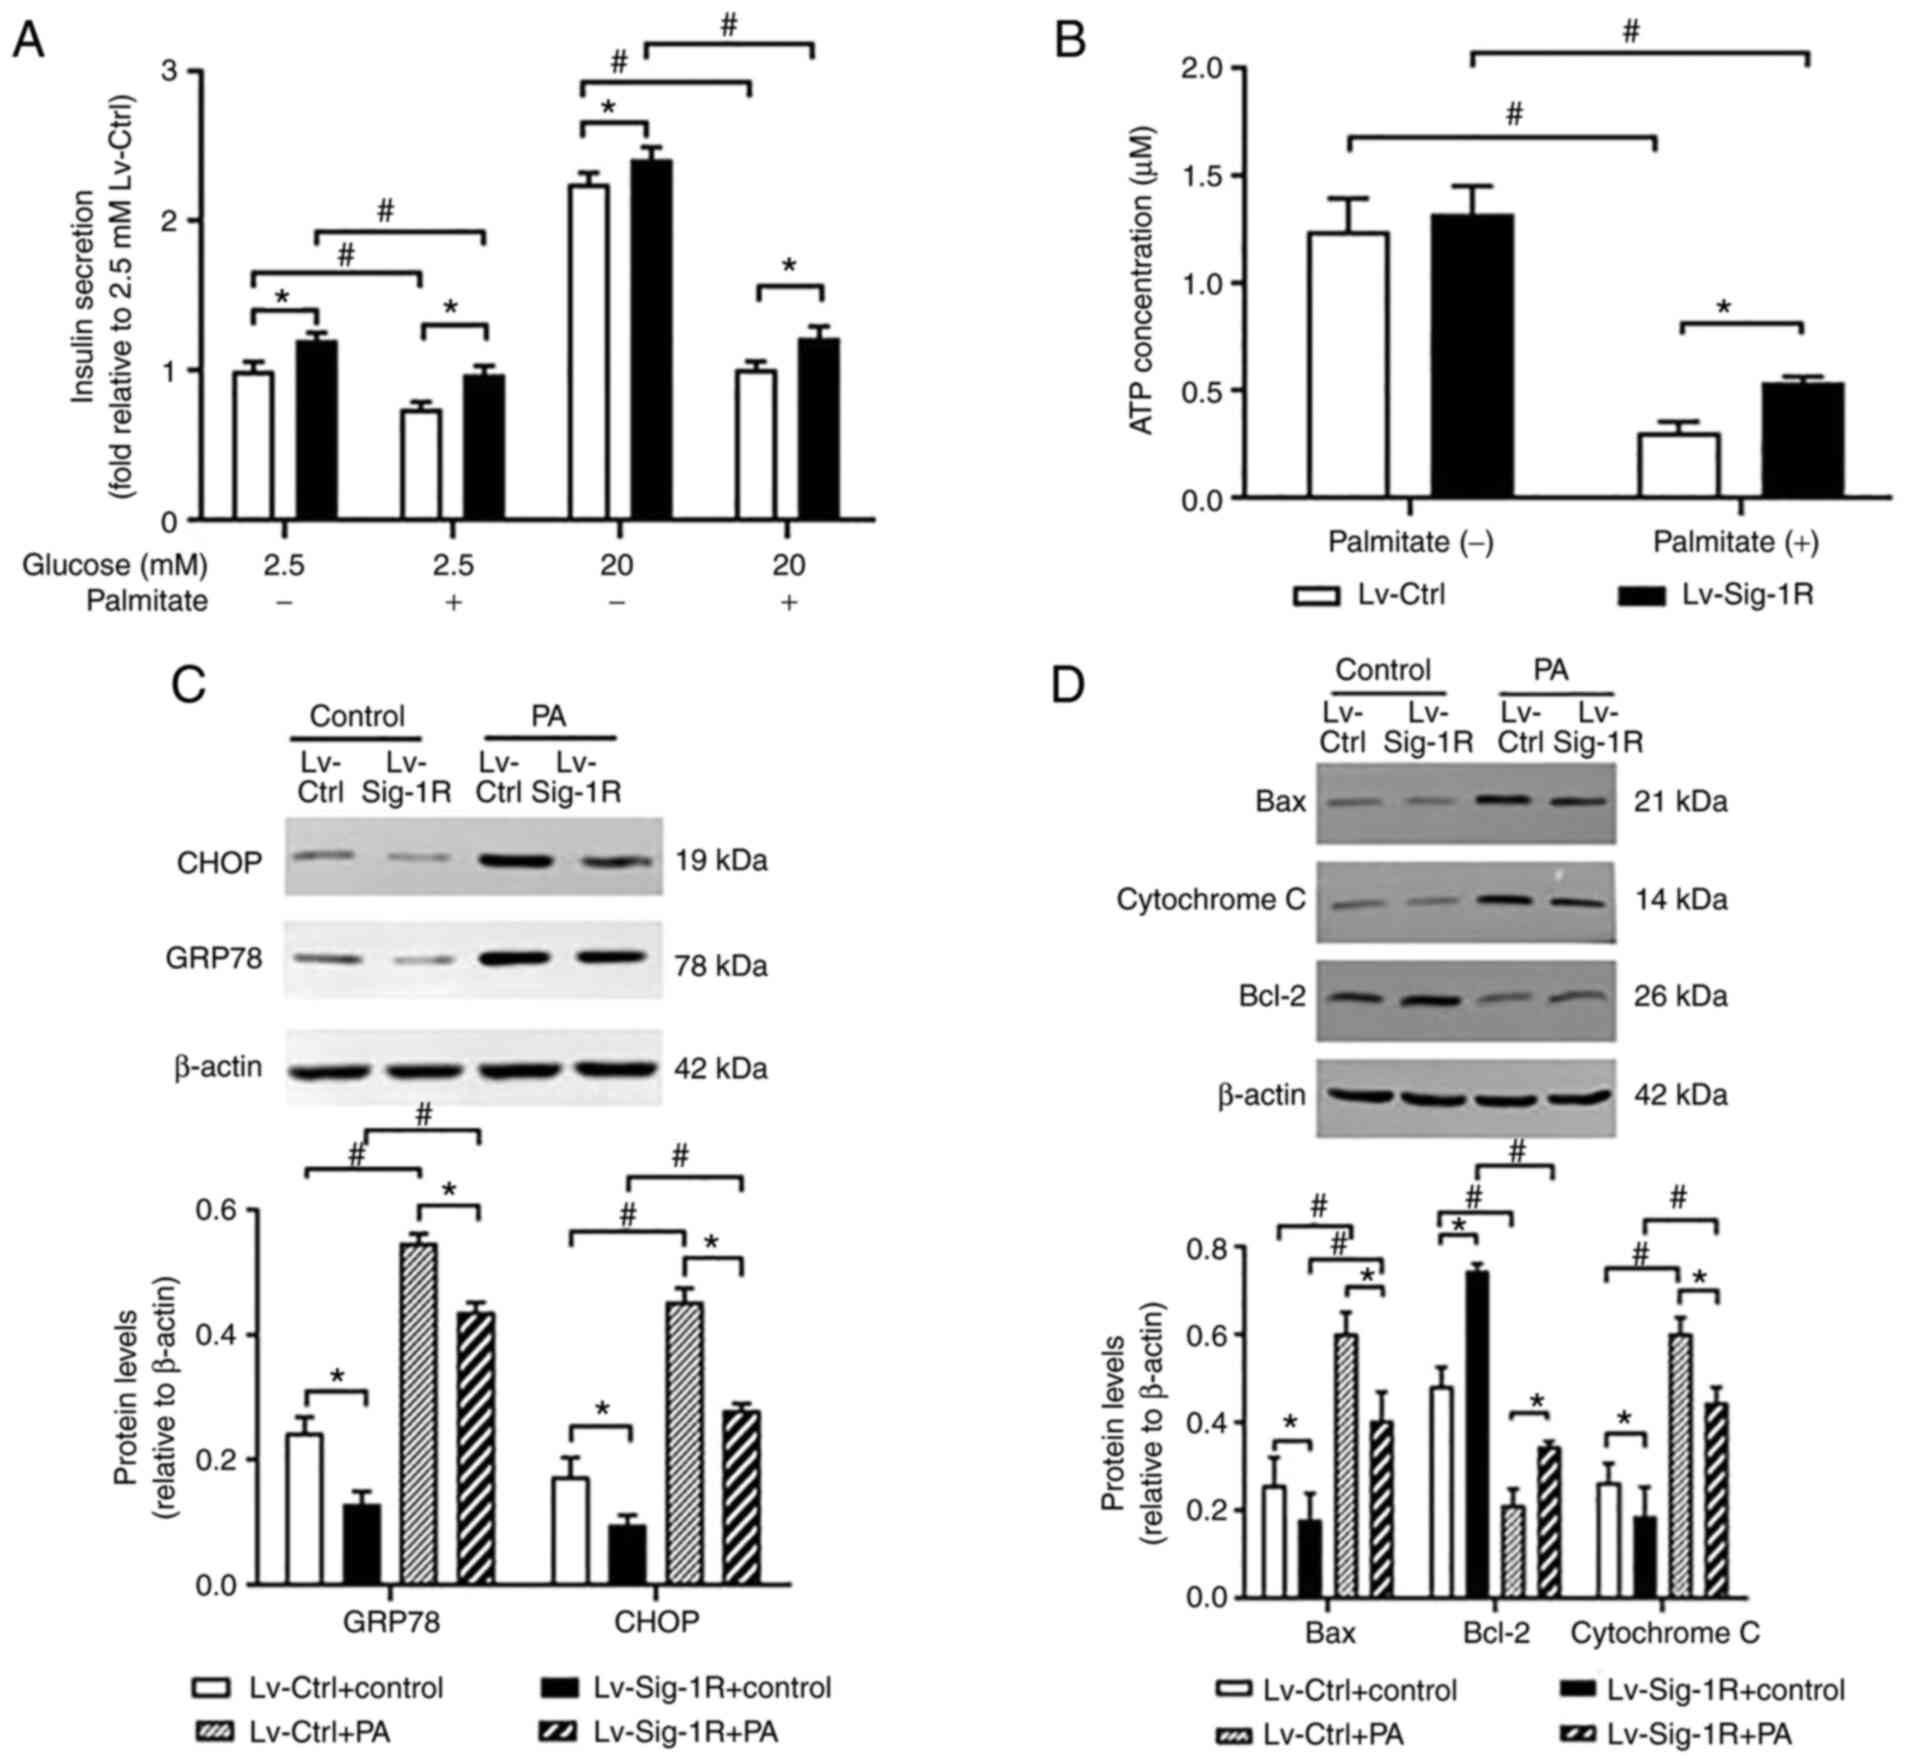
Glucose-stimulated insulin secretion assay showed
that insulin secretion was significantly decreased in Lv-Ctrl and
Lv-Sig-1R cells after exposure to PA compared with that in their
corresponding control that were not treated with PA (P<0.05;
Fig. 4A). However, significantly
increased insulin secretion was observed in Sig-1R-overexpressing
MIN6 cells compared with that in Lv-Ctrl cells regardless of
whether they were exposed to palmitate (P<0.05; Fig. 4A). Therefore, it was concluded
that Sig-1R overexpression ameliorated PA-induced impaired insulin
secretion and cell apoptosis.
Sig-1R overexpression relieves ER
stress and mitochondrial dysfunction induced by PA in MIN6
cells
GRP78 and CHOP are typical markers of ER stress
(18). The results in the present
study showed that the protein expression of GRP78 and CHOP in
Lv-Ctrl and Lv-Sig-1R cells was both significantly increased on
exposure to PA compared with that in their corresponding cells not
treated with PA (P<0.05; Fig.
4C). Similar to the insulin secretion data, after treatment
with cells with treated with PA, protein expression of GRP78 and
CHOP was significantly decreased in Sig-1R-overexpressing MIN6
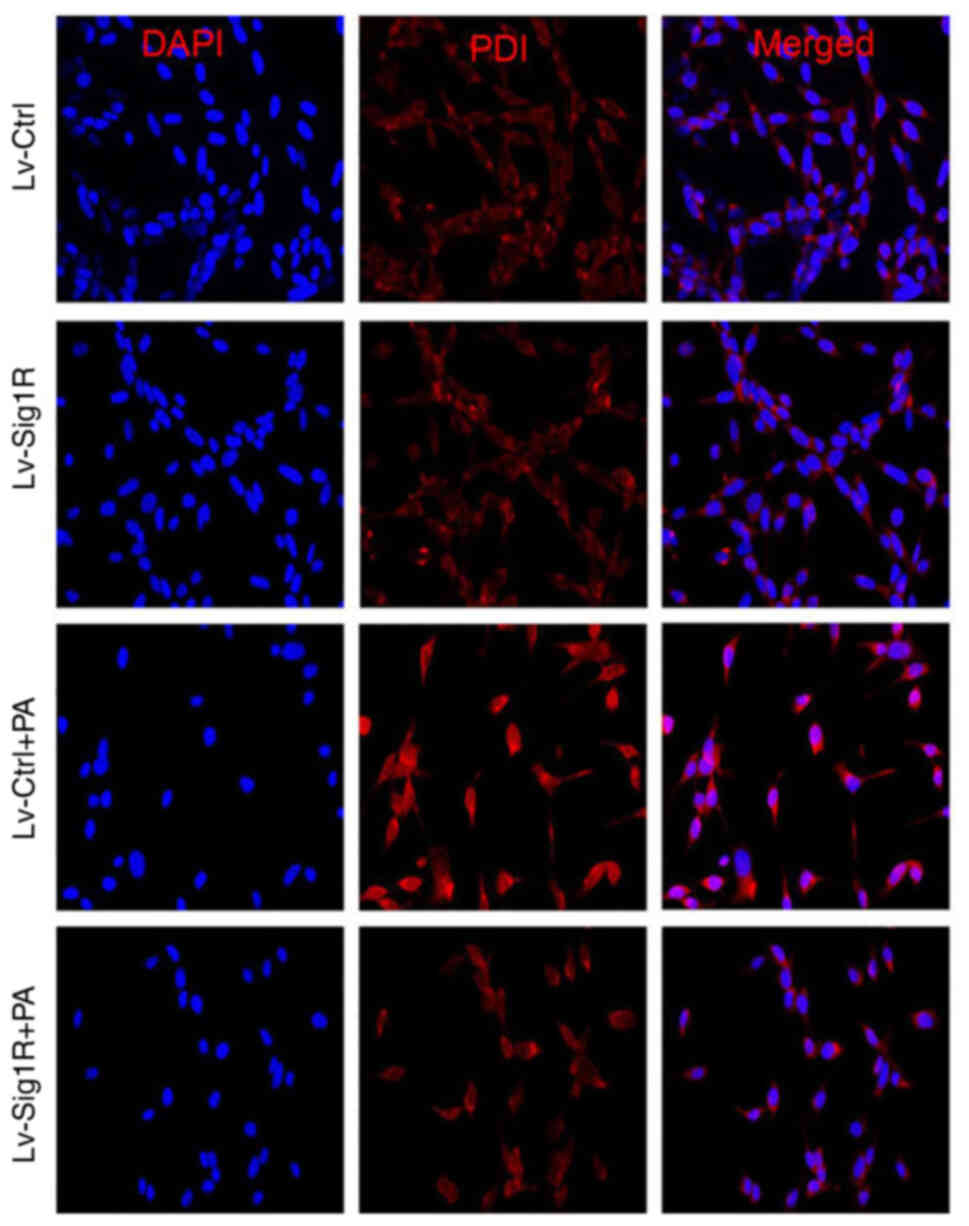
cells compared with that in Lv-Ctrl cells (P<0.05; Fig. 4C). PDI promotes the correction of
disulfide bonds between proteins. During the early stages of ER
stress, PDI is typically activated to maintain ER stability by
reducing the aggregation of misfolded and unfolded proteins within
ER (19). Immunofluorescence
results showed that PDI expression was markedly decreased in
Sig-1R-overexpressing MIN6 cells compared with that in Lv-Ctrl
cells following the exposure of both cells to PA (Fig. 5). These results suggest that
Sig-1R overexpression can relieve ER stress induced by PA in MIN6
cells.
During oxidative stress, Bax and cytochrome c
are released from mitochondria into cytoplasm and activate caspase
9 to induce apoptosis, suggesting that Bax and cytochrome c
are mitochondria-associated apoptosis proteins (20). Downstream, ATP and MMP can be used
to reflect mitochondrial function. After PA intervention, Bax and
cytochrome c protein levels were significantly increased,
whilst ATP, MMP and Bcl-2 expression were significantly decreased.
Bax and cytochrome c expression were significantly increased
in the Sig-1R overexpression group (Fig. 4D), whereas ATP (Fig. 4B), MMP (Fig. 6) and Bcl-2 expression levels
(Fig. 4D) were significantly
decreased (P<0.05) compared with that in Lv-Ctrl cells following
the exposure of both cells to PA. Therefore, these results suggest
that Sig-1R overexpression alleviated PA-induced mitochondrial
dysfunction.
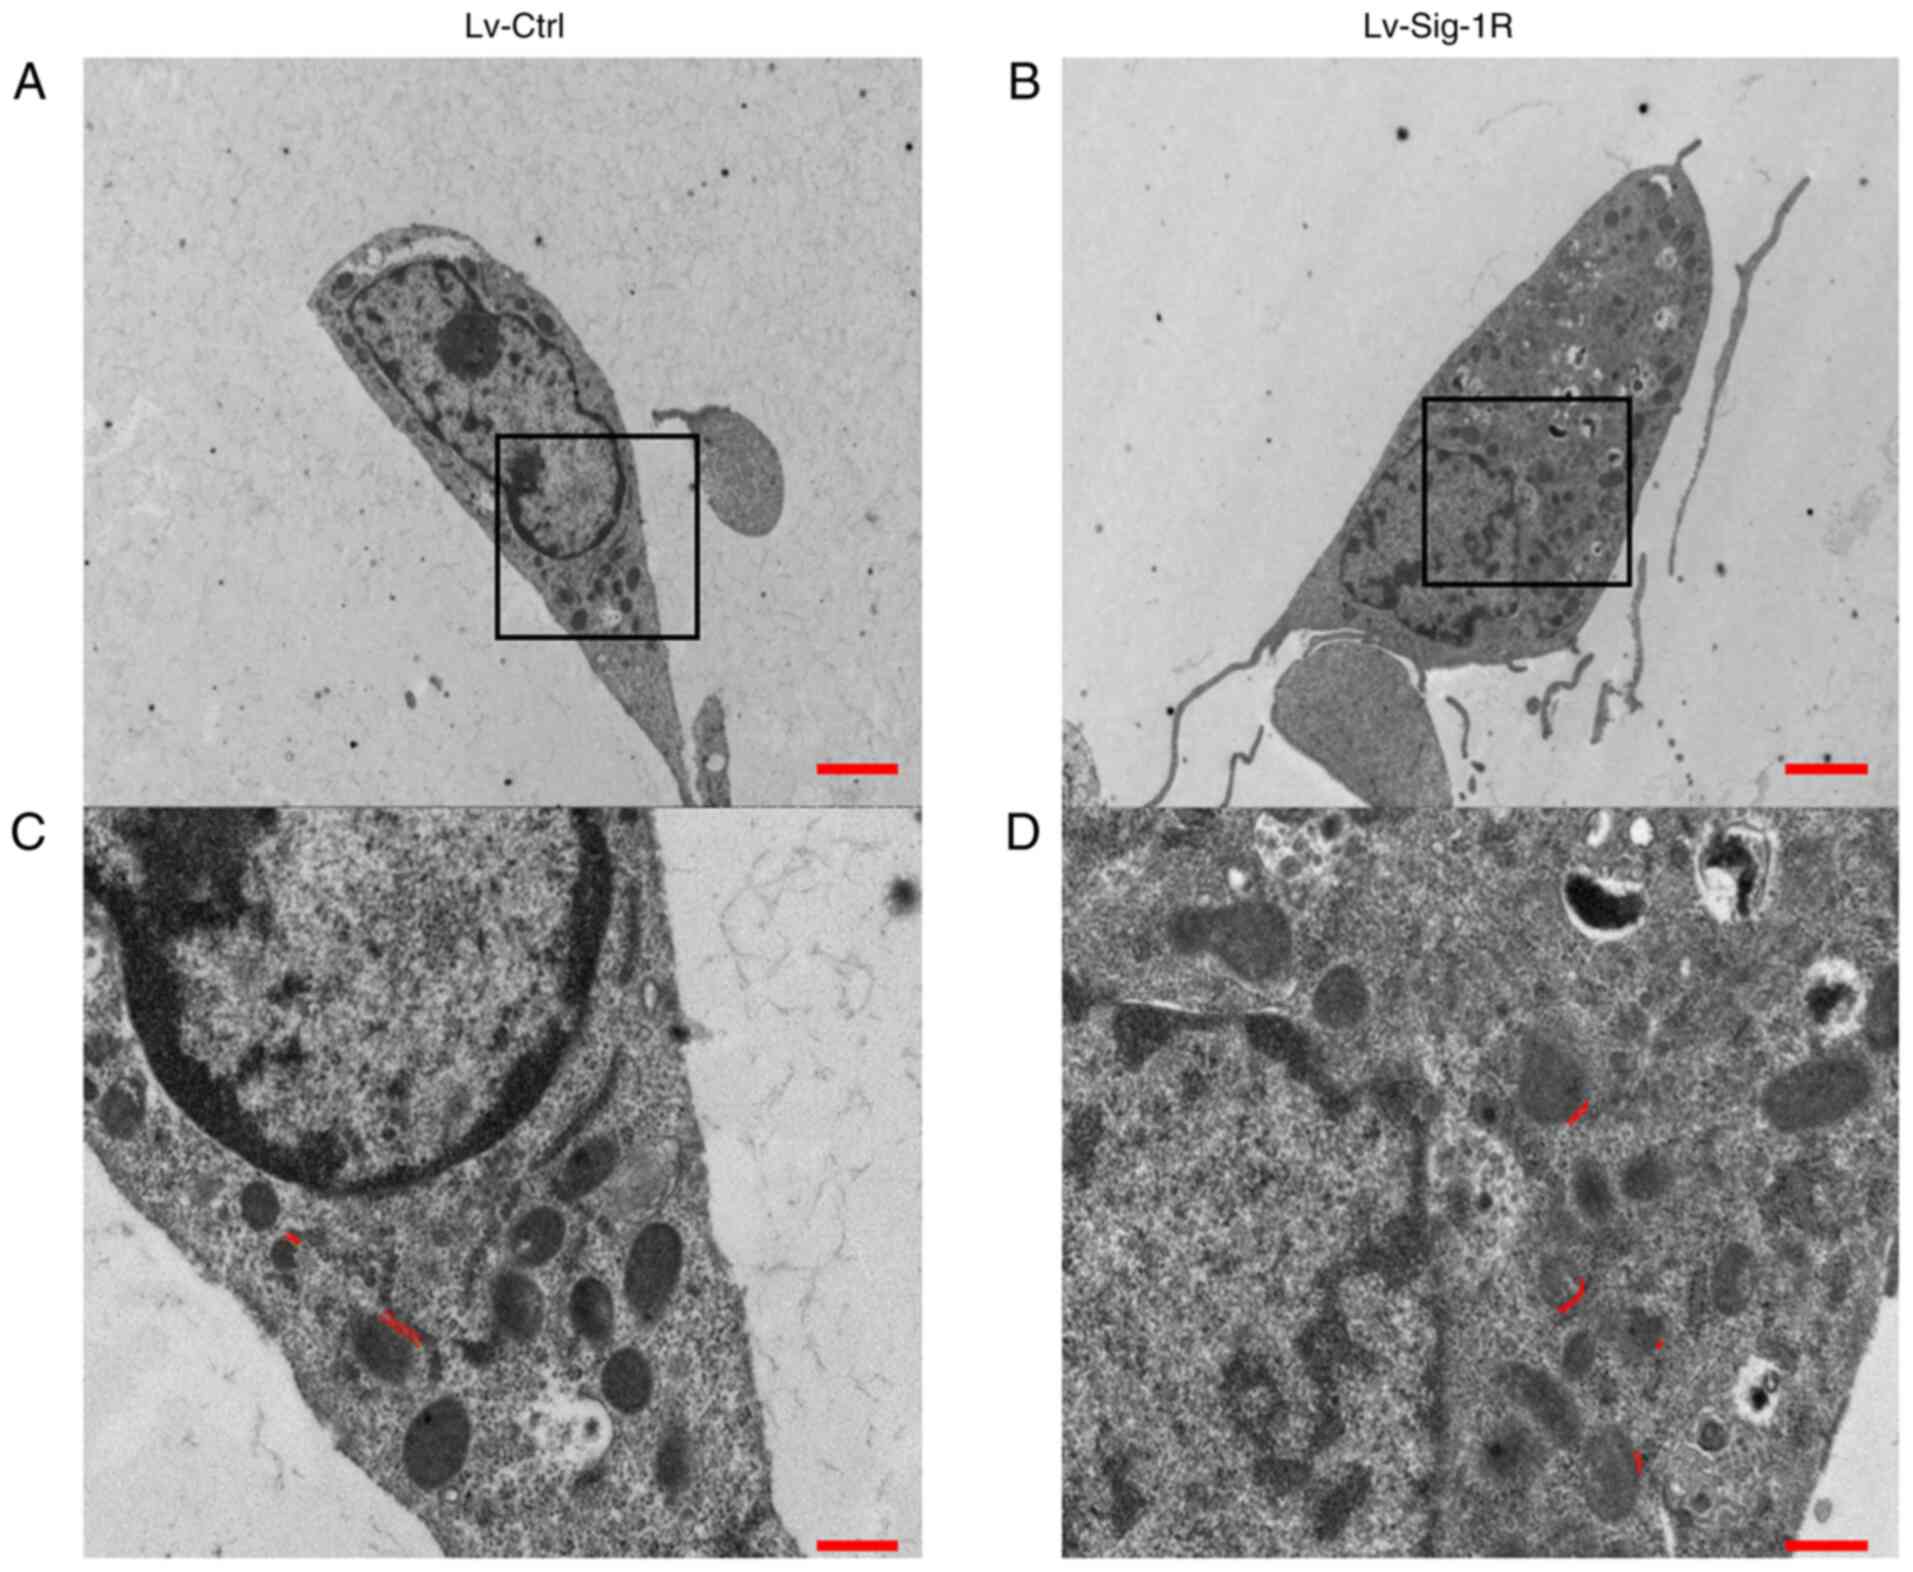
Sig-1R overexpression alters the
structure of mitochondria-associated membranes (MAM)
Mitochondrial and ER are important organelles within
nucleated eukaryotic cells that are key to intracellular cell
physiology. They are arranged in parallel, where various points of
physical coupling exists between the outer mitochondrial membrane
and the ER, which are called the MAM (21). The MAM contains a plethora of
functional proteins that regulate the transport of metabolites and
signaling molecules, such as Sig-1R (22). Therefore, it was hypothesized that
Sig-1R overexpression may alter the structure of MAM. The present
study next examined the structure of MAM using TEM. An increase in
the quantity of ER adjacent to mitochondria was observed in the
50-nm range according to TEM analysis in Lv-Sig-1R cells compared
with that in Lv-control cells (Fig.
7). Subsequently, immunofluorescence was used to detect the
effect of Sig-1R overexpression on the expression and localization
of key MAM proteins IP3R and VDACI. The expression level of
VDAC1was markedly increased in Sig-1R-overexpressing MIN6 cells
compared with that in Lv-control cells without PA. Although the
expression level of the two proteins decreased in the PA group,
VDAC1 expression remained to be higher in Sig-1R-overexpressing
MIN6 cells. On the other hand, Sig-1R overexpression had no
significant effect on IP3R protein expression with or without PA
compared with that in Lv-control cells (Fig. 8). These results suggested that
Sig-1R overexpression had an effect on the structure of MAM by
increasing the expression of VDAC1.
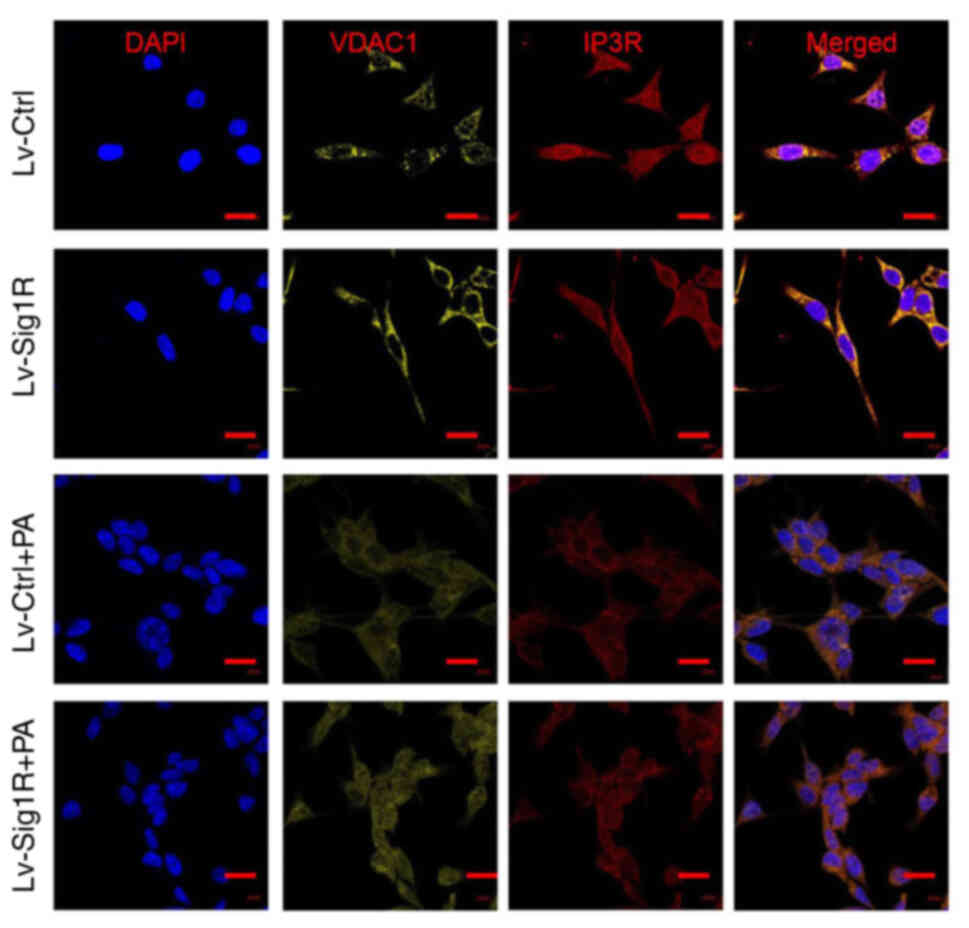 | Figure 8.Effect of Sig-1R overexpression on
the mitochondria-associated ER membrane junction morphology.
Representative immunofluorescence images of IP3R-VDACI on the
mitochondria-associated ER membrane in Lv-Sig-1R cells with Lv-Ctrl
cells, which was imaged using confocal microscopy. Scale bars, 10
µm. PA, palmitic acid; IP3R, inositol 1,4,5-triphosphate receptor;
VDAC, voltage-dependent anion channel 1; Sig-1R, Sigma-1 receptor;
Lv, lentiviral; Ctrl, control. |
Sig-1R overexpression increases
cytoplasmic calcium level
Fura 2/AM is a class of cytoplasmic calcium probe
that can be used to reflect cytoplasmic calcium levels. The present
study revealed that the cytoplasmic calcium level was significantly
increased in the PA group compared with that in the group not
treated with PA in both Lv-control and Lv-Sig-1R cells (Fig. 9). In addition, the cytoplasmic
calcium level was found to be significantly lower in
Sig-1R-overexpressing cells compared with that in control cells in
the absence of PA (Fig. 9).
Discussion
Sig-1R is a class of receptors that have unique
pharmacological effects and chaperone activity (23). In human lens cells, Sig-1R
receptor antagonists have been shown to inhibit cell proliferation
(9). In the present study, Sig-1R
overexpression was found to increase the proliferation rate of MIN6
cells. Cell cycle progression serves a key role in regulating cell
proliferation, where the transition from
G0/G1 to the S phase is a key step in this
process (24). To explore the
mechanism further, the cell cycle progression analysis of MIN6
cells in the present study revealed that Sig-1R overexpression this
process, specifically from the G1 to the S phase.
Therefore, it was hypothesized that Sig-1R can promote cell
proliferation by positively regulating the cell cycle.
Numerous studies have shown that exposure to PA can
decrease insulin secretion and induce apoptosis in β-cells
(25,26). Apoptosis and Glucose-stimulated
insulin secretion assays in the present study also showed that
exposure to PA increased apoptosis whilst decreasing insulin
secretion, which was consistent with these previous findings
(25,26). In addition, Sig-1R overexpression
was found to ameliorate apoptosis and restored the insulin
secretion previously impaired by PA in MIN6 cells. Sig-1R agonists
have been previously shown to alleviate cerebral
ischemia-reperfusion injury by reversing neuronal apoptosis and
improving neurological function (27). Amyotrophic lateral sclerosis is a
progressive neurological disorder (28). In this disease, brain neuronal
apoptosis was found to be inhibited after prolonged treatment with
Sig-1R agonists (28).
Altogether, these findings suggest that Sig-1R mediates protective
effects against cell damage, whereby increasing Sig-1R activity can
alleviate cell damage.
Therefore, the underlying mechanism was explored.
Oxidative and ER stress are associated with islet β-cell
dysfunction and participate in the development of T2DM (29). Results in the present study showed
that Sig-1R overexpression relieved PA-induced ER stress in MIN6
cells by decreasing the protein expression of the ER chaperone
GRP78 and the ER pro-apoptotic molecule CHOP. Previous studies also
reported that Sig-1R serves important roles in ER stress (11,30). Sig-1R upregulation was found to
alleviate neuronal damage caused by ER stress (11), whereas the activation of Sig1R
effectively inhibited the expression of GRP78 and CHOP to alleviate
apoptosis in mouse hippocampal cells (30). PDI promotes the formation of
correct disulfide bonds between and/or within proteins (31). During the early stages of ER
stress, PDI is activated to maintain stability by reducing the
aggregation of misfolded and unfolded proteins within ER (19). The present showed that PDI
expression was decreased in the Sig-1R-overexpressing MIN6 cells
compared with that in Lv-Ctrl cells after exposure to PA. Taken
together, these findings suggested that Sig-1R overexpression can
relieve MIN6 cell apoptosis under lipotoxic conditions through
ameliorating ER stress. Furthermore, the present study also
concluded that Sig-1R overexpression can alleviate PA-induced
mitochondrial dysfunction in MIN6 cells. Previous studies showed
that Sig1R agonists relieve oxidative stress (32) and promote ATP production (33). Tagashira et al (34) found that ligands that can activate
Sig-1R can protect cardiomyocytes by increasing IP3R-mediated
mitochondrial ATP production. Therefore, Sig-1R overexpression was
concluded to ameliorate apoptosis and restore insulin secretion
under lipotoxic conditions by relieving ER stress and mitochondrial
dysfunction in MIN6 cells.
Mitochondrial and ER are important organelles in
eukaryotic cells. Although the two organelles are normally in close
proximity to each other, their membranes do not fuse (35). Therefore, both can retain their
own unique structure and function (35). MAM is the site of physical
coupling between the mitochondrial outer membrane and ER, where
Sig-1R has been reported to be a chaperone protein (22). Sig-1R knockdown can lead to AD,
the mechanism of which may be associated with the loss of MAM
integrity (36). Therefore, it
was speculated in the present study that Sig-1R can regulate the
MAM structure in islet cells, thereby attenuating islet apoptosis
by regulating MAM structure by regulating ER stress and
mitochondrial function. An increase in the number of ER and
mitochondria contacts was observed in the 50-nm range by TEM
analysis in Lv-Sig-1R cells, suggesting that Sig-1R overexpression
serves an important role in promoting the formation of MAM.
IP3R is one of the calcium release channels in the
ER (37). When IP3R interacts
with VDAC1 on the outer mitochondrial membrane using the molecular
chaperone glucose regulatory protein 75 (GRP75) bridge, calcium
ions are released from the ER directly through IP3R without the
combination between IP3 and IP3R (38). The IP3R/GRP75/VDAC1 complex is a
multi-protein structure that is associated with the coupling of the
mitochondrial cytoplasmic network, where GRP75 knockdown can
prevent MAM formation and reduce mitochondrial calcium uptake
(39). Immunofluorescence results
from the present study showed that Sig-1R overexpression mainly
increased the expression levels of VDAC1. This suggests that Sig-1R
mediated a regulatory effect on the structure of MAM by increasing
the expression of VDAC1.
MAM enables the direct transport of ER calcium to
the mitochondria through the IP3R/GRP75/VDAC1 complexes (40). Sig-1R has been shown to control
calcium transport by regulating the formation of these complexes
(41). The present study showed
that the cytoplasmic calcium levels were decreased in
Sig-1R-overexpressing MIN6 cells compared with that in Lv-Ctrl
cells. This may have been because Sig-1R overexpression increased
direct calcium transport from the ER to the mitochondria by
increasing the number of mitochondria-ER coupling sites, which in
turn reduced calcium leakage into the cytosol. Therefore, it was
also speculated that Sig-1R overexpression ameliorated ER stress
and mitochondrial dysfunction in MIN6 cells by preserving calcium
transport between the mitochondria and ER.
To conclude, the present study revealed that Sig-1R
overexpression may exert protective effects on β-cells under
lipotoxic condition. This could be because Sig-1R overexpression
not only promoted cell proliferation but also relieved ER stress
and mitochondrial dysfunction. However, several limitations remain.
Only one cell line was used. It should be verified further in
primary β-cells or in β-cells in vivo. The specific
mechanism of how Sig-1R regulates cell apoptosis require further
investigation, such that cleaved caspase 3 expression levels should
be tested.
Acknowledgements
Not applicable.
Funding
The present study was supported by the National Natural Science
Foundation of China (grant no. 81970718).
Availability of data and materials
The datasets used and/or analyzed during the current
study are available from the corresponding author on reasonable
request.
Authors' contributions
MK, YX and JL contributed to conception and design
of the study. MK and FL performed the experiments and data
collection. HW, GH, JF and LS contributed to analysis and
interpretation of data. YX and JL revised the manuscript for
important intellectual content. MK and FL confirm the authenticity
of all the raw data. All authors have read and approved the final
manuscript.
Ethics approval and consent to
participate
Not applicable.
Patient consent for publication
Not applicable.
Competing interests
The authors declare that they have no competing
interests.
References
|
1
|
Saeedi P, Petersohn I, Salpea P, Malanda
B, Karuranga S, Unwin N, Colagiuri S, Guariguata L, Motala AA,
Ogurtsova K, et al: Global and regional diabetes prevalence
estimates for 2019 and projections for 2030 and 2045: Results from
the international diabetes federation diabetes Atlas. (9th
edition). Diabetes Res Clin Pract. 157:1078432019. View Article : Google Scholar : PubMed/NCBI
|
|
2
|
International Diabetes Federation: IDF
Diabetes Atlas (9th edition). 2019.
|
|
3
|
Butler AE, Janson J, Bonner-Weir S, Ritzel
R, Rizza RA and Butler PC: Beta-cell deficit and increased
beta-cell apoptosis in humans with type 2 diabetes. Diabetes.
52:102–110. 2003. View Article : Google Scholar : PubMed/NCBI
|
|
4
|
Ramachandran S, Lu H, Prabhu U and Ruoho
AE: Purification and characterization of the guinea pig sigma-1
receptor functionally expressed in Escherichia coli. Protein Expr
Purif. 51:283–292. 2007. View Article : Google Scholar : PubMed/NCBI
|
|
5
|
Hanner M, Moebius FF, Flandorfer A, Knaus
HG, Striessnig J, Kempner E and Glossmann H: Purification,
molecular cloning, and expression of the mammalian sigma1-binding
site. Proc Natl Acad Sci USA. 93:8072–8077. 1996. View Article : Google Scholar : PubMed/NCBI
|
|
6
|
Penke B, Fulop L, Szucs M and Frecska E:
The role of sigma-1 receptor, an intracellular chaperone in
neurodegenerative diseases. Curr Neuropharmacol. 16:97–116.
2018.PubMed/NCBI
|
|
7
|
Maurice T, Strehaiano M, Duhr F and
Chevallier N: Amyloid toxicity is enhanced after pharmacological or
genetic invalidation of the σ1 receptor. Behav Brain
Res. 339:1–10. 2018. View Article : Google Scholar : PubMed/NCBI
|
|
8
|
Jia H, Zhang Y and Huang Y: Imaging sigma
receptors in the brain: New opportunities for diagnosis of
Alzheimer's disease and therapeutic development. Neurosci Lett.
691:3–10. 2019. View Article : Google Scholar : PubMed/NCBI
|
|
9
|
Wang L, Prescott AR, Spruce BA, Sanderson
J and Duncan G: Sigma receptor antagonists inhibit human lens cell
growth and induce pigmentation. Invest Ophthalmol Vis Sci.
46:1403–1408. 2005. View Article : Google Scholar : PubMed/NCBI
|
|
10
|
Bucolo C, Drago F, Lin LR and Reddy VN:
Sigma receptor ligands protect human retinal cells against
oxidative stress. Neuroreport. 17:287–291. 2006. View Article : Google Scholar : PubMed/NCBI
|
|
11
|
Morihara R, Yamashita T, Liu X, Nakano Y,
Fukui Y, Sato K, Ohta Y, Hishikawa N, Shang J and Abe K: Protective
effect of a novel sigma-1 receptor agonist is associated with
reduced endoplasmic reticulum stress in stroke male mice. J
Neurosci Res. 96:1707–1716. 2018. View Article : Google Scholar : PubMed/NCBI
|
|
12
|
Omi T, Tanimukai H, Kanayama D, Sakagami
Y, Tagami S, Okochi M, Morihara T, Sato M, Yanagida K, Kitasyoji A,
et al: Fluvoxamine alleviates ER stress via induction of Sigma-1
receptor. Cell Death Dis. 5:e13322014. View Article : Google Scholar : PubMed/NCBI
|
|
13
|
Demirtas L, Guclu A, Erdur FM, Akbas EM,
Ozcicek A, Onk D and Turkmen K: Apoptosis, autophagy &
endoplasmic reticulum stress in diabetes mellitus. Indian J Med
Res. 144:515–524. 2016.PubMed/NCBI
|
|
14
|
Eizirik DL, Pasquali L and Cnop M:
Pancreatic β-cells in type 1 and type 2 diabetes mellitus:
different pathways to failure. Nat Rev Endocrinol. 16:349–362.
2020. View Article : Google Scholar : PubMed/NCBI
|
|
15
|
Livak KJ and Schmittgen TD: Analysis of
relative gene expression data using real-time quantitative PCR and
the 2(−Delta Delta C(T)) method. Methods. 25:402–408. 2001.
View Article : Google Scholar : PubMed/NCBI
|
|
16
|
Shi X, Deng H, Dai Z, Xu Y, Xiong X, Ma P
and Cheng J: Nr2e1 deficiency augments palmitate-induced oxidative
stress in beta cells. Oxid Med Cell Longev. 2016:96487692016.
View Article : Google Scholar : PubMed/NCBI
|
|
17
|
Dingreville F, Panthu B, Thivolet C,
Ducreux S, Gouriou Y, Pesenti S, Chauvin MA, Chikh K,
Errazuriz-Cerda E, Van Coppenolle F, et al: Differential effect of
glucose on ER-Mitochondria Ca2+ exchange participates in
insulin secretion and glucotoxicity-mediated dysfunction of
β-cells. Diabetes. 68:1778–1794. 2019. View Article : Google Scholar : PubMed/NCBI
|
|
18
|
Hetz C and Papa FR: The unfolded protein
response and cell fate control. Mol Cell. 69:169–181. 2018.
View Article : Google Scholar : PubMed/NCBI
|
|
19
|
Baehr LM, West DW, Marcotte G, Marshall
AG, De Sousa LG, Baar K and Bodine SC: Age-related deficits in
skeletal muscle recovery following disuse are associated with
neuromuscular junction instability and ER stress, not impaired
protein synthesis. Aging (Albany NY). 8:127–146. 2016. View Article : Google Scholar : PubMed/NCBI
|
|
20
|
Bâ A: Alcohol and thiamine deficiency
trigger differential mitochondrial transition pore opening
mediating cellular death. Apoptosis. 22:741–752. 2017. View Article : Google Scholar : PubMed/NCBI
|
|
21
|
Filadi R, Theurey P and Pizzo P: The
endoplasmic reticulum-mitochondria coupling in health and disease:
Molecules, functions and significance. Cell Calcium. 62:1–15. 2017.
View Article : Google Scholar : PubMed/NCBI
|
|
22
|
Sasi USS, Ganapathy S, Palayyan SR and
Gopal RK: Mitochondria associated membranes (MAMs): Emerging drug
targets for diabetes. Curr Med Chem. 27:3362–3385. 2020. View Article : Google Scholar : PubMed/NCBI
|
|
23
|
Kim FJ: Introduction to Sigma proteins:
Evolution of the concept of Sigma receptors. Handb Exp Pharmacol.
244:1–11. 2017. View Article : Google Scholar : PubMed/NCBI
|
|
24
|
Alenzi FQ: Links between apoptosis,
proliferation and the cell cycle. Br J Biomed Sci. 61:99–102. 2004.
View Article : Google Scholar : PubMed/NCBI
|
|
25
|
Ojo OO, Srinivasan DK, Owolabi BO, Conlon
JM, Flatt PR and Abdel-Wahab YH: Magainin-AM2 improves glucose
homeostasis and beta cell function in high-fat fed mice. Biochim
Biophys Acta. 1850:80–87. 2015. View Article : Google Scholar : PubMed/NCBI
|
|
26
|
Cnop M, Abdulkarim B, Bottu G, Cunha DA,
Igoillo-Esteve M, Masini M, Turatsinze JV, Griebel T, Villate O,
Santin I, et al: RNA sequencing identifies dysregulation of the
human pancreatic islet transcriptome by the saturated fatty acid
palmitate. Diabetes. 63:1978–1993. 2014. View Article : Google Scholar : PubMed/NCBI
|
|
27
|
Zhai M, Liu C, Li Y, Zhang P, Yu Z, Zhu H,
Zhang L, Zhang Q and Wang J and Wang J: Dexmedetomidine inhibits
neuronal apoptosis by inducing Sigma-1 receptor signaling in
cerebral ischemia-reperfusion injury. Aging (Albany NY).
11:9556–9568. 2019. View Article : Google Scholar : PubMed/NCBI
|
|
28
|
Shinoda Y, Haga Y, Akagawa K and Fukunaga
K: Wildtype σ1 receptor and the receptor agonist improve
ALS-associated mutation-induced insolubility and toxicity. J Biol
Chem. 295:17573–17587. 2020. View Article : Google Scholar : PubMed/NCBI
|
|
29
|
Rutter GA and Pinton P:
Mitochondria-associated endoplasmic reticulum membranes in insulin
signaling. Diabetes. 63:3163–3165. 2014. View Article : Google Scholar : PubMed/NCBI
|
|
30
|
Ono Y, Tanaka H, Tsuruma K, Shimazawa M
and Hara H: A sigma-1 receptor antagonist (NE-100) prevents
tunicamycin-induced cell death via GRP78 induction in hippocampal
cells. Biochem Biophys Res Commun. 434:904–909. 2013. View Article : Google Scholar : PubMed/NCBI
|
|
31
|
Zhong S, Ye W, Lin SH, Liu JY, Leong J, Ma
C and Lin YC: Zeranol induces cell proliferation and protein
disulfide isomerase expression in mammary gland of ACI rat.
Anticancer Res. 31:1659–1665. 2011.PubMed/NCBI
|
|
32
|
Smith SB, Wang J, Cui X, Mysona BA, Zhao J
and Bollinger KE: Sigma 1 receptor: A novel therapeutic target in
retinal disease. Prog Retin Eye Res. 67:130–149. 2018. View Article : Google Scholar : PubMed/NCBI
|
|
33
|
Shioda N, Ishikawa K, Tagashira H,
Ishizuka T, Yawo H and Fukunaga K: Expression of a truncated form
of the endoplasmic reticulum chaperone protein, σ1 receptor,
promotes mitochondrial energy depletion and apoptosis. J Biol Chem.
287:23318–23331. 2012. View Article : Google Scholar : PubMed/NCBI
|
|
34
|
Tagashira H, Bhuiyan MS and Fukunaga K:
Diverse regulation of IP3 and ryanodine receptors by pentazocine
through σ1-receptor in cardiomyocytes. Am J Physiol Heart Circ
Physiol. 305:H1201–H1212. 2013. View Article : Google Scholar : PubMed/NCBI
|
|
35
|
Marchi S, Patergnani S and Pinton P: The
endoplasmic reticulum-mitochondria connection: one touch, multiple
functions. Biochim Biophys Acta. 1837:461–469. 2014. View Article : Google Scholar : PubMed/NCBI
|
|
36
|
Hedskog L, Pinho CM, Filadi R, Rönnbäck A,
Hertwig L, Wiehager B, Larssen P, Gellhaar S, Sandebring A,
Westerlund M, et al: Modulation of the endoplasmic
reticulum-mitochondria interface in Alzheimer's disease and related
models. Proc Natl Acad Sci USA. 110:7916–7921. 2013. View Article : Google Scholar : PubMed/NCBI
|
|
37
|
Rückl M, Parker I, Marchant JS, Nagaiah C,
Johenning FW and Rüdiger S: Modulation of elementary calcium
release mediates a transition from puffs to waves in an IP3R
cluster model. PLoS Comput Biol. 11:e10039652015. View Article : Google Scholar : PubMed/NCBI
|
|
38
|
Janikiewicz J, Szymański J, Malinska D,
Patalas-Krawczyk P, Michalska B, Duszyński J, Giorgi C, Bonora M,
Dobrzyn A and Wieckowski MR: Mitochondria-associated membranes in
aging and senescence: structure, function, and dynamics. Cell Death
Dis. 9:3322018. View Article : Google Scholar : PubMed/NCBI
|
|
39
|
Kerkhofs M, Bultynck G, Vervliet T and
Monaco G: Therapeutic implications of novel peptides targeting
ER-mitochondria Ca2+-flux systems. Drug Discov Today.
24:1092–1103. 2019. View Article : Google Scholar : PubMed/NCBI
|
|
40
|
Bravo R, Vicencio JM, Parra V, Troncoso R,
Munoz JP, Bui M, Quiroga C, Rodriguez AE, Verdejo HE, Ferreira J,
et al: Increased ER-mitochondrial coupling promotes mitochondrial
respiration and bioenergetics during early phases of ER stress. J
Cell Sci. 124:2143–2152. 2011. View Article : Google Scholar : PubMed/NCBI
|
|
41
|
Hayashi T: The Sigma-1 receptor in
cellular stress signaling. Front Neurosci. 13:7332019. View Article : Google Scholar : PubMed/NCBI
|