Introduction
EWS is a highly aggressive bone- or soft
tissue-associated tumor of childhood and young adults (1). Though advances in the treatment of
EWS have improved quality of life, the prognosis is still poor for
early metastases and relapse (2).
Therefore, it is urgently necessary to find the mechanism and
relevant therapeutic targets of EWS.
Aerobic glycolysis is a well-recognized hallmark of
malignant tumors (3), making it
an attractive therapeutic target to inhibit tumor growth, including
Ewing sarcoma (4). To meet high
demands for growth, cancer cells exhibit a unique metabolic
preference for catabolizing glucose to lactate even under aerobic
conditions, a phenomenon described as Warburg effect or aerobic
glycolysis (3). It has been
proposed that transcription factors serve a crucial role in
regulating aerobic glycolysis. For instance, acting as a principal
regulator of glycolysis, hypoxia-inducible factor 1α (HIF-1α)
contributes to aerobic glycolysis by the induction of the glucose
transporters GLUT1 expression, thus enhancing cancer progression
(5). Thus, identifying key
regulators that regulate aerobic glycolysis could offer a novel
direction for EWS treatment.
The present study, for the first time to the best of
the authors' knowledge, identified transcription factor E2F1 as a
pivotal regulator for aerobic glycolysis in EWS. Highly expressed
E2F1 in EWS predicted a poor prognosis. Moreover, the
results revealed that E2F1 facilitates Warburg effect and
cancer progression by modulating the expression of enolase 2
(ENO2). Taken together, a new role of E2F1 in EWS was
unearthed, which provide a promising therapeutic strategy for
EWS.
Materials and methods
Access and analysis of public
data
The Ewing sarcoma microarray datasets GSE17679 and
corresponding clinical information were downloaded from Gene
Expression Omnibus (GEO) database (https://www.ncbi.nlm.nih.gov/geo/). In addition,
glycolysis genes were retrieved from the Kyoto Encyclopedia of
Genes and Genomes (https://www.kegg.jp; Table SI) and human transcription factor
were downloaded from a public database (http://humantfs.ccbr.utoronto.ca; Table SII). Data processing and quantile
normalization were performed using R, a programming language and
software environment for statistical computing (6). Differential expression analyses in
different tumor tissues characterized by clinical characteristics
were performed by the limma package (http://www.bioconductor.org/packages/release/bioc/html/limma.html/).
Genes with |log2FoldChange|>1 and P<0.05 were identified as
statistically significant. Then, overlapping analysis was performed
to identify genes consistently associated with clinical
characteristics of tumors, while their expression correlation and
survival significance were also analyzed.
Cell culture
Human EWS cell lines RDES (HTB-166) and SK-ES-1
(HTB-86) were obtained from ATCC. Cells were cultured in RPMI
medium (R8758; MilliporeSigma) containing 10% fetal bovine serum
(F8318; MilliporeSigma), 100 U/ml penicillin, 100 µg/ml
streptomycin (V900929; MilliporeSigma) at 37°C in a humidified
atmosphere containing 5% CO2.
Plasmid transfections
EWS cells were cultured in six-well plates until
cells reached ≥70% confluence. Overexpression vector pCMV-HA-E2F1
or pDONR233-ENO2 and corresponding empty vector pCMV-HA or
pDONR233, and shRNAs against E2F1 or ENO2 and corresponding empty
vector lentiviral vector GV298 were transiently transfected using a
Neofect DNA transfection reagent kit (cat. no. TF201201; Neofect
Biotech Co., Ltd.). Briefly, 2 µg of plasmid DNA was diluted with
100 µl of serum-free medium mixed with 100 µl of serum-free medium
containing 2 µl Neofect DNA transfection reagent (1 µg DNA:1 µl
Neofect), which were incubated for 30 min at room temperature. Then
the 200 µl plasmid /transfection reagent complex was added to the
well, which were further incubated for 24–48 h at 37°C in a 5%
CO2 incubator, after which they were used for
experiments. The knockout or overexpression efficiency was examined
using a PCR-based method.
Glucose uptake, lactate and ATP
assay
The present study employed a Glucose Uptake Assay
kit and Lactate Assay kit (BioVision, Inc.) to determine glucose
uptake level and lactic acid production, respectively. Briefly, the
cells were seeded in a 96-well plate and incubated at indicated
time and then the cell culture medium and cell supernatant were
collected to determine glucose uptake and lactic acid production.
Additionally, a ATP Colorimetric Assay kit was used to measure ATP
production (BioVision, Inc.). All experiments are performed
according to the manufacturer's protocol.
MTT assays
Cell proliferation was determined using MTT assays.
Human EWS cell lines RDES or SK-ES-1 cells were seeded in a 96-well
plate with 1×10⁵/well in 100 µl RPMI, allowed to grow
for the indicated times at 37°C in a 5% CO2 incubator.
Thereafter, MTT solution (final concentration, 5 mg/ml) was added
to the wells and the cells were incubated for 4 h at 37°C in a 5%
CO2 incubator. Then, removed the medium and 100 µl
dimethylsulfoxide (DMSO) was added to dissolve formazan crystals
with agitated cell culture plate for 5 min at room temperature. The
absorbance was recorded on a microplate reader Elx800 (Bio-Tek,
Winooski, Vermont, USA) at 570 nm.
Matrigel invasion assay
Cell invasion assay was performed using membranes
with precoated Matrigel at 37°C for 30 min (200 µg/ml; BD
Biosciences). Briefly, 1×10⁵ cells/well were added to
the upper chambers and 500 µl medium containing 10% FBS was added
to the bottom chamber. Following incubation at 37°C and 5%
CO2 for 24 h, invaded cells were stained with 1% crystal
violet for 15 min at room temperature. Subsequently, the invasive
cells were examined and counted using a light microscope
(magnification, ×200) in five random microscopic fields.
Gene overexpression and knockdown
Human genes E2F1 (Gene ID: 1869)
overexpression vector with pCMV-HA was purchased from Addgene (cat.
no. 24225) and ENO2 (Gene ID: 2026) overexpression vector
with pDONR233 was purchased from AtaGenix (cat. no. AtBC002745).
Oligonucleotides specific for short hairpin (sh)RNAs against
E2F1 and ENO2 were designed and purchased from
Genechem Co., Ltd. with lentiviral vector GV298. The nucleotide
sequences were as follows: E2F1 (sh-E2F1 #1: TCTGCCACCATAGTCTCGAGA,
sh-E2F1 #2: CTCGAGCAAAGTCACAGTCGA), ENO2 (sh-ENO2 #1,
CAAGGGAGTCATCAAGGACAA, sh-ENO2 #2 CGCCTGGCTAATAAGGCTTTA). The
negative control was sh-Sch: AACGGACTCGAGTCCGTTTAC.
Reverse transcription-quantitative
(RT-q) PCR
Total RNA (1×10⁶ cells/well in a 6-well
plate) was isolated with RNeasy Mini kit (Takara Bio, Inc.)
according to the manufacturer's protocols and RNA absorbance
measured by an ultra-micro spectrophotometer at 260 nm (Thermo
Fisher Scientific, Inc.). The obtained RNA (~2.0 µg) was used to
conduct reverse transcription reactions with Transcriptor First
Strand cDNA Synthesis kit (Takara Bio, Inc.) at 37°C for 1 h based
on the manufacturer's protocols. RT-qPCR with luminariscolor
hiGreen qPCR master mix (Fermentas; Thermo Fisher Scientific, Inc.)
was conducted using ABI Prism 7700 Sequence Detector (Applied
Biosystems; Thermo Fisher Scientific, Inc.). The following
thermocycling conditions were used for the qPCR: 50°C for 2 min and
95°C for 10 min; 36 cycles of 95°C for 10 sec and 60°C for 60 sec.
The primer sequences were synthesized by TSINGKE Biotech Co., Ltd.
Each 20-µl PCR reaction components contained 10 µl hiGreen qPCR
Mix, 3 µl cDNA, 0.6 µl Forward Primer (10 µM) and 0.6 µl Reverse
Primer (10 µM) and finally by adding nuclease-free H2O
to 20 µl. This experiment was repeated three times. The transcript
levels were normalized to β-actin and analyzed by 2−ΔΔCq
method (7). The following primer
sets were used: for human E2F1: 5′-CGCTATGAGACCTCACTGAAT-3′
(forward) and 5′-CACTGGATGTGGTTCTTGGAC-3′ (reverse); ENO2:
5′-AGGTGCAGAGGTCTACCATAC-3′ (forward) and
5′-AGCTCCAAGGCTTCACTGTTC-3′ (reverse); PFKM:
5′-AGCTGCCTACAACCTGGTGA-3′ (forward) and
5′-TCCACTCAGAACGGAAGGTGT-3′ (reverse); TPI1:
5′-AGTGACTAATGGGGCTTTTACTG-3′ (forward) and
5′-GCCCAATCAGCTCATCTGACTC-3′ (reverse); β-actin:
5′-CATGTACGTTGCTATCCAGGC-3′ (forward) and
5′-CTCCTTAATGTCACGCACGAT-3′ (reverse).
Western blot analysis
Cellular protein was extracted using 1X cell lysis
buffer (Promega Corporation) and the cellular protein concentration
was measured by bicinchoninic acid protein assay kit (Promega
Corporation). The obtained proteins (~30 µg) were separated by
electrophoresis with 4 to 20% precast polyacrylamide gel
(Invitrogen; Thermo Fisher Scientific, Inc.) and transferred onto a
polyvinylidene fluoride membrane. Then the membrane was blocked
with PBS containing 5% non-fat milk at room temperature for 1 h.
Subsequently, the membranes were incubated with primary antibodies
against rabbit anti-human antibodies against E2F1 (1:1,000; cat.
no. A19579, ABclonal), rabbit anti-human antibodies against ENO2
(1:1,000; A3118, ABclonal), rabbit anti-human antibodies against
PFKM (1:1,000; cat. no. A5477, ABclonal), rabbit anti-human
antibodies against TPI1 (1:1,000; cat. no. A2579, ABclonal), or
rabbit anti-human antibodies against β-actin (1:50,000; cat. no.
AC026, ABclonal) at 4°C overnight. After washing with TBS
containing 0.1% Tween-20 (TBST), the membranes were incubated with
horseradish peroxidase-conjugated goat Anti-Rabbit IgG secondary
antibodies at room temperature for 1 h (1:5,000, cat. no. AS014,
ABclonal). Enhanced chemiluminescence substrate kit (Thermo Fisher
Scientific, Inc.) was used for the chemiluminescent detection of
signals with autoradiography film (Cytiva). Protein expression was
quantified by densitometry using the Image-Pro Plus 6.0 imaging
software (Media Cybernetics, Inc.) with β-actin as the loading
control.
Statistical analysis
Statistical analyses used are detailed in the figure
legends. A two-tailed unpaired t-test was used to compare data
between two independent groups. One-way ANOVA with Bonferroni's
multiple comparison post hoc test was used to compare mean
differences between data with multiple groups. For survival
analyses, cutoff of gene expression was defined by average values,
survival curves were analyzed by log-rank (Mantel-Cox) analysis.
Pearson correlation analysis and all the other statistics were
performed in GraphPad Prism 9 (GraphPad Software). Data are
presented as mean ± standard error of the mean (SEM). P<0.05 was
considered to indicate a statistically significant difference.
Results
E2F1 involvement in aerobic glycolysis
in EWS
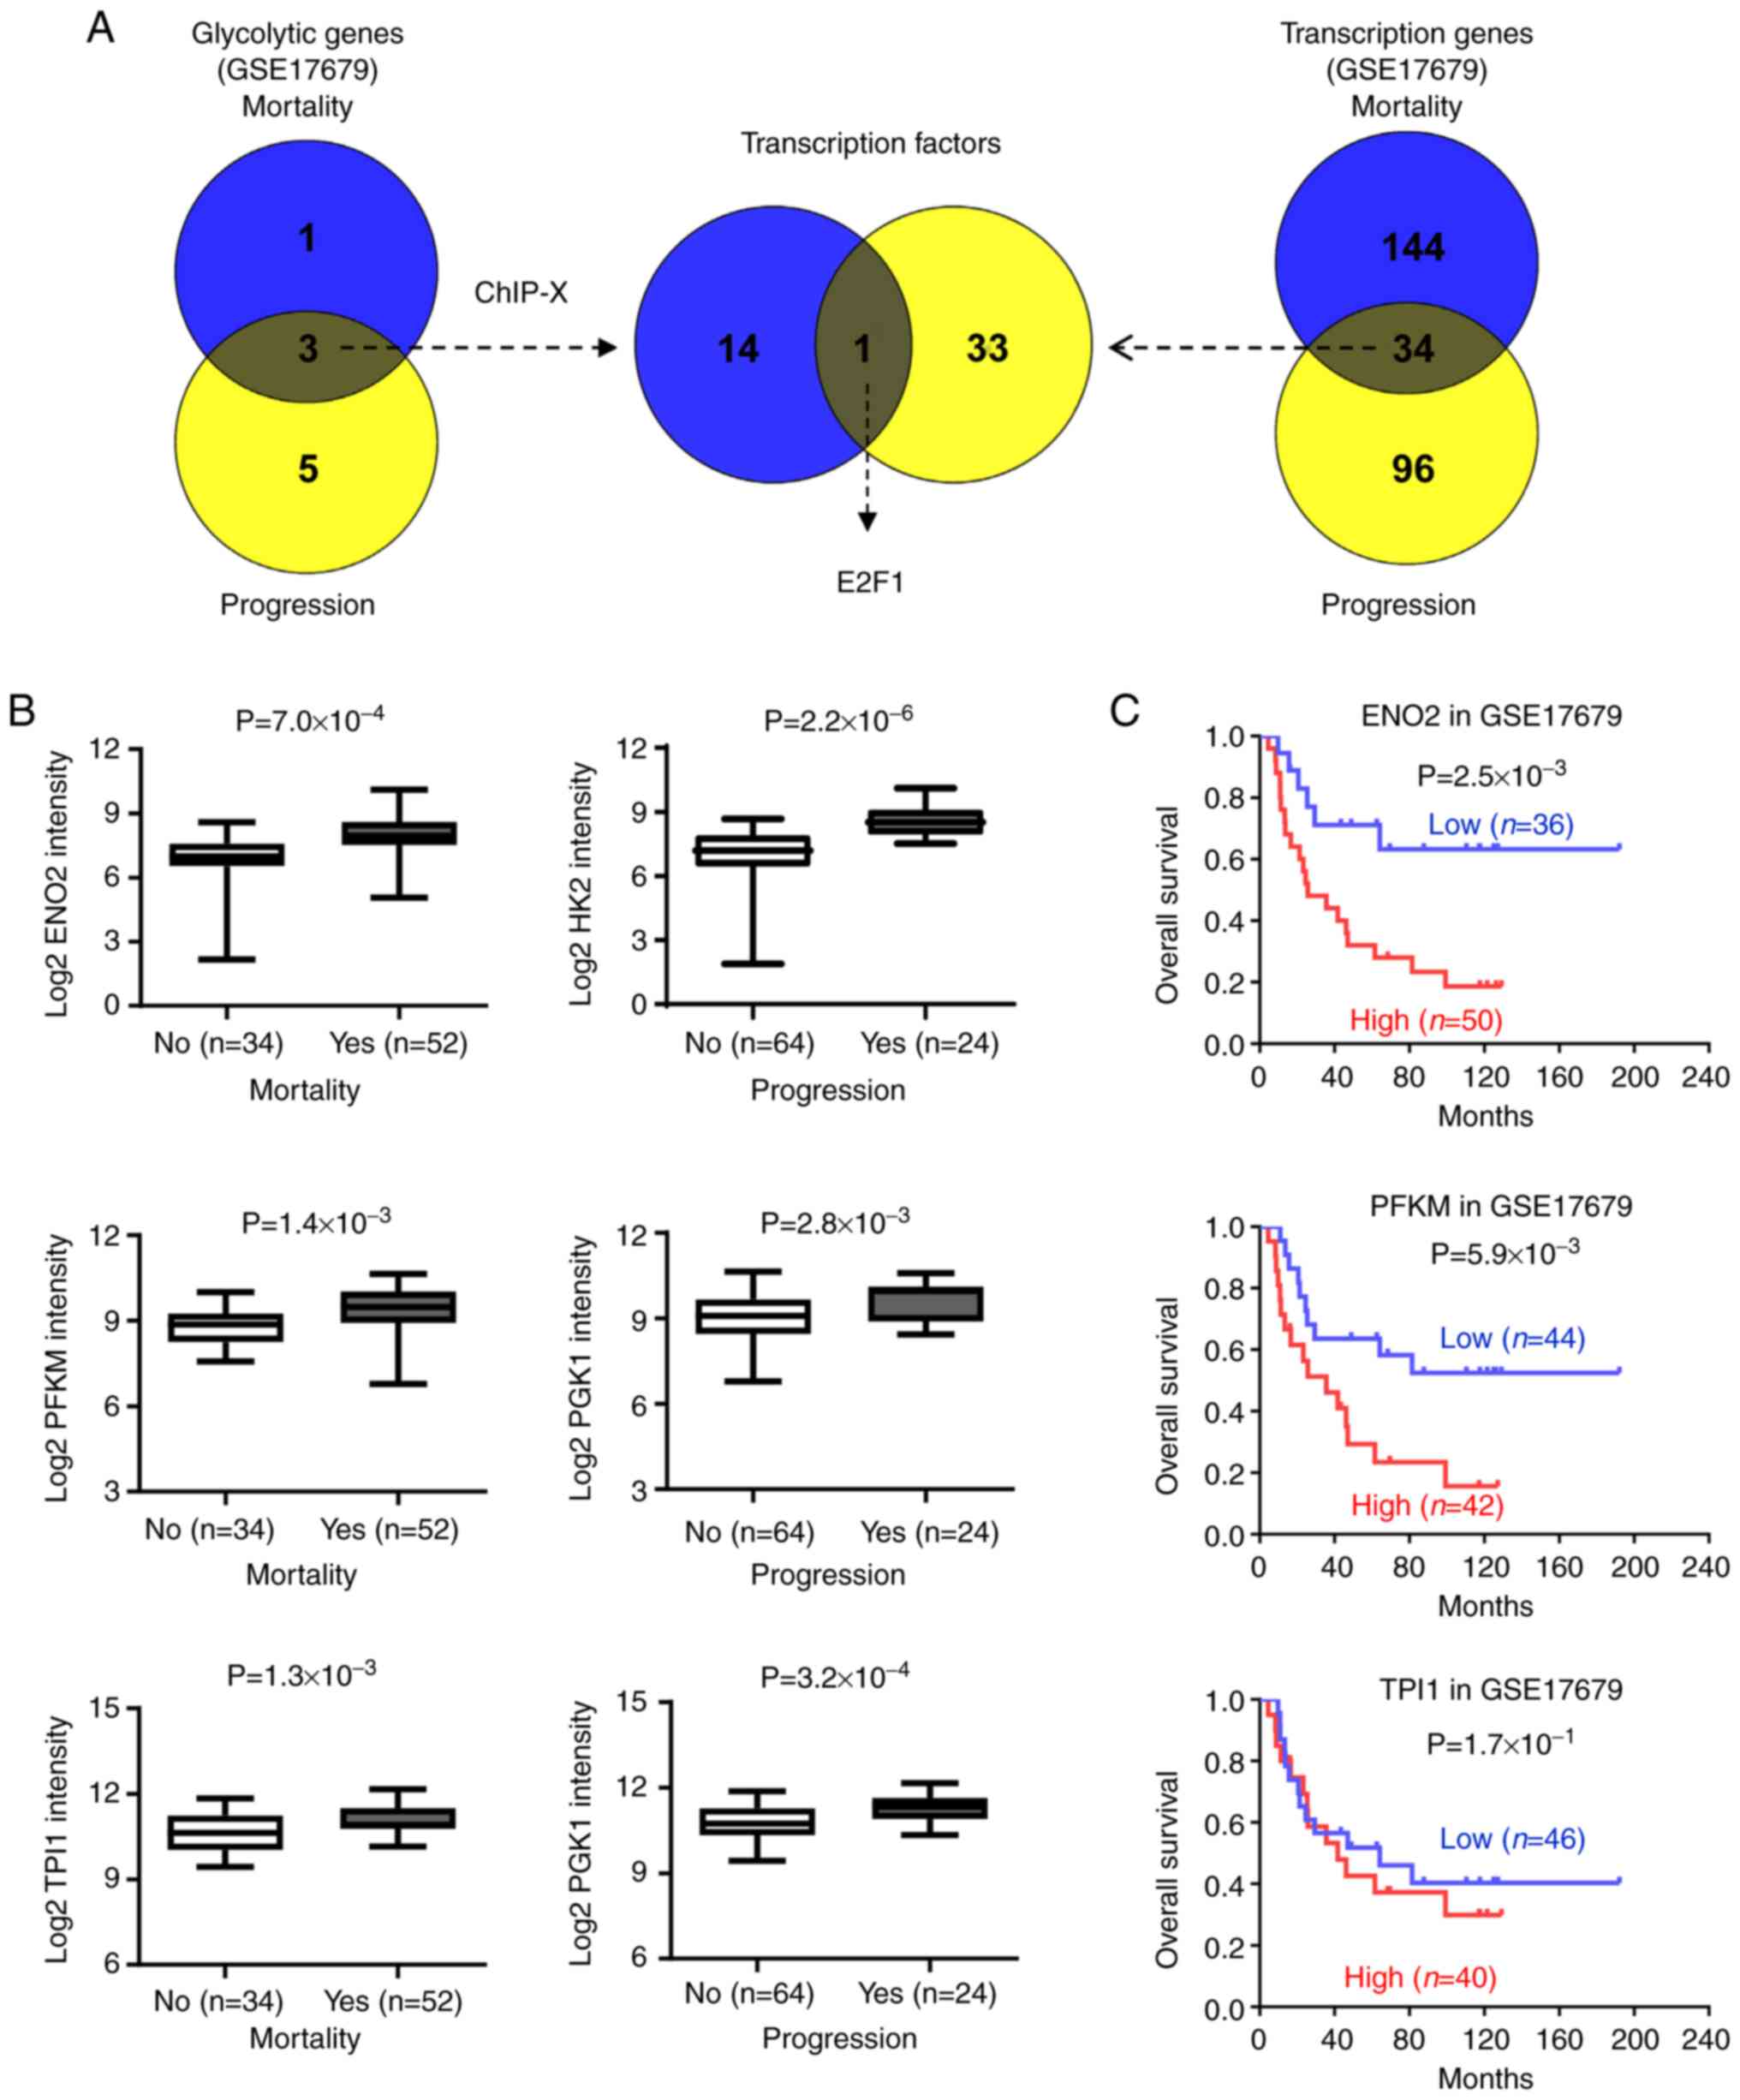
To identify key regulators of aerobic glycolysis in
EWS, the present study performed a bioinformatics analysis base on
a public EWS dataset (GSE17679) and identified one and eight
glycolytic genes (P<0.05) were correlated with varied status of
mortality and progression (Fig.
1A). Based on the above data, three glycolytic genes (ENO2,
PFKM and TPI1) were found to be related with the status
of mortality and progression (Fig.
1A and Table SIII). Further,
15 potentially transcription factors were found regulating these
three glycolytic genes analyzed by ChIP-X (8). In addition, 34 transcription factors
were consistently associated with the status of mortality and
progression in EWS dataset (Fig.
1A), which were further overlapping analysis with previous
result (Fig. 1A and Table SIII). Clearly, E2F1 as the only
transcription factor potential associated with aerobic glycolysis
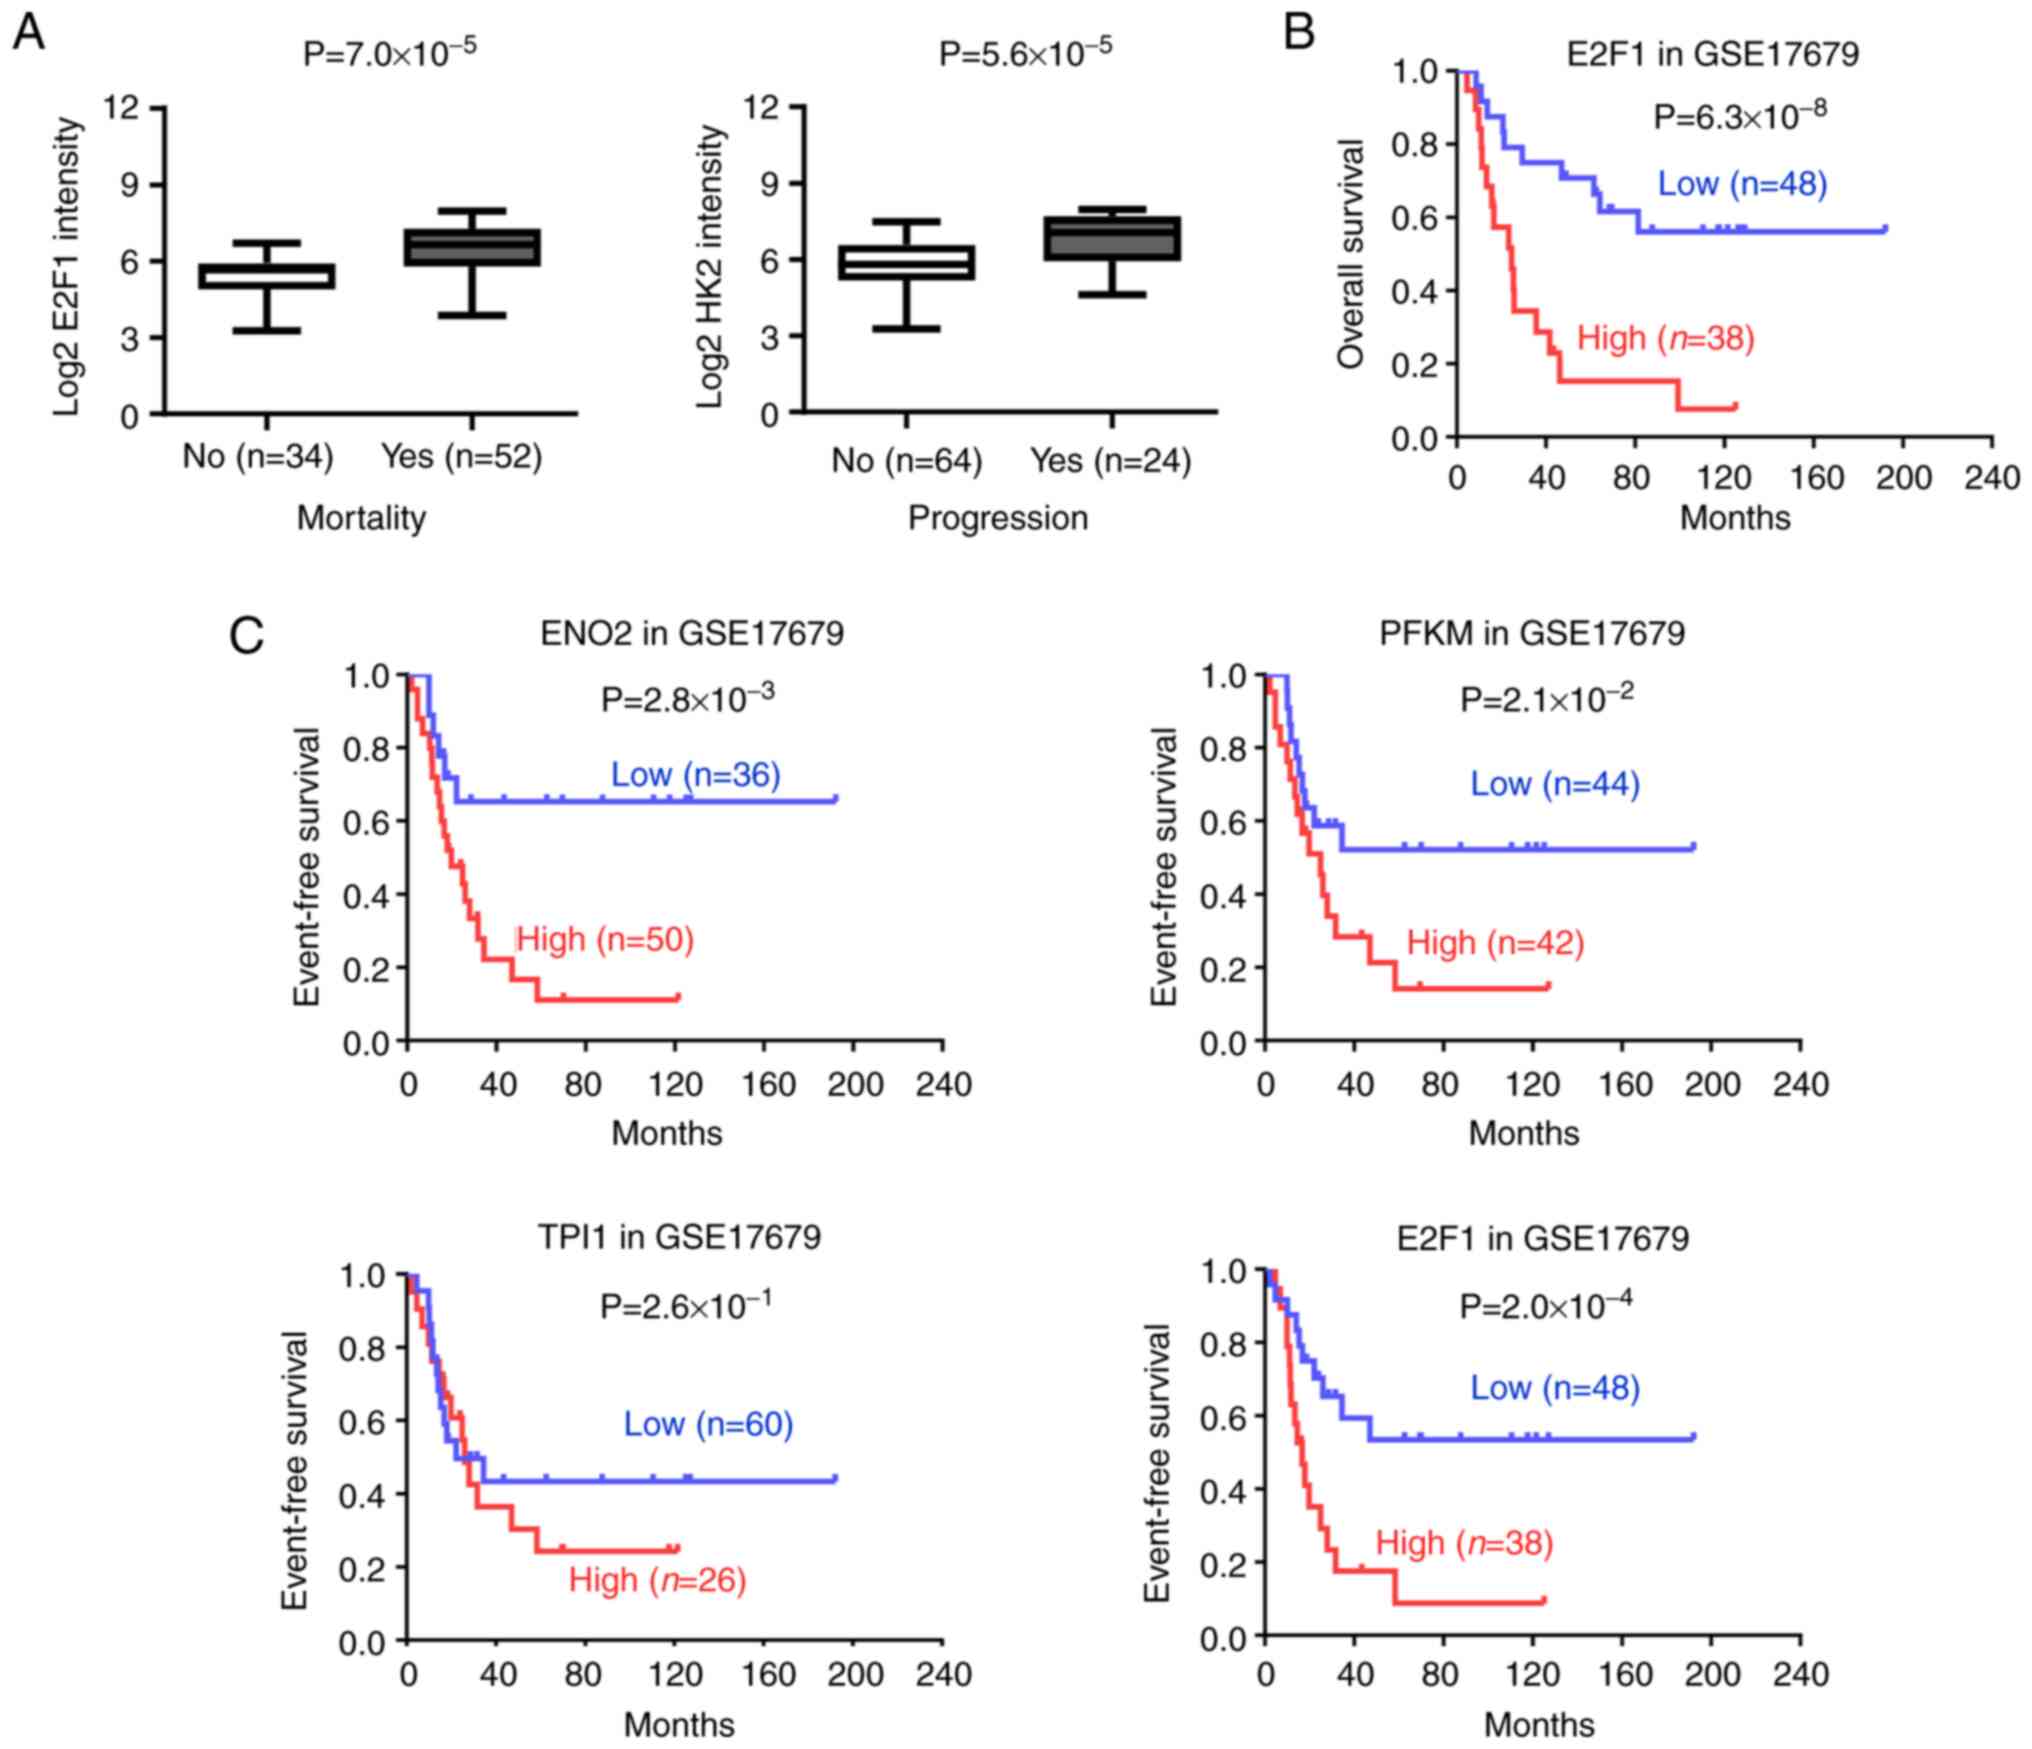
in EWS (Fig. 1A and Table SIII). Further analysis revealed
that higher expression of ENO2, PFKM, TPI1 and E2F1
were observed in patients with EWS with mortality
(P=7.0×10⁻⁴, P=1.4×10⁻³,
P=1.3×10⁻³ and P=7.0×10⁻⁵) and progression
(P=2.2×10⁻⁶, P=2.8×10⁻³,
P=3.2×10⁻⁴ and P=5.6×10⁻⁵) (Figs. 1B and 2A). More importantly, log-rank test of
EWS cases indicated that patients with high ENO2, PFKM and
E2F1 expression had poorer overall survival, but not
TPI1 (Figs. 1C and
2B). Consistently, patients with
high ENO2, PFKM and E2F1 had poorer event-free
survival in EWS, but not TPI1 (Fig. 2C). These findings indicated that
E2F1 involvement in aerobic glycolysis in EWS.
E2F1 regulates aerobic glycolysis gene
expression of ENO2
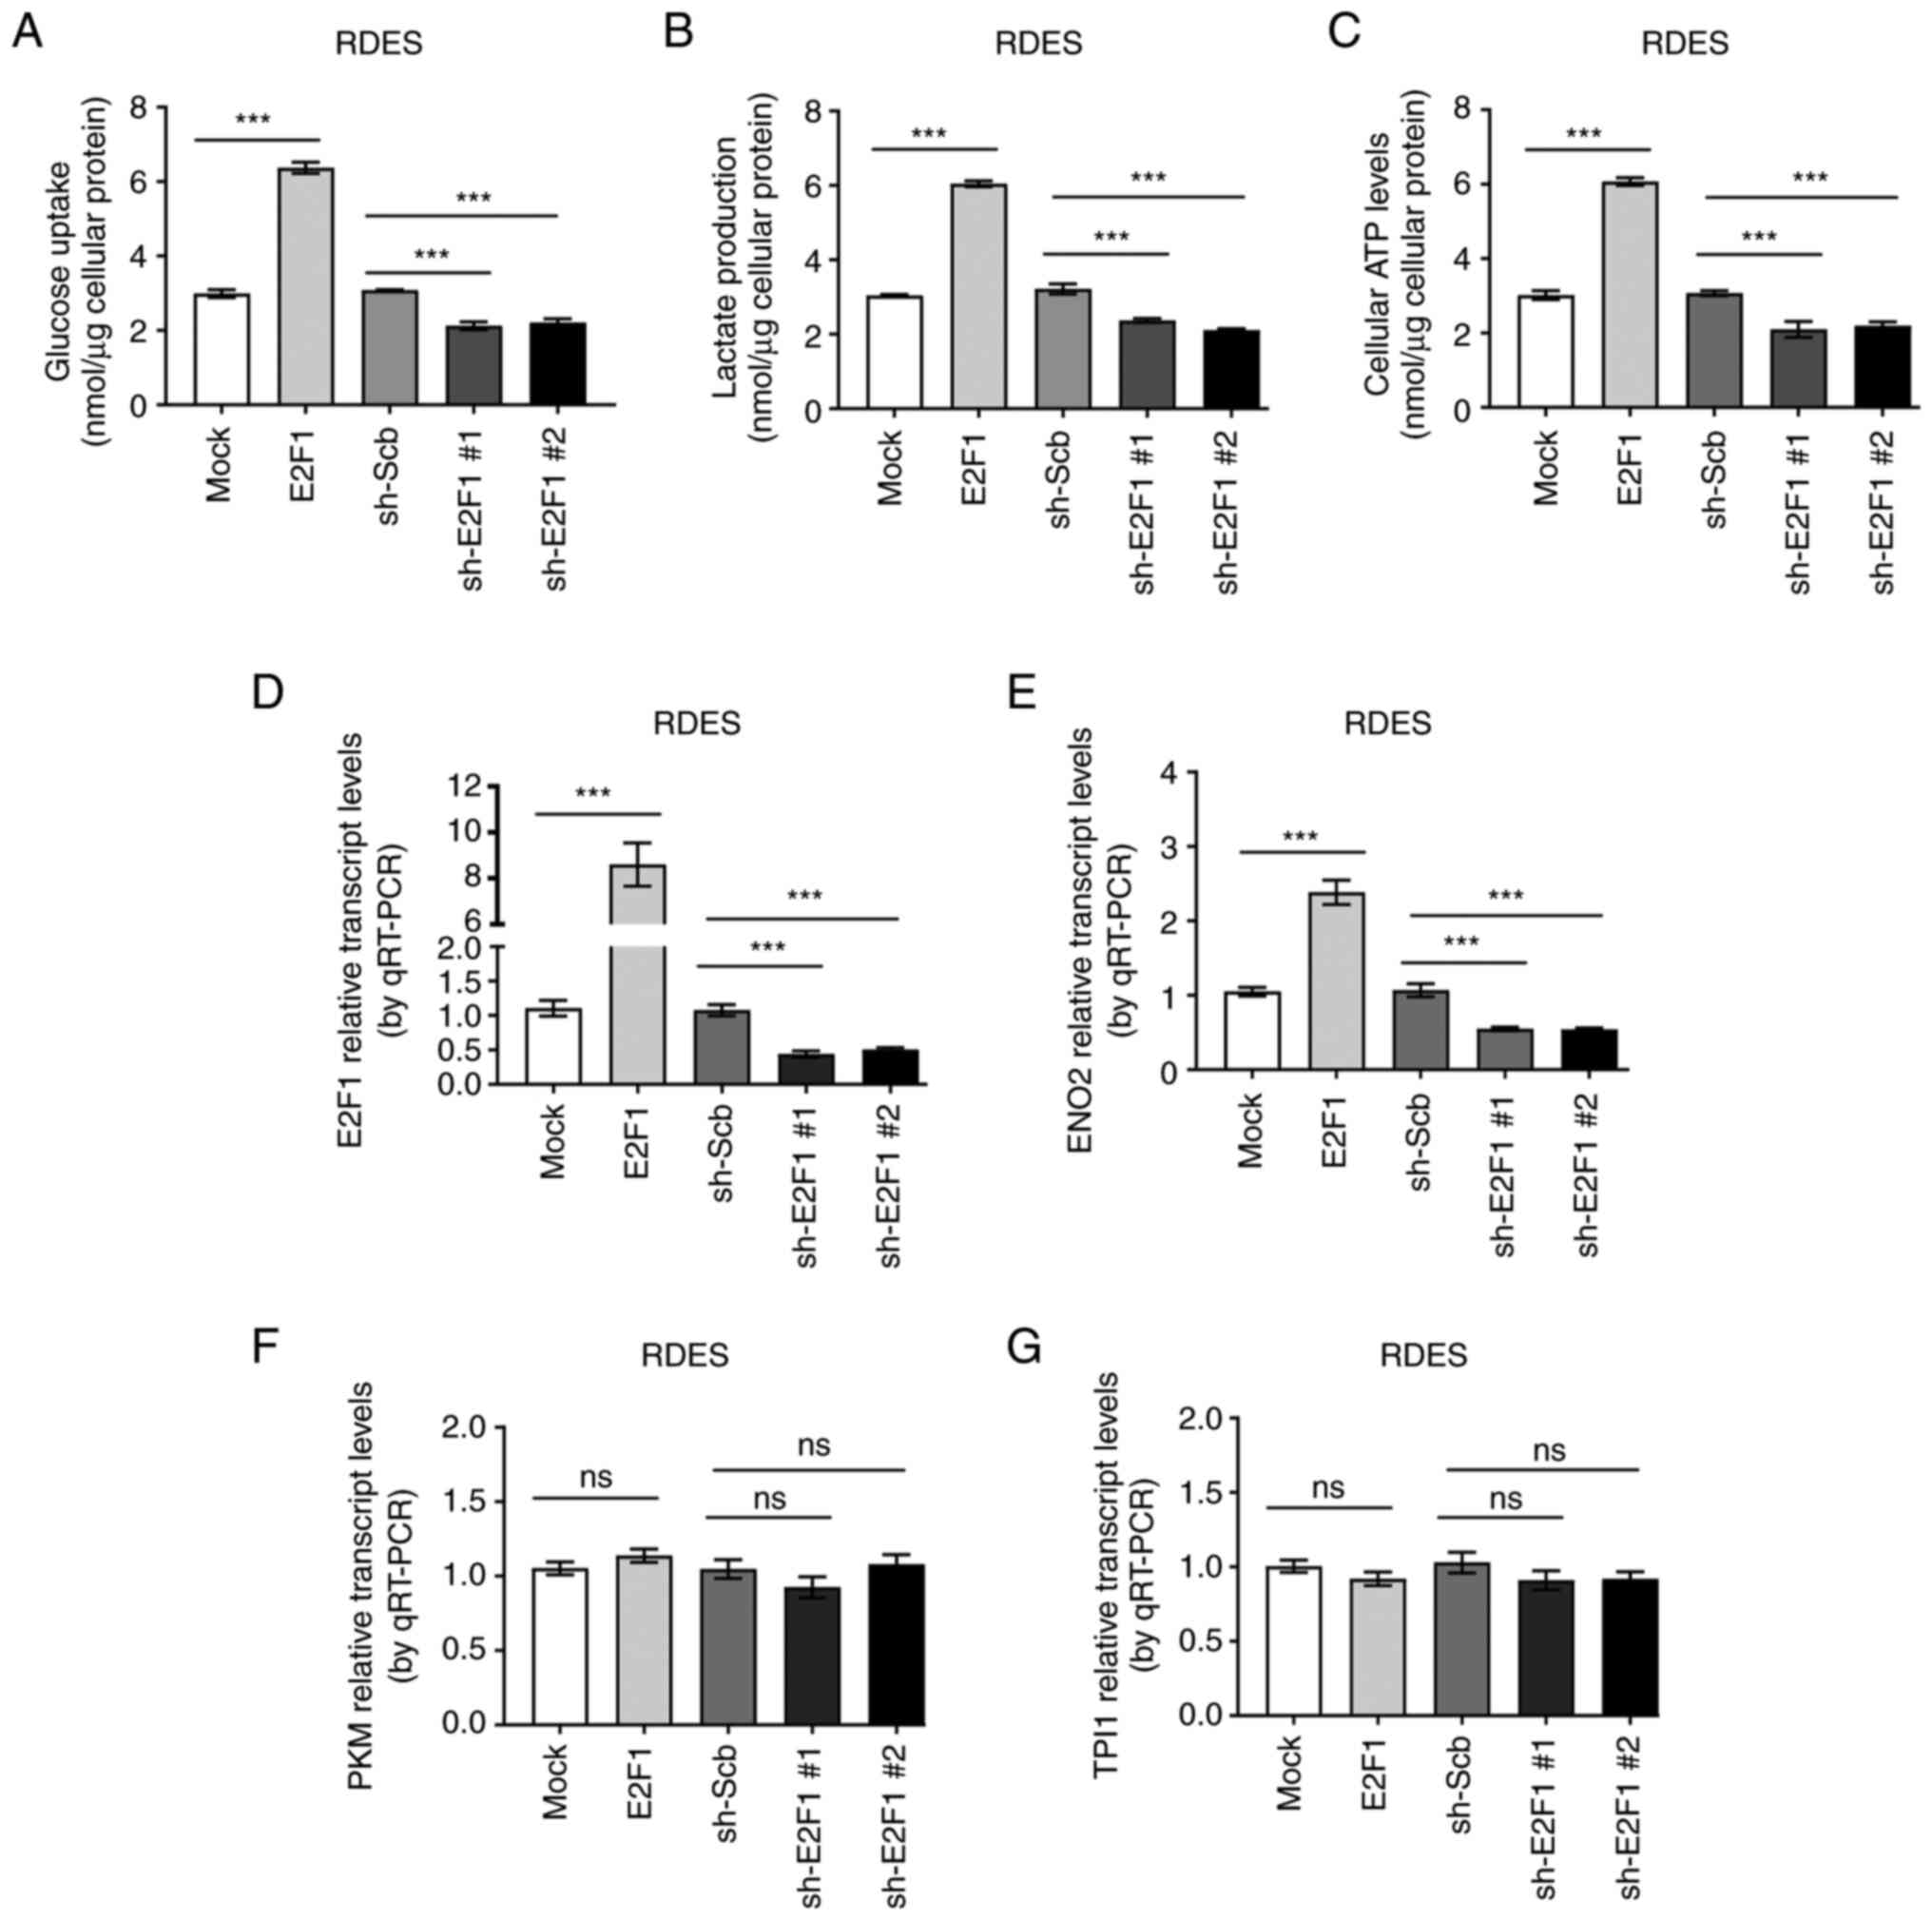
To characterize the roles of E2F1 on aerobic
glycolysis in EWS, glucose uptake, lactate production and ATP
levels were evaluated under enhanced or decreased E2F1
expression. As expected, forced expression of E2F1 increased
the glucose uptake, lactate production and ATP levels in EWS cells,
while silencing of E2F1 led to decrease the glucose uptake,
lactate production and ATP levels (Fig. 3A-C). To further functionally
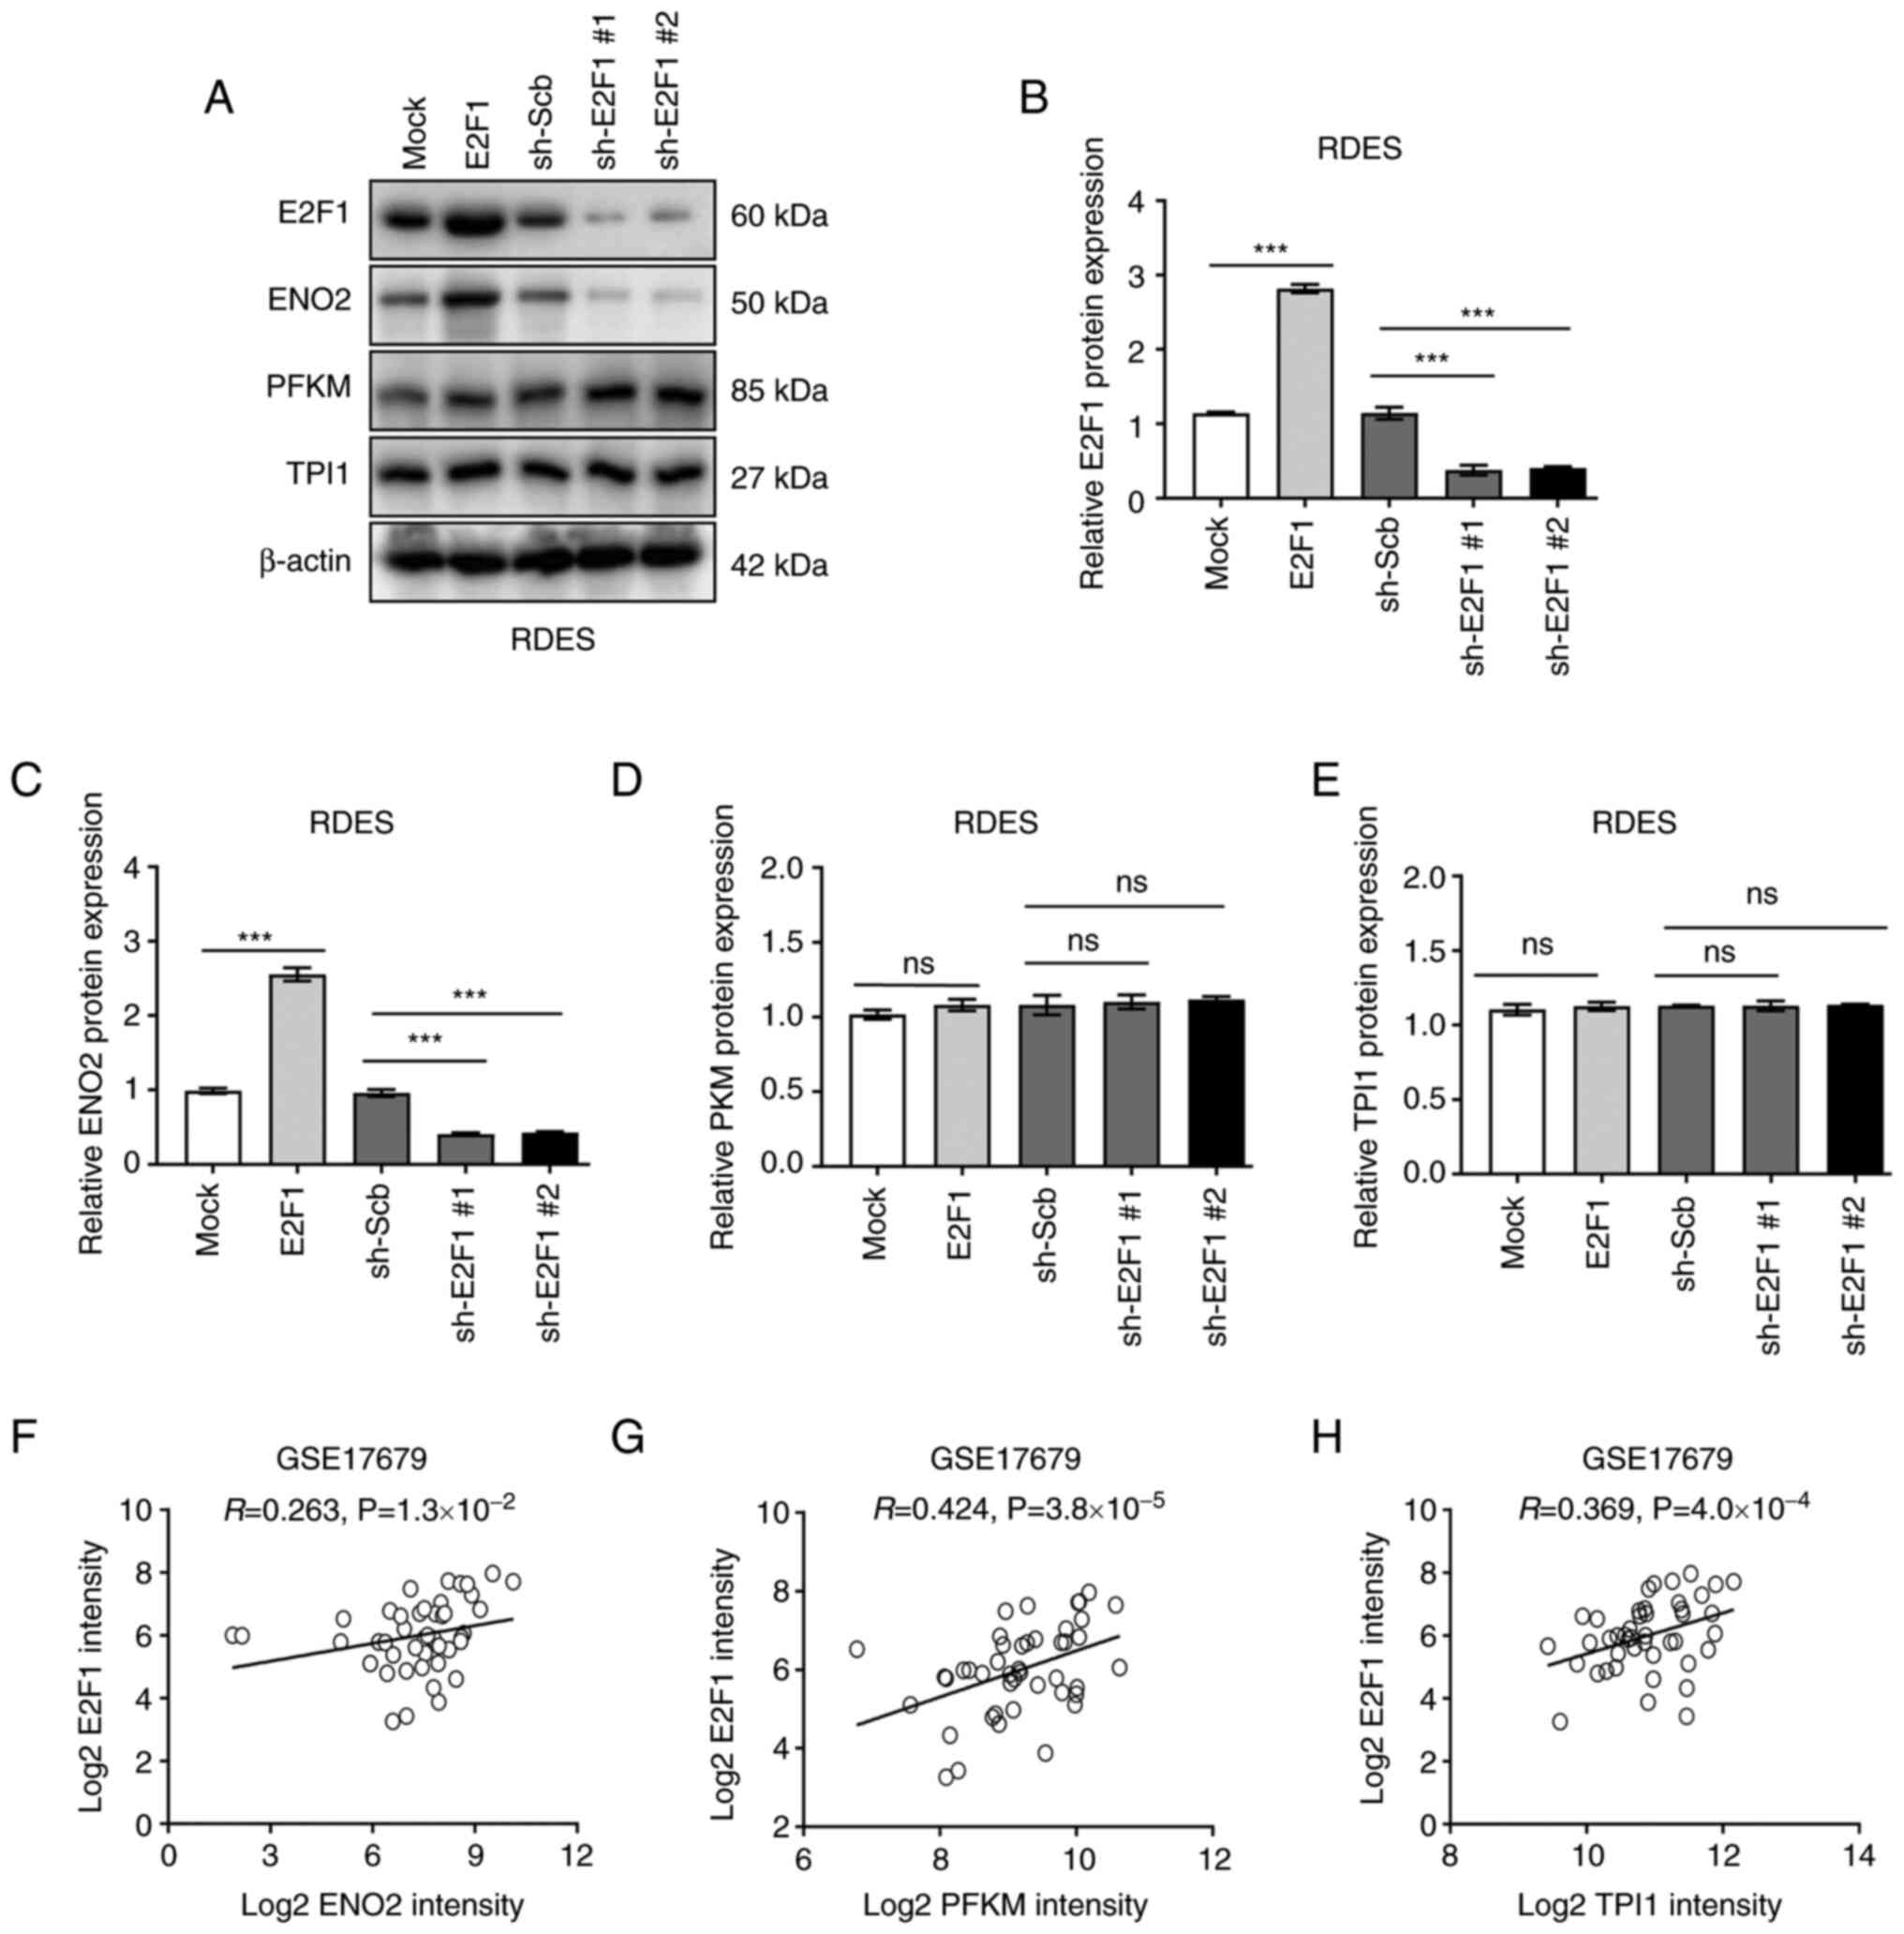
characterize E2FI regulating aerobic glycolysis, the expression of
putative target genes were measured. The result validated that
stable overexpression of E2F1 in EWS cell line RDES resulted
in increased expression of ENO2, while silencing of
E2F1 led to decreased expression of ENO2 (Figs. 3D-E and 4A-C). Meanwhile, the level of
PFKM and TPI1 was not affected by the altered
expression of E2F1 (Figs.
3F-G and 4D-E). In line with
the above findings, mining of public datasets revealed that there
was a positive expression correlation between E2F1 and ENO2,
even PFKM and TPI1 (R=0.263, P=1.3×10⁻²,
R=0.424, P=3.8×10⁻⁵ and R=0.369,
P=4.0×10⁻⁴) (Fig.
4F-H). Collectively, these data demonstrated that E2F1 may
affect aerobic glycolysis in EWS cells via regulating ENO2
expression.
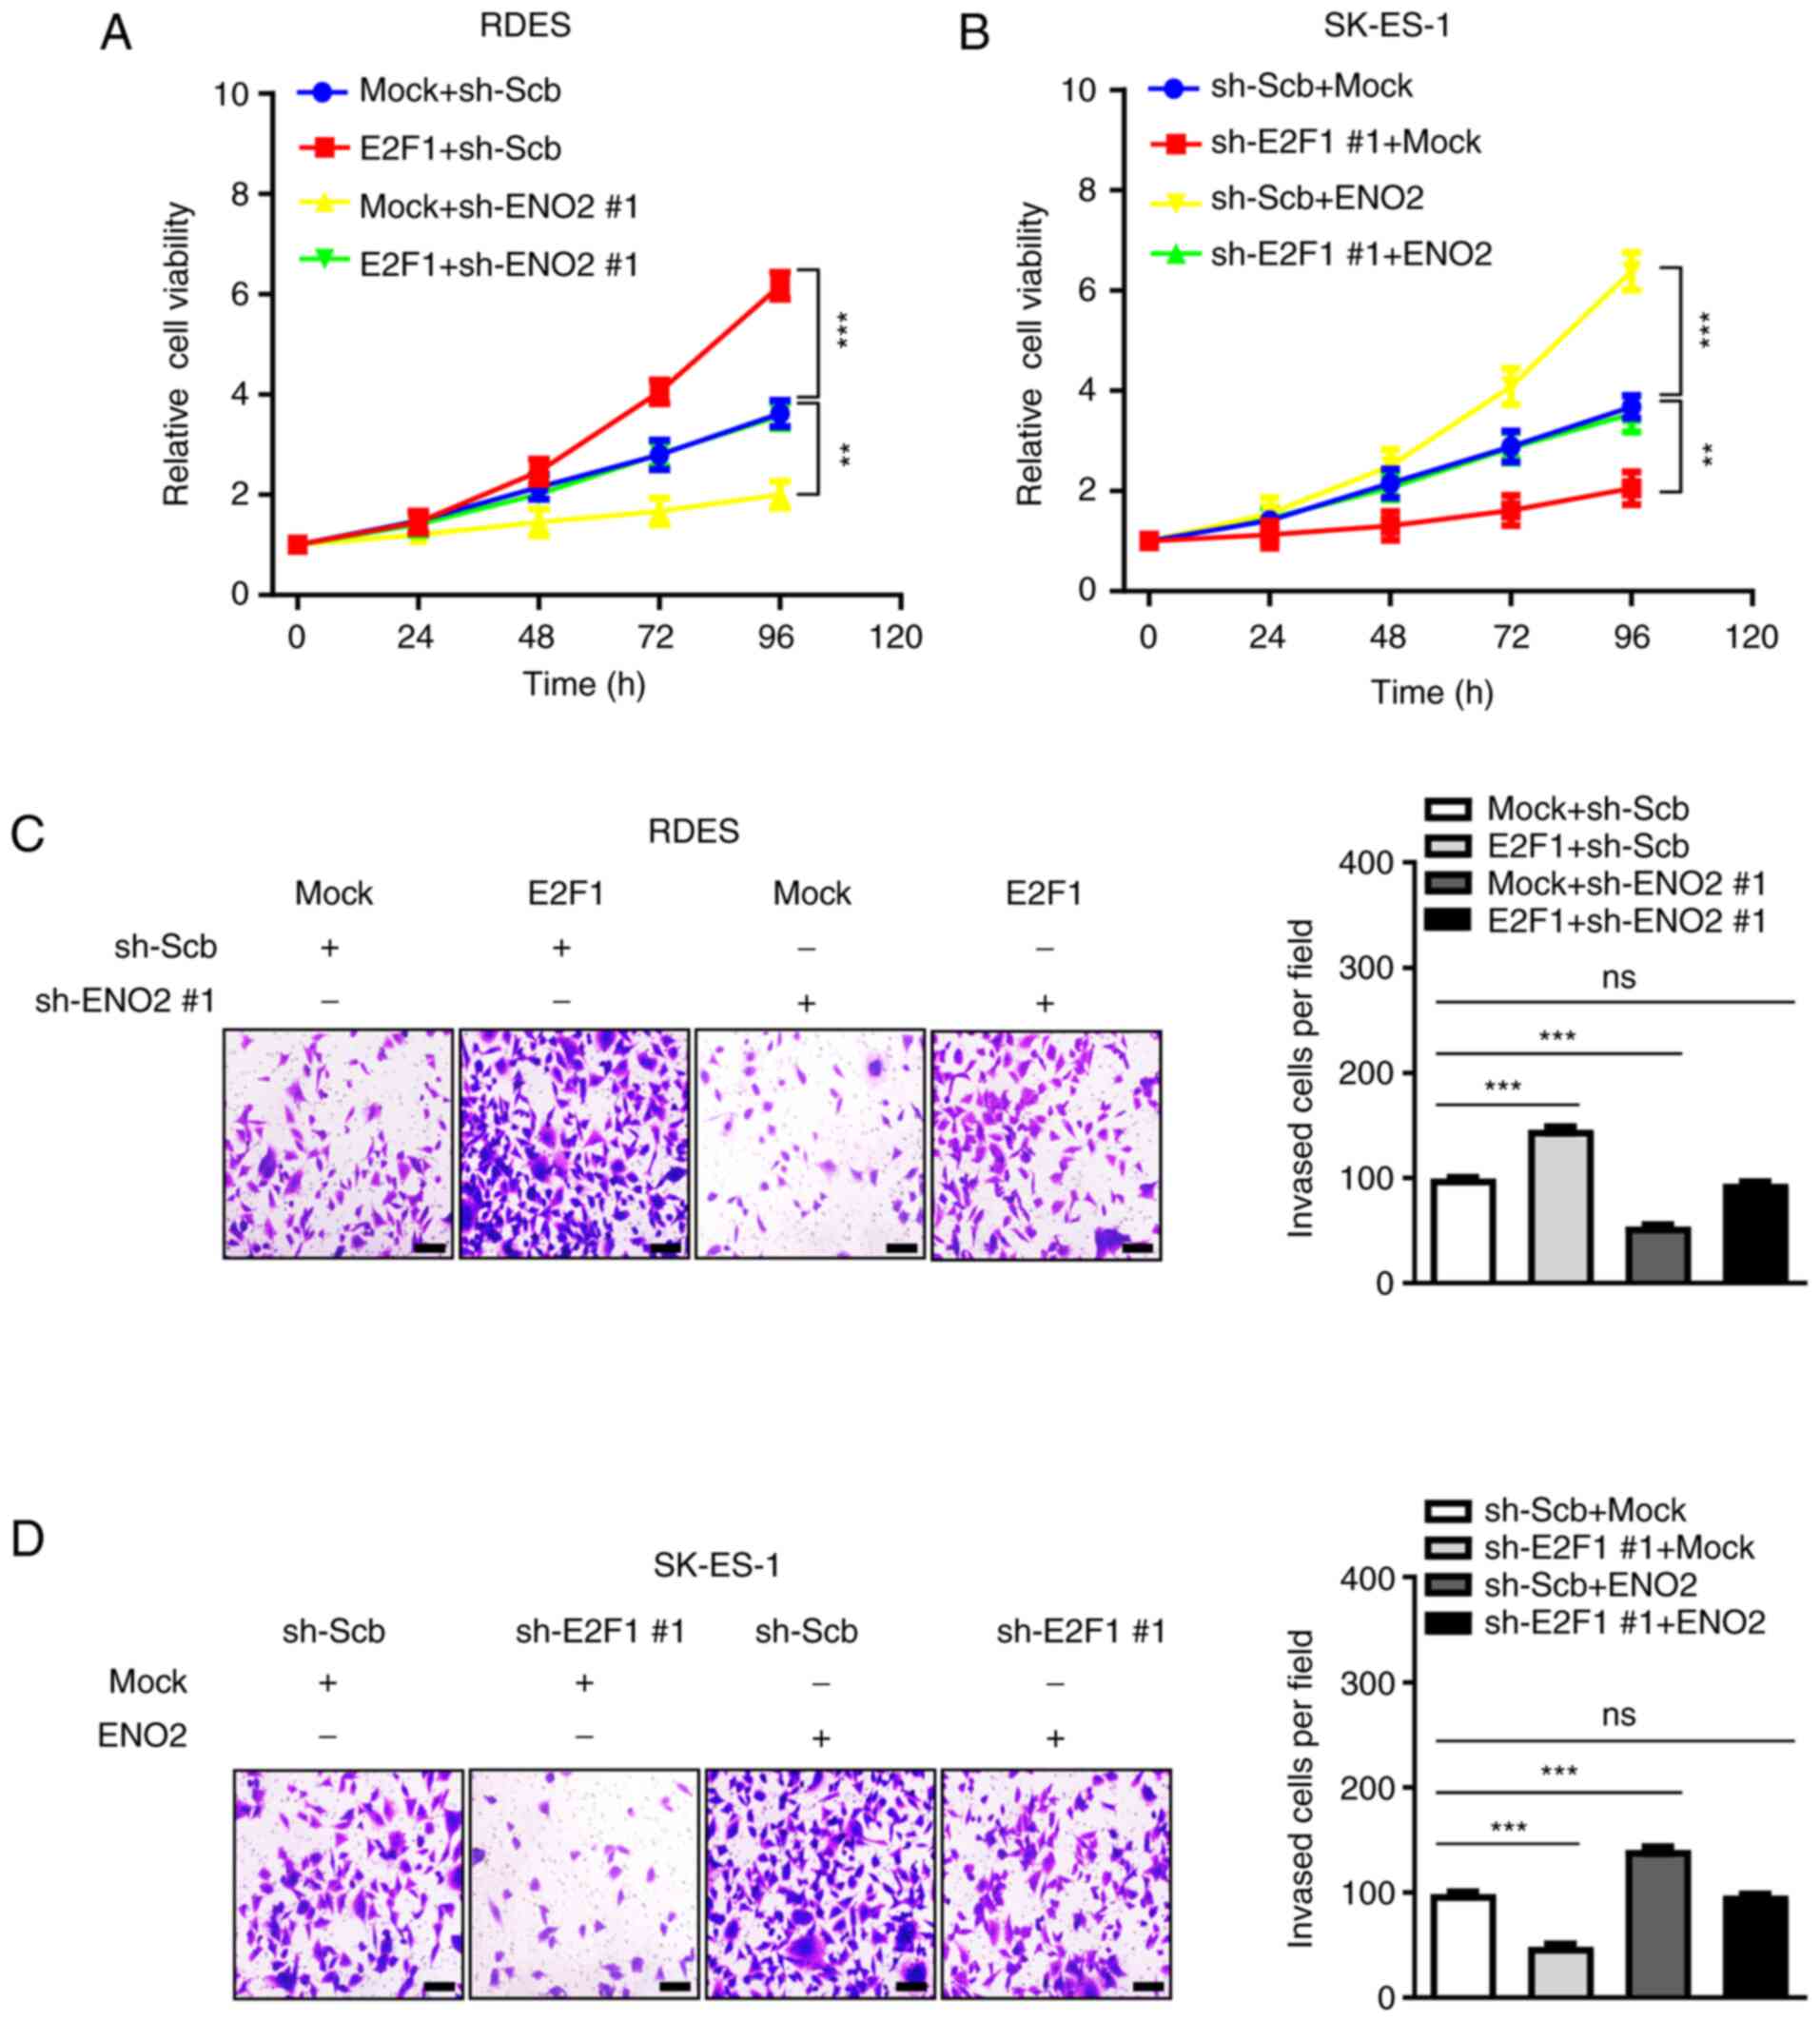
E2F1 regulates EWS progression via
ENO2
To further assess the functional roles of
E2F1 in EWS, EWS cells with stable overexpression and
knockdown of E2F1 were established. The accumulation of
endogenous E2F1 significantly accelerated cell viability and
invasion of RDES or SK-ES-1 cells, whereas knockdown of endogenous
E2F1 led to a significant reduce in cell viability and
invasion (Fig. 5A-D).
Additionally, silenced or enhanced expression of ENO2
partially rescued the changes in cell viability and invasion of EWS
induced by the forced expression or silencing of E2F1
(Fig. 5A-D). In conclusion, these
data demonstrated that E2F1 regulates EWS progression via
ENO2.
Discussion
Altered aerobic glycolysis is a well-recognized
characteristic of cancer cells, as elevated glycolytic flux
provides essential anabolic to sustain cancer cell proliferation
and metastasis (9). Thus,
targeting aerobic glycolysis in cancer cells remains an attractive
therapeutic way and several small organic molecules, such as
3-bromopyruvate are able to block aerobic glycolysis and repress
tumor progression (10). As
glycolysis progress is mediated by numerous enzymes, investigating
the regulation mechanism of glycolysis genes provide an improved
understanding about cancer therapy. Emerging evidence demonstrates
that transcription factors regulate glycolysis in various cancers.
For example, the oncogenic transcription factor c-MYC regulates
expression of glycolytic genes, including enolase 1 (ENO1)
and lactate dehydrogenase A (LDHA), eventually enhancing
aerobic glycolysis (11).
Additionally, HIF1α through activating pyruvate dehydrogenase
kinase 1 (PDK1) modulates aerobic glycolysis (12). Similarly, depletion of
EWS-FLI1, the oncogenic driver of EWS, results in a decrease
in LDHA levels in preclinical models of EWS, thus eventually
impairing glycolysis and affecting cell survival. The current study
uncovered E2F1 as a critical regulator of aerobic glycolysis
and EWS progression. It demonstrated that E2F1 is a driver
of EWS and promoted the aerobic glycolysis and progression of EWS
cells by regulating expression of ENO2.
E2F1 belongs to the E2F transcription factor family
that is involved in numerous cellular processes (13,14). In human tumors, aberrant E2F1 is
been found in various types of cancer, leading to the unfavorable
prognosis of patients with cancer. In neuroblastomas, E2F1
regulates MYCN gene expression, which is the most important
molecular marker of neuroblastomas (15). Additionally, studies indicate an
emerging role of E2F1 in regulating aerobic glycolysis. For
instance, E2F1 is involved in the development of liver
pathology by regulating glycolysis process (16). In breast cancer, E2F1
transcriptionally regulates SEC61G expression result in
modulate glycolysis, leading to cancer development and metastasis
(17). The findings of the
present study indicated that E2F1, facilitated cancer
progression and aerobic glycolysis in EWS via regulating the
expression of ENO2.
ENO2, also known as neuro-specific enolase (NSE), is
primarily expressed by mature neurons and cells of neuronal origin
(18,19). Serving as a key glycolytic enzyme
in glycolysis, ENO2 is responsible for the conversion of
β-glycerophosphate into dihydroxyacetone phosphate (20). ENO2 is a well-established
biomarker for neuroblastoma, small-cell lung cancer and other
tumors (21,22). In gastric cancer, studies have
found that elevated METTL3 expression through activating
GLUT4 and ENO2 expression promotes tumor angiogenesis
and glycolysis (23). However,
the roles of ENO2 in EWS remain to be elucidated. In present
study, high ENO2 expression was closely associated with
progression and poor prognosis in EWS. More importantly, it was
demonstrated that ENO2 was the target of E2F1, which
mediated aerobic glycolysis and cancer progression in EWS.
The present study has several limitations. First, it
only explored the role of E2F1 in vitro, thus in vivo
studies are needed to further investigate the effects of
E2F1 on glycolysis and cancer progression in EWS. Second,
E2F1 is associated with cell cycle progression and
E2F1 can modulate genes expression in a cell cycle-dependent
or independent manner (24).
Here, the results of the present study demonstrated that
E2F1 can regulate the expression of ENO2, although
without full understanding of the clear mechanism. To clarify the
mechanism that E2F1 regulated ENO2 expression in EWS,
special inhibitors of cell cycle or E2F1 are needed to be
administered in follow-up studies.
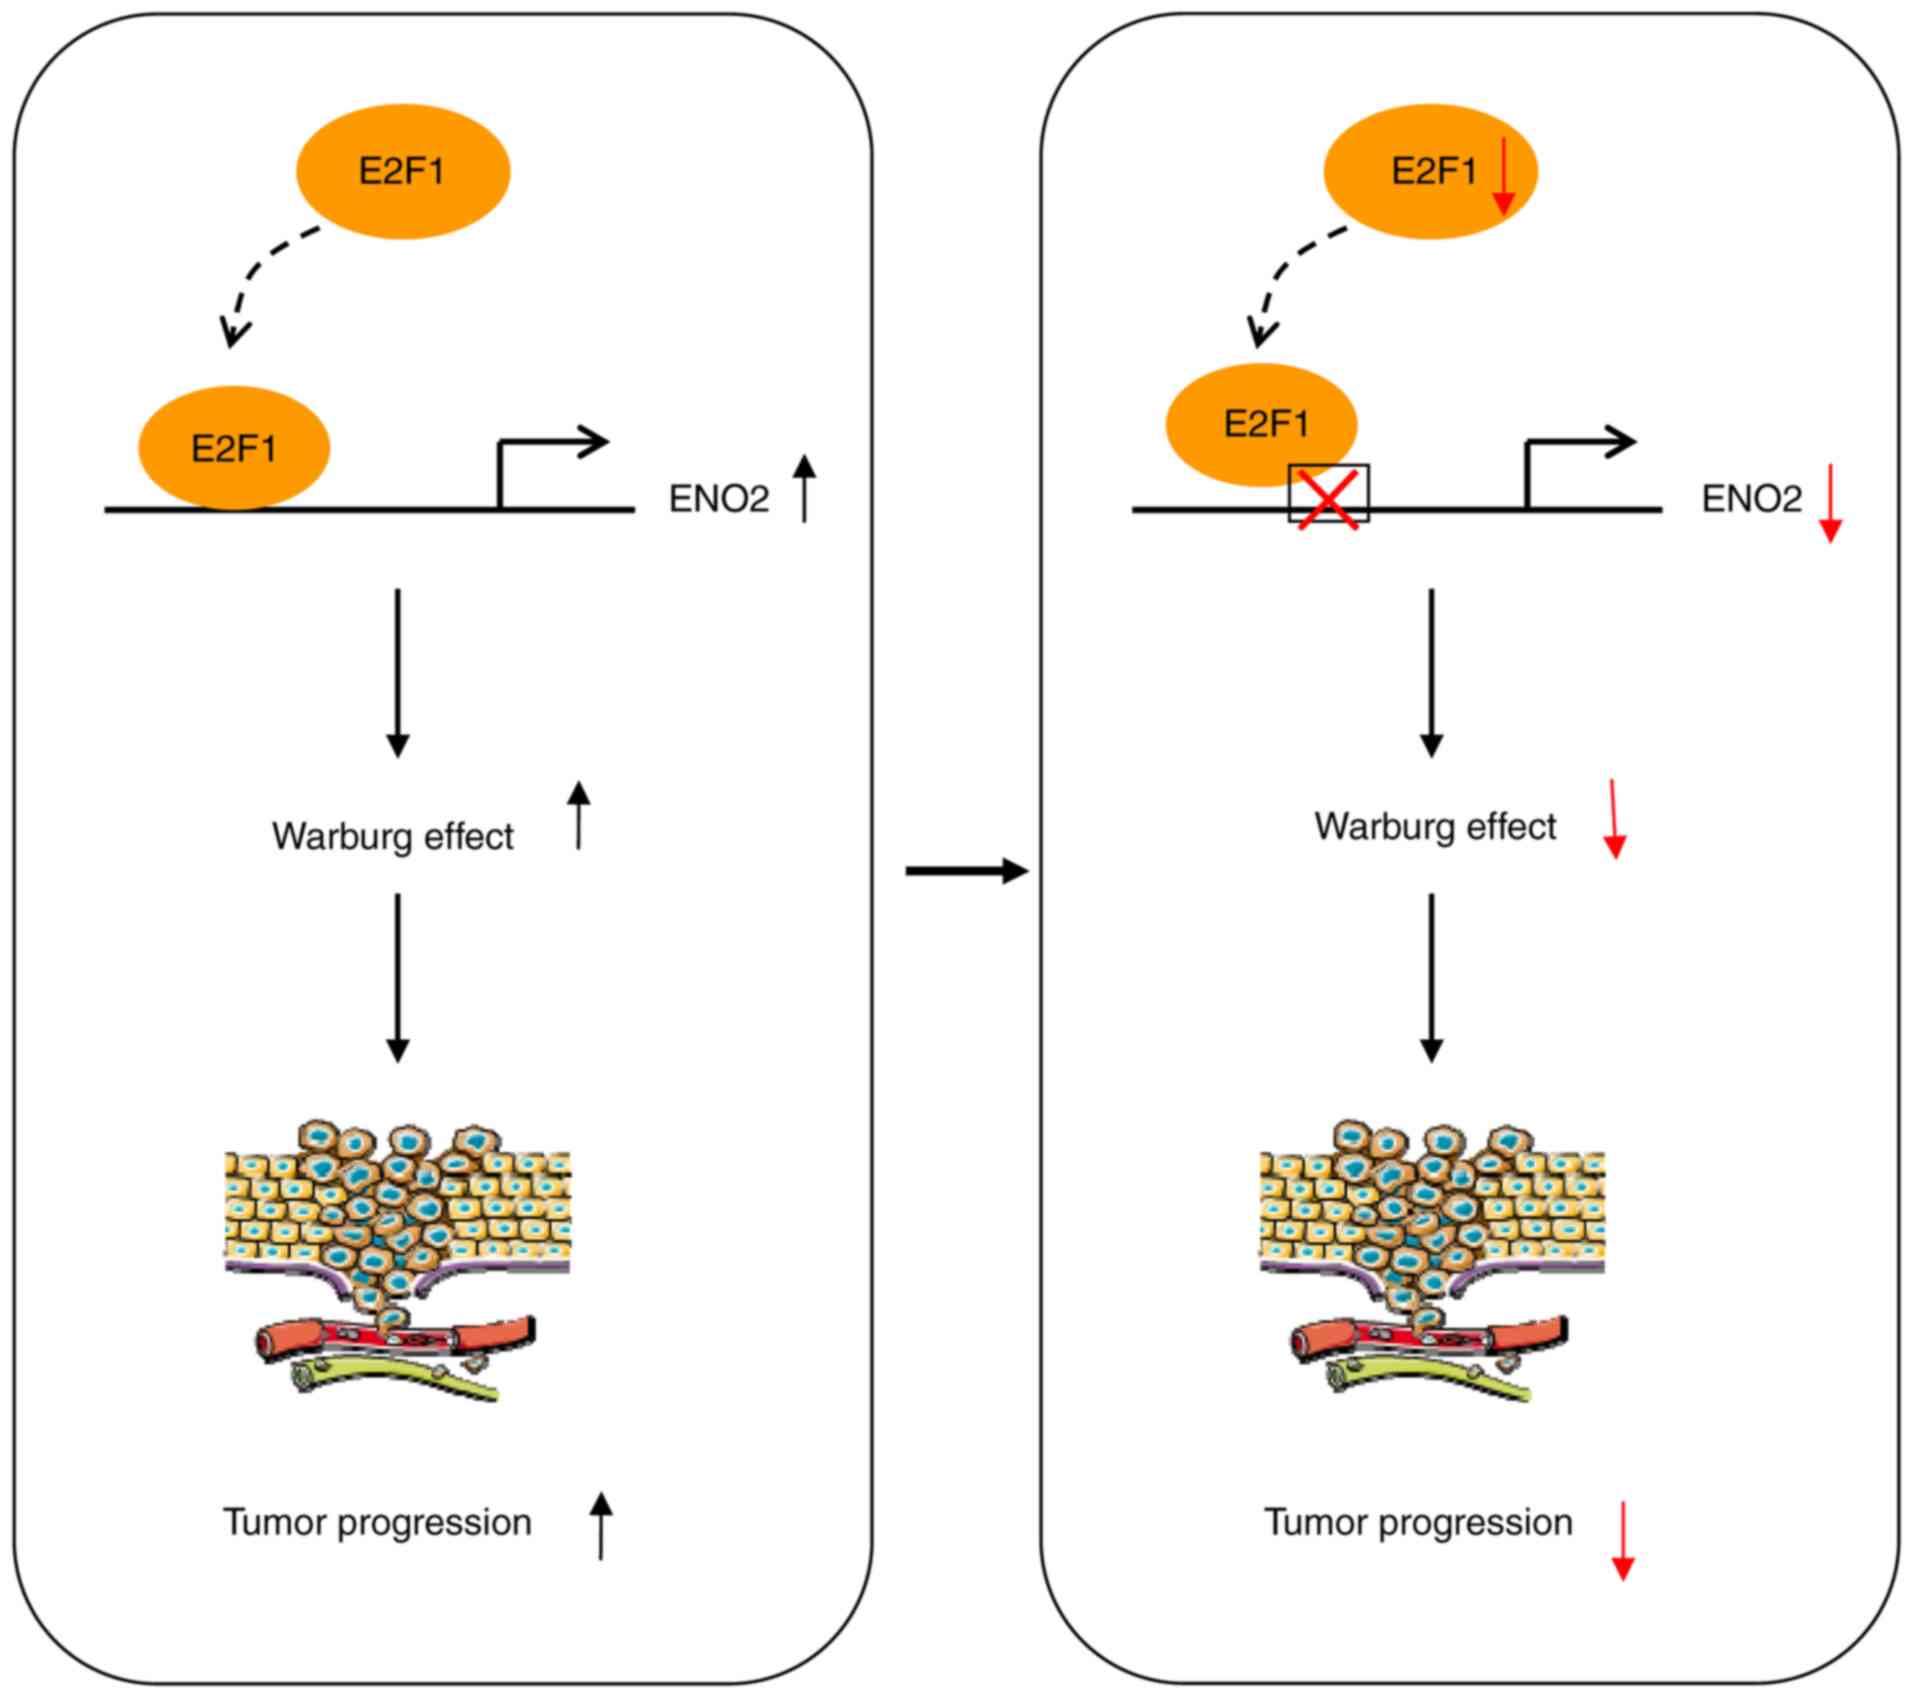
In summary, the present study demonstrated that
E2F1 was a prognostic biomarker and associated with
glycolysis in EWS. Mechanistically, E2F1 regulated
ENO2 expression to induce glycolysis and promote cancer
progression in EWS (Fig. 6).
Therefore, E2F1 might be a potential predictor and
therapeutic target for EWS. These results extend the understanding
of EWS.
Supplementary Material
Supporting Data
Acknowledgements
Not applicable.
Funding
The present study was supported by the Joint Funds of Hubei
Health Commission (grant no. WJ2019H362) and Medical Research Fund
of Wu Han Commission (grant no. WX20Q21).
Availability of data and materials
The datasets used and/or analyzed in this study are
available from the corresponding author on reasonable request.
Authors' contributions
XJ, ZC, and JZ designed and performed the
experiments. JH, GY and YL were involved in designing the figures
and analyzing the data. HY and TL designed the research, revised
the manuscript for important intellectual content and drafted the
manuscript. HY and TL confirm the authenticity of all the raw data.
All authors reviewed and approved the final manuscript.
Ethics approval and consent to
participate
Not applicable.
Patient consent for publication
Not applicable.
Competing interests
The authors declare that they have no competing
interests.
References
|
1
|
Grunewald TGP, Cidre-Aranaz F, Surdez D,
Tomazou EM, de Alava E, Kovar H, Sorensen PH, Delattre O and
Dirksen U: Ewing sarcoma. Nat Rev Dis Primers. 4:52018. View Article : Google Scholar : PubMed/NCBI
|
|
2
|
Linabery AM and Ross JA: Childhood and
adolescent cancer survival in the US by race and ethnicity for the
diagnostic period 1975–1999. Cancer. 113:2575–2596. 2008.
View Article : Google Scholar : PubMed/NCBI
|
|
3
|
Hanahan D and Weinberg RA: Hallmarks of
cancer: The next generation. Cell. 144:646–674. 2011. View Article : Google Scholar : PubMed/NCBI
|
|
4
|
Yeung C, Gibson AE, Issaq SH, Oshima N,
Baumgart JT, Edessa LD, Rai G, Urban DJ, Johnson MS, Benavides GA,
et al: Targeting glycolysis through inhibition of lactate
dehydrogenase impairs tumor growth in preclinical models of ewing
sarcoma. Cancer Res. 79:5060–5073. 2019. View Article : Google Scholar : PubMed/NCBI
|
|
5
|
Chen C, Pore N, Behrooz A, Ismail-Beigi F
and Maity A: Regulation of glut1 mRNA by hypoxia-inducible
factor-1. Interaction between H-ras and hypoxia. J Biol Chem.
276:9519–9525. 2001. View Article : Google Scholar : PubMed/NCBI
|
|
6
|
R Core Team R, . A language and
environment for statistical computing. R Foundation for Statistical
Computing. (Vienna). 2020.https://www.R-project.org/
|
|
7
|
Livak KJ and Schmittgen TDl: Analysis of
relative gene expression data using real-time quantitative PCR and
the 2 (−Delta Delta C(T)) method. Methods. 25:402–408. 2001.
View Article : Google Scholar : PubMed/NCBI
|
|
8
|
Lachmann A, Xu H, Krishnan J, Berger SI,
Mazloom AR and Ma'ayan A: ChEA: Transcription factor regulation
inferred from integrating genome-wide ChIP-X experiments.
Bioinformatics. 26:2438–2444. 2010. View Article : Google Scholar : PubMed/NCBI
|
|
9
|
Heiden MGV, Cantley LC and Thompson CB:
Understanding the warburg effect: The metabolic requirements of
cell proliferation. Science. 324:1029–1033. 2009. View Article : Google Scholar : PubMed/NCBI
|
|
10
|
Nilsson H, Lindgren D, Forsberg AM, Mulder
H, Axelson H and Johansson ME: Primary clear cell renal carcinoma
cells display minimal mitochondrial respiratory capacity resulting
in pronounced sensitivity to glycolytic inhibition by
3-Bromopyruvate. Cell Death Dis. 6:e15852015. View Article : Google Scholar : PubMed/NCBI
|
|
11
|
Guan H, Luo W, Liu Y and Li M: Novel
circular RNA circSLIT2 facilitates the aerobic glycolysis of
pancreatic ductal adenocarcinoma via miR-510-5p/c-Myc/LDHA axis.
Cell Death Dis. 12:6452021. View Article : Google Scholar : PubMed/NCBI
|
|
12
|
Dupuy F, Tabaries S, Andrzejewski S, Dong
Z, Blagih J, Annis MG, Omeroglu A, Gao D, Leung S, Amir E, et al:
PDK1-dependent metabolic reprogramming dictates metastatic
potential in breast cancer. Cell Metab. 22:577–589. 2015.
View Article : Google Scholar : PubMed/NCBI
|
|
13
|
Hernando E, Nahle Z, Juan G,
Diaz-Rodriguez E, Alaminos M, Hemann M, Michel L, Mittal V, Gerald
W, Benezra R, et al: Rb inactivation promotes genomic instability
by uncoupling cell cycle progression from mitotic control. Nature.
430:797–802. 2004. View Article : Google Scholar : PubMed/NCBI
|
|
14
|
Polager S and Ginsberg D: p53 and E2f:
Partners in life and death. Nat Rev Cancer. 9:738–748. 2009.
View Article : Google Scholar : PubMed/NCBI
|
|
15
|
Kramps C, Strieder V, Sapetschnig A, Suske
G and Lutz W: E2F and Sp1/Sp3 synergize but are not sufficient to
activate the MYCN gene in neuroblastomas. J Biol Chem.
279:5110–5117. 2004. View Article : Google Scholar : PubMed/NCBI
|
|
16
|
Denechaud PD, Lopez-Mejia IC, Giralt A,
Lai Q, Blanchet E, Delacuisine B, Nicolay BN, Dyson NJ, Bonner C,
Pattou F, et al: E2F1 mediates sustained lipogenesis and
contributes to hepatic steatosis. J Clin Invest. 126:137–150. 2016.
View Article : Google Scholar : PubMed/NCBI
|
|
17
|
Ma J, He Z, Zhang H, Zhang W, Gao S and Ni
X: SEC61G promotes breast cancer development and metastasis via
modulating glycolysis and is transcriptionally regulated by E2F1.
Cell Death Dis. 12:5502021. View Article : Google Scholar : PubMed/NCBI
|
|
18
|
Marangos PJ, Parma AM and Goodwin FK:
Functional properties of neuronal and glial isoenzymes of brain
enolase. J Neurochem. 31:727–732. 1978. View Article : Google Scholar : PubMed/NCBI
|
|
19
|
Liu CC, Wang H, Wang WD, Wang L, Liu WJ,
Wang JH, Geng QR and Lu Y: ENO2 promotes cell proliferation,
glycolysis, and glucocorticoid-resistance in acute lymphoblastic
leukemia. Cell Physiol Biochem. 46:1525–1535. 2018. View Article : Google Scholar : PubMed/NCBI
|
|
20
|
Roessler S, Jia HL, Budhu A, Forgues M, Ye
QH, Lee JS, Thorgeirsson SS, Sun Z, Tang ZU, Qin LX and Wang XW: A
unique metastasis gene signature enables prediction of tumor
relapse in early-stage hepatocellular carcinoma patients. Cancer
Res. 70:10202–10212. 2010. View Article : Google Scholar : PubMed/NCBI
|
|
21
|
Dong X, Du Y, Zhao G, Cao W, Fan D, Kuang
X, Wei Q and Ju H: Dual-signal electrochemiluminescence
immunosensor for neuron-specific enolase detection based on
‘dual-potential’ emitter Ru(bpy)3(2+) functionalized zinc-based
metal-organic frameworks. Biosens Bioelectron. 192:1135052021.
View Article : Google Scholar : PubMed/NCBI
|
|
22
|
Chen Y, Wen S, Xia J, Du X, Wu Y, Pan B,
Zhu W and Shen B: Association of dynamic changes in peripheral
blood indexes with response to PD-1 inhibitor-based combination
therapy and survival among patients with advanced non-small cell
lung cancer. Front Immunol. 12:6722712021. View Article : Google Scholar : PubMed/NCBI
|
|
23
|
Wang Q, Chen C, Ding Q, Zhao Y, Wang Z,
Chen J, Jiang Z, Zhang Y, Xu G, Zhang J, et al: METTL3-mediated
m(6)A modification of HDGF mRNA promotes gastric cancer progression
and has prognostic significance. Gut. 69:1193–1205. 2020.
View Article : Google Scholar : PubMed/NCBI
|
|
24
|
Iwanaga R, Komori H, Ishida S, Okamura N,
Nakayama K, Nakayama KI and Ohtani K: Identification of novel E2F1
target genes regulated in cell cycle-dependent and independent
manners. Oncogene. 25:1786–1798. 2006. View Article : Google Scholar : PubMed/NCBI
|