Introduction
Bile duct disease, characterized by immune-mediated
bile duct injury, inflammatory response and risks of fibrotic
changes, is a chronic disease of the biliary system that causes
cholestasis and secondary liver damage. Primary sclerosing
cholangitis and primary biliary cholangitis are the two most common
bile duct diseases in humans (1).
The bipotential cells in the human liver can be differentiated into
hepatocytes and bile duct epithelial cells (BDEs) (2), which are hepatic oval cells (HOCs).
HOCs can be activated to proliferate and differentiate into mature
hepatocytes and BDEs under certain conditions (3–6), and
these are regarded as hepatic stem/progenitor cells. Activation of
HOCs proliferation can be induced by a number of rodent models
(7–9), but 2-acetylaminofluroene and partial
hepatectomy (2-AAF/PH) is a traditional model to activate HOCs in
rat liver (10). A number of study
methods amass HOCs and show that the oval cells express hepatic
oval cell-specific marker OV-6, BDEs marker CK-19 and hepatocyte
lineage marker albumin and AFP (11). There still is a problem with
inducting HOCs committed to other cells. However, the study of the
directional differentiation of HOCs into BDEs is limited to
explorations on cell morphology and methodology, still leaving its
mechanism unclear (12,13). Therefore, studying the mechanism of
directional differentiation of HOCs into BDEs may provide a new way
for the treatment of bile duct diseases.
Epigenetics governs almost all aspects of the life
of multicellular organisms, as it controls how differentiated cells
achieve their unique phenotypes during development and
differentiation, despite their uniform genetic makeup (with
exceptions such as T cells and germ cells). Epigenetics involves
chromatin remodeling, histone H3 lysine 36 (H3K36), DNA methylation
(3) and non-coding RNA expression
(4). For example, human primary
hepatocytes have much more epigenetic regulation in terms of DNA
methylation and histone modifications than human embryonic stem
cell-derived hepatocytes due to their open chromatin structure, as
represented by hypomethylation of CpG sites and permissive histone
modifications (14). The human
primary hepatocytes and inhibition of DNA methyltransferases during
hepatic maturation induce demethylation of the CpG sites of
cytochrome P450 1A1 and cytochrome P450 1A2, thus leading to the
upregulation of their transcription (14). Otherwise, in delta-like 1 protein
hepatic stem/progenitor cells, 72 genes, including Cdkn2a and Sox4,
are significantly upregulated after differentiation toward
hepatocyte or cholangiocyte lineages as these genes exhibit
bivalent domains within 2 kb of the transcription start site. The 2
kb is the ‘bivalent domain’, a distinctive histone modification
signature characterized by repressive trimethylation of histone H3
at lysine 27 (H3K27me3) and active trimethylation of histone H3 at
lysine 4 (H3K4me3) marks (15).
Considerable emphasis should be placed on elucidating the
epigenetic machinery underlying the terminal differentiation of
HOCs.
A previous study has shown that histone H3 lysine 36
(H3K36), H3K36me3, can be catalyzed by histone methyltransferase
SET domain containing 2 (SETD2) to undetected trimethylate in human
liver cancer and liver tissues. It is only detected in the portal
area of the liver and is positively correlated with CK-19, the bile
duct epithelial marker and hepatocyte nuclear factor 1 (4). In this case, it is speculated that
H3K36me3 might be associated with the differentiation of BDEs, but
this has not been verified. Hence, the present study was performed
to explore the role of SETD2 and H3K36me3 in the differentiation of
HOCs and the possible mechanism by observing the expression changes
of SETD2 and H3K36me3 in mouse HOCs differentiated into BDEs and
analyzing its correlation with specific expression markers of liver
oval cells OV-6 and BDEs CK-19.
Materials and methods
Animals
A total of 30 male SPF mice aged 6–8 weeks and
weighing 20–25 g were collected from the Chinese Academy of
Sciences' Kunming Laboratory Animal Center. A total of 15 mice were
included in the experimental group and 15 were used as control
group; every mouse was placed in a single cage alone. Since male
mice have been as subject for liver regeneration in most
researches, 6–8 week-old male mice were selected for all
investigations. All mice were kept in a pathogen-free environment
at the animal center of the Dali University School of Medicine
(Dali, China). All animal tests were conducted in accordance with
the rules of the Biomedical Research Ethics Committee of the School
of Medicine at Dali University [approval number:
SYXK(yunnan)2018-0002]. All the mice were kept with a 12-h
light-dark cycle, a constant temperature of 25°C and a humidity of
48%. Every attempt was made to reduce the suffering of mice during
experiments, in order to record necessary information, animals
behavior were observed and recorded every 24 h at least. The
animals were not sacrificed until the successful cultivation of
oval cells. During the 45-day duration of this investigation, 15
mice were sacrificed for the collection of HOCs following partial
hepatectomy and two mice were found dead after the surgical
procedure, possibly due to liver failure. At the end of the
investigation, the remaining 15 mice were sacrificed by cervial
dislocation after ether inhalation. During the investigation, the
health and behavior of all the test animals were observed and
documented. After administering general anesthesia with inhalation
of 90% ether, which was administrated via wet cotton, cervical
dislocation was employed for sacrifice. Mortality was declared 5
min after cervical dislocation and pupil dilation.
Surgical preparation
The animals received 10-mg/kg/day of
2-acetylaminofluorene (AAF; 2-AAF vegetable oil solution at a
concentration of 0.2%) through gavage feeding for four consecutive
days. On the seventh day, a PH (10) was conducted, followed by four
further AAF treatments. On the tenth day after PH, the samples were
obtained for the isolation of HOCs. Inhalation of 90% ether was
used for general anesthesia.
Study design
A total of two experiments were performed following
the presented sequence. HOCs were taken as the control group, while
different differentiated BDEs were the experimental group.
Isolation of cells
The HOCs were extracted from mice treated with
AAF/PH (10 mg/kg/day) and sacrificed on the tenth day after PH. The
isolation and enrichment technique is briefly outlined in (6). The materials were digested with 0.10%
collagenase IV (MilliporeSigma; cat. no. C4-BIOC) and 0.10% pronase
E (MilliporeSigma; cat. no. 107433) before being separated and
purified using density gradient centrifugation (150 × g for 10 min
at 20°C). The purified HOCs were cultivated in DMEM/F12 media with
10% calf serum and 1% double antibody (HyClone; Cytiva) together
with penicillin and streptomycin (Beijing Solarbio Science &
Technology Co., Ltd.).
Cell culture and induction
differentiation
Sino Biological provided the neonatal calf serum
(Thermo Scientific, Inc.) in DMEM-F12 media for cell culture, also
the stem cell growth factor (SCF) and the leukemia inhibitory
factor (LIF). On day 3, the initial HOCs generation was cultured in
a DMEM-F12 culture mixture with 20% neonatal calf serum and on day
4, the DMEM-12 culturing media was supplemented with 20 ng/ml SCF,
10 ng/ml EGF and 10 ng/ml LIF. These cells were then cultivated in
a cell incubator at 37°C with 5% CO2.
Cell morphology observation
The cell morphology and growth of both the
experimental and the control group were examined using an inverted
phase-contrast microscope every three days (×40 and ×100
magnification), with the culture medium replaced and sub-cultured
whenever necessary.
Flow cytometry analysis
Cultured primary cells and different
differentiations of BDEs were detected using flow cytometry. Mouse
monoclonal OV-6 antibody (1:100; Santa Cruz Biotechnology, Inc.;
cat. no. sc-101863), rabbit anti-mouse CK-19 antibody (1:100;
ABclonal Biotech Co., Ltd.; cat. no. A0247) and FITC conjugated
donkey anti-rabbit antibody (1:100; ABclonal Biotech Co., Ltd.;
cat. no. AS042) were used for flow cytometry detection. Santa Cruz
Biotechnology, Inc., provided FITC-labeled goat anti-mouse
antibodies (1:50; cat. no. sc-2010) and PE-labeled goat anti-rabbit
antibodies (1:100; cat. no. sc-3739). Following centrifugation (120
× g for 5 min at 4°C), sufficient cells were suspended in PBS
buffer solution and the cell count was corrected to
1×10⁵/ml using Trypan blue (MilliporeSigma). The
specific steps were to take a straw, put it into the culture flask,
gently and repeatedly blow the cell suspension to make the cells
resuspended evenly, immediately absorb a little of the cell
suspension, drop nine drops of cell suspension into another
centrifuge tube, then one drop of trypan blue dye solution, mix
them and leave the obtained solution for ~2-3 min. The counting
plate was placed flat on the microscope stage and immediately 1–2
drops of stained cell suspension were added gently from the edge of
the counting plate to fill the space between the counting plate and
the cover glass. Microscopic observation (×40 and ×100
magnification) showed that the cells were scattered evenly and the
cell body of healthy cells was intact, transparent and
non-pigmented. All the pigmented cells were unhealthy. The number
of cells in the quadrants was then calculated. Only the left line
and the top line were counted if the center line was touched, and
the right line and the bottom line were not counted (i.e., only the
cells touching two sides were counted). The calculation was using
the following formula:
Cell count/ml of original suspension=Total number of cells in 4 large grids4
×1,000 × diluted multiples. Cell suspensions from the same
generation were deposited in three flow tubes, each consisting of a
negative control group, an OV-6 group and a CK-19 group. The
supernatant was collected and discarded after 8 min of (120 × g for
5 min at 4°C) centrifugation. A corresponding primary antibody was
added to each of the OV-6 and CK-19 group and incubated in the dark
for 30 min before oscillation with 1 ml PBS buffer. Furthermore,
before adding the corresponding secondary antibody for oscillation
and incubating the antibody in a dark environment for 30 min before
detection; an appropriate amount of cell washing solution was added
and centrifuged at 120 × g at 4°C for 8 min, the supernatant
discarded and the cells washed twice repeatedly. The cells were
resuspended with 100–200 µl PBS buffer. The blank tube and the
homologous tube were tested first and then the OV-6 and CK-19 tube
to be tested with a FlowSight® flow cytometer (model no.
00102107; Merck KGaA) and FlowJo10.8.1. (Becton, Dickinson &
Company) to analyze the data. The late apoptosis + early apoptosis
group (Q2+Q3) was used to calculate the apoptosis rate.
Immunofluorescence microscopy
analysis
In vitro, primary isolated HOCs were grown
and passaged 6–8 times. The cells were harvested and then incubated
with rabbit anti-mouse CK19 (1:150; ABclonal Biotech Co., Ltd.;
cat. no. A0247); and Cy3 conjugated goat anti-rabbit IgG (1:150;
ABclonal Biotech Co., Ltd.; cat. no. AS007); anti-mouse OV-6
antibody (1:100; Santa Cruz Biotechnology, Inc.; cat. no.
sc-101863); FCy3 conjugated goat anti-rabbit IgG (1:150; ABclonal
Biotech Co., Ltd.; cat. no. AS007). Otherwise, HOCs, 5th and 8th
BDEs were treated with rabbit anti-mouse SETD2 (1:100; ABclonal
Biotech Co., Ltd.; cat. no. A11757); Cy3 conjugated goat
anti-rabbit IgG (1:150; ABclonal Biotech Co., Ltd.; cat. no. AS007)
and rabbit anti-H3K36me3 (1:500; ABclonal Biotech Co., Ltd.; cat.
no. A2366; Cy3 conjugated goat anti-rabbit IgG (1:150; ABclonal
Biotech Co., Ltd.; cat. no. AS007). HOCs were fixed in 4%
paraformaldehyde for 15 min at 37°C with oscillation and washed
three times (each time 5 min) and ruptured within 30 min. The HOCs
were then washed three times (5 min each time) with PBS at 37°C
with oscillation, followed by a 37°C incubation in the dark for 20
min and then kept in a 4°C refrigerator (in the dark) overnight.
The following day, the primary antibody working solution was
aspirated and washed three times with PBS and oscillation at 37°C
(5 min each time). The fluorescence-labeled goat anti-rabbit
antibody was diluted 1:100 and incubated at 37°C in the dark for 30
min. Finally, the solution was rinsed three times with PBS and
oscillation (5 min each time) and was evaluated using an
immunofluorescence detector (Olympus Corp.) and FlowJo10.8.1
software (Becton, Dickinson & Company), and mean fluorescence
intensity was quantified using ImageJ v1.8.0 (National Institutes
of Health).
Confocal microscope
In order to further verify the specific location of
SETD2 and H3K36me3 distribution in cells, microscopic confocal
observation was used. The third generation of BDEs was chosen as
the experimental subject. A total of 1×10⁵ cells/ml cell
suspension was prepared from DMEM/F12 medium containing 10% calf
serum, and inoculated in confocal culture dishes with clean sterile
cover slides, and cultured in a cell incubator at 37°C with 5%
CO2 overnight. The slides were washed twice with PBS and
2 µl rabbit anti-mouse SETD2 (ABclonal Biotech Co., Ltd.; cat. no.
A11757) and rabbit anti-H3K36me3 (ABclonal Biotech Co., Ltd.; cat.
no. A2366) were added and incubated at room temperature for 40 min.
The slides were washed twice with PBS and then 4 µl Cy3-conjugated
goat anti-rabbit IgG (ABclonal Biotech Co., Ltd.; cat. no. AS007)
was added at room temperature for 30 min. The slides were washed
with PBS three times, before adding 2 µl DAPI dye solution for 5
min and washing with PBS another three times. The slides were
sealed with a drop of 90% glycerin. An upper confocal microscope
(Leica Microsystems, Inc.) was used to view the images and scan
them using the Leica TCS SP8X system (Leica Microsystems,
Inc.).
Endogenous nucleosome
purification
To purify endogenous mono-nucleosomes, cell nuclei
were isolated using hypotonic solution [5 mM HEPES, 10 mM KCl, 5 mM
MgCl2, 0.5 mM EDTA, 1 mM 2-mercaptoethanol, 0.4 mM
phenylmethylsulfonyl fluoride (PMSF), 1 mM benzamidine and 1 mM
sodium metabisulfite] followed by centrifugation at 2,700 × g for 5
min at 4°C. Nuclei were re-suspended in 30 ml of buffer A (15 mM
HEPES, 30 mM KCl, 3 mM CaCl2, 3 mM MgCl2, 1
mM 2-mercaptoethanol and 0.4 mM PMSF) and incubated with MNase at
4°C for 15 min. Ca2+ ions were chelated by adding EDTA,
EGTA and KCl to a final concentration of 5, 3 and 300 mM
respectively to stop MNase reaction. FLAG-tagged H3-containing
mono-nucleosomes were purified by incubating with αFLAG M2 beads
for 2 h. Mono-nucleosomes were recovered from the beads by eluting
with 3XFLAG peptide at 500 ng/ul in a buffer containing 20 mM
HEPES, 1 mM EDTA, 10% Glycerol, 150 mM NaCl, 0.01% NP-40, 1 mM
2-mercaptoethanol and 0.4 mM PMSF. Finally, NaCl concentration was
brought down to 50 mM using dialysis.
Histone protein analysis
Assays on mono-nucleosomes extracted from HOCs and
BDEs was performed. Cells were harvested and washed twice with
ice-cold PBS. To maintain the histone acetylation levels, PBS and
subsequent buffers were added with 5 mM sodium butyrate. Cells were
resuspended at 107 cells per ml in Triton Extraction
Buffer (TEB; PBS containing 0.5% Triton X 100 (v/v), 2 mM PMSF and
0.02% (w/v) NaN3) and cells lysed for 10 min on ice with
moderate shaking. To recover the nuclei, centrifugation at 650 × g
for 10 min at 4°C was performed. The supernatant was then removed
and discarded. The nuclei were centrifuged at 650 × g for 10 min at
4°C in half the volume of TEB. The pellet was resuspended to a
density of 4×10⁷ nuclei per ml in 0.2 N HCl. The
histones were acid extracted at 4°C overnight. The debris was
pelleted by centrifuging samples at 650 × g for 10 min at 4°C. The
supernatant (which contains the histone protein) was saved and the
HCl neutralized with 2M NaOH at 1:10 of the supernatant volume. The
Bradford test was used to determine the protein content, with the
rabbit polyclonal anti-mouse H3K36me3 antibody (1:500; ABclonal
Biotech Co., Ltd.; cat. no. A2366) and rabbit polyclonal anti-mouse
Histone H3 antibody (1:500; ABclonal Biotech Co., Ltd.; cat. no.
A2348) used as the primary antibody and horseradish peroxidase
(HRP)-conjugated anti-rabbit (1:2,500; ABclonal Biotech Co., Ltd.;
cat. no. AS014) employed as a secondary antibody. A 15% Bis-Tris
gel, 1.0-mm thickness, was used for histone western blotting
electrophoresis, and 5 µg sample was loaded in every lane, which
includes the pre-stained protein standard. The gel was placed in
MES SDS running buffer at 200 volts for 35 min. For effective
histone protein retention, pore-sized porous nitrocellulose
membranes with a diameter of 0.2 cm were used. The membrane was
blocked with 5% BSA/0.1% TBST [50 mM Tris-HCl (pH 7.5) and 150 mM
NaCl, 0.1%] for 1 h at room temperature (50 mM Tris-HCl, pH 7.5,
150 mM NaCl, 0.1%). The membrane was divided into strips and
treated for 20 min at room temperature with primary antibody that
had been diluted in blocking buffer (5% BSA/0.1% TBST). The
membrane containing the primary antibody was stored for 16 h at
4°C. The blots were briefly rinsed with 0.1% TBST, then the same
buffer was used for two 5-min washes and two 10-min washes. After
diluting the secondary antibody in 1% BSA/0.1% TBST, the membrane
was incubated for 1 h at room temperature. In 0.1% TBST, the
membrane was washed twice for 5 min and twice for 10 min. Clarity
Western ECL blotting substrate was used for the study of histone
proteins (Bio-Rad Laboratories, Inc.). Images were captured using
autoradiography film or the Bio-Rad ChemidocMP (Bio-Rad
Laboratories, Inc.) imaging equipment and the blots were analyzed
using Bio-Rad Image Lab 5.0 software (Bio-Rad Laboratories,
Inc.).
Reverse transcription-quantitative
(RT-q) PCR
Cells were seeded into 6-well plates at
0.7×10³ cells/well. The total RNA was isolated according
to the manufacturer's protocols using the RNAqueous micro kit (cat.
no. AM 1931; Ambion; Thermo Fisher Scientific, Inc.). For cDNA
synthesis, a high-capacity cDNA reverse transcription kit (cat. no.
4368814; Applied Biosystems; Thermo Fisher Scientific, Inc.) was
used according to the manufacturer's protocols. The ABI Prism 7300
sequence detection system (Applied Biosystems; Thermo Fisher
Scientific, Inc.) was used to run qPCR for SETD2 (Assay ID:
Rn00562048 m1) in accordance with the instructions of the
manufacturer using the ChamQ SYBR qPCR Master Mix (cat. no.
Q311-02; Vazyme Biotech, Co., Ltd.). Endogenous control was GAPDH;
mSETD2: Sense 5′-3′CATAGCTGTGAACCAAACTGTGA; antisense
5′-3′TAATTCTGAGCCTGAAGGAACTA; GAPDH: Sense
5′-3′AGGTCGGTGTGAACGGATTTG; antisense 5′-3′TGTAGACCATGTAGTTGAGGTCA.
The total volume of each reaction was 20 µl. The PCR thermocycling
conditions were as follows: 95°C for 5 min, with 40 cycles of 95°C
for 10 sec, 58°C for 30 sec and 70°C for 10 sec. In a 20-µl
reaction volume, all samples were run in triplicate and the results
were calculated as threshold cycle (CT) values. The expression
levels were calculated using delta CT. The data were determined as
the mean of three independent measurements and the relative mRNA
expression level was determined with the 2−ΔΔCq model
(16).
Western blot analysis
For full lapping cleavage, 0.020 g of cells were
mixed with RIPA lysis (Beyotime Institute of Biotechnology) and
supernatant was obtained after centrifugation at 1,400 × g at 4°C
for 20 min. The protein content was determined using the BCA method
(Tiangen Biotech Co., Ltd.) and protein samples were generated. A
10% SDS-PAGE gel was generated for sample separation. A 100-ng
quantity of total protein extracts were loaded per lane, After
electrophoresis, the protein extracts were transferred onto PVDF
membranes, and then the PVDF membranes were blocked with blocking
reagent (5% skimmed dried milk) for 1 h at room temperature. The
primary antibodies were added and incubated overnight at 4°C in a
shaking table: Rabbit polyclonal anti-mouse SETD2 antibody
(1:1,000; ABclonal Biotech Co., Ltd.; cat. no. A11757) and rabbit
polyclonal anti-mouse Histone H3 antibody (1:500; ABclonal Biotech
Co., Ltd.; cat. no. A2348). The TBST membrane was cleaned.
Following incubation with HRP-conjugated anti-rabbit antibodies
(1:2,500; ABclonal Biotech Co., Ltd.; cat. no. AS014) for 1 h at
room temperature, the TBST membrane was washed and an ECL kit
(Fdbio Science) development was used; a Bio-Rad Laboratories, Inc.
gel imaging system was employed and the gray value of each strip
was analyzed using ImageJ 1.6 software (National Institutes of
Health). The target protein to anti-Histone H3 was used as an
internal reference.
Label-free proteomic analysis
To clarify how functional proteins alter throughout
the directed differentiation of HOCs into BDEs, a thorough
proteomics method was used for hepatica oval cells and BDEs to
determine the functional protein connections between HOCs and BDEs.
HOCs were chosen as the control group and cell shape changed with
each generation, including cells in the fourth and eighth
generations of the experimental group. The first stage of cell
sample processing was as follows: The cells were trypsinized and
harvested. For 1×10⁶ cells, 400 µl lysis buffer (7M
urea, 2M thiourea, 0.1% PMSF, a protease inhibitor, 65 mM DTT) was
added and the sample sonicated on ice. Ultrasound conditions were:
70–75 W ultrasound, 5 sec ultrasound, 10 sec rest and 3–5 times
ultrasound after 40 min on ice. The supernatant was centrifuged for
30 min at 14,00 × g and 4°C, which is a two-step process to protein
quantification. The concentration of isolated protein was
determined using the Bradford method. The sample was diluted with
lysis buffer until the final concentration was within the range of
the standard. The diluted sample and standard (10 µl; dissolved
with BSA into a series of concentrations of the standard protein in
lysis buffer) and 300 µl of protein quantitative dye (Coomassie
Brilliant Blue G-250; cat. no. B802204; Shanghai Macklin
Biochemical, Co., Ltd.) were reacted in the dark for 15–20 min
before measuring the absorbance of the standard and sample at 595
nm with a microplate reader. A standard curve was obtained based on
the relationship between the absorbance and concentration of each
standard tube. SDS-PAGE electrophoresis was accomplished in three
phases. To control the cell sample volume: 2X Loading buffer volume
(5:1) was mixed well and then the proteins denatured at 100°C for 8
min. In general, the maximum sample volume for each electrophoresis
lane was 30 µl, the lowest amount of protein loaded in each
electrophoresis lane (each protein band) was 0.1 µg (Coomassie
brilliant blue staining) to 2 ng (silver staining) and the maximum
protein amount (protein mixture) was 20–40 µg; 150–160 V was used
for 1 h at 90°C. Enzymatic cleavage of peptides involved four
stages. The samples were separated into five divisions using
Coomassie brilliant blue dyed gel. Then, the gel was cut into 1–2
mm2 films with a knife and placed in tiny vials. To
soak, 200 µl of the decolorizing solution was added and shaken for
10 min and was then removed. The steps were repeated 1–2 times
until the blue color faded. Acetonitrile (200 µl) was added and the
waste solution discarded. A total of 100 µl LDTT reduction solution
was added for 30 min at 56°C, then the waste liquid discarded and
200 µl acetonitrile added for 5–10 min of dehydration.
Iodoacetamide (100 µl) was added for alkylation in the dark for 30
min, followed by 100 µl of decolorization solution, washing with
water for 5–10 min, acetonitrile (100 µl) was added, the waste
solution discarded and the sample was washed three times with water
and acetonitrile before freeze-drying for 20 min. Then, 50 µl of
enzyme solution (0.01 ug/µl) was added and left at 4°C for 30 min.
After that, 50–100 µl of enzymolysis buffer (25 mM
NH4HCO3) was added and when the enzyme
solution was entirely absorbed the gel was completely immersed and
maintained at 37°C for at least 15 h or overnight. Extract I (100
µl; 5% TFA) was added and heated it for 1 h in a water bath at 40°C
and sonicated for 3 min at 30 min at 20 kHz in 40°C. The extract
was aspirated into another clean tube, freeze-dried and then 100 µl
of Extract II (50% acetonitrile; 2.5% TFA) added to block the gel
which was incubated at 30°C for 1 h, then sonicated for 3 min at 20
kHz in 40°C. The extracts were combined, blown to dry the
acetonitrile with nitrogen, and freeze-dried. TFA solution (5–10
µl; 0.1%) was added, thoroughly stirred and analyzed using mass
spectrometry. The gel glass plate was removed from the
electrophoresis device and stained for 1 h with Coomassie brilliant
blue before distaining. Generally, there are five steps involved in
performing Liquid Chromatography with tandem mass spectrometry
(LC-MS-MS). In the present study, the high pH reverse phase
separation fractions were reconstituted with 20 l of 2% methanol
and 0.1% formic acid, which were then centrifuged at 13,00 × g for
10 min at 4°C and aspirated. The supernatant was loaded. The sample
volume was 10 µl and it was loaded at a loading flow rate of 350
nl/min for 15 min using the sandwich approach. The flow rate of
separation was 350 nl/min and the separation gradient was as shown
in Table I.
 | Table I.Separation gradient analysis by
liquid chromatography with tandem mass spectrometry. |
Table I.
Separation gradient analysis by
liquid chromatography with tandem mass spectrometry.
| Time, min | Mobile phase B
ratio, % |
|---|
| 0 | 4 |
| 5 | 15 |
| 40 | 25 |
| 65 | 35 |
| 70 | 95 |
| 82 | 95 |
| 85 | 4 |
| 90 | 4 |
The raw data were processed using the Proteome
Discoverer 2.5.0.400 software (Thermo Fisher Scientific, Inc.).
Protein identification analysis was performed based on the data
available in the UniProt protein sequence database for the Homo
sapiens Proteome 2020_05 with 75,069 entries and a common
contaminant database from MaxQuant (version 1.6.2.6, Max Planck
Institute of Biochemistry). A heatmap was visualized using the
‘heatmap.2’ function from the ‘gplots’ R-package and R language
(https://www.r-project.org/) ‘cor’
function to compute correlation proteins for correlation analysis.
Metascape, a web-based resource (http://metascape.org), was used to conduct Gene
Ontology (GO) analysis and the Kyoto Encyclopedia of Genes and
Genomes (KEGG) Orthology-Based Annotation System (KOBAS) online
analysis tool (http://kobas.cbi.pku.edu.cn/) was used to perform KEGG
pathway analyses. Database enrichment analysis was performed using
the UniProtKB database (Release 2016 10). GO enrichment included
three ontologies [biological process (BP), molecular function (MF),
and cellular component (CC)]. In addition, protein-protein
interaction (PPI) analysis was performed using STRING software
(http://string-db.org/).
Statistical analysis
Data were analyzed with one-way ANOVA for
comparisons of multiple groups followed by Tukey's multiple
comparisons test using Prism (version 7; GraphPad Software;
Dotmatics). All data were assessed for distribution normality using
the Shapiro-Wilk test. The results were expressed as the mean ±
standard deviation. P<0.05 was considered to indicate a
statistically significant difference.
Results
HOCs morphological features in the
original generation and differentiation into BDEs
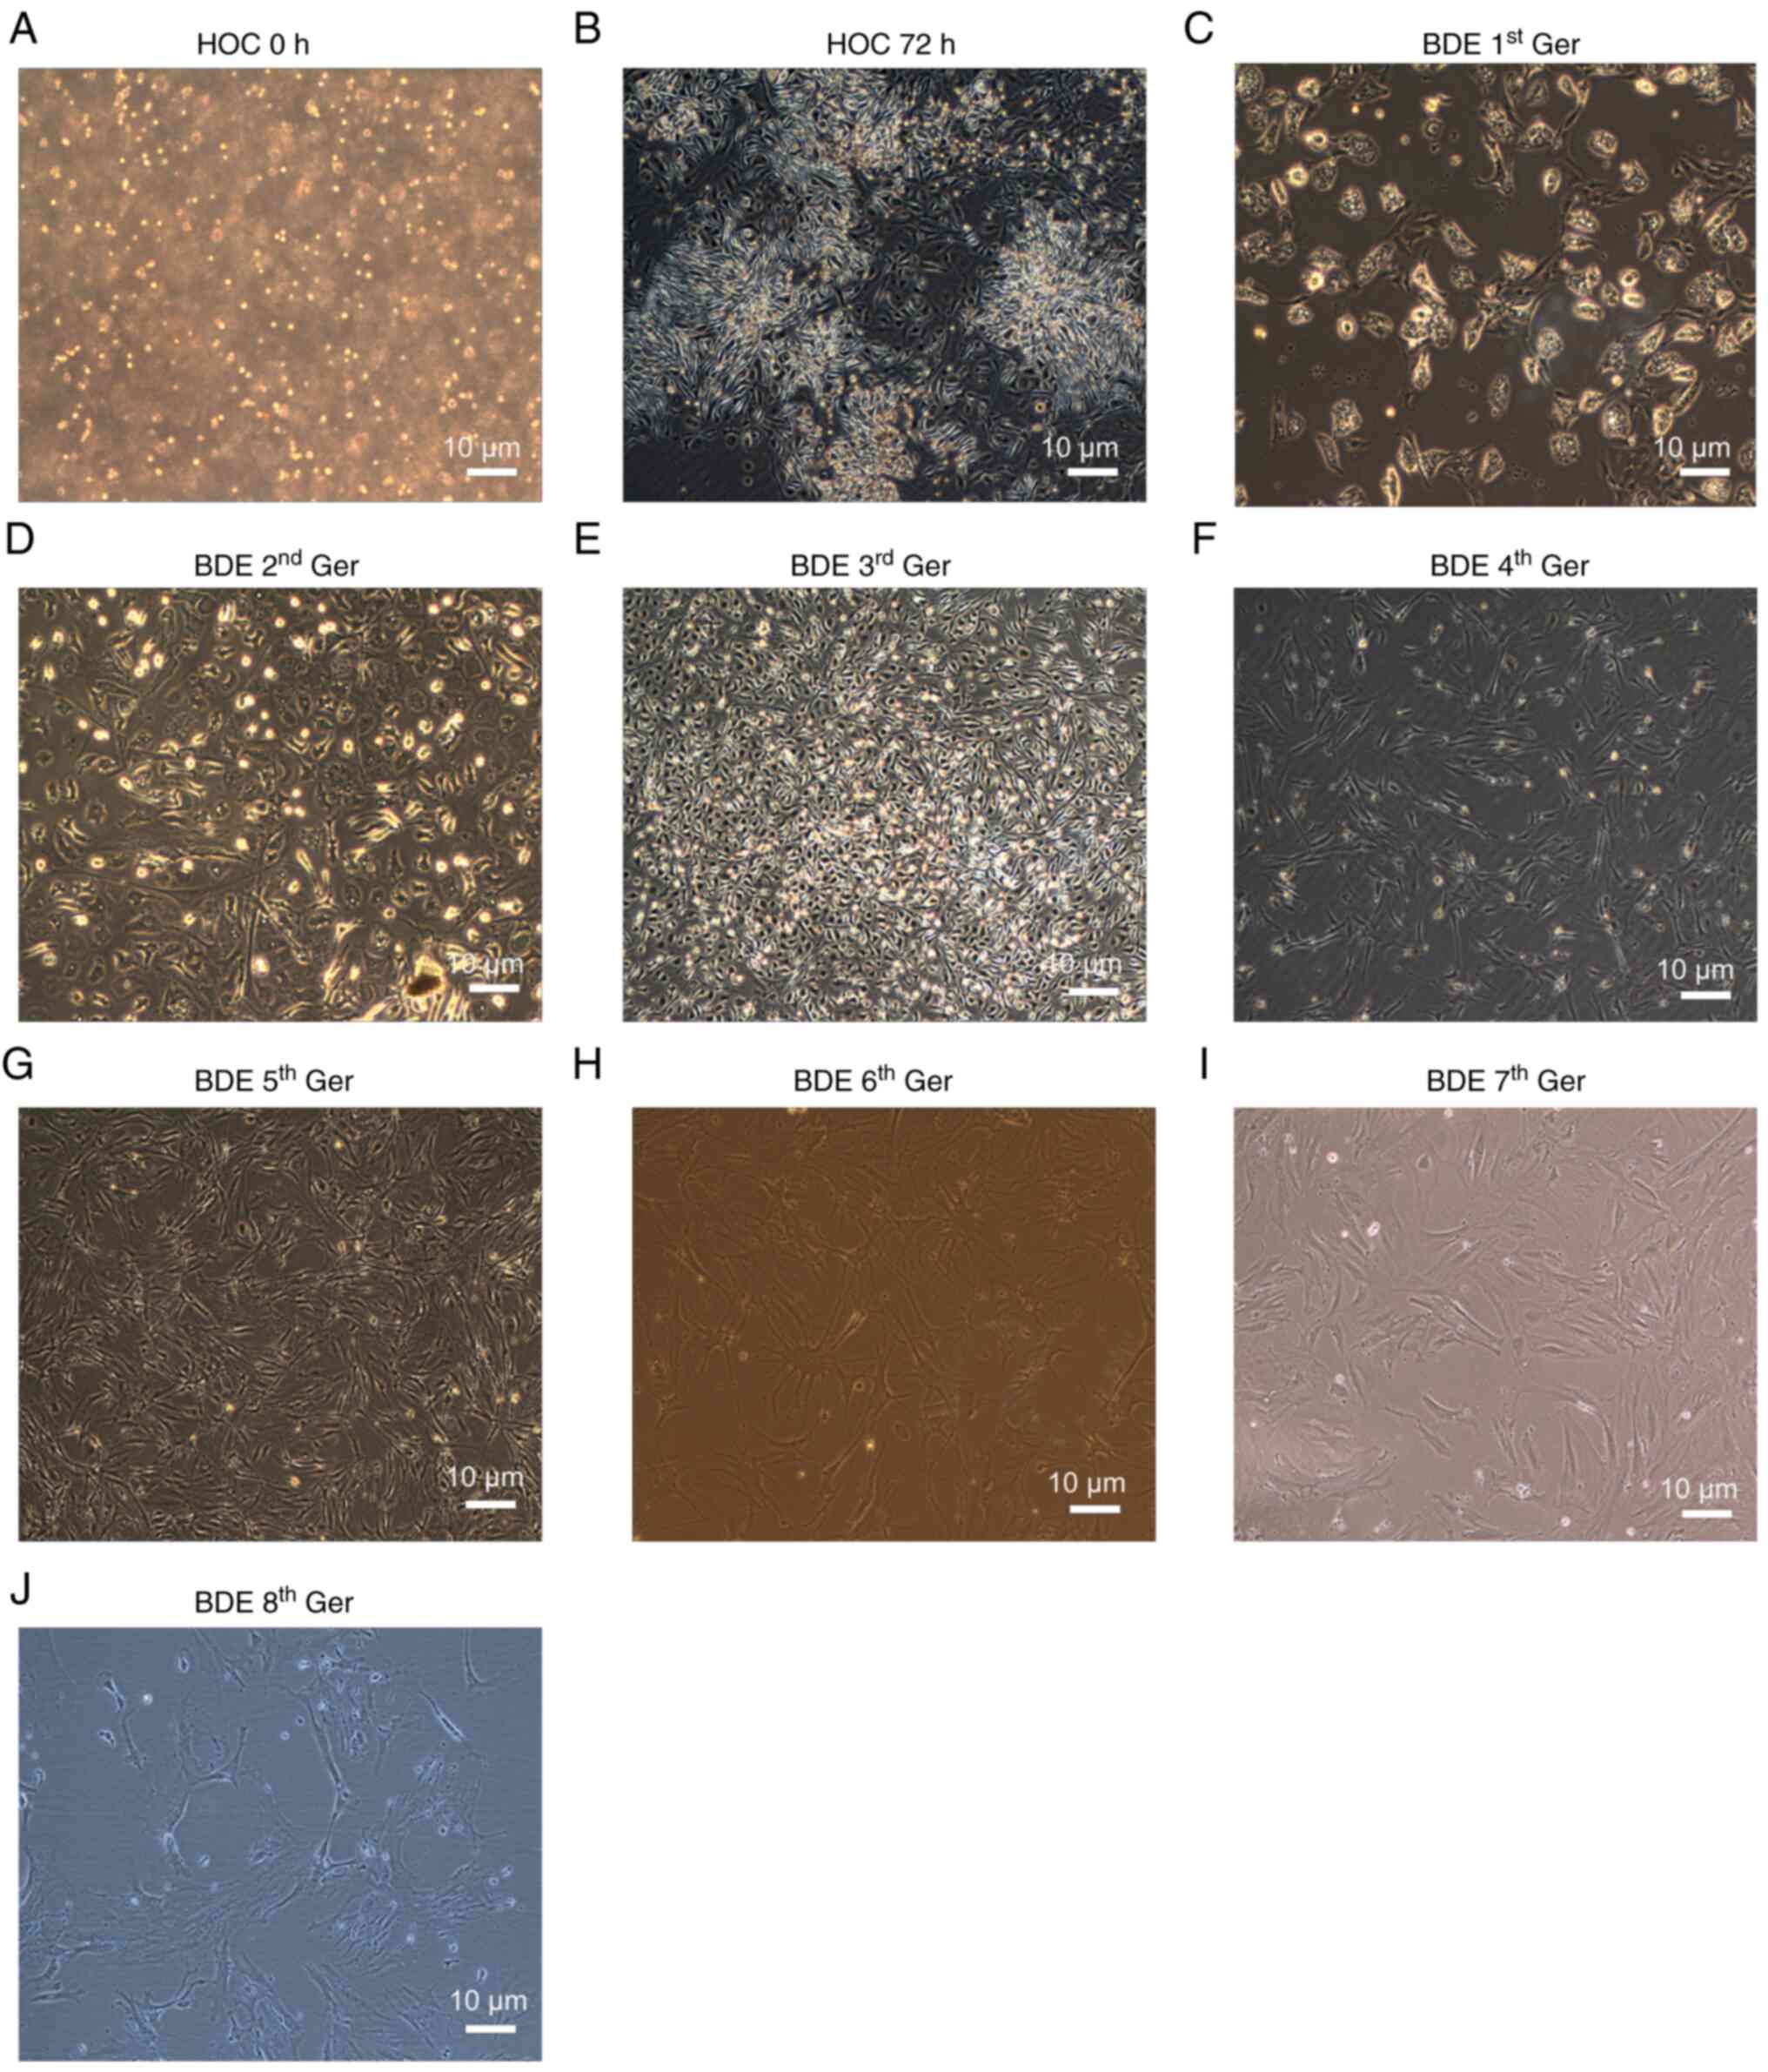
A modified two-step enzyme digestion method
established proliferation of HOCs in the mouse model using the
2-AAF/PH method. After the separation of HOCs under light
microscopy, the cells were found to be oval and the cell volume was
small, with large nuclear/cytoplasmic ratios. Bulkier oval cells
(Fig. 1A) were also observed.
However, rapid cell growth of the first generation typical colony
formation was observed after being combined with the culture medium
containing cytokines for 3 days (Fig.
1B). During the process, the nucleus was gradually increased
(Fig. 1C). When the cell culture
passed to the 2nd and 3rd generation, a number of cells were
irregular-shaped, with a large cell volume and a high cell quality.
Some cells had apparent nuclei (Fig.
1D and E). The 4th and 5th generation of BDEs was
differentiated, the cell mass was significantly enlarged and the
cell volume was increased gradually (Fig. 1F and G). When the passage to 6, 7
and 8th generation of BDEs was induced and differentiated, changes
were found in bile duct epithelium and multiple ‘pseudopodia’-like
growth and the induced HOCs were not layered at the bottom of the
cell culture flask, but presented a certain three-dimensional
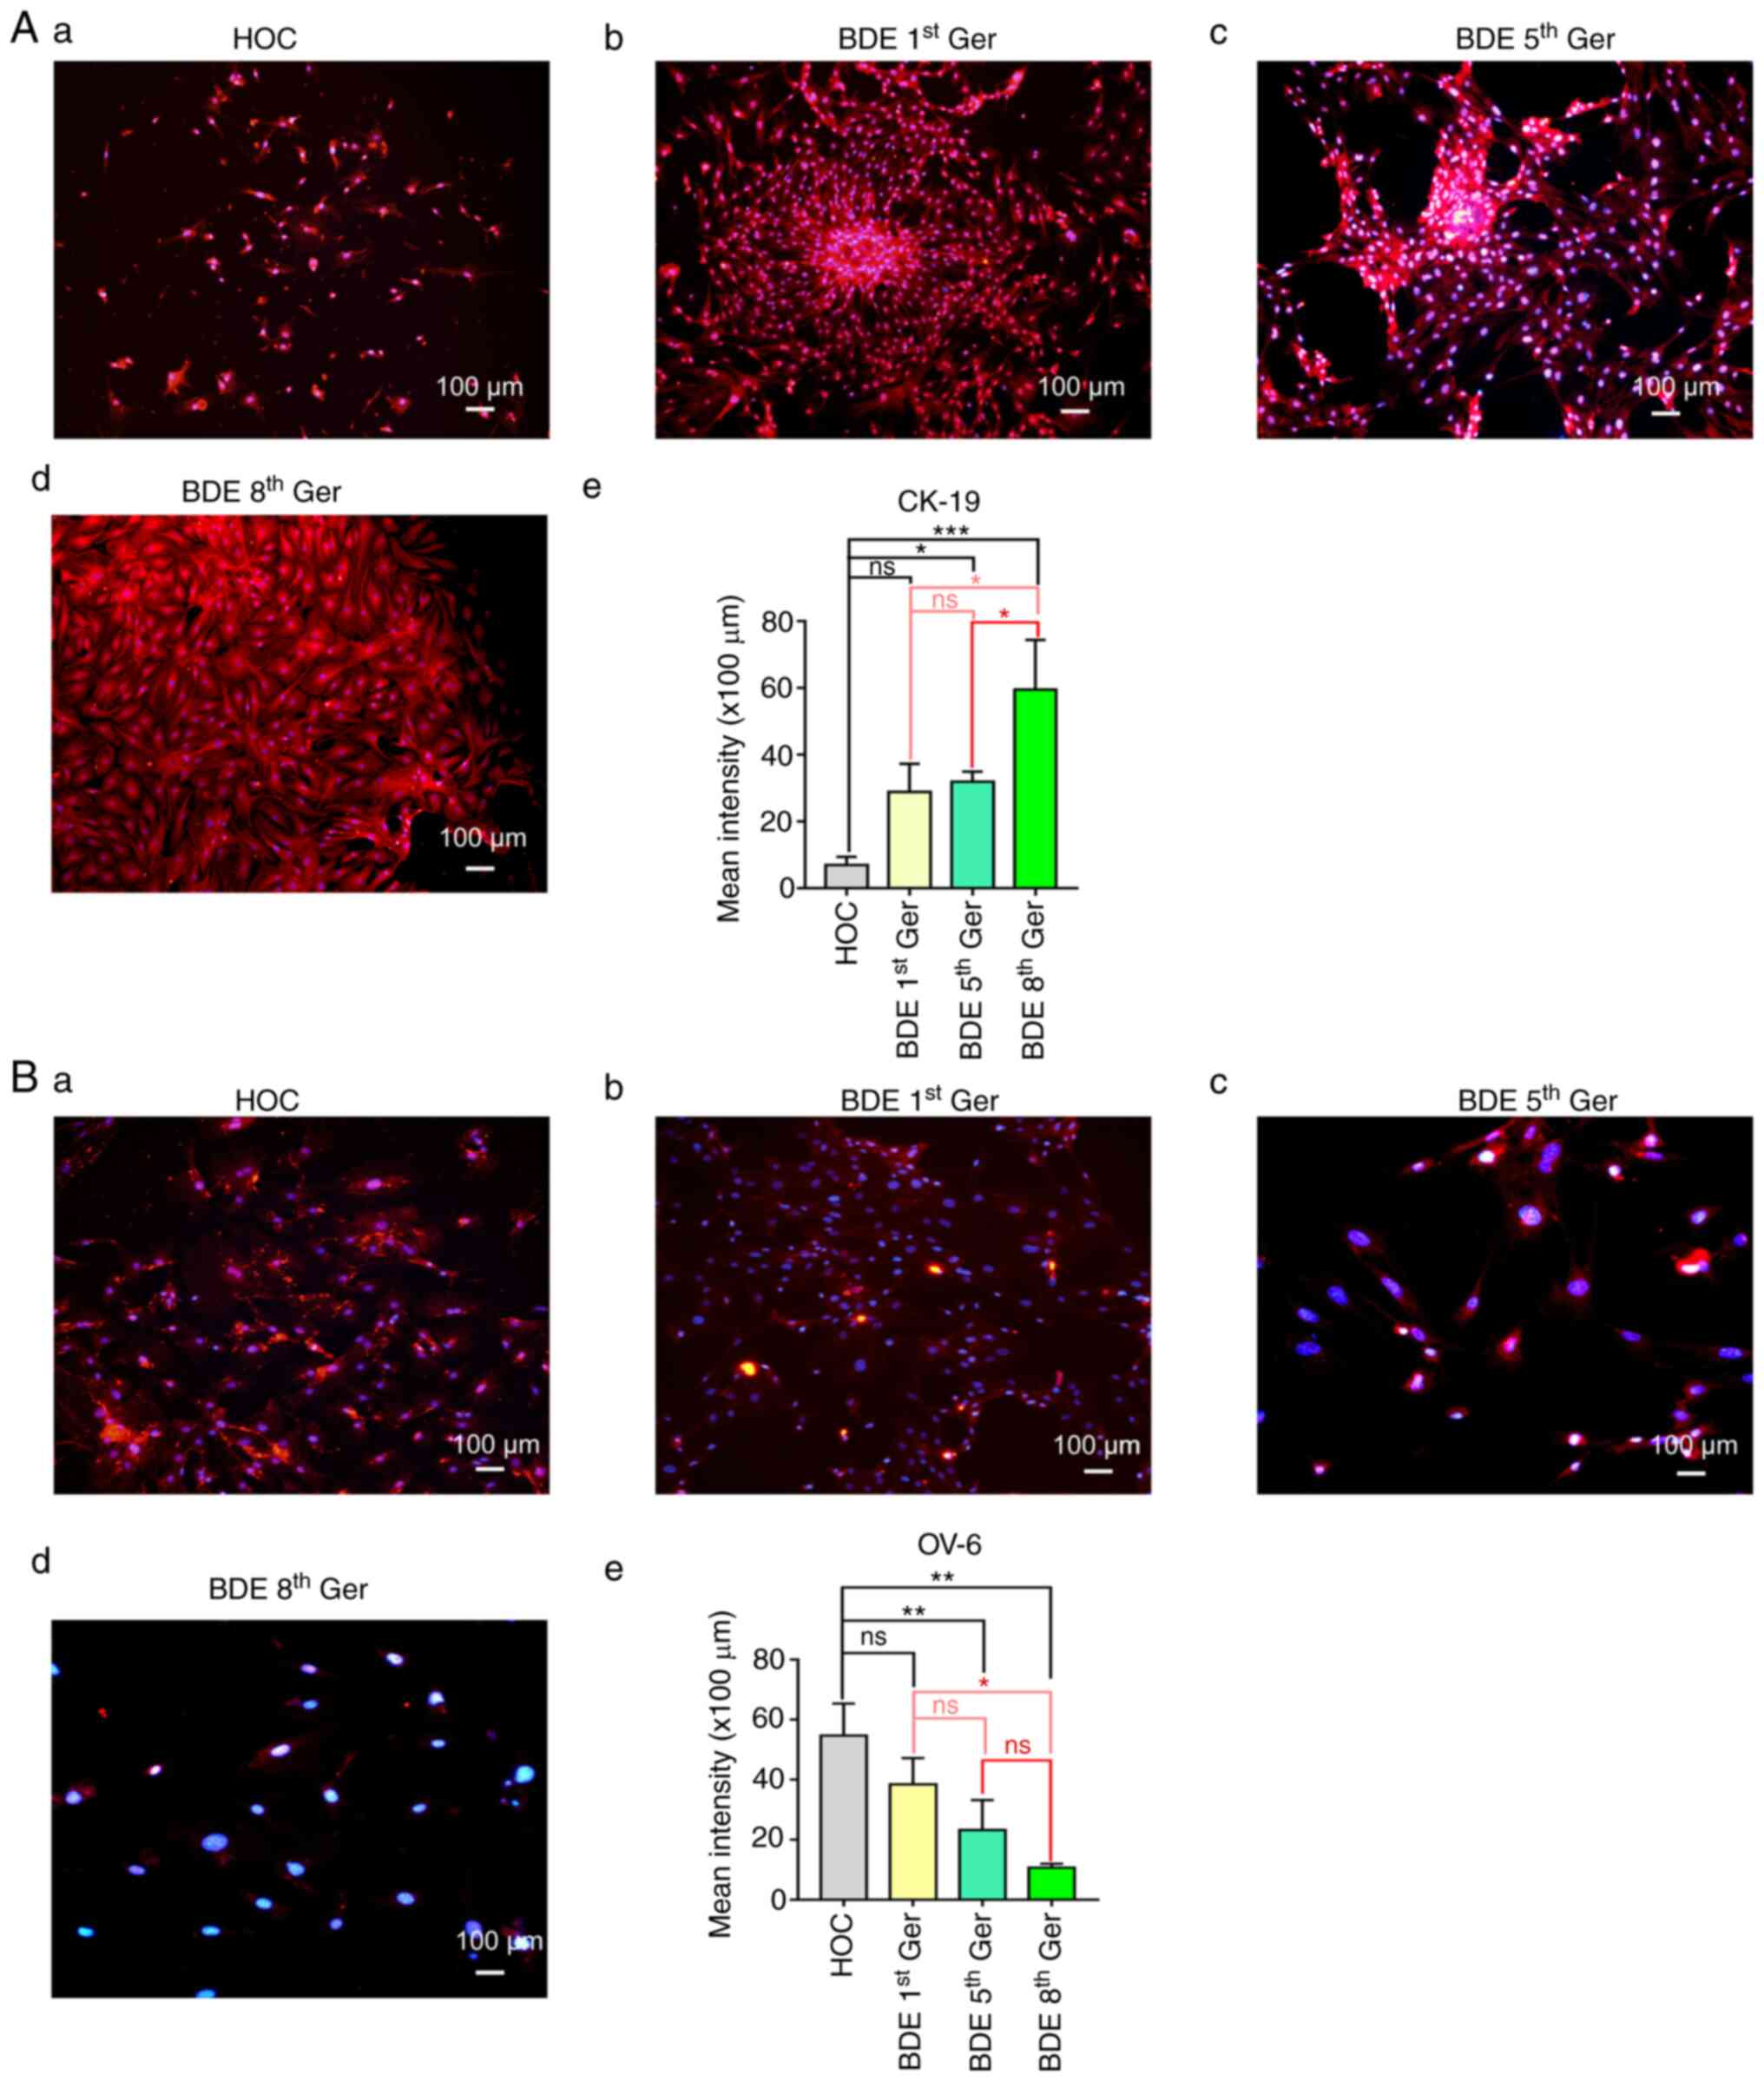
structure (Fig. 1H-J). To confirm
that the isolated and differentiated cells were HOCs and BDEs, OV-6
and CK-19 were used in immunofluorescence microscopy and flow
cytometry, which marked BDEs and HOCs. As the results revealed,
CK-19 positive cells were gradually increased while, on the
contrary, the OV-6 positive cells showed a significant decrease
from 1st bile duct epithelium cells generation. (P<0.05;
Fig. 2Aa-e; Fig. 2Ba-e and Table II; detailed flow cytometry shown
in Fig. S1).
| Table II.Results of OV-6 and CK19 flow in
different generations of BDEs induced in vitro mouse HOCs
differentiation. |
Table II.
Results of OV-6 and CK19 flow in
different generations of BDEs induced in vitro mouse HOCs
differentiation.
|
|
| Cell
generations |
|---|
|
|
|
|
|---|
| Molecular
markers | Number of
cases | HOC | BDE 5th Ger | BDE 8th Ger |
|---|
| OV-6 | 3 | 76.60±3.14 |
37.10±3.21a |
1.65±0.14a,b |
| CK-19 | 3 | 6.15±4.29 |
53.24±6.60a |
96.38±1.23a,b |
Changes of SETD2/H3K36me3 expression in mice liver
oval cells induced to differentiate into BDEs in vitro.
Although SETD2 and H3K36me3 have been confirmed to have significant
effects on cell differentiation, such as in hematopoietic stem
cells (17) and bone marrow
mesenchymal stem cells (18),
changes in the expression of SETD2 and H3K36me3 during HOCs
differentiation into BDEs have not been examined, to the best of
the authors' knowledge. In order to investigate the role of SETD2
and H3K36me3, HOCs were induced to be differentiated into BDEs
in vitro. First, it was found through culture of HOCs and
induced differentiation of BDEs that the general shapes of cells
were not so different on the two continuous passages, indicating
that the markers expression might be identical between the two
neighboring passages. Hence, passages 5 and 8, which were
distinguishable on the shapes as the experimental targets were
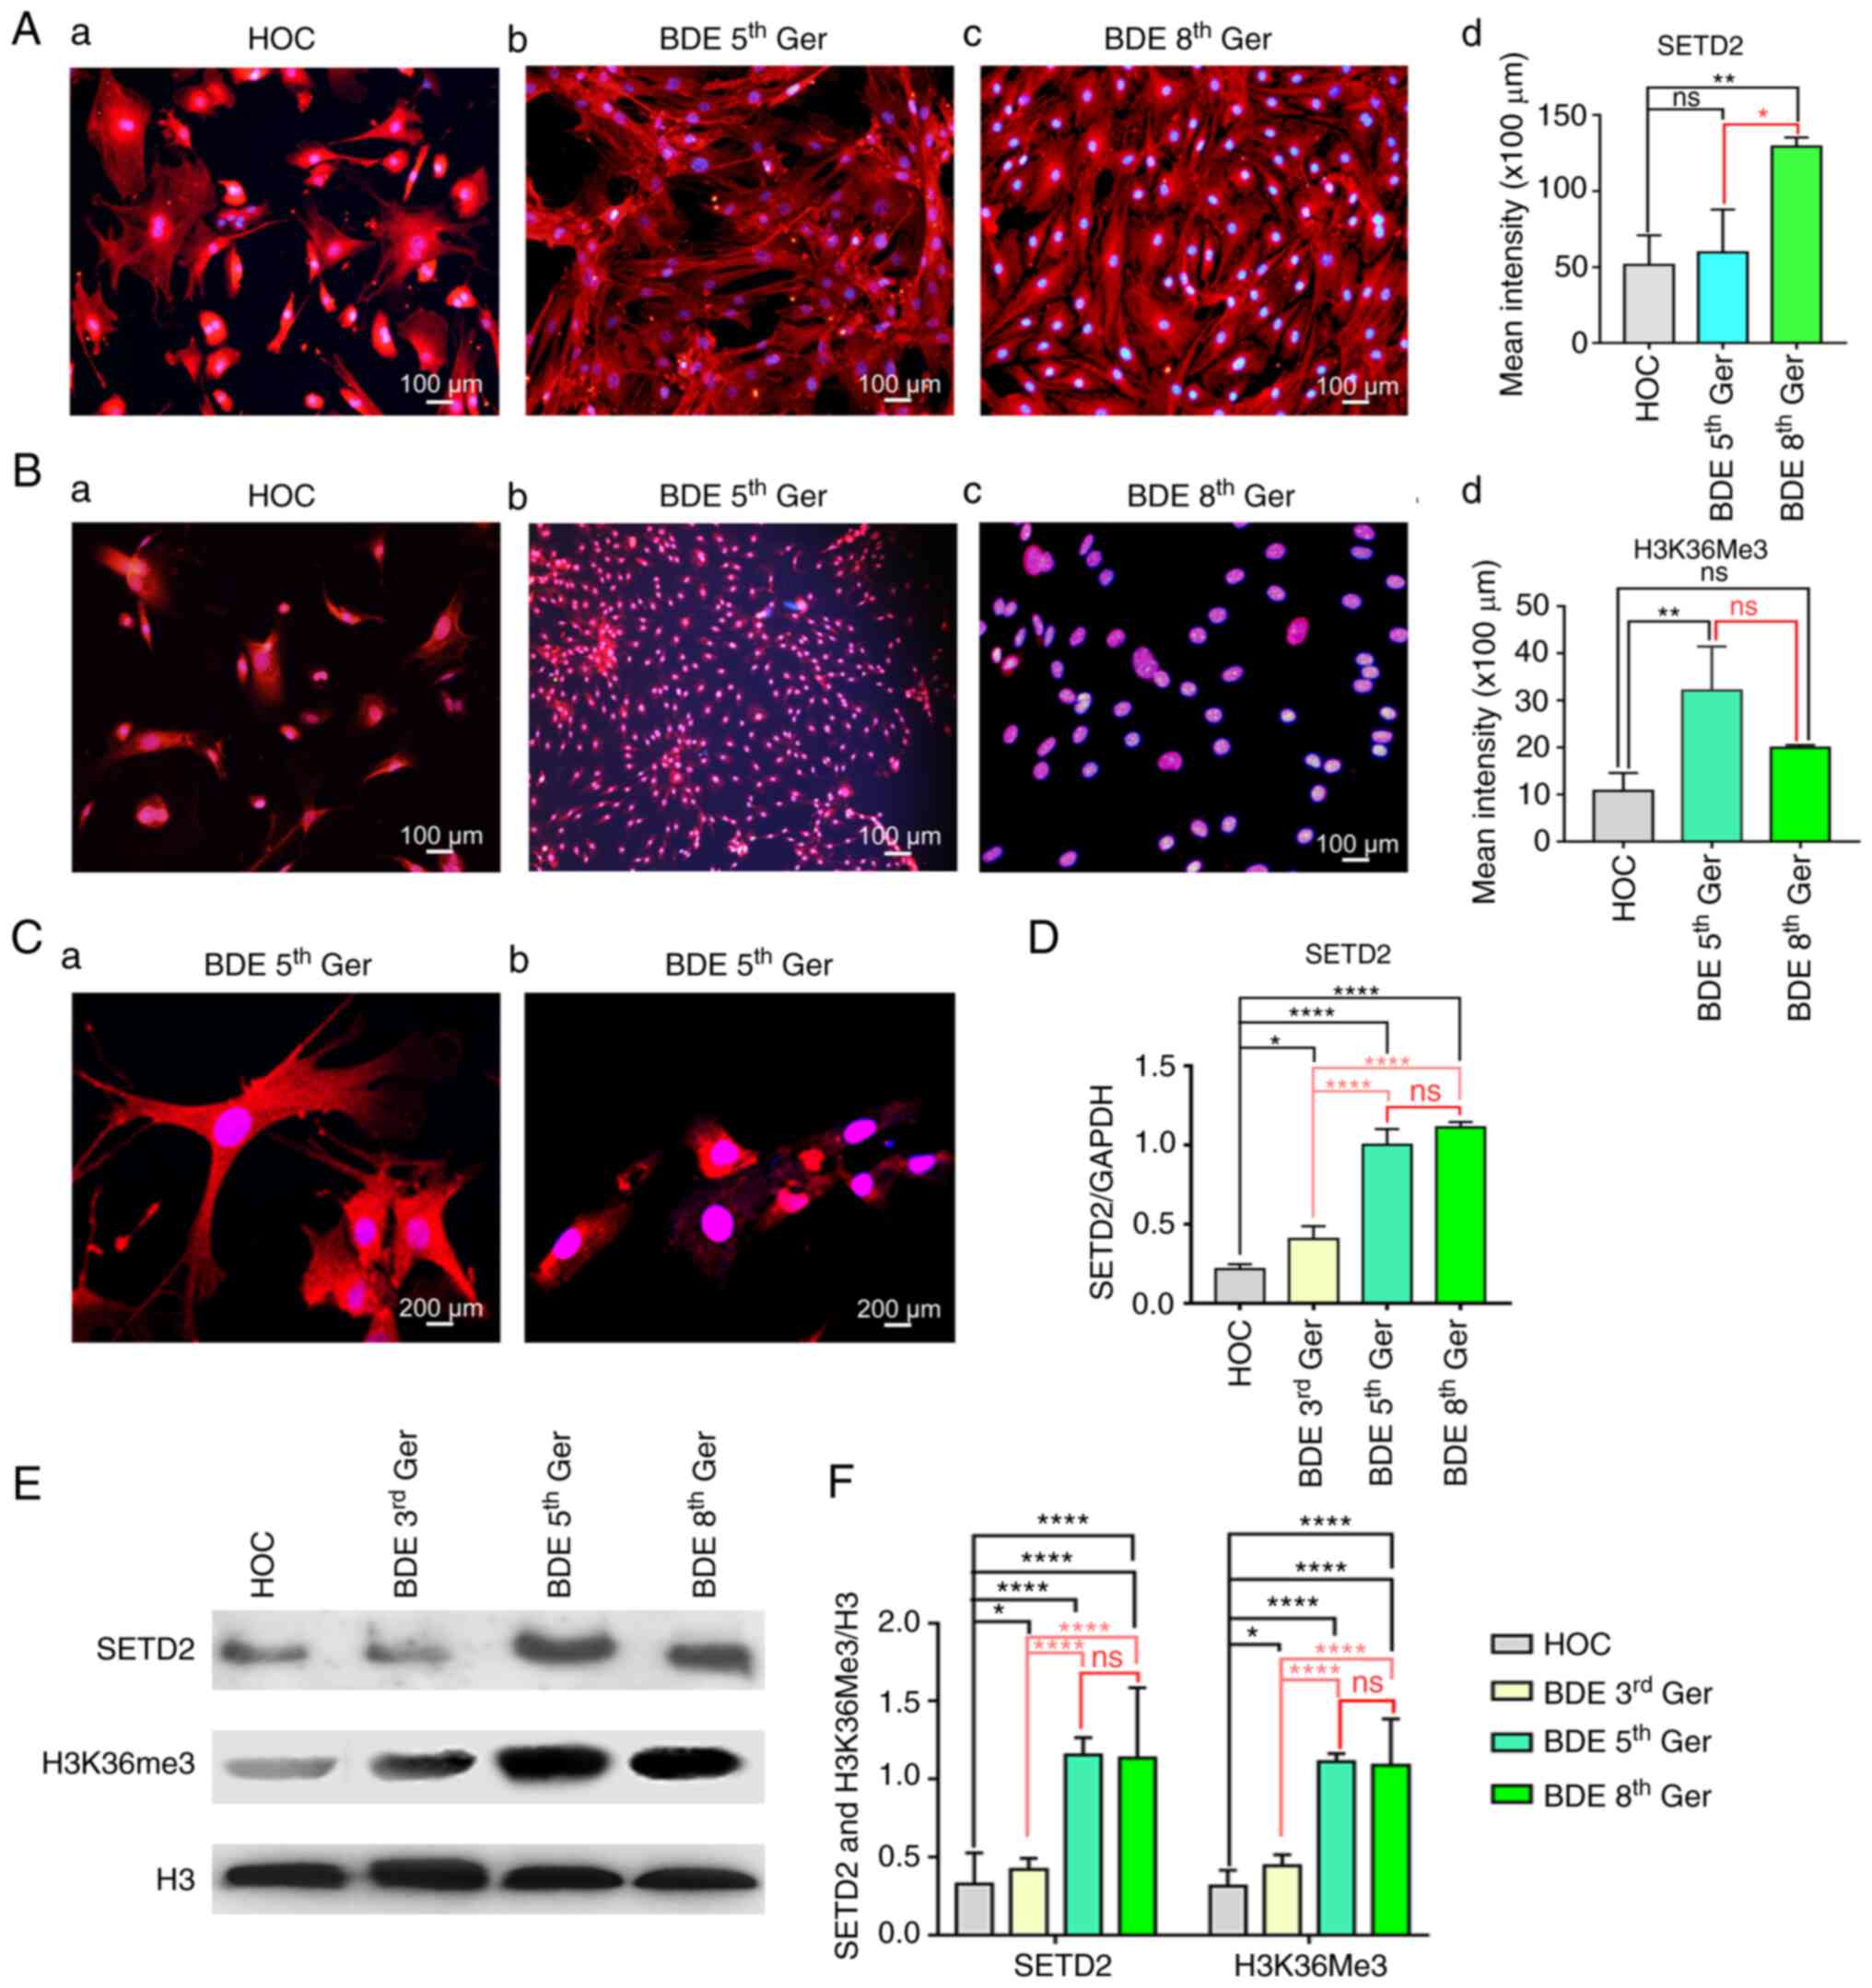
selected to explore the key proteins expression. Immunofluorescence
analysis of the cell location and expression was conducted with
SETD2 and H3K36me3 in primary oval cells obtained from liver
samples having undergone 2AAF/PH and committed differentiation bile
duct cell passages 5 and 8 using EGF 20 µg/l + SCF 10 µg/l + LIF 10
µg/l protocol. It was confirmed that SETD2 and H3K36me3 were, in
fact, observed at all time points during committed differentiation
(P<0.05; Fig. 3Aa-d and Ba-d).
However, SETD2 was expressed in the cell nucleus and cell cytoplasm
and had increased significantly since the primary generation
(Fig. 3Aa-d). By contrast,
H3K36me3 was mainly expressed in the cell nucleus as the
differentiation process gradually increased (Fig. 3Ba-d). To confirm the
immunofluorescence results, Confocal microscopy was used to test
the SETD2 and H3K36me3 cell location in the third generation of
BDEs. The conclusion seemed to be that the immunofluorescence
showed that SETD2 was mainly expressed in the nucleus and
cytoplasm, while H3K36me3 was mainly expressed in the nucleus
(Fig. 3Ca and b). Next, RTqPCR
analysis of cDNA obtained from the cells differentiation over
generations clarified that SETD2 mRNA was gradually increasing and
being stabilized during the progress of HOCs differentiation into
mature BDEs (Fig. 3D). Western
blotting was used to test SETD2 and H3K36me3 proteins in primary
oval cells obtained from liver samples which had undergone 2AAF/PH
and differentiated BDEs generation 5 and 8 using EGF 20 µg/l + SCF
10 µg/l + LIF 10 µg/l protocol (Fig.
3E and F). Analysis of these protein levels in Fig. 3E revealed that the expression of
SETD2 and H3K36me3 in 3rd generation BDEs, compared to that of mice
primary HOCs, was increased by ~35%. In the 5 and 8th generation
mature BDEs, both were increased by ~75% and tended to be
stabilized.
Label-free test of the hub proteins
during the differentiation of HOCs into BDEs
As expected, SETD2 and H3K36me3 presented
significantly increased expression during the progress of HOCs
differentiation into BDEs. To further confirm the mechanism of both
SETD2 and H3K36me3 increasing in the presence of HOCs committed
into BDEs, a protein chip was performed to search deferentially
expressed proteins using the label-free technology method, which is
a widely used method for protein identification and which couples
prefractionation of protein samples by one-dimensional PAGE with
LC/MS/MS (16). Following this
method, the protein detection of the HOCs, the 4th generation BDEs
and the 8th generation BDEs was performed. Each sample was repeated
three times.
On the basis of the label-free LC-MS/MS data, a
total 162,294 unique peptides and 15,065 proteins were identified
and 5,210 proteins were quantified on the basis of the
identification of one or more unique peptides across all three
biological replicates in each group. The quality assessment is
shown in Fig. S2. The correlation
analysis for proteins between BDEs 4/8th Ger and HOCs groups is
shown in Fig. S3 (HOCs vs. BDEs
4th Ger, HOCs vs. BDEs 8th Ger and BDEs 4th Ger vs. BDEs 4th Ger;
Pearson correlation <1). The fold change >2.0 or <0.5 in
relative abundance and P-value <0.05 were seen as the criteria
to choose the differentially upregulated and downregulated
proteins. A total of 443 differentially expressed proteins were
quantified including 162 upregulated proteins and 281 downregulated
proteins between the BDEs 4/8th Ger and HOCs group as shown in
Table SI. According to the
differential expression of proteins and the relationship with cell
differentiation, 30 differentially expressed proteins in BDEs
4th/8th Ger and HOCs were further screened, among which 14 were
upregulated (fold change >2.0) and 16 were downregulated (fold
change <0.5) as shown in Table
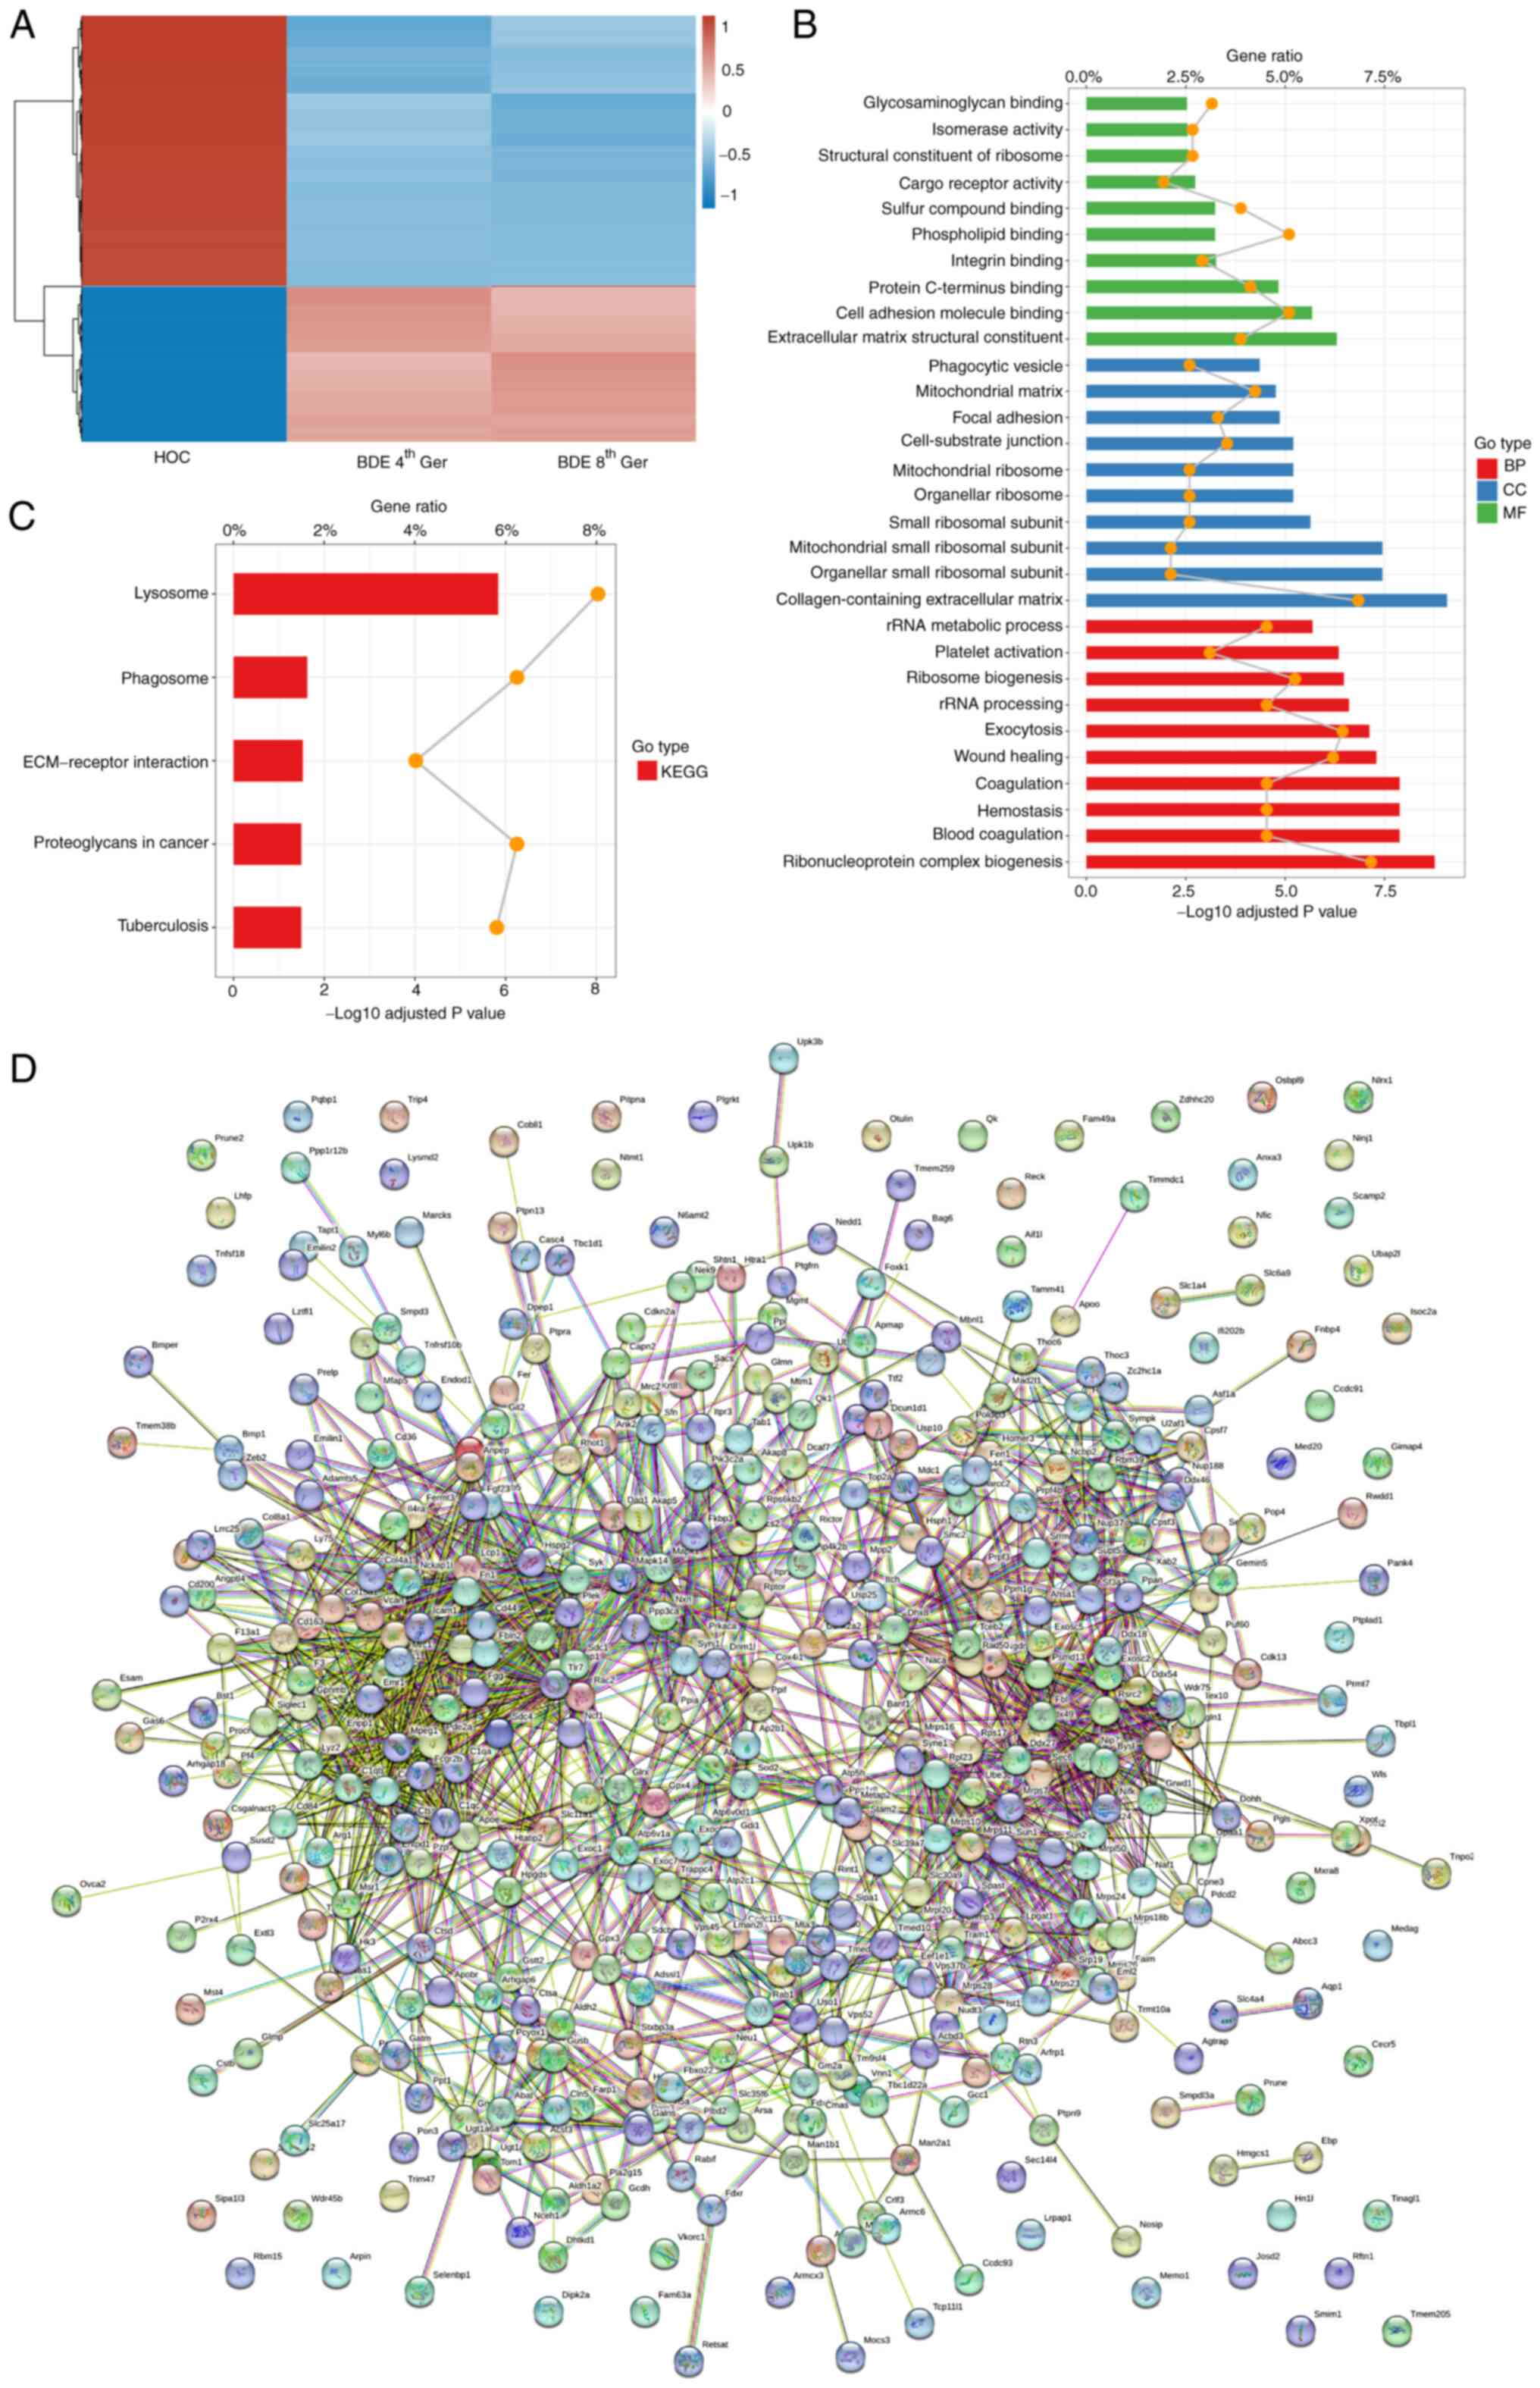
III. A total of 358 differentially expressed proteins between
BDEs 4/8th Ger and HOCs were classified with a heatmap (Fig. 4A). The functional distribution of
proteins including their MF, CC and BP was determined by an online
tool based on the GO annotation project. Pathway analysis of
differentially expressed proteins was elucidated using the KEGG
database. Protein-protein interactions were analyzed using STRING.
By GO analysis of BP, it was found that most of the differentially
expressed proteins were involved in ribonucleoprotein complex
biogenesis, blood coagulation, hemostasis, coagulation, wound
healing, exocytosis, rRNA processing, ribosome biogenesis, platelet
activation and rRNA metabolic process. The majority of the CC
proteins have a different distribution, involving
collagen-containing extracellular matrix, organellar small
ribosomal subunit, mitochondrial small ribosomal subunit, small
ribosomal subunit, organellar ribosome, mitochondrial ribosome,
cell-substrate junction, focal adhesion, mitochondrial matrix and
phagocytic vesicle. According to the analysis of MF, the
differentially expressed proteins were categorized into
extracellular matrix structural constituent, cell adhesion molecule
binding, protein C-terminus binding, integrin binding, phospholipid
binding, sulfur compound binding, cargo receptor activity,
structural constituent of ribosome, isomerase activity and
glycosaminoglycan binding (Fig.
4B). In addition, KEGG analysis indicated that lysosome,
phagosome, ECM-receptor interaction, proteoglycans in cancer and
tuberculosis were significantly associated with the cell
differentiation (Fig. 4C).
Furthermore, the protein-protein functional network diagram
analysis demonstrated that differentially expressed proteins
closely interacted with each other (Fig. 4D).
| Table III.Detailed information of 38 secreted
differential proteins associated with the progress of cell
differentiation in HOCs and BDEs 4th Ger and BDEs 8th Ger
Groupsa. |
Table III.
Detailed information of 38 secreted
differential proteins associated with the progress of cell
differentiation in HOCs and BDEs 4th Ger and BDEs 8th Ger
Groupsa.
| Protein | Gene name | Length (kDa) | BDE4th 8th Ger/HOCs
ratio | Regulation
type |
|---|
| Ninjurin-1 | Ninj1 | 152 | 0.120 | Down |
| cAMP-dependent
protein kinase catalytic subunit alpha | Prkaca | 351 | 0.668 | Down |
| Interleukin-4
receptor subunit alpha | Il4r | 810 | 0.066 | Down |
| Protein NEDD1 | Nedd1 | 660 | 0.668 | Down |
| Protein phosphatase
3 catalytic subunit alpha | Ppp3ca | 521 | 0.774 | Down |
| SLAM family member
5 | Slamf5 | 329 | 0.096 | Down |
| Transmembrane
anterior posterior transformation protein 1 | Tapt1 | 564 | 0.450 | Down |
| Fibrillin-1 | Fbn1 | 2873 | 0.038 | Down |
| Versican core
protein | Cspg2 | 3357 | 0.022 | Down |
| All-trans-retinol
13,14-reductase | Retsa | 609 | 0.265 | Down |
|
Calcium-transporting ATPase type 2C member
1 | Atp2c1 | 918 | 0.162 | Down |
| Exopolyphosphatase
PRUNE1 | Prune1 | 454 | 0.654 | Down |
| Adipocyte plasma
membrane-associated protein | Apmap | 415 | 0.532 | Down |
| Fibroblast growth
factor 23 | Fgf23 | 251 | 0.017 | Down |
| P2X purinoceptor
4 | P2rx4 | 388 | 0.070 | Down |
| Exostosin-like
3 | Extl3 | 918 | 0.088 | Down |
| Vacuolar protein
sorting-associated protein 37B | Vps37b | 285 | 2.087 |
Up |
|
Ubiquitin-conjugating enzyme E2 variant
1 | Ube2v1 | 147 | 1.687 |
Up |
| Ubiquitin
carboxyl-terminal hydrolase 25 | Usp25 | 1055 | 1.675 |
Up |
| Forkhead box
protein K1 | Foxk1 | 719 | 2.265 |
Up |
| Cleavage and
polyadenylation specificity factor subunit 3 | Cpsf3 | 684 | 1.886 |
Up |
| Mitogen-activated
protein kinase 1 | Mapk1 | 358 | 1.357 |
Up |
| RNA-binding protein
15 | Rbm15 | 962 | 1.548 |
Up |
| Activating signal
cointegrator 1 | Trip4 | 581 | 1.924 |
Up |
| Histone-lysine
N-methyltransferase SETD2 | Setd2 | 2537 | 4.826 |
Up |
| Protein
quaking | Qki | 341 | 1.425 |
Up |
| TBC1 domain family
member 1 | Tbc1d1 | 1255 | 1.241 |
Up |
| Mesenteric
estrogen-dependent adipogenesis protein | Medag | 303 | 1.512 |
Up |
| SWI/SNF complex
subunit SMARCC2 | Smarcc2 | 1213 | 1.550 |
Up |
| Protein prune
homolog 2 | Prune2 | 3084 | 4.592 |
Up |
Discussion
Understanding signaling pathways and molecular
regulation of liver regeneration is of high interest, as it
provides the basis to improve or modulate the liver regenerative
capacity, thus opening new avenues on therapeutic intervention in
liver diseases, other than orthotopic liver transplantation. In the
present study, the SEDT2 and H3K36me3 expression in mouse HOCs
differentiated into BDEs was studied in vitro. The SEDT2 and
H3K36me3 antibodies labeled the HOCs and a strong reaction
differentiated into the maturation of BDEs was observed. At the
same time, HOCs specific marker OV-6 and BDEs marker CK-19 were
detected in the differentiation progress to validate the cell
types.
HOCs are considered the stem cells in the liver.
Under the activation of various factors, HOCs can differentiate
into hepatocytes or BDEs. In addition, HOCs can differentiate into
pancreatic (19), intestinal
epithelial (20), glial (21) and prolactin cells (22) in vitro and in vivo.
At present, most of the studies on the in vitro culture
model of HOCs focus on the induction of differentiation into
hepatocytes, while the induction into BDEs is less studied. Biliary
epithelium was previously considered to be a type of simple
epithelial cells covering the intrahepatic and extrahepatic bile
ducts, whose function is to maintain biliary knots to keep it
intact for transporting bile into the intestine. A previous study
confirmed that BDEs are not only a group of cells that maintain
structural integrity, but also serve an important role in bile
secretion, inflammation and rejection (4). From the perspective of tissue origin,
intrahepatic bile duct is formed by the branch of the portal vein
of hepatic precursor cells derived from the liver bud process,
while extrahepatic bile duct is formed by the endodermal cells
between the liver bud process and the ventral pancreatic process
(23). At present, the tissue
origin and differentiation process of BDEs remain to be elucidated,
but some studies suggest that the biliary system, liver and
pancreas are also derived from the endodermal foregut during
embryofetal development. In the extrahepatic bile duct, there are a
large number of peribiliary glands and there are a subgroup of
SOX17+/PDX1-fine cells in these glands, which could differentiate
into extrahepatic BDEs (24). In
the present study, the in vitro induction system was
successfully established by inducing the in vitro cultured
HOCs to differentiate into BDEs through a variety of cytokines. The
extraction of HOCs in mice was explored by using 10 µg EGF + 5 µg
SCF + 5 µg LIF protocol to BDEs induced directional
differentiation. In this induction system, EGF is a mitogenic
factor. EGF plays a role in promoting cell proliferation by binding
to its membrane receptor EGFR. In the study, EGF was used in rats
after 2AAF/PH. It has been confirmed that EGF can promote the
proliferation of bile duct cells and their surrounding cells and
promote the migration of HOCs from the portal area to the liver
parenchyma (25). In addition, SCF
is an important hematopoietic stimulator, which activates and
proliferates cells by binding to c-kit on the cell surface. c-kit
can be expressed on the surface of HOCs and SCF may play a key role
in the proliferation and activation of oval cells (26). Through the effect of EGF and SCF,
mice HOCs were successfully induced to differentiate into BDEs
expressing CK-19 and the morphology of the cells was significantly
changed, which was in line with the morphological characteristics
of epithelial cells (Fig. 1A-I)
and the expression of CK-19 (Fig.
2A-D and Table II) in
cultured cells was confirmed by immunofluorescence and flow
cytometry. It is suggested that the induction protocol can be used
to induce HCOs to differentiate into mature BDEs in vitro
with stability and reliability.
The bivalent domains, consisting of active
modification H3K4me3 and repressive modification H3K27me3, have
been shown to play an important role in the mechanism of action of
histone modification proteins in stem cells (27). Functional analyses of these
molecules during liver development have advanced the understanding
of several complex chromatin-modifying enzymes involved in cell
lineage commitment (28,29). In addition, it is reported that
expression of liver-specific transcription factors is changed by
administration of histone deacetylase inhibitors in vitro
(30). Special attention is being
paid to their role in controlling both growth and differentiation
of stem cells in vitro. In past decades, the study of
H3K36me3 and SETD2 mainly focus on their function as tumor
suppressors, including clear cell renal cell carcinoma,
chondroblastomas, lymphoma, acute leukemia, intestinal
tumorigenesis and so on (31–35).
In the mechanism, SETD2, H3K36 histone methyltransferase in yeast,
has been reported to be required for transcription elongation
(36). Also, SETD2 could directly
regulate transcriptional initiation of Fgfr3 through histone
H3K36me3 modification (37). In
the present study, SETD2 could regulate H3k36Me3 expression to
promote the HOCs committed into BDEs. Regretfully, although SETD2
and H3K36me3 were studied in the progress of HOCs differentiation
into BDEs knockdown SEDT2 mice were not established. Were this
performed, it could be observed that HOCs simply maintained their
original state and failed to form mature BDEs. Therefore, it is
hypothesized that SETD2 can regulate the expression of H3K36me3 and
promote the differentiation of HOCs into BDEs.
Protein detection plays an important role in
biological and biomedical sciences. With the development and
improvement of label-free quantitative proteomics technology, it is
possible to study diseases from the whole protein expression level
of body fluids, tissues or cells which can reflect the disease
state of the body so as to provide new specific molecular markers
for early diagnosis of disease and new clues for understanding the
pathogenesis of the disease. In the present study, this technology
was used to detect the proteomic through the differentiation of
HOCs induced into BDEs. Unexpectedly, SETD2 matched the label-free
proteins test and experienced a 4.826 ratio change with more BDE4th
8th Ger than HOCs (Table III).
The whole trend in change was consistent with the cell
morphological features. In addition, in the 30 differentially
expressed proteins associated with cell differentiation, it was
found that, after using NCBI functional annotation(https://www.ncbi.nlm.nih.gov/), the 30 differentially
expressed proteins in HOCs directional differentiation to the
process of BDEs involved in sugar metabolism, angiogenesis,
transcriptional regulation, histone modification, cell cycle
regulation, chromatin regulation, bile metabolism and a series of
important steps in cell differentiation (Table SII). Thus, it was found that most
of the proteins in HOCs were committed to differentiation into BDEs
with multi-function coordination working. In addition, some of the
proteins are also of importance in liver function adjustment, such
as lipid metabolism. Thus, they can be identified as the progress
of HOCs differentiation into BDEs. Epigenetic modifying proteins
can promote original cells to be other mature cells accompanied by
the formation of the metabolism function. There is also research
reporting the essential role of SETD2 and H3K36me3 in cell
differentiation, such as bone marrow mesenchymal stem cells
(18), fetal erythropoiesis
(38), hematopoietic stem cell
(17), osteosarcoma cells
(39), bone regeneration (40), germline stem cells (41), human epidermal stem cells and human
epidermal stem cells (42). There
is also research showing the proteomic in hepatic stem cells
(43,44), although this examined only cell
membrane and cytoplasmic proteins, but not nuclear proteins, which
play an important role in differentiation. The proteomics of HOCs
differentiating into BDEs has not been studied. The proteomic study
of the present study can provide a good basis for the future study
of BDEs.
However, the present study is still subject to some
flaws. SETD2 knockdown mice were not constructed, making it
difficult to directly observe how SETD2 adjusts H3K36me3 in the
progress of HOCs committed differentiation into BDEs. In further
research, SETD2 knockdown and overexpression mice will be chosen to
study the relationship between SETD2 and H3K36me3 in HOCs
differentiation into BDEs. Continuous efforts will be made to study
this and make the present hypothesis more convincing. Additionally,
the hub proteins will be explored with a label-free proteins test
to clarify the significance of epigenetic modification proteins in
hepatic oval cell differentiation.
In summary, the present study demonstrated the way
SETD2 regulates H3K36me3, a critical factor in the differentiation
of HOCs and is endowed with significant research potential for the
dry maintenance and differentiation of liver oval cells into BDEs,
which can be used in stem cell research for biliary diseases, bile
duct repair, liver transplantation and other clinical
applications.
Supplementary Material
Supporting Data
Supporting Data
Acknowledgements
Not applicable.
Funding
The present study was supported by PhD research start-up funds
of Dali University, Dali, Yunnan, P.R. China (grant no.
KYBS201720).
Availability of data and materials
The datasets used and/or analyzed during the current
study are available from the corresponding author on reasonable
request.
Authors' contributions
YC initiated the research and drafted the
manuscript; LJ drafted the manuscript and completed all
experiments; LJ and YC confirm the authenticity of all the raw
data. ZS and SH analyzed the data and assisted in preparing the
manuscript; YT provided practical technical guidance and analyzed
the data; and IM checked the language issues and assisted in the
experiments. All authors read and approved the final
manuscript.
Ethics approval and consent to
participate
The Biomedical Research Ethics Committee of the
School of Medicine at Dali University approved the present study
[approval number: SYXK(yunnan)2018-0002].
Patient consent for publication
Not applicable.
Competing interests
The authors declare that they have no competing
interests.
References
|
1
|
Carpino G, Cardinale V, Renzi A, Hov JR,
Berloco PB, Rossi M, Karlsen TH, Alvaro D and Gaudio E: Activation
of biliary tree stem cells within peribiliary glands in primary
sclerosing cholangitis. J Hepatol. 63:1220–1228. 2015. View Article : Google Scholar : PubMed/NCBI
|
|
2
|
Miyajima A, Tanaka M and Itoh T:
Stem/progenitor cells in liver development, homeostasis,
regeneration, and reprogramming. Cell Stem Cell. 14:561–574. 2014.
View Article : Google Scholar : PubMed/NCBI
|
|
3
|
Alison MR, Poulsom R and Forbes SJ: Update
on hepatic stem cells. Liver. 21:367–373. 2001. View Article : Google Scholar : PubMed/NCBI
|
|
4
|
Lowes KN, Croager EJ, Olynyk JK, Abraham
LJ and Yeoh GC: Oval cell-mediated liver regeneration: Role of
cytokines and growth factors. J Gastroenterol Hepatol. 18:4–12.
2003. View Article : Google Scholar : PubMed/NCBI
|
|
5
|
Fujikawa T, Hirose T, Fujii H, Oe S,
Yasuchika K, Azuma H and Yamaoka Y: Purification of adult hepatic
progenitor cells using green fluorescent protein (GFP)-transgenic
mice and fluorescence-activated cell sorting. J Hepatol.
39:162–170. 2003. View Article : Google Scholar : PubMed/NCBI
|
|
6
|
Alison M, Golding M, Lalani el-N and
Sarraf C: Wound healing in the liver with particular reference to
stem cells. Philos Trans R Soc Lond B Biol Sci. 353:877–894. 1998.
View Article : Google Scholar : PubMed/NCBI
|
|
7
|
Akhurst B, Croager EJ, Farley-Roche CA,
Ong JK, Dumble ML, Knight B and Yeoh GC: A modified
choline-deficient, ethionine-supplemented diet protocol effectively
induces oval cells in mouse liver. Hepatology. 34:519–522. 2001.
View Article : Google Scholar : PubMed/NCBI
|
|
8
|
Dabeva MD and Shafritz DA: Activation,
proliferation, and differentiation of progenitor cells into
hepatocytes in the D-galactosamine model of liver regeneration. Am
J Pathol. 143:1606–1620. 1993.PubMed/NCBI
|
|
9
|
Factor VM, Radaeva SA and Thorgeirsson S:
Origin and fate of oval cells in dipin-induced hepatocarcinogenesis
in the mouse. Am J Pathol. 145:409–422. 1994.PubMed/NCBI
|
|
10
|
Tatematsu M, Kaku T, Medline A and Farber
E: Intestinal metaplasia as a common option of oval cells in
relation to cholangiofibrosis in liver of rats exposed to
2-acetylaminofluorene. Lab Invest. 52:354–362. 1985.PubMed/NCBI
|
|
11
|
Wright N, Samuelson L, Walkup MH,
Chandrasekaran P and Gerber DA: Enrichment of a bipotent hepatic
progenitor cell from naïve adult liver tissue. Biochem Biophys Res
Commun. 366:367–372. 2008. View Article : Google Scholar : PubMed/NCBI
|
|
12
|
Yoon BI, Choi YK and Kim DY:
Differentiation processes of oval cells into hepatocytes: Proposals
based on morphological and phenotypical traits in
carcinogen-treated hamster liver. J Comp Pathol. 131:1–9. 2004.
View Article : Google Scholar : PubMed/NCBI
|
|
13
|
Yin L, Lynch D, Ilic Z and Sell S:
Proliferation and differentiation of ductular progenitor cells and
littoral cells during the regeneration of the rat liver to
CCl4/2-AAF injury. Histol Histopathol. 17:65–81. 2002.PubMed/NCBI
|
|
14
|
Park HJ, Choi YJ, Kim JW, Chun HS, I'm I,
Yoon S, Han YM, Song CW and Kim H: Differences in the epigenetic
regulation of cytochrome P450 genes between human embryonic stem
cell-derived hepatocytes and primary hepatocytes. PLoS One.
10:e01329922015. View Article : Google Scholar : PubMed/NCBI
|
|
15
|
Kanayama K, Chiba T, Oshima M, Kanzaki H,
Koide S, Saraya A, Miyagi S, Mimura N, Kusakabe Y, Saito T, et al:
Genome-wide mapping of bivalent histone modifications in hepatic
stem/progenitor cells. Stem Cells Int. 2019:97892402019. View Article : Google Scholar : PubMed/NCBI
|
|
16
|
Livak KJ and Schmittgen TD: Analysis of
relative gene expression data using real-time quantitative PCR and
the 2(−Delta Delta C(T)). Methods. 25:402–408. 2001. View Article : Google Scholar : PubMed/NCBI
|
|
17
|
Zhang YL, Sun JW, Xie YY, Zhou Y, Liu P,
Song JC, Xu CH, Wang L, Liu D, Xu AN, et al: Setd2 deficiency
impairs hematopoietic stem cell self-renewal and causes malignant
transformation. Cell Re. 28:476–490. 2018. View Article : Google Scholar : PubMed/NCBI
|
|
18
|
Wang L, Niu N, Li L, Shao R, Ouyang H and
Zou W: H3K36 trimethylation mediated by SETD2 regulates the fate of
bone marrow mesenchymal stem cells. PLoS Biol. 16:e20065222018.
View Article : Google Scholar : PubMed/NCBI
|
|
19
|
Li Y, Zhao LJ, Xia FZ, Li YX and Lu YL:
Transdifferentiation of hepatic oval cells into pancreatic islet
beta-cells. Front Biosci (Landmark Ed). 17:2391–2395. 2012.
View Article : Google Scholar : PubMed/NCBI
|
|
20
|
Barut V and Sarraf CE: Intestinal
metaplasia in liver of rats after partial hepatectomy and treatment
with acetylaminofluorene. Cell Prolif. 42:657–560. 2009. View Article : Google Scholar : PubMed/NCBI
|
|
21
|
Deng J, Steindler DA, Laywell ED and
Petersen BE: Neural trans-differentiation potential of hepatic oval
cells in the neonatal mouse brain. Exp Neurol. 182:373–382. 2003.
View Article : Google Scholar : PubMed/NCBI
|
|
22
|
Lee EJ, Russell T, Hurley L and Jameson
JL: Pituitary transcription factor-1 induces transient
differentiation of adult hepatic stem cells into
prolactin-producing cells in vivo. Mol Endocrinol. 19:964–971.
2005. View Article : Google Scholar : PubMed/NCBI
|
|
23
|
Raynaud P, Carpentier R, Antoniou A and
Lemaigre FP: Biliary differentiation and bile duct morphogenesis in
development and disease. Int J Biochem Cell Biol. 43:245–256. 2011.
View Article : Google Scholar : PubMed/NCBI
|
|
24
|
Carpino G, Cardinale V, Onori P,
Franchitto A, Berloco PB, Rossi M, Wang Y, Semeraro R, Anceschi M,
Brunelli R, et al: Biliary tree stem/progenitor cells in glands of
extrahepatic and intraheptic bile ducts: An anatomical in situ
study yielding evidence of maturational lineages. J Anat.
220:186–199. 2012. View Article : Google Scholar : PubMed/NCBI
|
|
25
|
Nagy P, Bisgaard H, Santoni-Rugiu E and
Thorgeirsson SS: In vivo infusion of growth factors enhances the
mitogenic response of rat hepatic ductal (oval) cells after
administration of 2-accetylaminofluorene. Hepatology. 23:71–79.
1996. View Article : Google Scholar : PubMed/NCBI
|
|
26
|
Matsusaka S, Tsujimura T, Toyosaka A,
Nakasho K, Sugihara A, Okamoto E, Uematsu K and Terada N: Role of
c-kit receptor tyrosine kinase in development of oval cells in the
rat 2-acetylaminofluorene/partial hepatectomy model. Hepatology.
29:670–676. 1999. View Article : Google Scholar : PubMed/NCBI
|
|
27
|
Stock JK, Giadrossi S, Casanova M, Brookes
E, Vidal M, Koseki H, Brockdorff N, Fisher AG and Pombo A:
Ring1-mediated ubiquitination of H2A restrains poised RNA
polymerase II at bivalent genes in mouse ES cells. Nat Cell Biol.
9:1428–1435. 2007. View Article : Google Scholar : PubMed/NCBI
|
|
28
|
Xu CR, Cole PA, Meyers DJ, Kormish J, Dent
S and Zaret KS: Chromatin ‘prepattern’ and histone modifiers in a
fate choice for liver and pancreas. Science. 332:963–966. 2011.
View Article : Google Scholar : PubMed/NCBI
|
|
29
|
Aoki R, Chiba T, Miyagi S, Negishi M,
Konuma T, Taniguchi H, Ogawa M, Yokosuka O and Iwama A: The
polycomb group gene product Ezh2 regulates proliferation and
differentiation of murine hepatic stem/progenitor cells. J Hepatol.
52:854–863. 2010. View Article : Google Scholar : PubMed/NCBI
|
|
30
|
Kubicek S, Gilbert JC, Fomina-Yadlin D,
Gitlin AD, Yuan Y, Wagner FF, Holson EB, Luo T, Lewis TA, Taylor B,
et al: Chromatin-targeting small molecules cause class-specific
transcriptional changes in pancreatic endocrine cells. Proc Natl
Acad Sci USA. 109:5364–5369. 2012. View Article : Google Scholar : PubMed/NCBI
|
|
31
|
Fang D, Gan H, Lee JH, Han J, Wang Z,
Riester SM, Jin L, Chen J, Zhou H, Wang J, et al: The histone
H3.3K36M mutation reprograms the epigenome of chondroblastomas.
Science. 352:1344–1348. 2016. View Article : Google Scholar : PubMed/NCBI
|
|
32
|
Yuan H, Li N, Fu D, Ren J, Hui J, Peng J,
Liu Y, Qiu T, Jiang M, Pan Q, et al: Histone methyltransferase
SETD2 modulates alternative splicing to inhibit intestinal
tumorigenesis. J Clin Invest. 127:3375–3391. 2017. View Article : Google Scholar : PubMed/NCBI
|
|
33
|
Moffitt AB, Ondrejka SL, McKinney M,
Rempel RE, Goodlad JR, Teh CH, Leppa S, Mannisto S, Kovanen PE, Tse
E, et al: Enteropathy-associated T cell lymphoma subtypes are
characterized by loss of function of SETD2. J Exp Med.
214:1371–1386. 2017. View Article : Google Scholar : PubMed/NCBI
|
|
34
|
Zhu X, He F, Zeng H, Ling S, Chen A, Wang
Y, Yan X, Wei W, Pang Y, Cheng H, et al: Identification of
functional cooperative mutations of SETD2 in human acute leukemia.
Nat Genet. 46:287–293. 2014. View Article : Google Scholar : PubMed/NCBI
|
|
35
|
Duns G, van den Berg E, van Duivenbode I,
Osinga J, Hollema H, Hofstra RM and Kok K: Histone
methyltransferase gene SETD2 is a novel tumor suppressor gene in
clear cell renal cell carcinoma. Cancer Res. 70:4287–4291. 2010.
View Article : Google Scholar : PubMed/NCBI
|
|
36
|
Zhang Y, Xie S, Zhou Y, Xie Y, Liu P, Sun
M, Xiao H, Jin Y, Sun X, Chen Z, et al: H3K36 histone
methyltransferase Setd2 is required for murine embryonic stem cell
differentiation toward endoderm. Cell Rep. 8:1989–2002. 2014.
View Article : Google Scholar : PubMed/NCBI
|
|
37
|
Li J, Moazed D and Gygi SP: Association of
the histone methyltransferase Set2 with RNA polymerase II plays a
role in transcription elongation. J Biol Chem. 277:49383–49388.
2002. View Article : Google Scholar : PubMed/NCBI
|
|
38
|
Li Y, Tang H, Chen F, Chen J, Wang H, Chen
Z, Duan Y, Wang X, Li L and Ouyang K: SETD2 is essential for
terminal differentiation of erythroblasts during fetal
erythropoiesis. Biochem Biophys Res Commun. 552:98–105. 2021.
View Article : Google Scholar : PubMed/NCBI
|
|
39
|
Jiang C, He C, Wu Z, Li F and Xiao J:
Histone methyltransferase SETD2 regulates osteosarcoma cell growth
and chemosensitivity by suppressing Wnt/β-catenin signaling.
Biochem Biophys Res Commun. 502:382–388. 2018. View Article : Google Scholar : PubMed/NCBI
|
|
40
|
Jia X, Long Q, Miron RJ, Yin C, Wei Y,
Zhang Y and Wu M: Setd2 is associated with strontium-induced bone
regeneration. Acta Biomater. 53:495–505. 2017. View Article : Google Scholar : PubMed/NCBI
|
|
41
|
McCarthy A, Sarkar K, Martin ET, Upadhyay
M, Jang S, Williams ND, Forni PE, Buszczak M and Rangan P: Msl3
promotes germline stem cell differentiation in female Drosophila.
Development. 149:dev1996252022. View Article : Google Scholar : PubMed/NCBI
|
|
42
|
Rinaldi L, Datta D, Serrat J, Morey L,
Solanas G, Avgustinova A, Blanco E, Pons JI, Matallanas D, Von
Kriegsheim A, et al: Dnmt3a and Dnmt3b associate with enhancers to
regulate human epidermal stem cell homeostasis. Cell Stem Cell.
19:491–501. 2016. View Article : Google Scholar : PubMed/NCBI
|
|
43
|
Montaldo C, Mancone C, Conigliaro A,
Cozzolino AM, de Nonno V and Tripodi M: SILAC labeling coupled to
shotgun proteomics analysis of membrane proteins of liver
stem/hepatocyte allows to candidate the inhibition of TGF-beta
pathway as causal to differentiation. Proteome Sci. 12:152014.
View Article : Google Scholar : PubMed/NCBI
|
|
44
|
Hurrell T, Segeritz CP, Vallier L, Lilley
KS and Cromarty AD: A proteomic time course through the
differentiation of human induced pluripotent stem cells into
hepatocyte-like cells. Sci Rep. 9:32702019. View Article : Google Scholar : PubMed/NCBI
|