Introduction
Insulin resistance (IR) is one of the main features
of type 2 diabetes mellitus and is closely related to lipid
metabolism disorders (1–3). Skeletal muscle accounts for 75–80% of
systemic glucose uptake in the body and has an important role in IR
(4,5).
Resveratrol (RSV) is a polyphenolic phytoalexin
mainly derived from peanuts, grapes, knotweed, mulberries and other
plants (6). It has beneficial
effects on metabolism, and can improve IR and other metabolic
abnormalities, including dyslipidemia, hyperglycemia and
hyperinsulinemia (7). Among these
properties, the anti-IR effect of RSV has been confirmed in a
number of studies (8,9). A previous in vitro study has
demonstrated that RSV can stimulate glucose uptake in skeletal
muscle cells (10), and an in
vivo study has shown that RSV significantly improves insulin
sensitivity in mice fed a high-fat diet (11). Although several studies have
investigated the antidiabetic effects of RSV (12,13),
the underlying mechanism for its effects against IR has not been
fully elucidated.
mTOR has been implicated in various human diseases
and pathological states, including diabetes, obesity, cancer and
neurodegenerative diseases (14–17).
The main downstream target of mTOR is p70 ribosomal protein S6
kinase (p70S6K) (18). Notably, it
has been reported that the mTOR signaling pathway can be activated
by energy overload, leading to the occurrence of IR (19).
DNA damage-inducible transcript 4 (DDIT4; also known
as Redd1, RTP801 and Dig2) functions in DNA damage repair, insulin
signaling, oxidative metabolism, nutrient deprivation, hypoxia and
endoplasmic reticulum stress, which can negatively regulate mTOR
activity (20–23). DDIT4 and mTOR are also involved in
regulation of the adipocyte insulin signaling pathway (24). However, the mechanisms underlying
the effects of DDIT4 and mTOR on skeletal muscle IR remain to be
fully elucidated. The possibility that RSV may regulate skeletal
muscle IR via the DDIT4/mTOR pathway warrants further research to
identify new targets for RSV in the improvement of IR.
To investigate the underlying mechanism for how RSV
improves IR, the present study established a palmitic acid
(PA)-induced IR model in C2C12 cells, verified the effects of RSV
on PA-induced IR, and glucose and lipid metabolism in the model,
and explored whether the effects of RSV were related to the
DDIT4/mTOR signaling pathway.
Materials and methods
C2C12 cell culture and treatments
The C2C12 mouse myoblast cell line (cat. no.
CL-0044) was obtained from Procell Life Science & Technology
Co., Ltd. C2C12 cells were maintained in DMEM (cat. no.
C11995500BT; Gibco; Thermo Fisher Scientific, Inc.) supplemented
with 10% fetal bovine serum (cat. no. FSP500; Shanghai ExCell
Biology, Inc.) and 1% penicillin/streptomycin (cat. no. P1400;
Beijing Solarbio Science & Technology Co., Ltd.) at 37°C under
5% CO2. After the cells reached 70–80% confluence, cell
differentiation was induced by culture in DMEM supplemented with 2%
horse serum (cat. no. S9050; Beijing Solarbio Science &
Technology Co., Ltd.) and 1% penicillin/streptomycin. Mycoplasma
contamination was not detected in the cells. Differentiated C2C12
cells at a density of 1×10⁴ cells/cm2 were
then incubated with 0.1 mM (PA1 group), 0.25 mM (PA2 group) or 0.5
mM (PA3 group) PA (cat. no. P0500; Sigma-Aldrich; Merck KGaA) at
room temperature for 24 h. A total of 0, 12 and 24 h after the
addition of PA (0.1, 0.25 or 0.5 mM), the glucose concentration in
the culture medium was measured using the Glucose Oxidase Assay Kit
(cat. no. E1011; Beijing Applygen Technologies, Inc.) to determine
whether IR was established in the cells. The optimal concentration
of PA was selected by measuring the cellular triglyceride (TG)
content, number of Oil red O-stained droplets, and the protein and
mRNA expression levels of insulin pathway indicators in the PA1,
PA2 and PA3 groups.
When the cells reached ~80% confluence, RSV (cat.
no. RS-BLLC; Hangzhou Great Forest Biomedical Ltd.) was added to
the medium at concentrations of 10, 20, 30, 50 and 100 µM at room
temperature. After 24 h, 10 µl Cell Counting Kit-8 (cat. no. CK04;
Dojindo Laboratories, Inc.) was added to each well and incubated at
37°C for 20 min, before the absorbance was measured at 450 nm. Cell
survival rate was calculated as follows: Cell survival rate
(%)=[(As-Ab)/(Ac-Ab)] ×100; where As indicates the OD value of
culture medium containing cells treated with different
concentrations of RSV; Ac indicates the OD value of culture medium
containing untreated cells; and Ab indicates the OD value of
culture medium containing no cells. The cell survival rate was
calculated to select the appropriate RSV concentration for
subsequent experiments.
In addition, C2C12 cells were treated with 10 µM
MHY1485 (mTOR agonist) (cat. no. A01B013361; Energy Chemical Co.,
Ltd.) and transfected with a small interfering (si)RNA against
DDIT4 (DDIT4-siRNA) (Shanghai Genechem Co. Ltd.) at 37°C for 24 h.
The cells were divided into the following groups: The control (CON)
group; PA (0.5 mM) group; PA (0.5 mM) + RSV (30 µM) group; PA (0.5
mM) + RSV (30 µM) + DDIT4-siRNA group; and PA (0.5 mM) + RSV (30
µM) + MHY1485 (10 µM) group. All cells were treated with 100 nM
insulin (Sigma-Aldrich; Merck KGaA) for 30 min at 37°C before
western blotting and detection of glucose contents in order to
stimulate the phosphorylation of indicators (IRS-1/PI3K/AKT) in the
insulin signaling pathway. The cells were collected for western
blotting and reverse transcription-quantitative PCR (RT-qPCR)
analyses.
Detection of glucose contents in
culture medium
After stimulation with insulin for 30 min, the
glucose oxidase-peroxidase method was employed to measure the
concentration of glucose remaining in the culture medium at 0, 12
and 24 h using the Glucose Oxidase Assay Kit. Briefly, 8 ml reagent
R1 and 2 ml reagent R2 in a 4:1 ratio were mixed to prepare 10 ml
working solution. Subsequently, 5 µl culture medium and 1 ml
working solution were mixed in test tubes, and blank and standard
tubes were also set up. The absorbance of each tube was measured at
450 nm and was used to calculate the residual glucose concentration
in the culture medium.
TG assay
The concentrations of TG in the cultured cells at a
density of 5×10⁵ cells/cm2 were measured
using a commercially available Triglyceride Assay Kit (cat. no.
A110-1-1; Nanjing Jiancheng Biological Engineering Research
Institute) in accordance with the manufacturer's instructions.
Oil red O staining to observe lipid
droplets in the cytoplasm of C2C12 cells
An Oil Red O Stain Kit (cat. no. G1262; Beijing
Solarbio Science & Technology Co., Ltd.) was used to detect
lipid droplets in the cytoplasm of C2C12 cells. C2C12 cells were
cultured in 6-well plates and the medium was discarded. The cells
were then stained with filtered Oil red O solution at room
temperature for 15 min, rinsed with 37°C water for 20 sec, stained
with counterstain solution for 3 min, rinsed with 37°C water for 5
sec, and covered with curing agent. The lipid droplets in the cell
cytoplasm were observed under a light microscope (TS100F; Nikon
Corporation) at ×400 magnification. In addition, the lipid
deposition in cells was semi-quantified using ImageJ software
(version 1.8.0; National Institutes of Health) (25).
Transfection with siRNAs
Three DDIT4-siRNAs (5′-GGGAAGGAAGUGUUCUCCAGGAAGU-3′;
5′-GCAGCTGCTCATTGAAGAGTGTTGA-3′; 5′-GGTGCCCATGTACTGGAGGATTCAA-3′)
and a negative control siRNA (5′-CCUCUUACCUCAGUUACAAUUUAUA-3′)
sequence were purchased from Shanghai Genechem Co., Ltd. For
preparation, 50 µl Opti-MEM I reduced serum medium (cat. no.
31985-062; Thermo Fisher Scientific, Inc.) was added to 20 pmol
siRNA to obtain a RNA oligonucleotide stock solution, which was
stored at −20°C. Furthermore, 50 µl Opti-MEM I medium was used to
dilute 1 µl Lipofectamine® 2000 (cat. no. 11668; Invitrogen; Thermo
Fisher Scientific, Inc.). For experiments, the RNA oligonucleotide
stock solution and the diluted Lipofectamine 2000 solution were
mixed to prepare transfection complexes at room temperature. Cells
were seeded into 24-well plates once they reached ~40% confluence
at 37°C. Transfection was performed when the cells reached ~60%
confluence, with 100 µl siRNA transfection complexes at a
concentration of 50 nM added to each well and incubated at 37°C for
24 h. The transfection efficiency of the different siRNAs was
examined by western blotting 24 h post-transfection to select the
optimal siRNA for use in subsequent experiments. The optimal
sequence of the DDIT4-siRNA was:
5′-GGGAAGGAAGUGUUCUCCAGGAAGU-3′.
RT-qPCR
Total RNA was extracted from cultured cells using an
RNAsimple Total RNA Kit (cat. no. DP419; Tiangen Biotech Co.,
Ltd.), and its purity and concentration were determined using a
NanoDrop® 2000 (Thermo Fisher Scientific, Inc.). Subsequently, RNA
was reverse transcribed into cDNA using a PrimeScript™ RT Reagent
Kit (cat. no. RR047A; Takara Biotechnology Co., Ltd.) according to
the manufacturer's protocol. Amplification was performed using a
SYBR® Premix Ex Taq™ II Kit (cat. no. RR820A; Takara Biotechnology
Co., Ltd.) in an Applied Biosystems 7500 Real-Time PCR System
(Thermo Fisher Scientific, Inc.). The cycling conditions were as
follows: 3 min of predenaturation at 95°C, followed by 40 cycles at
95°C for 5 sec and 60°C for 32 sec, and the fluorescence was
detected at the end of each cycle. The mRNA expression levels of
insulin receptor substrate (IRS)-1, PI3K, AKT, glucose transporter
4 (GLUT4), DDIT4, mTOR and p70S6K were evaluated in the cultured
cells. β-actin was measured as an internal control. The relative
mRNA expression levels were quantified using the 2−ΔΔCq
method (26). The sequences of the
primers used in the present study are listed in Table I.
 | Table I.Primer sequences. |
Table I.
Primer sequences.
| Gene | Sequence,
5′-3′ |
|---|
| DDIT4 | F:
TACTGCCCACCTTTCAGTTG |
|
| R:
GTCAGGGACTGGCTGTAACC |
| mTOR | F:
GCGGCCTGGAAATGCGGAAGTGG |
|
| R:
AAAGCCCCAAGGAGCCCCAACA |
| p70S6K | F:
CACTCAGGCCCCCCTACACT |
|
| R:
GCCGTCACTGAAAACCAAGTTC |
| PI3K | F:
CCCATGGGACAACATTCCAA |
|
| R:
CATGGCGACAAGCTCGGTA |
| AKT | F:
TCAGGATGTGGATCAGCGAGA |
|
| R:
CTGCAGGCAGCGGATGATAA |
| IRS-1 | F:
GCACCTGGTGGCTCTCTACAC |
|
| R:
TCGCTATCCGCGGCAAT |
| GLUT4 | F:
GTGACTGGAACACTGGTCCTA |
|
| R:
CCAGCCACGTTGCATTGTAG |
| β-actin | F:
GGTGGGAATGGGTCAGAAGG |
|
| R:
AGGTCTCAAACATGATCTGGGT |
Western blotting
C2C12 cells were collected after culture and
treatment, and lysed in RIPA lysis buffer (cat. no. R0010; Beijing
Solarbio Science & Technology Co., Ltd.). The lysed cells were
scraped off using a cell scraper, solubilized in 3X SDS sample
buffer (cat. no. P1040; Beijing Solarbio Science & Technology
Co., Ltd.) and the protein concentration was determined using a BCA
kit (cat. no. 23225; Thermo Fisher Scientific, Inc.). Total
proteins (30 µg) were separated by SDS-PAGE on 10% gels and were
transferred to polyvinylidene fluoride membranes (cat. no.
ISEQ00010; MilliporeSigma.), which were blocked with 5% skimmed
milk at room temperature for 2 h. The membranes were then incubated
with the following primary antibodies at 4°C overnight: Total
(t)-IRS-1 (cat. no. ab52167; Abcam), rabbit antibody, 1:1,000;
phosphorylated (p)-IRS-1 (cat. no. ab5599; Abcam), rabbit antibody,
1:1,000; t-AKT (cat. no. BS2987; Bioworld Technology, Inc.), rabbit
antibody, 1:2,000; p-AKT (cat. no. BS4006; Bioworld Technology,
Inc.), rabbit antibody, 1:2,000; t-PI3K (cat. no. 20583-1-AP;
Proteintech Group, Inc.), rabbit antibody, 1:2,000; p-PI3K (cat.
no. 11508; SAB Biotherapeutics, Inc.), rabbit antibody, 1:2,000;
GLUT4 (cat. no. ab65267; Abcam), mouse antibody, 1:2,000; DDIT4
(cat. no. ab106356; Abcam), rabbit antibody, 1:2,000; t-mTOR (cat.
no. ab32028; Abcam), rabbit antibody, 1:1,000; p-mTOR (cat. no.
ab109268; Abcam), rabbit antibody, 1:1,000; t-p70S6K (cat. no.
ab32529; Abcam), rabbit antibody, 1:1,000; p-p70S6K (cat. no.
ab59208; Abcam), rabbit antibody, 1:1,000; β-actin (cat. no.
20536-1-AP; Proteintech Group, Inc.), mouse antibody, 1:5,000.
After three washes with Tris-buffered saline containing 20%
Tween-20, the membranes were incubated with appropriate horseradish
peroxidase-conjugated secondary antibodies for 2 h at room
temperature as follows: Anti-rabbit (cat. no. S0001; Affinity
Biosciences), 1:8,000; anti-mouse (cat. no. S0002; Affinity
Biosciences), 1:8,000. The membranes were washed and immersed in
chemiluminescence solution (cat. no. 34580; Thermo Fisher
Scientific Inc.) for ~2 min, and images of the target bands were
acquired using a Gel Imager System (GDS8000; Analytik Jena AG).
ImageJ software version 1.8.0 was used to measure the optical
densities of the target bands.
Statistical analysis
Statistical analyses were conducted using SPSS 23.0
software (IBM Corp.). All samples were run in triplicate. All data
are expressed as the mean ± SD. The mean values of multiple samples
were compared by one-way analysis of variance followed by
Bonferroni's multiple comparison test or Tamhane's multiple
comparison test when there were unequal variances. P<0.05 was
considered to indicate a statistically significant difference.
Results
Establishment of a PA-induced IR model
in C2C12 cells
As shown in Fig.
1A, C2C12 cells were treated with PA at different
concentrations (0.1, 0.25 or 0.5 mM). After 12 h, the glucose
concentration in the culture medium from the PA3 group (0.5 mM PA)
was significantly higher than that from the CON group. After 24 h,
the glucose concentrations in the culture media from both the PA2
(0.25 mM PA) and PA3 groups were significantly higher than that
from the CON group.
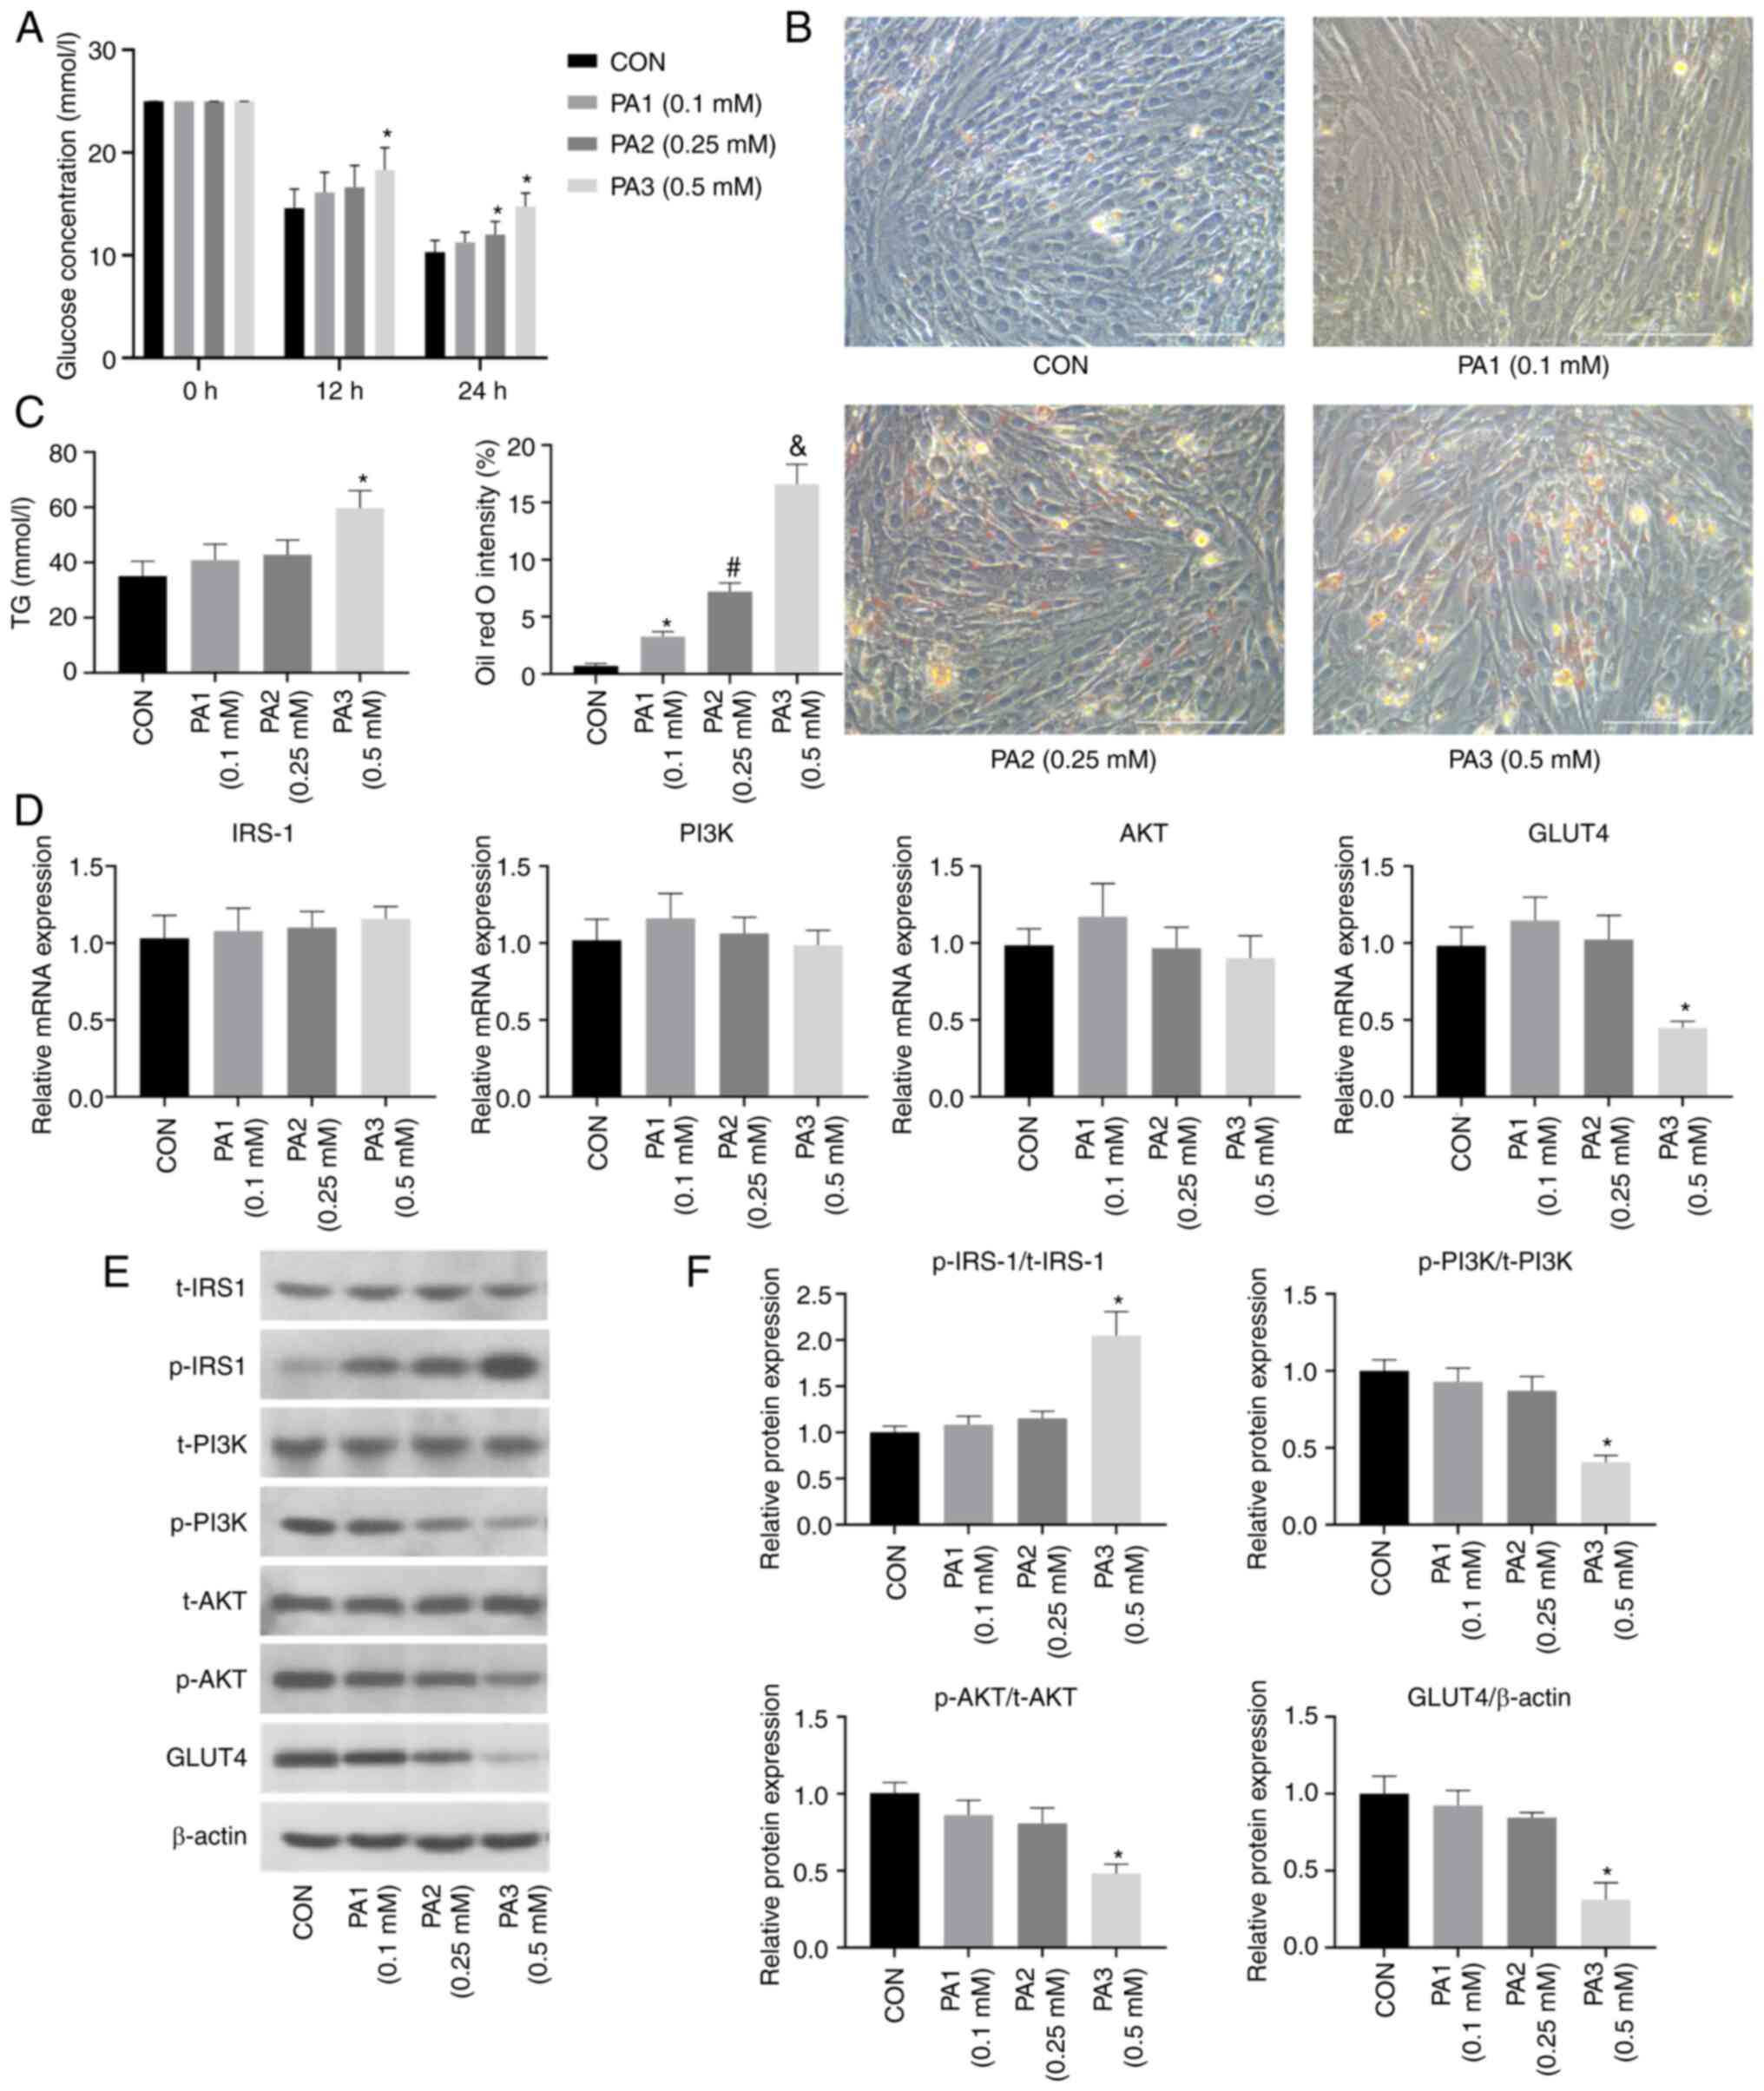 | Figure 1.PA induces lipid deposition and
insulin resistance in C2C12 cells. (A) Glucose concentration in the
culture medium was increased after PA treatment for 24 h. (B) Oil
red O staining of C2C12 cells revealed lipid deposition 24 h after
PA treatment; magnification, ×400, scale bar, 100 µm. (C) TG
content was increased in C2C12 cells after PA treatment. (D)
Effects of PA treatment on the mRNA expression levels of insulin
pathway indicators (IRS-1, PI3K, AKT and GLUT4) in C2C12 cells. (E)
Effects of PA treatment on the protein expression levels of insulin
pathway indicators in C2C12 cells. (F) Semi-quantification of
p-protein/t-protein ratios for insulin pathway indicators (IRS-1,
PI3K, AKT) and protein expression levels of GLUT4 in C2C12 cells
after PA treatment. All cells were treated with 100 nM insulin for
30 min before (A) detection of glucose contents and (E) western
blotting. Data are presented as the mean ± SD (n=3). *P<0.05 vs.
CON, #P<0.05 vs. PA1 (0.1 mM),
&P<0.05 vs. PA2 (0.25 mM). CON, control; PA,
palmitic acid; IRS-1, insulin receptor substrate-1; GLUT4, glucose
transporter 4; p-, phosphorylated; t-t, total; TG,
triglyceride. |
As determined by Oil red O staining, a light blue
cytoplasm was observed in the CON group, whereas orange-red lipid
droplets were present in the PA1, PA2 and PA3 groups, and the PA3
group had the largest number of droplets (Fig. 1B). The cellular TG contents in the
PA1, PA2 and PA3 groups were increased compared with those in the
CON group, and the PA3 group had the highest TG content (Fig. 1C). Based on these findings, the
concentration of 0.5 mM PA was selected for subsequent
experiments.
As shown in Fig.
1D, compared with those in the CON group, the mRNA expression
levels of GLUT4 were significantly decreased in the PA3 group, but
unchanged in the PA1 and PA2 groups. Notably, the mRNA expression
levels of IRS-1, PI3K and Akt remained unchanged in the PA-treated
groups.
As shown in Fig. 1E and
F, compared with those in the CON group, the protein expression
levels of p-PI3K/t-PI3K, p-AKT/t-AKT and GLUT4 were decreased in
the PA3 group, whereas the protein expression levels of
p-IRS-1/t-IRS-1 were increased. In the PA1 and PA2 groups, the
protein expression levels of p-IRS-1/t-IRS-1, p-PI3K/t-PI3K,
p-AKT/t-AKT and GLUT4 were unchanged compared with those in the CON
group. Notably, there were no significant differences in the total
protein expression levels of IRS-1, PI3K and AKT among the groups.
These results confirmed that 0.5 mM PA inhibited the insulin
pathway in C2C12 cells, indicating successful establishment of an
IR model in C2C12 cells.
RSV improves PA-induced lipid
deposition and IR in C2C12 cells
The viability of C2C12 cells was measured following
treatment with 0.5 mM PA and RSV at concentrations of 10, 20, 30,
50 or 100 µM for 24 h (Fig. 2A).
No difference in cell viability was observed between the 0.5 mM PA
group and the CON group. Treatment with RSV at 50 and 100 µM
significantly reduced cell viability, whereas treatment with RSV at
10, 20 and 30 µM did not. Therefore, a concentration of 30 µM RSV
was selected for subsequent experiments to observe the effects of
RSV on PA-treated cells.
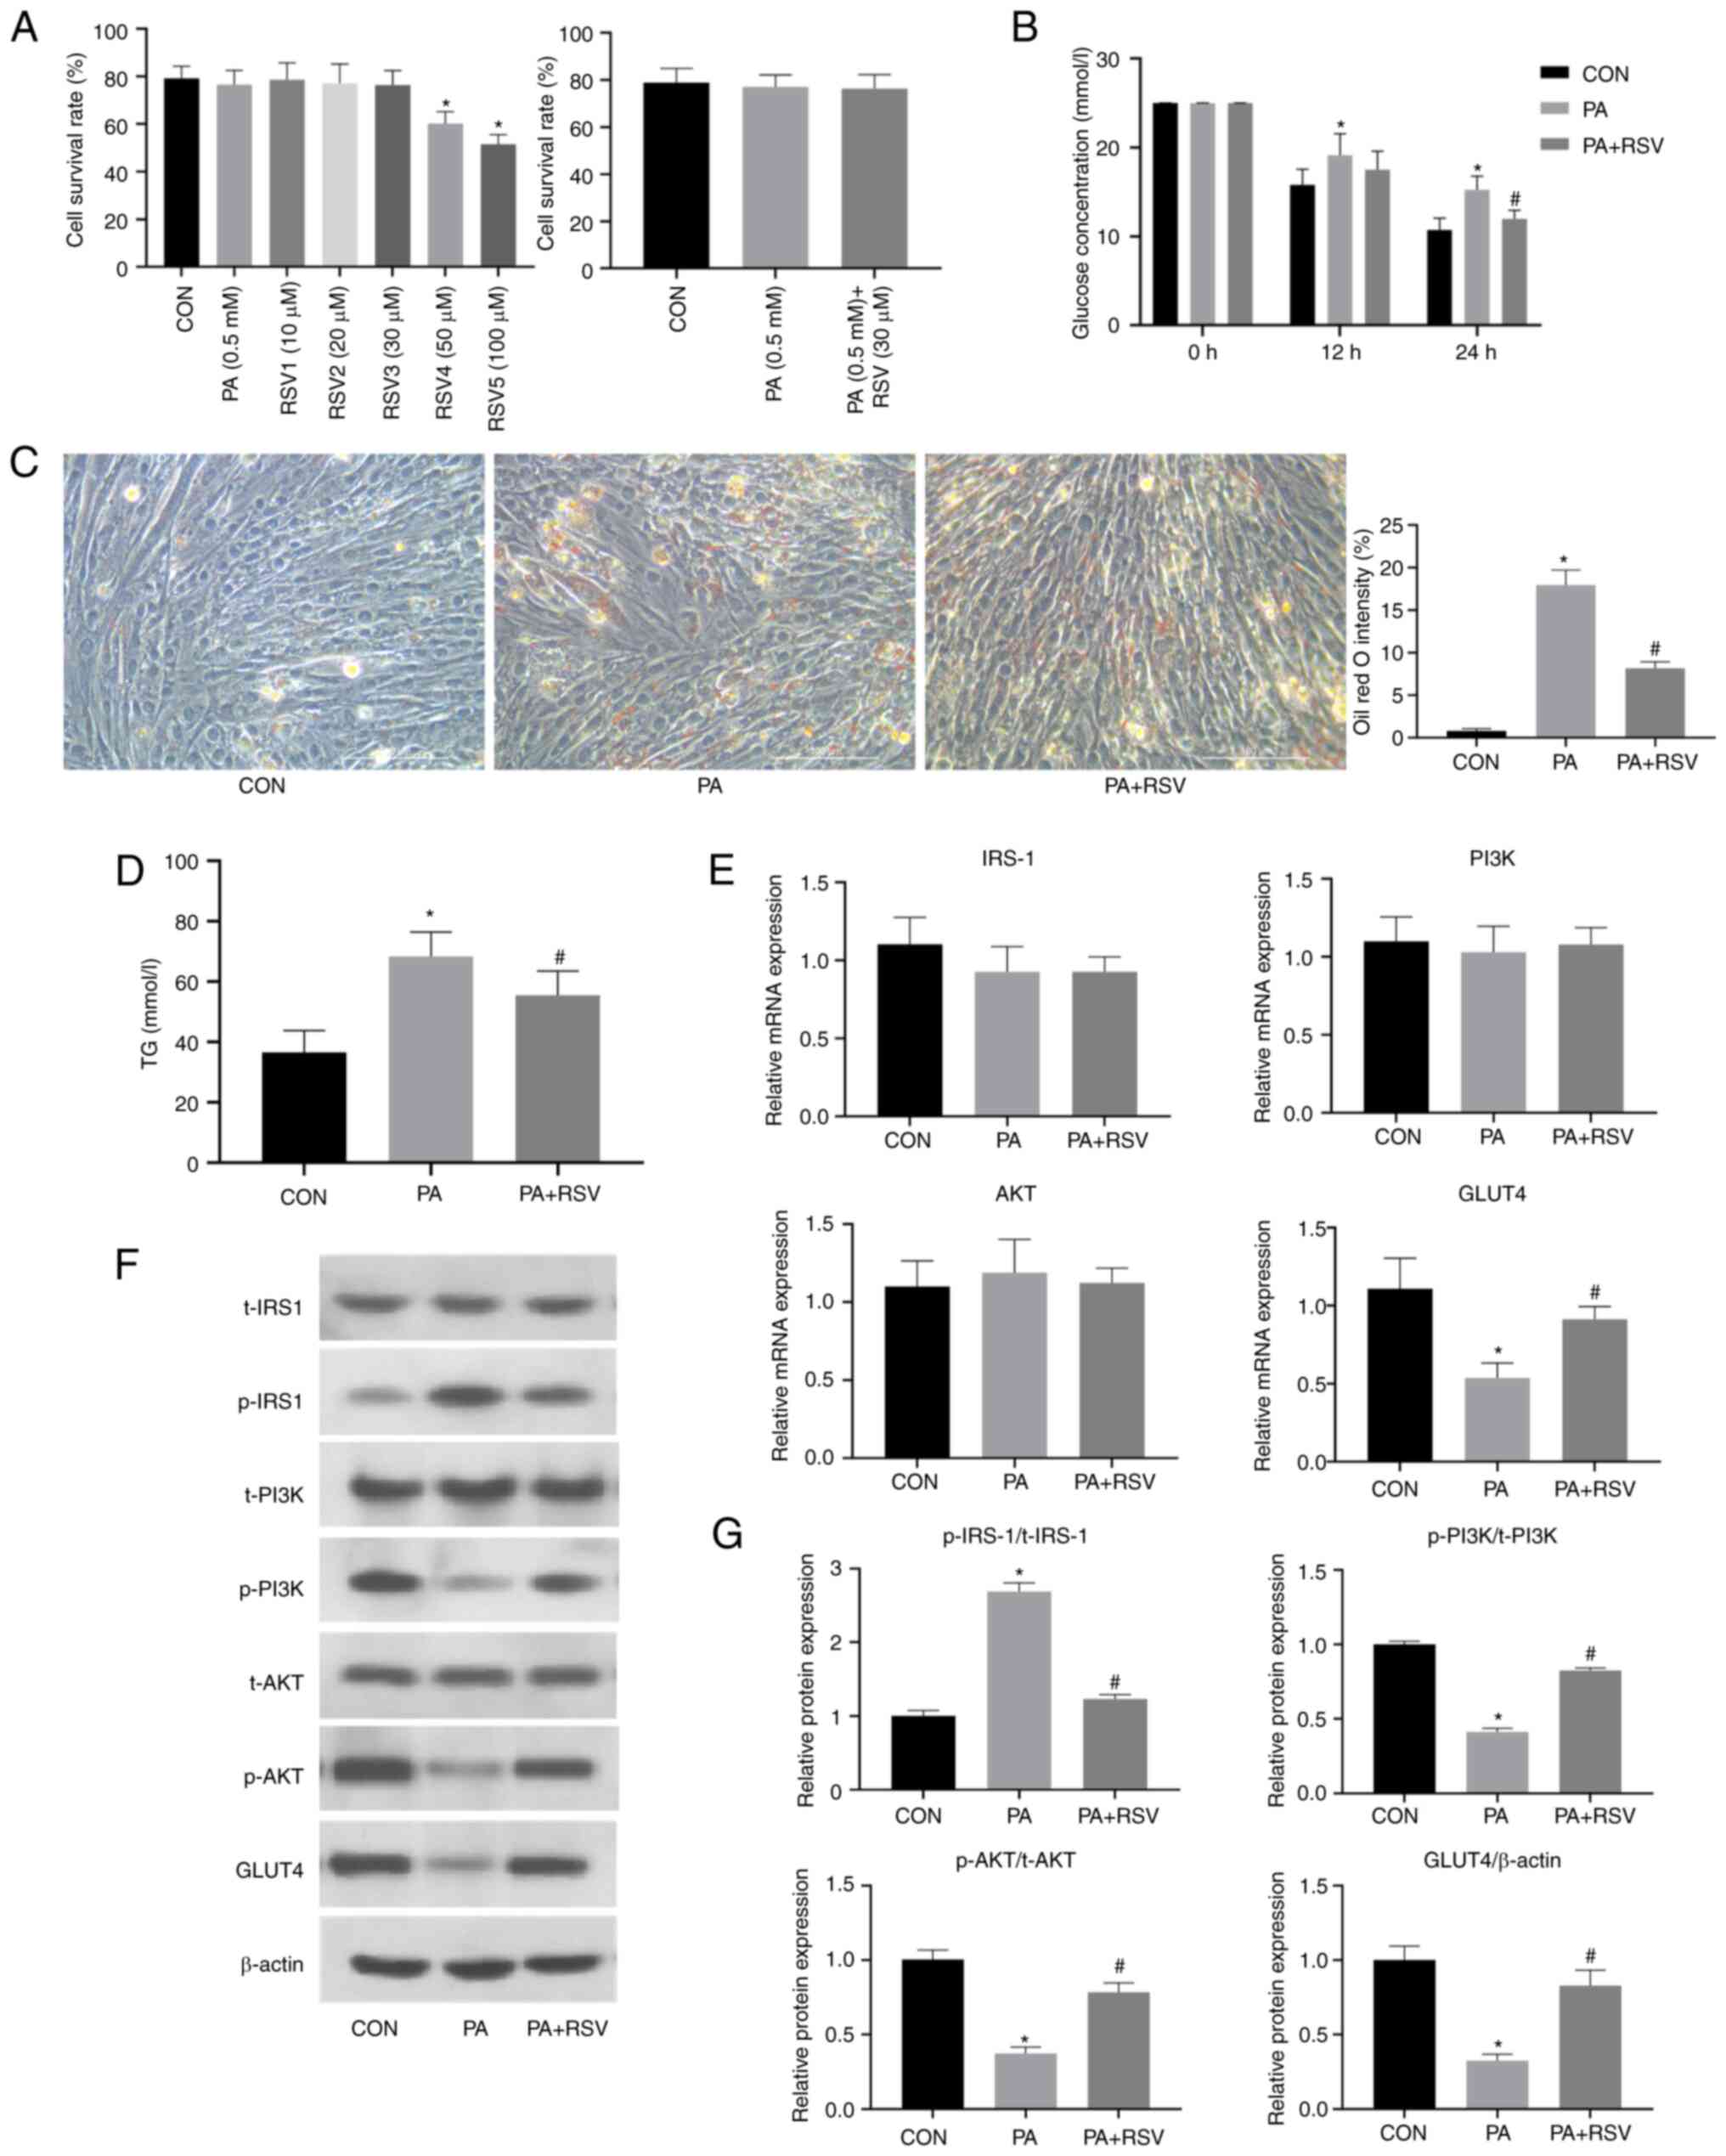 | Figure 2.RSV alleviates PA-induced lipid
deposition and insulin resistance in C2C12 cells. (A) Survival
rates of C2C12 cells after treatment with PA and RSV. (B) Glucose
concentration in the culture medium was decreased after RSV
treatment for 24 h. (C) Lipid deposition was decreased in Oil red
O-stained C2C12 cells after RSV treatment; magnification, ×400,
scale bar, 100 µm. (D) TG content in C2C12 cells was decreased
after RSV treatment. (E) Effects of RSV treatment on the mRNA
expression levels of insulin pathway indicators in C2C12 cells. (F)
Effects of RSV treatment on the protein expression levels of
insulin pathway indicators in C2C12 cells after RSV treatment. (G)
Semi-quantification of p-protein/t-protein ratios for insulin
pathway indicators and protein expression levels of GLUT4 in C2C12
cells after RSV treatment. All cells were treated with 100 nM
insulin for 30 min before (B) detection of glucose contents and (F)
western blotting. Data are presented as the mean ± SD (n=3).
*P<0.05 vs. CON, #P<0.05 vs. PA. CON, control;
RSV, resveratrol; PA, palmitic acid; IRS-1, insulin receptor
substrate-1; GLUT4, glucose transporter 4; p-, phosphorylated; t-t,
total; TG, triglyceride. |
The C2C12 cells were grouped into the CON group, PA
(0.5 mM) group and PA (0.5 mM) + RSV (30 µM) group. Compared with
that in the PA group, the glucose level in the culture medium was
decreased in the PA + RSV group (Fig.
2B). These results indicated that RSV may increase
insulin-stimulated glucose uptake, promote glucose utilization by
cells and reduce gluconeogenesis.
Oil red O staining revealed that the number of
cytoplasmic orange-red lipid droplets in the PA + RSV group was
lower than that in the PA group (Fig.
2C). Furthermore, the cellular TG content in the PA + RSV group
was significantly lower than that in the PA group (Fig. 2D). These results suggested that RSV
improved the lipid deposition in C2C12 cells induced by PA
treatment.
There were no differences in the mRNA expression
levels of IRS-1, PI3K and AKT among the three groups. By contrast,
the mRNA expression levels of GLUT4 were decreased in the PA group
compared with those in the CON group, but were increased in the PA
+ RSV group compared with those in the PA group (Fig. 2E).
The total protein expression levels of IRS-1, PI3K
and AKT were not significantly affected by treatment with PA or
RSV. However, compared with those in the CON group, the protein
expression levels of p-PI3K/t-PI3K, p-AKT/t-AKT and GLUT4 were
decreased, whereas those of p-IRS-1/t-IRS-1 were increased in the
PA group (Fig. 2F and G). Compared
with those in the PA group, the protein expression levels of
p-PI3K/t-PI3K, p-AKT/t-AKT and GLUT4 were increased, whereas those
of p-IRS-1/t-IRS-1 were decreased in the PA + RSV group (Fig. 2F and G). These results suggested
that RSV may have a beneficial role in the insulin signaling
pathway and could reverse PA-induced IR in C2C12 cells.
Effects of RSV on PA-induced
expression of DDIT4 and mTOR pathway components in C2C12 cells
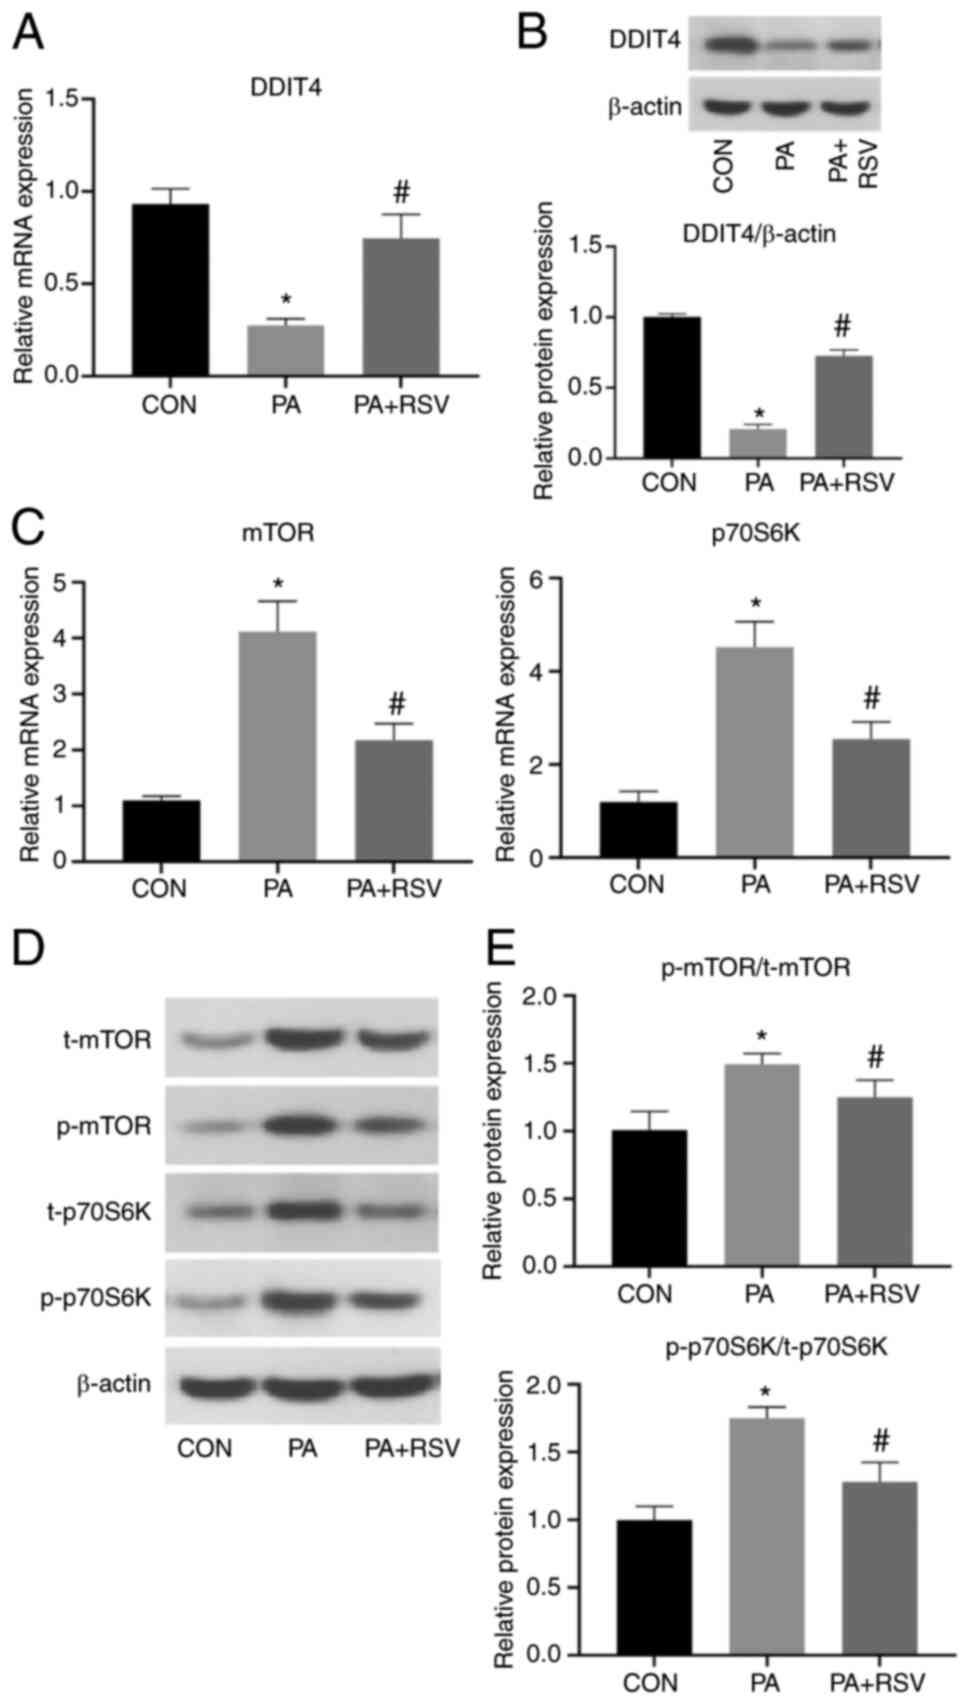
Compared with those in the CON group, the mRNA and
protein expression levels of DDIT4 were significantly decreased in
the PA group, indicating that PA may cause a decrease in DDIT4
expression. Compared with those in the PA group, the DDIT4 mRNA and
protein expression levels were increased in the PA + RSV group,
indicating that RSV may promote the expression of DDIT4 (Fig. 3A and B). By contrast, the mRNA
expression levels of mTOR and p70S6K were significantly increased
in the PA group compared with those in the CON group, but were
significantly decreased in the PA + RSV group compared with those
in the PA group (Fig. 3C).
In the PA group, compared with in the CON group, the
t-protein and p-protein expression levels of mTOR and p70S6K were
markedly increased (Fig. 3D), and
the p-protein/t-protein ratios for mTOR and p70S6K were also
significantly increased (Fig. 3E).
In the PA + RSV group, compared with in the PA group, the t-protein
and p-protein expression levels of mTOR and P70S6K were markedly
decreased (Fig. 3D), and the
p-protein/t-protein ratios for mTOR and p70S6K were also decreased
(Fig. 3E). These findings
indicated that RSV weakened the effects of PA and inhibited the
mTOR pathway.
Expression of insulin signaling
pathway-related and mTOR pathway-related indicators after silencing
of DDIT4
Three siRNAs targeting DDIT4 were used in the
present study to verify the effect on DDIT4 silencing. The protein
expression levels of DDIT4 in the three transfection groups were
significantly lower than those in the negative control group.
Notably, DDIT4-siRNA-1 had the most significant silencing effect
and was thus selected for subsequent experiments (Fig. 4A). The cells were grouped as
follows: CON, PA, PA + RSV and PA + RSV + DDIT4-siRNA groups.
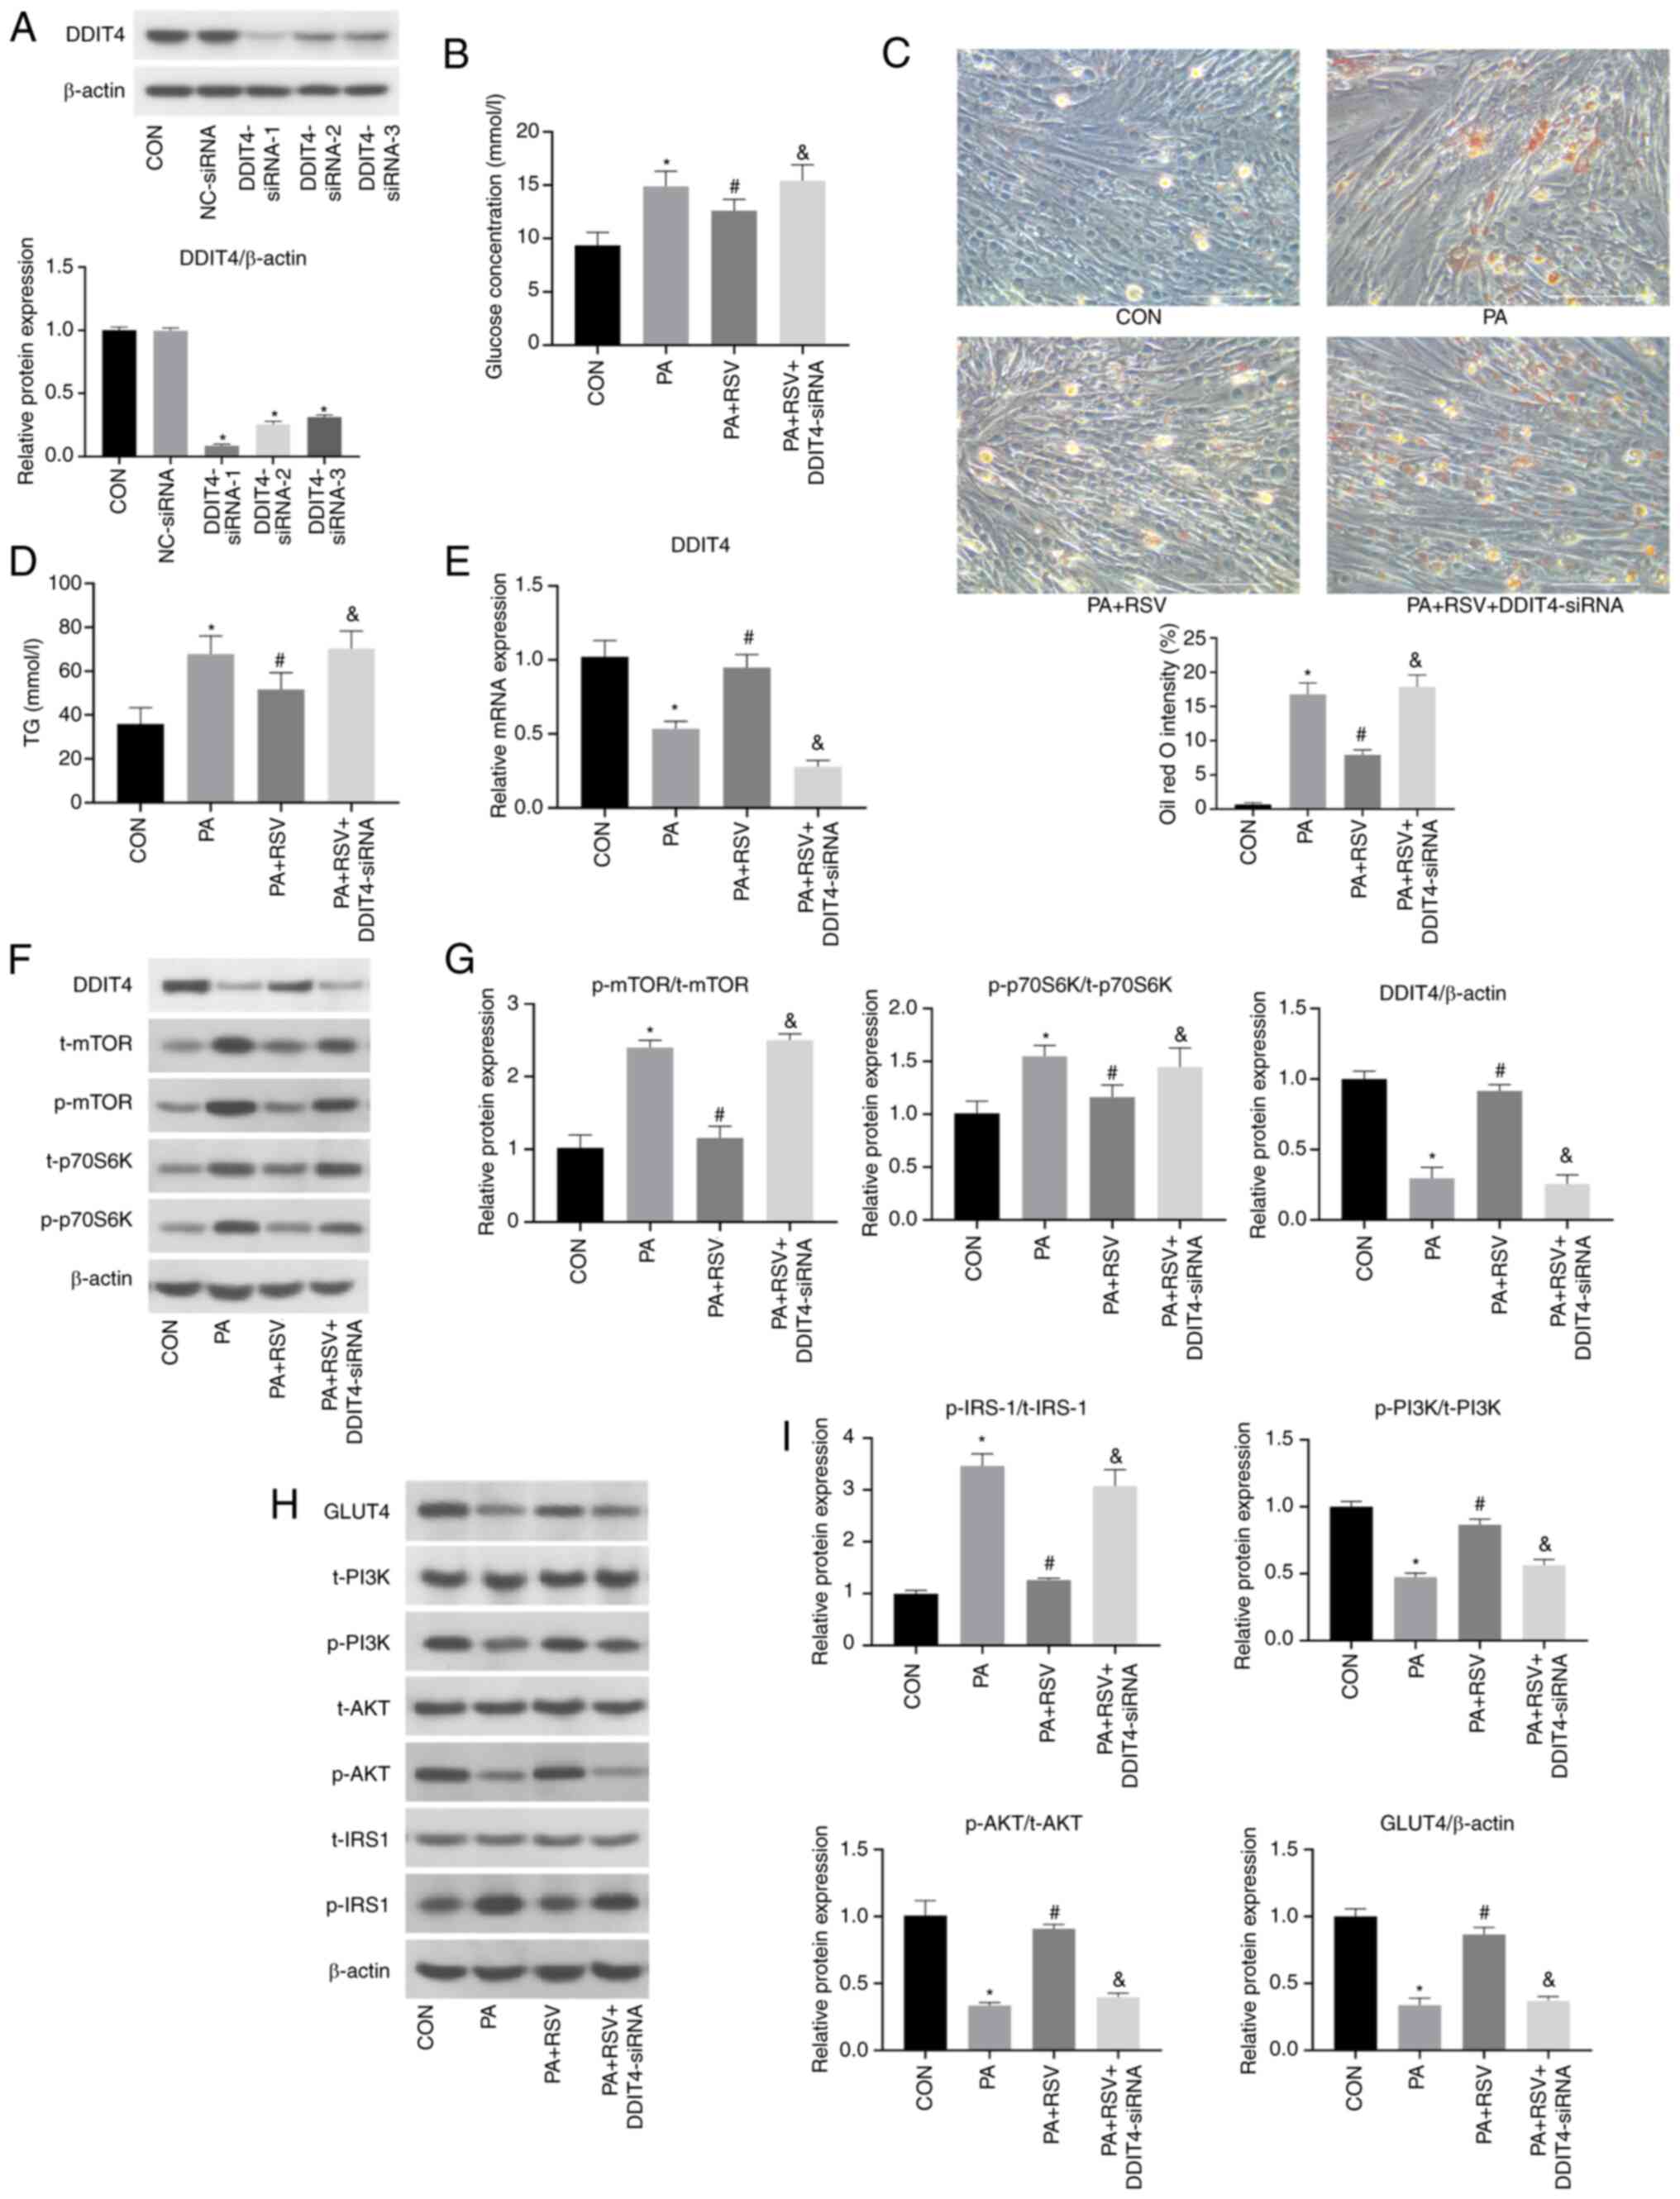 | Figure 4.Expression levels of insulin
signaling pathway and mTOR pathway indicators after silencing of
DDIT4 in C2C12 cells with PA-induced insulin resistance. (A)
Protein expression levels of DDIT4 were decreased after
transfection with three DDIT4-siRNAs. (B) Glucose concentration in
the culture medium of C2C12 cells was increased after silencing
DDIT4. (C) Number of red lipid droplets in C2C12 cells was
increased after silencing DDIT4, as determined by Oil red O
staining; magnification, ×400, scale bar, 100 µm. (D) TG levels in
C2C12 cells were increased after silencing DDIT4. (E) mRNA
expression levels of DDIT4 were decreased after silencing DDIT4.
(F) Protein expression levels of DDIT4 and mTOR pathway indicators
after silencing DDIT4. (G) Semi-quantification of
p-protein/t-protein ratios for mTOR pathway indicators and protein
expression levels of DDIT4 after silencing DDIT4. (H) Protein
expression levels of insulin signaling pathway indicators after
silencing of DDIT4. (I) Semi-quantification of p-protein/t-protein
ratios for insulin signaling pathway indicators and protein
expression levels of GLUT4 after silencing of DDIT4. All cells were
treated with 100 nM insulin for 30 min before (B) detection of
glucose contents and (A, F and H) western blotting. Data are
presented as the mean ± SD (n=3). *P<0.05 vs. CON,
#P<0.05 vs. PA, &P<0.05 vs. PA +
RSV. CON, control; RSV, resveratrol; PA, palmitic acid; siRNA,
small interfering RNA; NC, negative control; DDIT4, DNA
damage-inducible transcript 4; p70S6K, p70 ribosomal protein S6
kinase; IRS-1, insulin receptor substrate-1; GLUT4, glucose
transporter 4; p-, phosphorylated; t-t, total; TG,
triglyceride. |
In the PA + RSV + DDIT4-siRNA group, compared with
in the PA + RSV group, the glucose concentration was significantly
increased in the culture medium, and the effects of RSV on
promoting utilization of cellular glucose and reducing
gluconeogenesis were weakened (Fig.
4B). These findings indicated that RSV promoted glucose uptake
via DDIT4. Furthermore, compared with in the PA + RSV group, the
Oil red O staining and TG content measurement results revealed
increases in the number of intracellular lipid droplets and
cellular TG content in the PA + RSV + DDIT4-siRNA group after
silencing of DDIT4, which offset the effect of RSV on reducing cell
lipid deposition (Fig. 4C and D).
These findings indicated that RSV was effective for improving
cellular lipid deposition through DDIT4.
Compared with in the PA + RSV group, the mRNA and
protein expression levels of DDIT4 were significantly decreased in
the PA + RSV + DDIT4-siRNA group, indicating that the silencing
effect on DDIT4 was significant (Fig.
4E-G).
In the PA + RSV + DDIT4-siRNA group, the t-protein
and p-protein expression levels of mTOR and p70S6K were increased
compared with those in the PA + RSV group (Fig. 4F), and the p-protein/t-protein
ratios were also increased (Fig.
4G). These findings indicated that silencing DDIT4 reversed the
attenuating effects of RSV on the increased p-protein/t-protein
ratios for mTOR and p70S6K following PA treatment, thus suggesting
that RSV inhibited the mTOR pathway through DDIT4.
Compared with in the PA + RSV group, the protein
expression levels of p-PI3K/t-PI3K, p-AKT/t-AKT and GLUT4 were
decreased, whereas the protein expression levels of p-IRS-1/t-IRS-1
were increased in the PA + RSV + DDIT4-siRNA group after silencing
of DDIT4 (Fig. 4H and I). None of
the treatments affected the total protein expression levels of
PI3K, AKT and IRS-1. These results indicated that DDIT4 served a
positive role in RSV-mediated improvement of PA-induced IR.
Expression of DDIT4, mTOR and insulin
signaling pathways markers in MHY1485-treated C2C12 cells
Compared with in the PA + RSV group, the glucose
concentration was significantly increased in the culture medium
from the PA + RSV + MHY1485 group, which offset the effect of RSV
(Fig. 5A). These findings
indicated that mTOR activation may weaken the beneficial effect of
RSV on glucose metabolism.
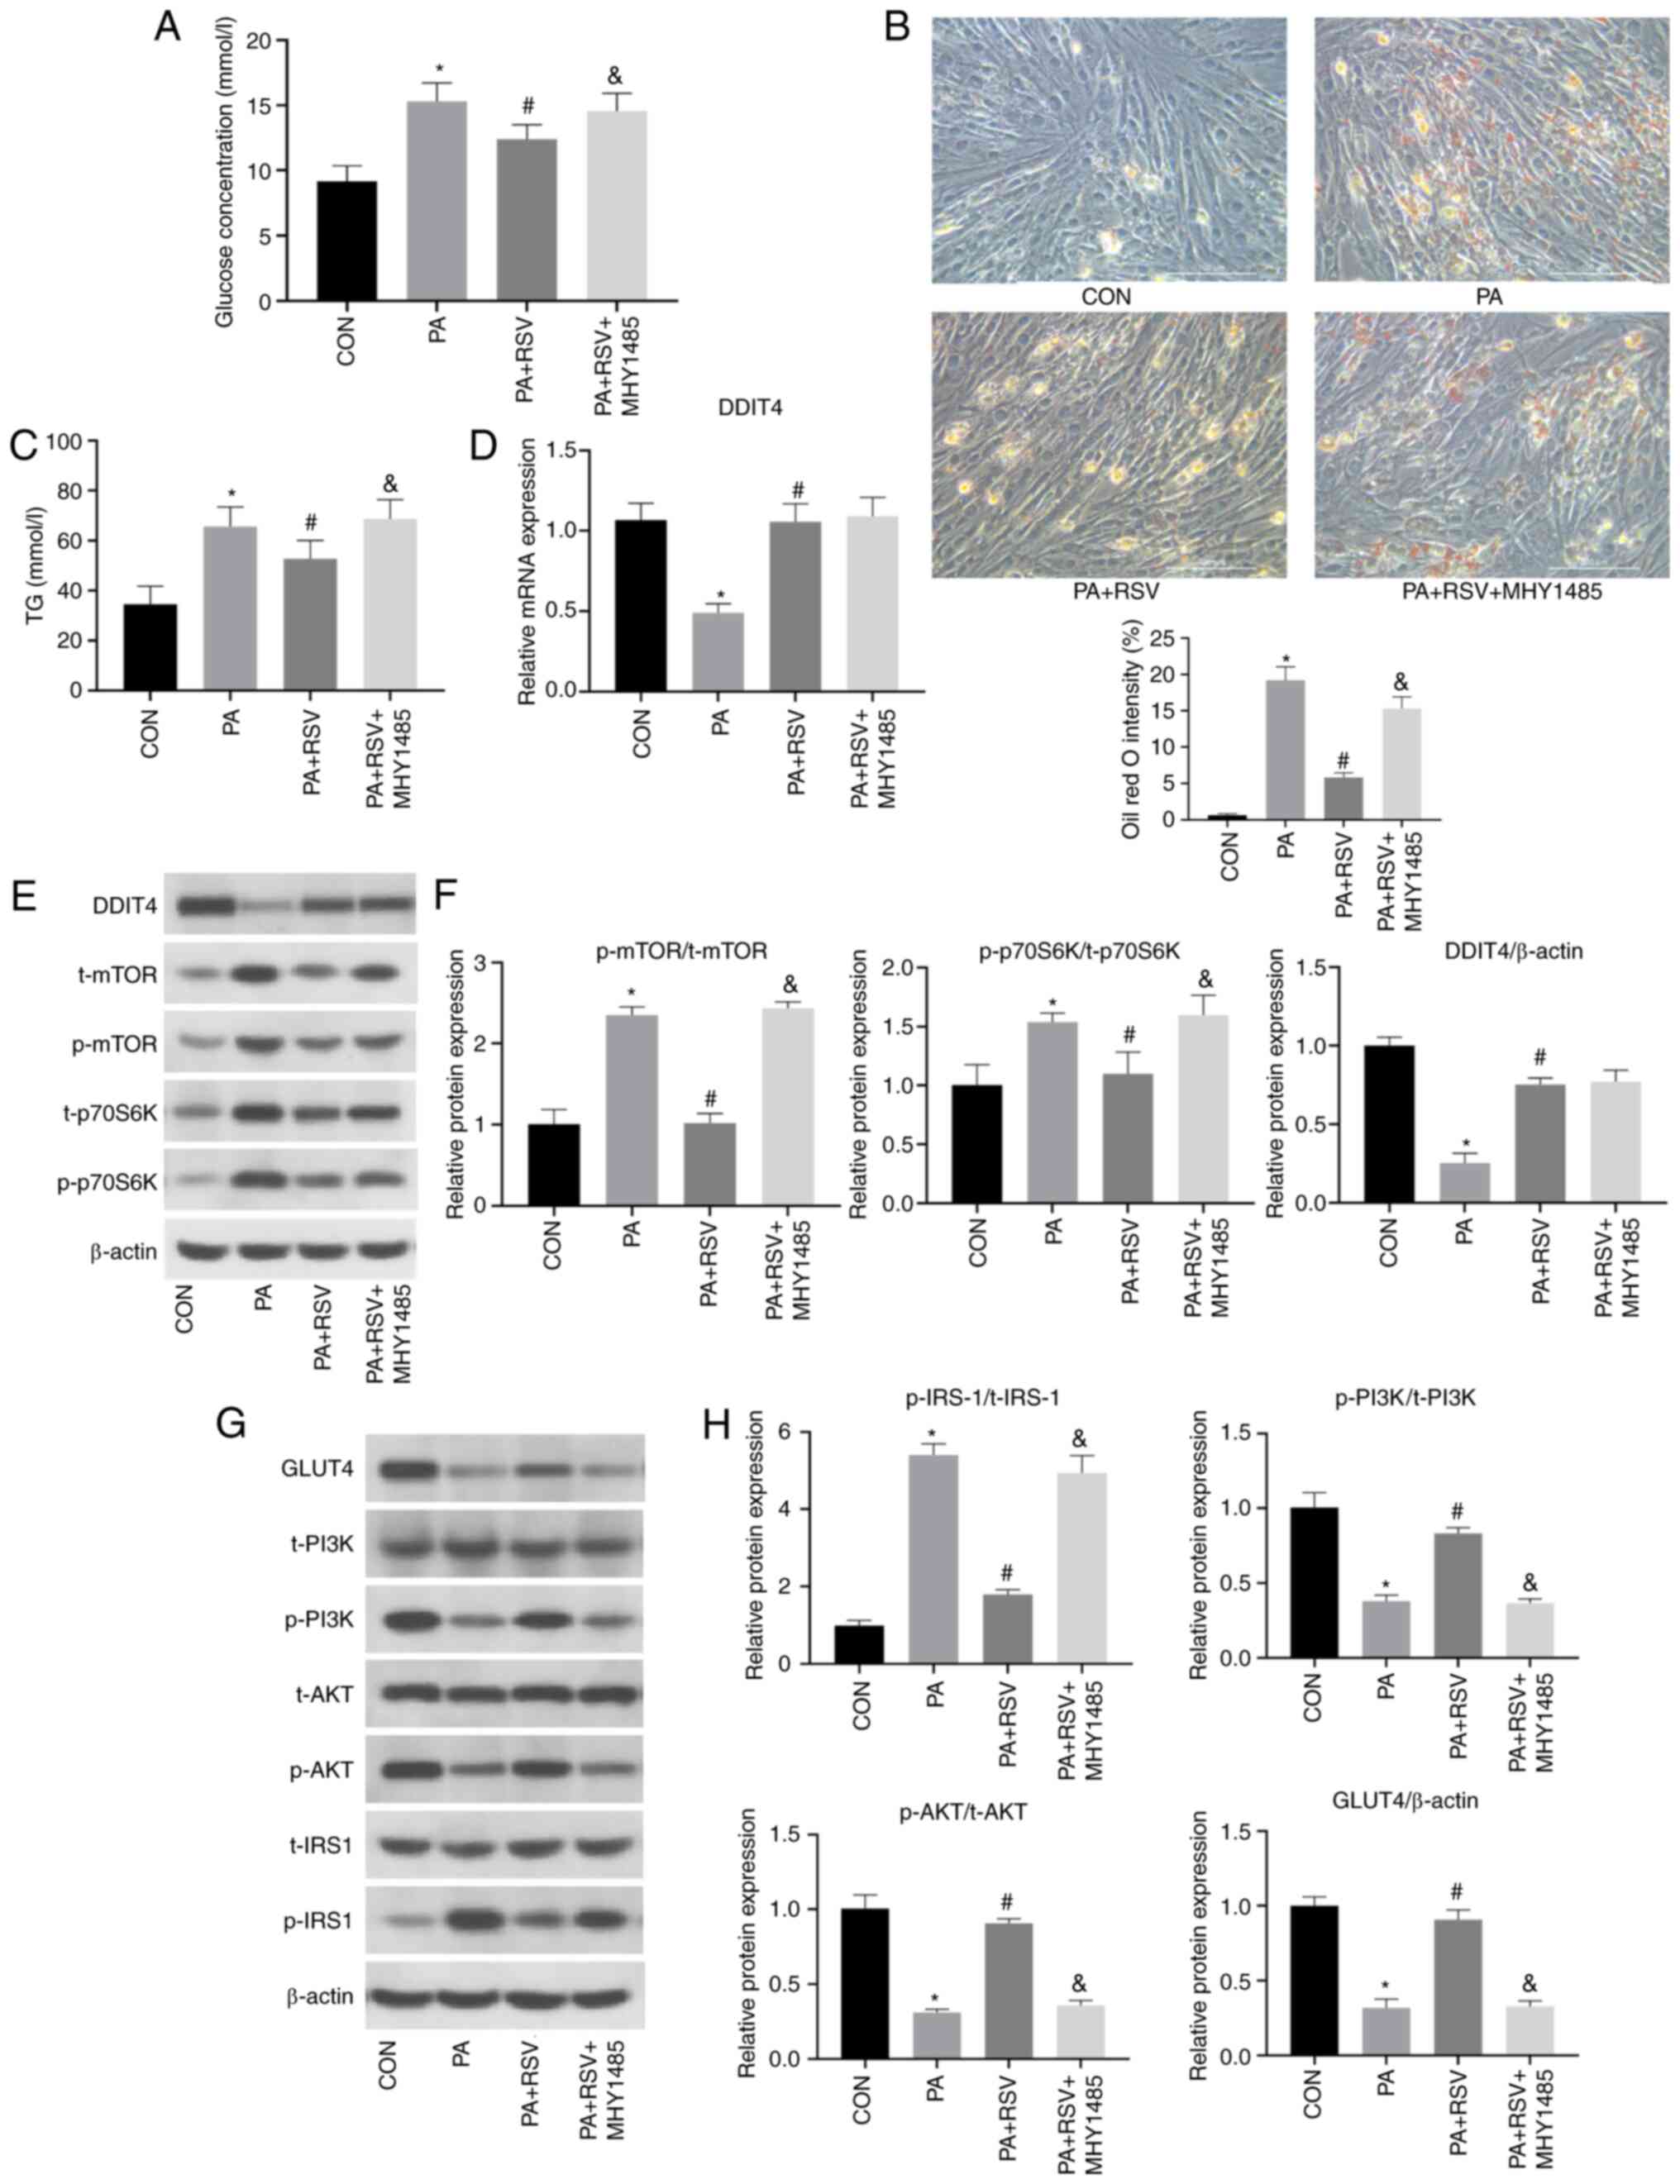 | Figure 5.Expression levels of indicators
related to the DDIT4, mTOR and insulin signaling pathways in
MHY1485-treated C2C12 cells with PA-induced insulin resistance. (A)
Glucose concentration in the culture medium of C2C12 cells was
increased after activation of mTOR. (B) Number of red lipid
droplets in C2C12 cells was increased after activation of mTOR, as
determined by Oil red O staining; magnification, ×400, scale bar,
100 µm. (C) TG content in C2C12 cells was increased after
activation of mTOR. (D) mRNA expression levels of DDIT4 after
activation of mTOR. (E) Protein expression levels of DDIT4 and mTOR
signaling pathway indicators after activation of mTOR. (F)
Semi-quantification of p-protein/t-protein ratios for mTOR
signaling pathway indicators and protein expression levels of DDIT4
after activation of mTOR. (G) Protein expression levels of insulin
signaling pathway indicators after activation of mTOR. (H)
Semi-quantification of p-protein/t-protein ratios for insulin
signaling pathway indicators and protein expression levels of GLUT4
after activation of mTOR. All cells were treated with 100 nM
insulin for 30 min before (A) detection of glucose contents and (E
and G) western blotting. Data are presented as the mean ± SD (n=3).
*P<0.05 vs. CON, #P<0.05 vs. PA,
&P<0.05 vs. PA + RSV. CON, control; RSV,
resveratrol; PA, palmitic acid; DDIT4, DNA damage-inducible
transcript 4; p70S6K, p70 ribosomal protein S6 kinase; IRS-1,
insulin receptor substrate-1; GLUT4, glucose transporter 4; p-,
phosphorylated; t-t, total; TG, triglyceride. |
In terms of lipid metabolism, the Oil red O-stained
lipid droplets and TG content in the cells were increased in the PA
+ RSV + MHY1485 group compared with those in the PA + RSV group
(Fig. 5B and C), indicating that
activation of the mTOR pathway reduced the effect of RSV on
improving cellular lipid deposition.
Notably, there were no differences in the mRNA and
protein expression levels of DDIT4 between the PA + RSV + MHY1485
group and the PA + RSV group (Fig.
5D-F), suggesting that MHY1485 did not affect the expression of
DDIT4. Compared with in the PA + RSV group, the t-protein and
p-protein expression levels for mTOR and p70S6K were increased in
the PA + RSV + MHY1485 group, and the p-protein/t-protein ratios
for mTOR and p70S6K were also increased (Fig. 5E and F), indicating that MHY1485
increased the mTOR pathway activity and counteracted the inhibitory
effect of RSV on the mTOR pathway.
Compared with in the PA + RSV group, the protein
expression levels of p-PI3K/t-PI3K, p-AKT/t-AKT and GLUT4 were
downregulated in the PA + RSV + MHY1485 group, whereas the protein
expression levels of p-IRS-1/t-IRS-1 were upregulated (Fig. 5G and H). These findings indicated
that activation of the mTOR pathway may weaken the effect of RSV
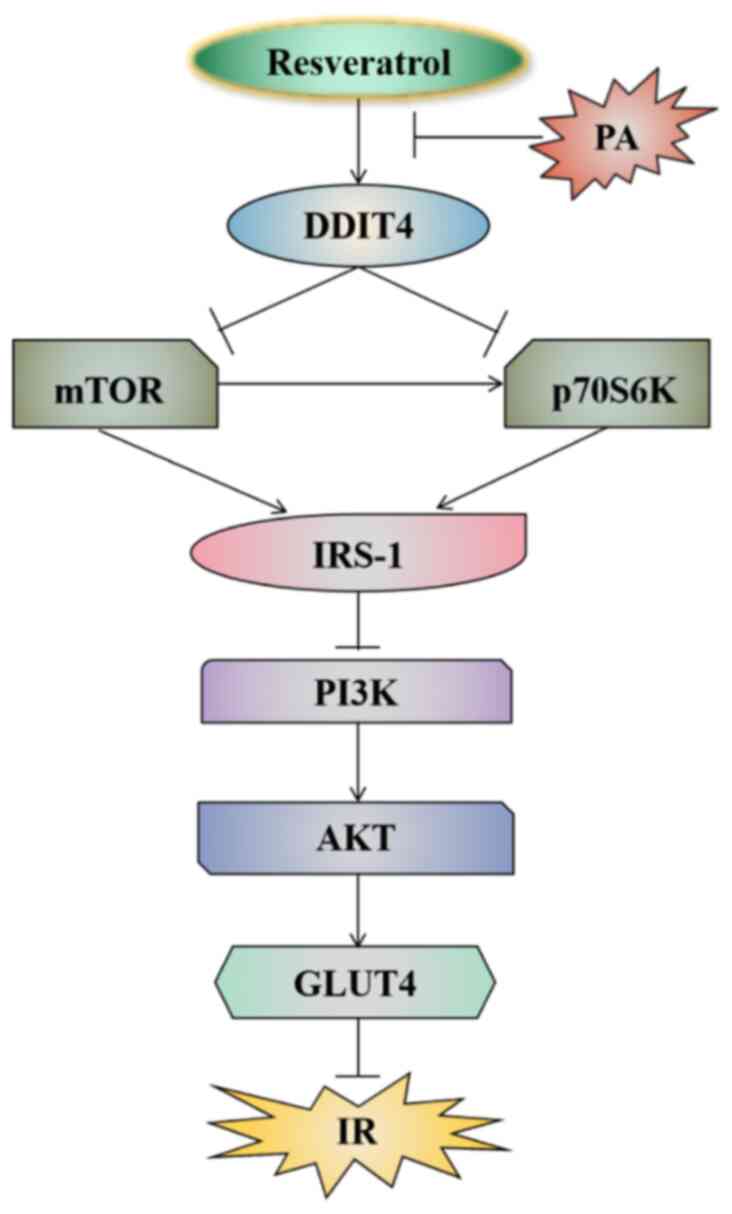
and lead to IR. The results of the present study revealed that RSV
could inhibit the mTOR pathway by increasing DDIT4, thereby
improving PA-induced IR and lipid deposition in C2C12 cells
(Fig. 6).
Discussion
RSV, a plant-derived compound, has the potential to
improve IR, a focus of numerous research groups. RSV has been
reported to alleviate IR in high-fructose corn syrup-fed rats
(27), improve IR in
hyperlipidemic mice and obese Zucker rats (28), improve abnormal liver glucose
metabolism induced by high-fat diet intake through adenosine
5′-monophosphate-activated protein kinase pathway (29), and upregulate mmu-microRNA-363-3p
through the PI3K/AKT pathway to improve high-fat diet-induced IR in
mice (30). RSV is an
anti-diabetic drug that warrants further research. In our previous
study, high-throughput sequencing showed that DDIT4 mRNA expression
was decreased in the skeletal muscle of high-fat diet-fed mice, and
was increased following treatment of these mice with RSV (31).
The present study established a PA-induced IR model
in C2C12 cells and used this model to study the effects of RSV on
improving IR in vitro. The concentration of RSV used was 30
µM, because 10 and 20 µM RSV had no significant effect on cell
survival rate, whereas 50 and 100 µM RSV significantly reduced the
cell survival rate. In a previous study from our group, RSV
treatment was found to improve IR and lipid deposition in the
skeletal muscle cells of high-fat diet-fed mice and PA-treated L6
rats (32). In the present study,
RSV was found to reverse the effect of PA on C2C12 cells,
upregulate the expression of DDIT4, inhibit the mTOR/P70S6K
pathway, reduce the expression of p-IRS-1, increase the expression
levels of p-PI3K and p-Akt in the insulin pathway, activate the
expression of GLUT4, promote glucose uptake, reduce lipid
deposition and alleviate PA-induced IR in C2C12 myocyte cells.
After silencing DDIT4 by DDIT4-siRNA transfection or activating
mTOR by MHY1485 treatment, the beneficial effects of RSV on
improving IR, and glucose and lipid metabolism were significantly
attenuated. These results indicated that RSV could inhibit the
mTOR/p70S6K signaling pathway activity through activation of DDIT4,
thereby improving IRS-1/PI3K/AKT/GLUT4 insulin signaling and
significantly alleviating IR, and improving glucose and lipid
metabolism.
DDIT4 is a potent mTOR inhibitor (33) involved in DNA damage repair, growth
during hypoxia, cell stress and other effects (34–36).
DDIT4 has been shown to inhibit the mTOR pathway and improve
insulin pathway signaling, whereas DDIT4 deficiency can increase
systemic glucose and promote IR, and impair skeletal muscle insulin
signaling (37). Sustained DDIT4
overexpression has been shown to inhibit mTOR activity in a
tuberous sclerosis complex 1/2 (TSC1/2)-mediated manner, with
significantly reduced levels of p-p70S6K and induction of AKT
phosphorylation at serine 473, whereas rapamycin-mediated mTOR
inhibition increases the phosphorylation level of AKT (38). High glucose can inhibit DDIT4 and
TSC1/2 in β-cells, upregulate Ras homolog enriched in
brain/mTOR/p70S6K, and enhance the expression of
apoptosis-regulating proteins (39). Furthermore, 1,25(OH)2D3
can activate the expression of DDIT4 in the renal tissue of
diabetic rats, reduce the expression of p-mTOR and p-p70S6K,
promote the downstream insulin pathway activity, inhibit the
proliferation of rat mesangial cells induced by high glucose, and
improve the glucose and lipid metabolism in diabetic rats (40,41).
Other studies have shown that activation of the mTOR/p70S6K
signaling pathway is a physiological feedback mechanism for
insulin-stimulated glucose transport in skeletal muscle cells,
leading to aberrant serine/tyrosine phosphorylation of IRS-1
(19,42). Further studies have confirmed that
the attenuation of free fatty acid-induced IR in skeletal muscle
cells by RSV is closely related to the inhibition of mTOR and
p70S6K (43). In the present
study, with the aim of further clarifying the underlying mechanism
for the involvement of the DDIT4/mTOR pathway in the improvement of
IR by RSV, DDIT4 was silenced by DDIT4-siRNA transfection and the
mTOR pathway was activated by MHY1485 treatment, after which, the
effects of RSV on improving glucose utilization and IR were
weakened. The results further revealed that RSV increased DDIT4
expression, inhibited mTOR and p70S6K activation, increased the
expression of IRS-1/PI3K/AKT/GLUT4 insulin pathway indicators, and
promoted insulin signaling transduction and glucose uptake, which
may comprise one of the mechanisms for the RSV-mediated improvement
in skeletal muscle IR. However, a limitation of the present study
is that the mechanism was verified only in skeletal muscle cells
in vitro. We aim to further explore the relationship between
RSV and the DDIT4/mTOR pathway in vivo using an animal
model.
In conclusion, the present study confirmed that RSV
could inhibit the mTOR/p70S6K pathway by increasing the expression
of DDIT4, thereby ameliorating IR and alleviating lipid deposition
in C2C12 cells.
Acknowledgements
Not applicable.
Funding
This study was partially supported by the Scientific Research
Project of Hebei Provincial Administration of Traditional Chinese
Medicine (grant no. 2023010).
Availability of data and materials
The datasets used and/or analyzed during the current
study are available from the corresponding author on reasonable
request.
Authors' contributions
XP and GS conceived and designed the study. XP, CL,
XW, MZ, ZZ, XZ and CW acquired and analyzed the data. XP, CW and GS
confirm the authenticity of all the raw data. XP prepared the draft
of the manuscript. All authors read and approved the final
manuscript.
Ethics approval and consent to
participate
Not applicable.
Patient consent for publication
Not applicable.
Competing interests
The authors declare that they have no competing
interests.
Glossary
Abbreviations
Abbreviations:
|
RSV
|
resveratrol
|
|
IR
|
insulin resistance
|
|
PA
|
palmitic acid
|
|
DDIT4
|
DNA damage-inducible transcript 4
|
|
p70S6K
|
p70 ribosomal protein S6 kinase
|
|
IRS-1
|
insulin receptor substrate-1
|
|
GLUT4
|
glucose transporter 4
|
|
TG
|
triglyceride
|
References
|
1
|
Wang Y, Yang LZ, Yang DG, Zhang QY, Deng
ZN, Wang K and Mao XJ: MiR-21 antagomir improves insulin resistance
and lipid metabolism disorder in streptozotocin-induced type 2
diabetes mellitus rats. Ann Palliat Med. 9:394–404. 2020.
View Article : Google Scholar : PubMed/NCBI
|
|
2
|
Fernandes GW and Bocco BMLC: Hepatic
mediators of lipid metabolism and ketogenesis: Focus on fatty liver
and diabetes. Curr Diabetes Rev. 17:e1103201875392021. View Article : Google Scholar : PubMed/NCBI
|
|
3
|
Petersen MC and Shulman GI: Mechanisms of
insulin action and insulin resistance. Physiol Rev. 98:2133–2223.
2018. View Article : Google Scholar : PubMed/NCBI
|
|
4
|
Merz KE and Thurmond DC: Role of skeletal
muscle in insulin resistance and glucose uptake. Compr Physiol.
10:785–809. 2020. View Article : Google Scholar : PubMed/NCBI
|
|
5
|
Houzelle A, Jörgensen JA, Schaart G,
Daemen S, van Polanen N, Fealy CE, Hesselink MKC, Schrauwen P and
Hoeks J: Human skeletal muscle mitochondrial dynamics in relation
to oxidative capacity and insulin sensitivity. Diabetologia.
64:424–436. 2021. View Article : Google Scholar : PubMed/NCBI
|
|
6
|
Robertson I, Wai Hau T, Sami F, Sajid Al
M, Badgujar V, Murtuja S, Saquib Hasnain M, Khan A, Majeed S and
Tahir Ansari M: The science of resveratrol, formulation,
pharmacokinetic barriers and its chemotherapeutic potential. Int J
Pharm. 618:1216052022. View Article : Google Scholar : PubMed/NCBI
|
|
7
|
Su M, Zhao W, Xu S and Weng J: Resveratrol
in treating diabetes and its cardiovascular complications: A review
of its mechanisms of action. Antioxidants (Basel). 11:10852022.
View Article : Google Scholar : PubMed/NCBI
|
|
8
|
Mongioì LM, La Vignera S, Cannarella R,
Cimino L, Compagnone M, Condorell RA and Calogero AE: The role of
resveratrol administration in human obesity. Int J Mol Sci.
22:43622021. View Article : Google Scholar : PubMed/NCBI
|
|
9
|
Barber TM, Kabisch S, Randeva HS, Pfeiffer
AFH and Weickert MO: Implications of resveratrol in obesity and
insulin resistance: A state-of-the-art review. Nutrients.
14:28702022. View Article : Google Scholar : PubMed/NCBI
|
|
10
|
Kang BB and Chiang BH: Amelioration of
insulin resistance using the additive effect of ferulic acid and
resveratrol on vesicle trafficking for skeletal muscle glucose
metabolism. Phytother Res. 34:808–816. 2020. View Article : Google Scholar : PubMed/NCBI
|
|
11
|
Abo Alrob O, Al-Horani RA, Altaany Z and
Nusair MB: Synergistic beneficial effects of resveratrol and diet
on high-fat diet-induced obesity. Medicina (Kaunas). 58:13012022.
View Article : Google Scholar : PubMed/NCBI
|
|
12
|
Meng Q, Li J, Wang C and Shan A:
Biological function of resveratrol and its application in animal
production: A review. J Anim Sci Biotechno. 14:252023. View Article : Google Scholar
|
|
13
|
Shahwan M, Alhumaydhi F, Ashraf GM, Hasan
PMZ and Shamsi A: Role of polyphenols in combating type 2 diabetes
and insulin resistance. Int J Biol Macromol. 206:567–579. 2022.
View Article : Google Scholar : PubMed/NCBI
|
|
14
|
Koundouros N and Blenis J: Targeting mTOR
in the context of diet and whole-body metabolism. Endocrinology.
163:bqac0412022. View Article : Google Scholar : PubMed/NCBI
|
|
15
|
Fan H, Wu Y, Yu S, Li X, Wang A, Wang S,
Chen W and Lu Y: Critical role of mTOR in regulating aerobic
glycolysis in carcinogenesis (review). Int J Oncol. 58:9–19. 2021.
View Article : Google Scholar : PubMed/NCBI
|
|
16
|
Rapaka D, Bitra VR, Challa SR and Adiukwu
PC: mTOR signaling as a molecular target for the alleviation of
Alzheimer's disease pathogenesis. Neurochem Int. 155:1053112022.
View Article : Google Scholar : PubMed/NCBI
|
|
17
|
Ong PS, Wang LZ, Dai X, Tseng SH, Loo SJ
and Sethi G: Judicious toggling of mTOR activity to combat insulin
resistance and cancer: Current evidence and perspectives. Front
Pharmacol. 7:3952016. View Article : Google Scholar : PubMed/NCBI
|
|
18
|
Pan S, Lin H, Luo H, Gao F, Meng L, Zhou
C, Jiang C, Guo Y, Ji Z, Chi J and Guo H: Folic acid inhibits
dedifferentiation of PDGF-BB-induced vascular smooth muscle cells
by suppressing mTOR/P70S6K signaling. Am J Transl Res. 9:1307–1316.
2017.PubMed/NCBI
|
|
19
|
Faheem Sivasubrmanian S: Fathoming the
role of mTOR in diabetes mellitus and its complications. Curr Mol
Pharmacol. 16:520–529. 2023.PubMed/NCBI
|
|
20
|
Hayasaka M, Tsunekawa H, Yoshinaga M and
Murakami T: Endurance exercise induces REDD1 expression and
transiently decreases mTORC1 signaling in rat skeletal muscle.
Physiol Rep. 2:e122542014. View Article : Google Scholar : PubMed/NCBI
|
|
21
|
Gordon BS, Williamson DL, Lang CH,
Jefferson LS and Kimball SR: Nutrient-induced stimulation of
protein synthesis in mouse skeletal muscle is limited by the mTORC1
repressor REDD1. J Nutr. 145:708–713. 2015. View Article : Google Scholar : PubMed/NCBI
|
|
22
|
Lipina C and Hundal HS: Is REDD1 a
metabolic éminence grise? Trends Endocrinol Metab. 27:868–880.
2016. View Article : Google Scholar : PubMed/NCBI
|
|
23
|
DeYoung MP, Horak P, Sofer A, Sgroi D and
Ellisen LW: Hypoxia regulates TSC1/2-mTOR signaling and tumor
suppression through REDD1-mediated 14-3-3 shuttling. Genes Dev.
22:239–251. 2008. View Article : Google Scholar : PubMed/NCBI
|
|
24
|
Regazzetti C, Dumas K, Le Marchand-Brustel
Y, Peraldi P, Tanti JF and Giorgetti-Peraldi S: Regulated in
development and DNA damage responses-1 (REDD1) protein contributes
to insulin signaling pathway in adipocytes. PLoS One. 7:e521542012.
View Article : Google Scholar : PubMed/NCBI
|
|
25
|
Shengchen W, Jing L, Yujie Y, Yue W and
Shiwen X: Polystyrene microplastics-induced ROS overproduction
disrupts the skeletal muscle regeneration by converting myoblasts
into adipocytes. J Hazard Mater. 417:1259622021. View Article : Google Scholar : PubMed/NCBI
|
|
26
|
Livak KJ and Schmittgen TD: Analysis of
relative gene expression data using real-time quantitative PCR and
the 2(−Delta Delta C(T)) method. Methods. 25:402–408. 2001.
View Article : Google Scholar : PubMed/NCBI
|
|
27
|
Babacanoglu C, Yildirim N, Sadi G, Pektas
MB and Akar F: Resveratrol prevents high-fructose corn
syrup-induced vascular insulin resistance and dysfunction in rats.
Food Chem Toxicol. 60:160–167. 2013. View Article : Google Scholar : PubMed/NCBI
|
|
28
|
Sung MM, Kim TT, Denou E, Soltys CM, Hamza
SM, Byrne NJ, Masson G, Park H, Wishart DS, Madsen KL, et al:
Improved glucose homeostasis in obese mice treated with resveratrol
is associated with alterations in the gut microbiome. Diabetes.
66:418–425. 2017. View Article : Google Scholar : PubMed/NCBI
|
|
29
|
Lu C, Xing H, Yang L, Chen K, Shu L, Zhao
X and Song G: Resveratrol ameliorates high-fat-diet-induced
abnormalities in hepatic glucose metabolism in mice via the
AMP-activated protein kinase pathway. Evid Based Complement
Alternat Med. 2021:66169062021. View Article : Google Scholar : PubMed/NCBI
|
|
30
|
Shu L, Zhao H, Huang W, Hou G, Song G and
Ma H: Resveratrol upregulates mmu-miR-363-3p via the PI3K-Akt
pathway to improve insulin resistance induced by a high-fat diet in
mice. Diabetes Metab Syndr Obes. 13:391–403. 2020. View Article : Google Scholar : PubMed/NCBI
|
|
31
|
Liu Z, Zhang Z, Song G, Wang X, Xing H and
Wang C: Resveratrol alleviates skeletal muscle insulin resistance
by downregulating long noncoding RNA. Int J Endocrinol.
2022:25395192020.PubMed/NCBI
|
|
32
|
Zhang YJ, Zhao H, Dong L, Zhen YF, Xing
HY, Ma HJ and Song GY: Resveratrol ameliorates high-fat
diet-induced insulin resistance and fatty acid oxidation via
ATM-AMPK axis in skeletal muscle. Eur Rev Med Pharmacol Sci.
23:9117–9125. 2019.PubMed/NCBI
|
|
33
|
Dennis MD, Coleman CS, Berg A, Jefferson
LS and Kimball SR: REDD1 enhances protein phosphatase 2A-mediated
dephosphorylation of Akt to repress mTORC1 signaling. Sci Signal.
7:ra682014. View Article : Google Scholar : PubMed/NCBI
|
|
34
|
Ellisen LW, Ramsayer KD, Johannessen CM,
Yang A, Beppu H, Minda K, Oliner JD, McKeon F and Haber DA: REDD1,
a developmentally regulated transcriptional target of p63 and p53,
links p63 to regulation of reactive oxygen species. Mol Cell.
10:995–1005. 2002. View Article : Google Scholar : PubMed/NCBI
|
|
35
|
Shoshani T, Faerman A, Mett I, Zelin E,
Tenne T, Gorodin S, Moshel Y, Elbaz S, Budanov A, Chajut A, et al:
Identification of a novel hypoxia-inducible factor 1-responsive
gene, RTP801, involved in apoptosis. Mol Cell Biol. 22:2283–2293.
2002. View Article : Google Scholar : PubMed/NCBI
|
|
36
|
Wang Z, Malone MH, Thomenius MJ, Zhong F,
Xu F and Distelhorst CW: Dexamethasone-induced gene 2 (dig2) is a
novel pro-survival stress gene induced rapidly by diverse apoptotic
signals. J Biol Chem. 278:27053–27058. 2003. View Article : Google Scholar : PubMed/NCBI
|
|
37
|
Dungan CM, Wright DC and Williamson DL:
Lack of REDD1 reduces whole body glucose and insulin tolerance, and
impairs skeletal muscle insulin signaling. Biochem Biophys Res
Commun. 453:778–783. 2014. View Article : Google Scholar : PubMed/NCBI
|
|
38
|
Jin HO, Hong SE, Kim JH, Choi HN, Kim K,
An S, Choe TB, Hwang CS, Lee JH, Kim JI, et al: Sustained
overexpression of Redd1 leads to Akt activation involved in cell
survival. Cancer Lett. 336:319–324. 2013. View Article : Google Scholar : PubMed/NCBI
|
|
39
|
Yang Z, Liu F, Qu H, Wang H, Xiao X and
Deng H: 1, 25(OH)2D3 protects β cell against high
glucose-induced apoptosis through mTOR suppressing. Mol Cell
Endocrinol. 414:111–119. 2015. View Article : Google Scholar : PubMed/NCBI
|
|
40
|
Chen DP, Ma YP, Zhuo L, Zhang Z, Zou GM,
Yang Y, Gao HM and Li WG: 1,25-Dihydroxyvitamin D3
inhibits the proliferation of rat mesangial cells induced by high
glucose via DDIT4. Oncotarget. 9:418–427. 2017. View Article : Google Scholar : PubMed/NCBI
|
|
41
|
Wang H, Wang J, Qu H, Wei H, Ji B, Yang Z,
Wu J, He Q, Luo Y, Liu D, et al: In vitro and in vivo inhibition of
mTOR by 1,25-dihydroxyvitamin D3 to improve early
diabetic nephropathy via the DDIT4/TSC2/mTOR pathway. Endocrine.
54:348–359. 2016. View Article : Google Scholar : PubMed/NCBI
|
|
42
|
Vlavcheski F and Tsiani E: Attenuation of
free fatty acid-induced muscle insulin resistance by rosemary
extract. Nutrients. 10:16232018. View Article : Google Scholar : PubMed/NCBI
|
|
43
|
Den Hartogh DJ, Vlavcheski F, Giacca A and
Tsiani E: Attenuation of free fatty acid (FFA)-induced skeletal
muscle cell insulin resistance by resveratrol is linked to
activation of AMPK and inhibition of mTOR and p70S6K. Int J Mol
Sci. 21:49002020. View Article : Google Scholar : PubMed/NCBI
|