Introduction
Vault RNAs (vtRNAs) have been reported as components
of vault, the largest ribonucleoprotein particles found in
eukaryotic cells, from amoebas to mammals (1,2).
Four vault RNA genes; VTRNA1-1 (98 bp), VTRNA1-2 (88
bp), VTRNA1-3 (88 bp) and VTRNA2-1 (108 bp), are
expressed in humans and these non-coding RNAs are transcribed by
polymerase III (3). VTRNA1-1,
VTRNA1-2 and VTRNA1-3 are highly homologous and are
clustered on chromosome 5q31.3. The less homologous paralogue,
VTRNA2-1, located on chromosome 5q31.1, encodes vtRNA2-1,
previously named as precursor microRNA-886 (2,4,5).
Among these genes, the gene product of VTRNA1-1, vtRNA1-1,
has been reported to be strongly up-regulated during influenza A
virus and Epstein-Barr virus infections, and to serve a role in
viral establishment and apoptosis suppression (6–8).
These previous studies have suggested the involvement of vtRNA1-1
in viral evasion from the innate immune system. It has also been
reported that expression of vtRNA1-1 suppressed apoptosis in cancer
cells and its overexpression was related to drug resistance in
cancer cells (9–12). As a mechanism of drug resistance,
vtRNA1-1 can recognise and bind chemotherapeutic compounds, such as
mitoxantrone, in human glioblastoma-, leukaemia- and
osteocarcinoma-derived cell lines (9). VtRNA1-1 also associates with an
RNA/DNA-binding protein, PSF, in MCF-7 cells, inducing the
oncogene, GAGE6 (10).
Knock-out of vtRNA1-1 in HeLa cells has been reported to cause
mis-regulation of the PI3K/Akt signalling pathway and the ERK1/2
MAPK cascade, leading to increased apoptosis (11). Another study with liver cancer
cells suggested the role of vtRNA1-1 in lysosome-mediated
chemoresistance (12). Recently,
Horos et al (13) reported
that vtRNA1-1 binds to sequestosoma-1/p62, repressing autophagy as
a riboregulator (14). Therefore,
vtRNA1-1 is one of the multifaceted modulators of pro-survival
characteristics and tumorigenesis (15). However, the function of
extracellular vtRNA1-1 remains unknown.
Vault RNAs are expressed in numerous cell types, are
localised in the cytoplasm and are secreted from cells into the
extracellular space. Extracellular vtRNA1-1 is found in exosomes,
small extracellular vesicles, which serve roles in inter-cellular
communication, and in the promotion and metastasis of cancer cells
(16). Transport of vtRNA1-1 into
exosomes is regulated by YBX1 proteins (17). Ramayanti et al (18) used vtRNA1-1 as an internal control
to measure serum microRNAs in patients with malignancy considering
its consistent detection, small variation in its levels and its PCR
amplification with efficiencies similar to those for microRNAs
(18). However, the relation
between serum vtRNA1-1 levels and certain diseases is unknown.
In the present study, the clinical significance of
serum vtRNA1-1 levels in patients with blood diseases was assessed.
First, a method to measure the serum levels of vtRNA1-1 using
reverse transcription-quantitative PCR (RT-qPCR), with spiked RNA
to correct for the inconsistencies in RNA extraction and
measurement, was proposed and optimised. The stability and
sub-localisation of extracellular vtRNA1-1 in serum was then
determined. The serum levels of vtRNA1-1 in patients with blood
diseases in different disease states were assessed to determine the
clinical significance of serum vtRNA1-1.
Materials and methods
Clinical samples
Archived serum samples from patients requiring
laboratory tests and transplant donors visiting or hospitalised in
the Department of Haematology, Tottori University Hospital (Yonago,
Japan) between September 2020 and February 2022 were used in the
present study. Serum was obtained from blood collected without
anticoagulants by centrifugation at 1,900-2,200 × g for 7 min at
room temperature. The serum samples were used for the subsequent
clinical tests. The residual samples were stored at 4°C until use
in this study. The present study was approved by the Ethics
Committee at Tottori University Faculty of Medicine (approval no.
18A115). Informed consent was obtained using an opt-out
approach.
Fractionation of exosomes and the
other extracellular vesicles
Exosomes were isolated from serum using the affinity
purification method with Tim4-bound beads (MagCapture™ Exosome
Isolation Kit PS; FUJIFILM Wako Pure Chemical Corporation) as per
the manufacturer's instructions (19). Briefly, serum samples were
incubated with Tim4-bound beads at 4°C for ≥3 h. After incubation
and magnetic selection, the supernatant was transferred and
centrifuged at 10,000 × g for 30 min at 4°C. Large extracellular
vesicles were concentrated in the pellet (P10 fraction) and the
residual supernatant (S10 fraction) contained serum proteins,
ribonucleoproteins and phosphatidylserine-negative small
extracellular vesicles. The beads were washed three times to obtain
the Tim4 fraction. The three fractions were subjected to lysis for
protein and RNA extraction.
RNA extraction and RT-qPCR with spiked
MS2 RNA
RNA was extracted from 200 µl serum (stored for ≤21
days at 4°C) using the spin column method (miRNeasy Serum/Plasma
Advanced Kit; Qiagen KK) by centrifugation at 12,000 × g for 1 min
at room temperature, and from serum fractions (Tim4-bound beads,
pellets and supernatants) using the organic method (RNAzol RT;
Molecular Research Center, Inc.) according to the manufacturers'
instructions. Before RNA extraction, lysis buffer was mixed with
bacteriophage MS2 RNA (0.8 ng/sample, Roche Diagnostics) as a
spiked control to correct for inconsistent RNA extraction rates and
transfer RNA from Saccharomyces cerevisiae (spin column
method, 1 µg; organic method 5.5 µg; Sigma-Aldrich; Merck KGaA) as
a carrier. One-step RT-PCR was performed using a 50 µl reaction
mixture containing 900 nM forward and reverse primers, 250 nM
probe, 1 µl ROX Reference Dye (50 X), One Step PrimeScript III
RT-qPCR Mix (both from Takara Bio, Inc.) and 2 µl extracted RNA
(equivalent to 20 µl serum). The mixture was incubated at 52°C for
5 min for reverse transcription, followed by the inactivation of
transcriptase at 95°C for 10 sec and subsequent PCR amplification
consisted of 50 cycles of denaturation at 95°C for 15 sec and
annealing and extension at 60°C for 1 min using an ABI7300 Real
Time PCR System (Thermo Fisher Scientific, Inc.). Primers and
probes were purchased from Takara Bio, Inc. (Table I).
 | Table I.Sequence of primers and probes used
for reverse transcription-quantitative PCR. |
Table I.
Sequence of primers and probes used
for reverse transcription-quantitative PCR.
| Target | Sequence
(5′-3′) |
|---|
| vtRNA1-1 | F:
GGCTGGCTTTAGCTCAGCG |
|
| R:
AAGGACTGGAGAGCGCCC |
|
| P:
FAMCAAGCAACCTGTCTGGGTTGTTCGAGACCTAM |
| MS2 RNA | F:
GGGTTTCCGTCTTGCTCGTA |
|
| R:
GGACTTCATGCTGTCGGTGA |
|
| P:
FAMCCACTGTCGTGCTTTTCGCTGAAGAACTTGTAM |
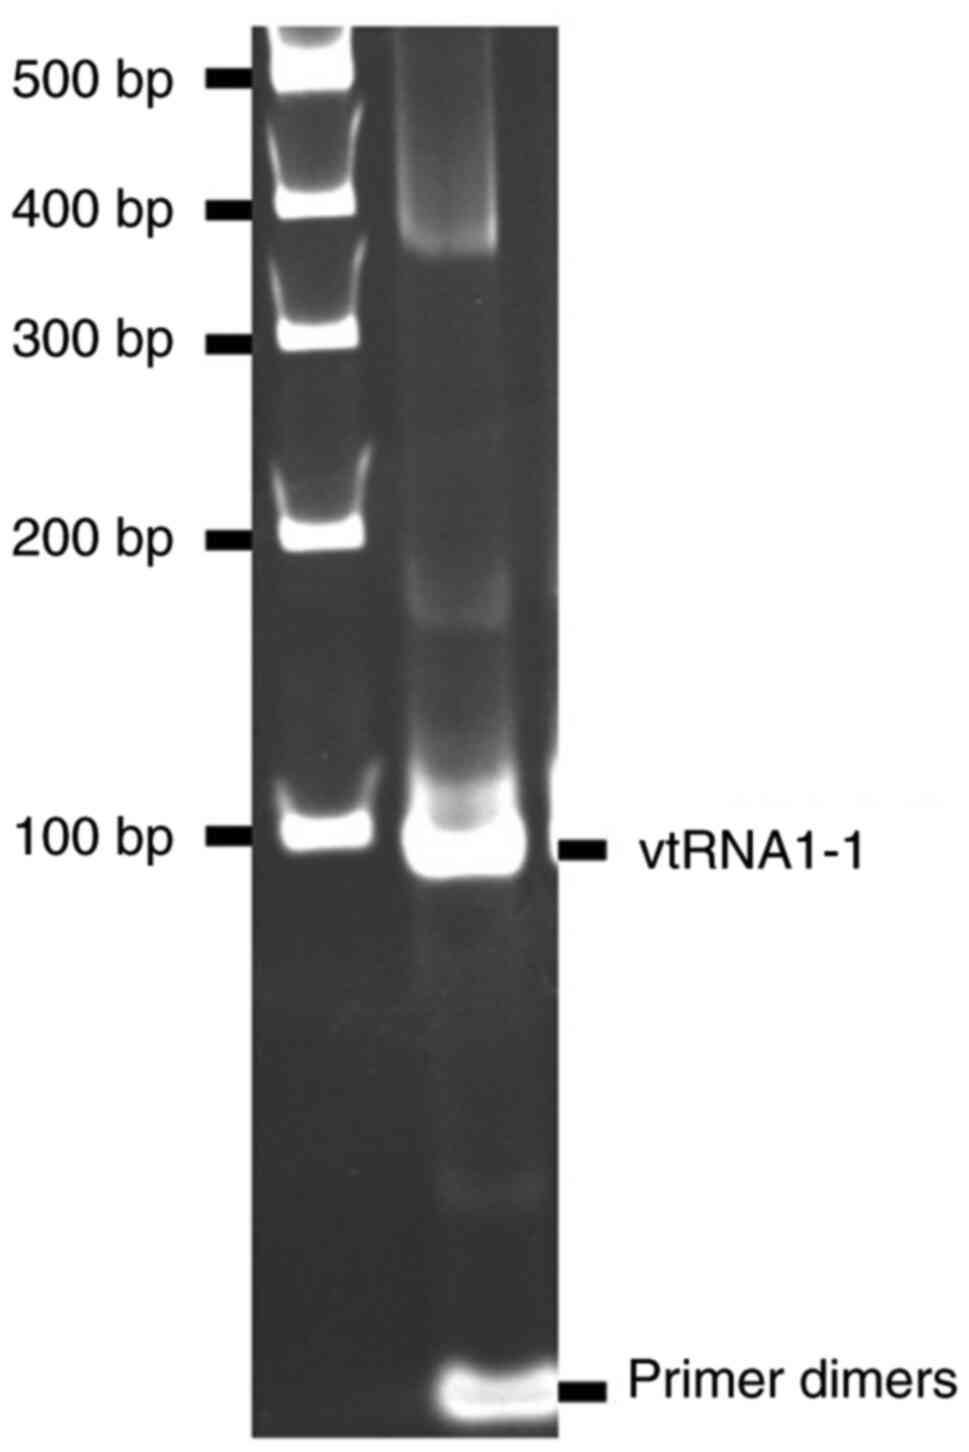
PCR products of vtRNA1-1 were examined using 5%
polyacrylamide gel electrophoresis and ethidium bromide staining
after 50 more cycles of PCR amplification, which was performed
using 2 µl qPCR product and TaKaRa Ex Taq DNA polymerase (Takara
Bio, inc.) with the aforementioned conditions, with the exception
of denaturation at 95°C for 10 min. The amplified band (Fig. 1) was purified after gel
electrophoresis and amplified again with the same conditions. The
product obtained was purified using the spin column method (QIAamp
DNA Mini Kit; Qiagen KK) by centrifugation at 6,000 × g for 1 min
at room temperature and used to generate calibration curves for the
measurement of vtRNA1-1 expression levels. The correction for the
measured values of vtRNA1-1 levels was made using the Ct
values for MS2 RNA spiked in lysis buffer according to the
following equation: corrected value (cps/ml)=measured value
(cps/ml)/2(Ct value of MS2 RNA spiked in RNA extraction lysis
buffer-Ct value of MS2 RNA in each sample).
DNA contamination was assessed using PCR without RT.
RNA samples were subjected to semi-qPCR amplification using GeneAce
Probe qPCR Mix II (Nippon Gene Co., Ltd.), which consisted of
denaturation at 95°C for 10 min followed by 50 cycles of
denaturation at 95°C for 15 sec, and annealing and extension at
60°C for 1 min using an ABI7300 Real Time PCR System (Thermo Fisher
Scientific, Inc.). Ct values for vtRNA1-1 were compared
with the measured Ct values for vtRNA1-1
aforementioned.
The amount of vtRNA1-1 in each serum fraction was
determined using RT-qPCR, as aforementioned. The corrected values
were normalised to that in the Tim4 fraction.
Gel electrophoresis and western
blotting
The three fractions were lysed using SDS sample
buffer (62.5 mM Tris-HCl, pH 6.8, 2% w/v SDS, 10% w/v glycerol,
0.005% w/v BPB), separated using SDS-PAGE on 10% gels and
transferred onto a membrane (ClearTrans SP PVDF Membrane, Fujifilm,
Japan). Western blot signals were detected using Amersham ECL Prime
Western Blotting Detection Reagents (Cytiva) and images were
captured using a MultiImager II (MISVS II, BioTools, Inc.).
Membranes were incubated at 4°C overnight with anti-CD63 (cat. no.
3-13; FUJIFILM Wako Pure Chemical Corporation; 1:1,000), anti-CD9
(cat. no. 1K; FUJIFILM Wako Pure Chemical Corporation; 1:1,000) and
anti-CD81 (cat. no. 17B1; FUJIFILM Wako Pure Chemical Corporation;
1:2,000) primary monoclonal antibodies. Membranes were washed with
PBS and 0.05% Tween-20 and then incubated with peroxidase-labelled
goat polyclonal anti-murine IgG and IgM (H+L) (cat. no. 5220-0343;
SeraCare Life Sciences, Inc.; 1: 6,000 for negative control,
1:12,500 for CD63, and 1:25,000 for CD9 and CD81).
Statistical analysis
The enrolled individuals were classified into four
groups, namely patients with malignancy in active disease (AD),
patients with malignancy receiving chemotherapy (CTx), patients
with malignancy receiving intensive chemotherapy (ICTx) and
patients with malignancy in inactive disease (ID). The ID group
included patients with malignancies in partial or complete
remission after chemotherapy or indolent diseases without symptoms.
Patients with non-malignant diseases, regardless of treatment, and
transplant donors were included in the ID group. The ICTx group
included patients receiving intensive chemotherapy requiring
hospitalisation. Patients receiving other chemotherapies, which
included cytotoxic drugs, targeted drugs and/or antibody drugs,
were classified in the CTx group.
Data were analysed using EZR (version 1.35, Jichi
Medical University Saitama Medical Center), which is a Japanese
user interface for R (version 2.3–0) (20). The correlation coefficient between
two variables was calculated using the Spearman's rank correlation
test and, pairwise comparisons were performed using the Student's
t-test or Mann-Whitney U test, and multiple comparisons were
performed using one-way ANOVA with Bonferroni correction or
Kruskal-Wallis test followed by pairwise Mann-Whitney U comparisons
with the Bonferroni correction.
Results
Stability of serum vtRNA1-1
vtRNA1-1 levels in the serum, stored overnight at 4,
−20, or −80°C, were quantified. The vtRNA1-1 levels in frozen
samples were significantly reduced in the −20°C and markedly
reduced in the −80°C compared with those in the 4°C sample, which
indicated the degradation of vtRNA1-1 during the freezing and
thawing process (Fig. 2A). The
serum was then stored for three weeks and vtRNA1-1 was quantified.
The vtRNA1-1 levels were significantly decreased after a single day
of storage at −20°C and remained stable thereafter whereas serum
vtRNA1-1 stored at 4°C was stable for three weeks (Fig. 2B). Freezing and thawing resulted in
a marked reduction in serum vtRNA1-1 levels. Therefore, serum was
stored at 4°C for use in subsequent assays. RNA extraction was
performed within 21 days of storage.
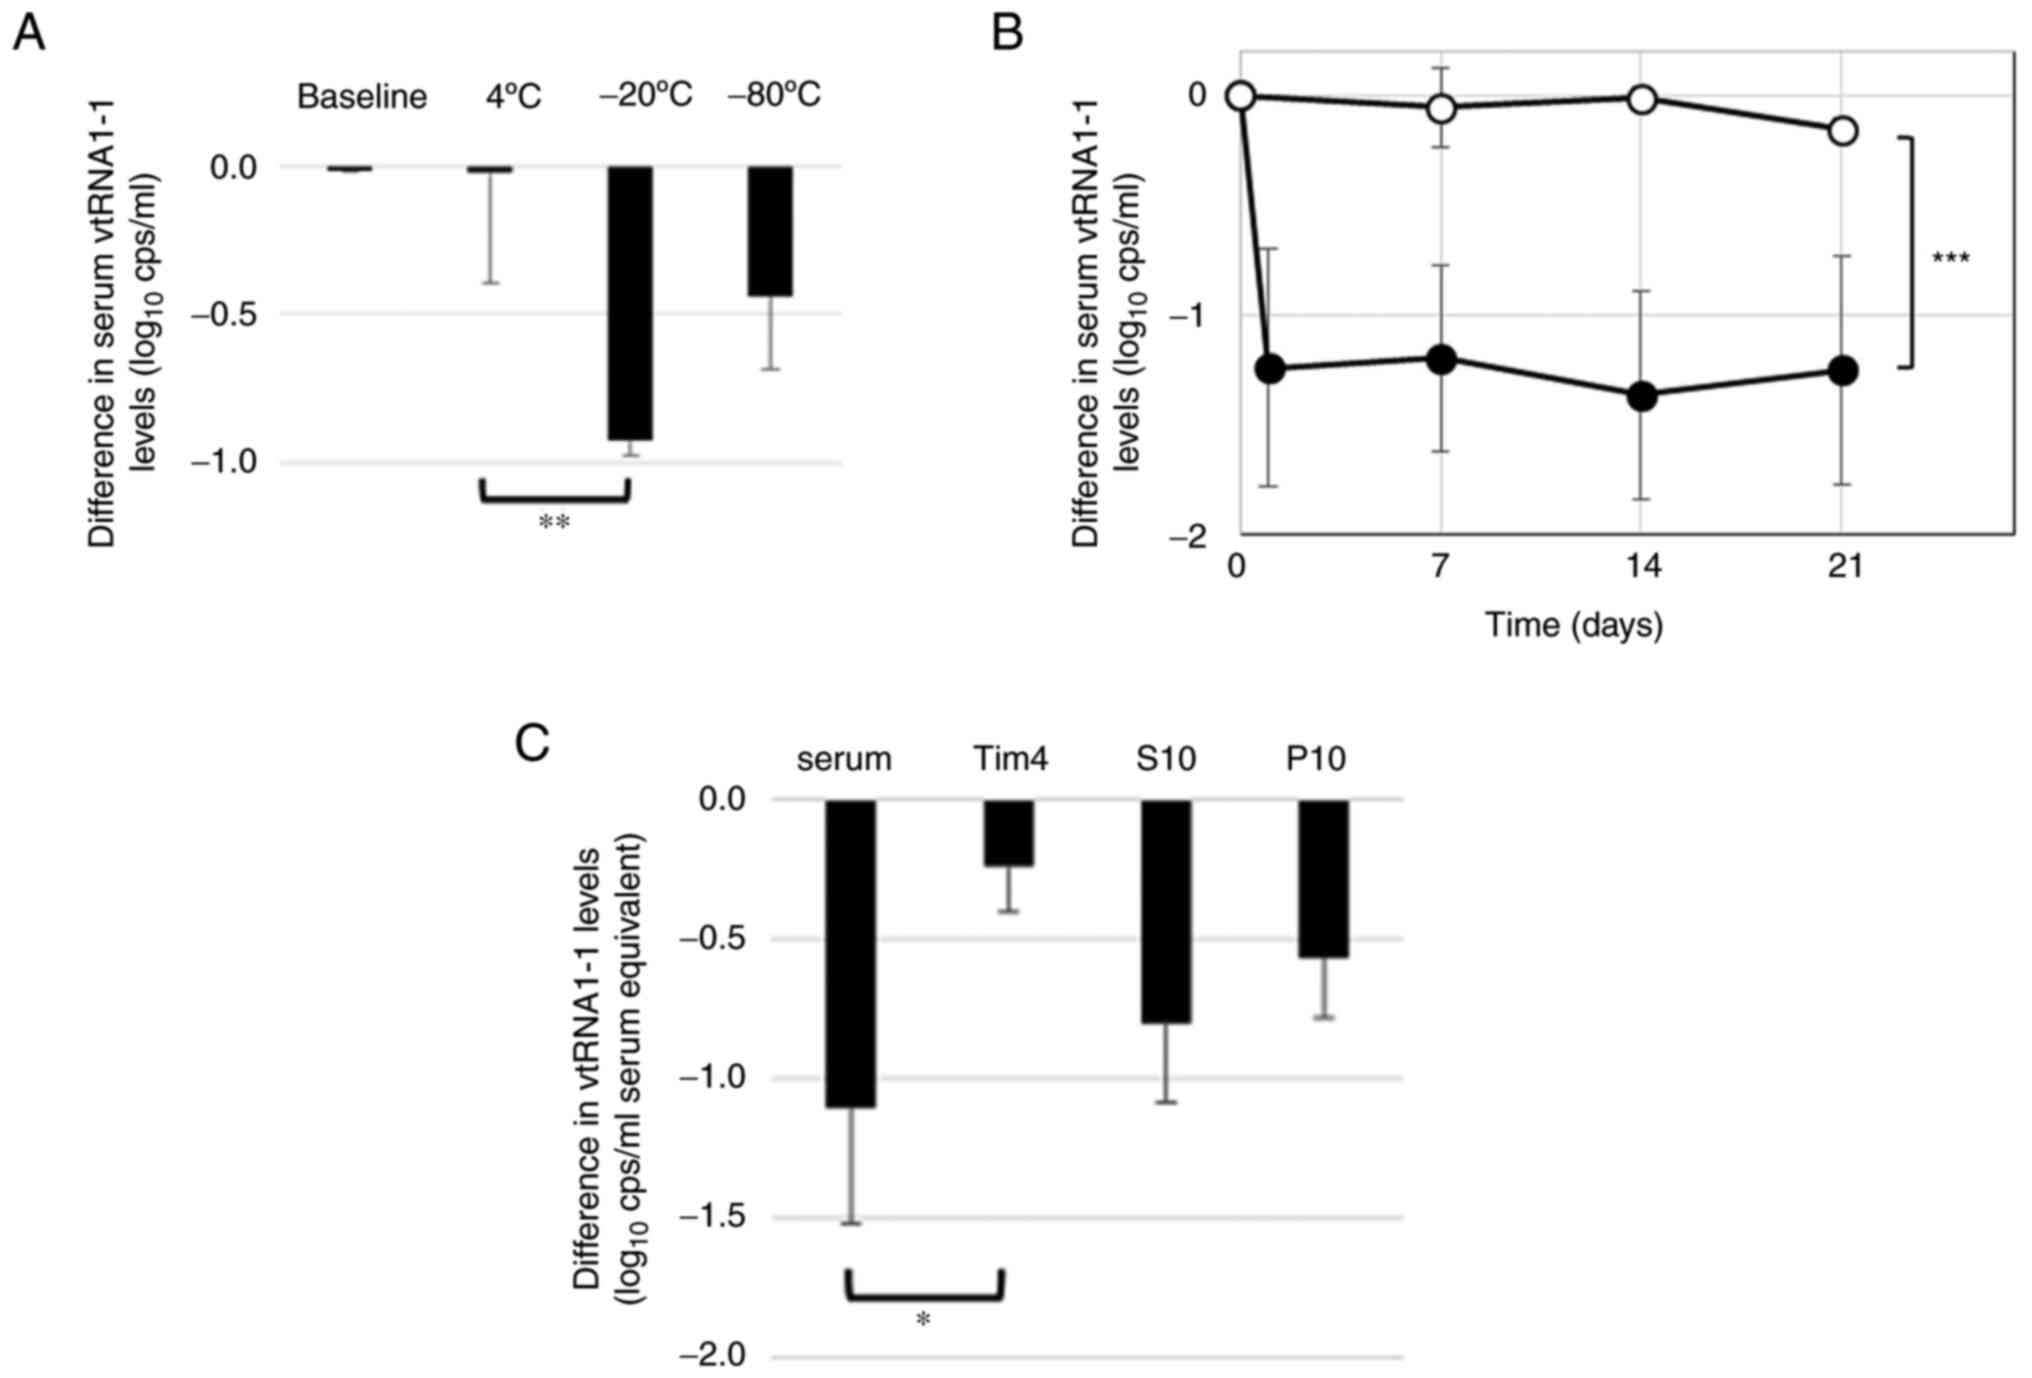 | Figure 2.Stability of serum vtRNA1-1. RT-qPCR
was used to quantify serum vtRNA1-1 levels at baseline and in serum
stored at 4, −20, or 80°C (A) overnight or (B) 4°C (open circles,
n=4) or −20°C (closed circles, n=4) for 1, 7, 14 and 21 days. (C)
The affinity purification method with Tim4-bound beads followed by
centrifugation was used to fractionate serum samples (fractions
stored at −20°C). RT-qPCR was used to quantify vtRNA1-1 in each
fraction before and after storage. The values were normalised to
the baseline values obtained before storage in the log scale; the
differences from the baseline values are shown. Bars indicated the
standard deviation. Pairwise comparison was performed using the (B)
Student's t-test and (A and C) ANOVA with the Bonferroni correction
as required. *P<0.05, **P<0.01 and ***P<0.001. RT-qPCR,
reverse transcription-quantitative PCR; S10, supernatant fraction;
P10, pellet fraction; vtRNA, vault RNA; cps, copies. |
Sub-localisation of serum
vtRNA1-1
The affinity method using Tim4-bound beads allowed
the collection of phosphatidylserine-positive vesicles and highly
purified exosomes (19).
Centrifugation at 10,000 × g following the affinity method was used
to separate the serum into the Tim4, S10 and P10 fraction.
Tetraspanins, which are exosomal markers, were analysed using
western blotting (Fig. 3). CD63,
the marker that was used to isolate exosomes (17), was found in the Tim4 fraction,
which indicated efficient purification of exosomes. CD9 and CD81
were identified in all fractions, which suggested that these
proteins were also present in other vesicles, including the large
extracellular vesicles (separated in the P10 fractions) and
phosphatidylserine-negative small extracellular vesicles (separated
in the S10 fractions). Furthermore, vtRNA1-1 was quantified using
RT-qPCR in all fractions and a markedly larger amount was present
in the S10 fraction (Fig. 3).
Thus, serum vtRNA1-1 was not confined to the exosome fractions.
Freezing and thawing degraded serum vtRNA1-1, as aforementioned.
The stability of vtRNA1-1 in each fraction was tested by freezing
and thawing. The amount of vtRNA1-1 in any fraction reduced after
freezing and thawing. vtRNA1-1 in the Tim4 fractions was
demonstrated to be the most resistant to freezing and thawing
whereas that in P10 and S10 fractions was more susceptible
(Fig. 2C). These results suggested
that serum vtRNA1-1 existed in different modalities in different
fractions.
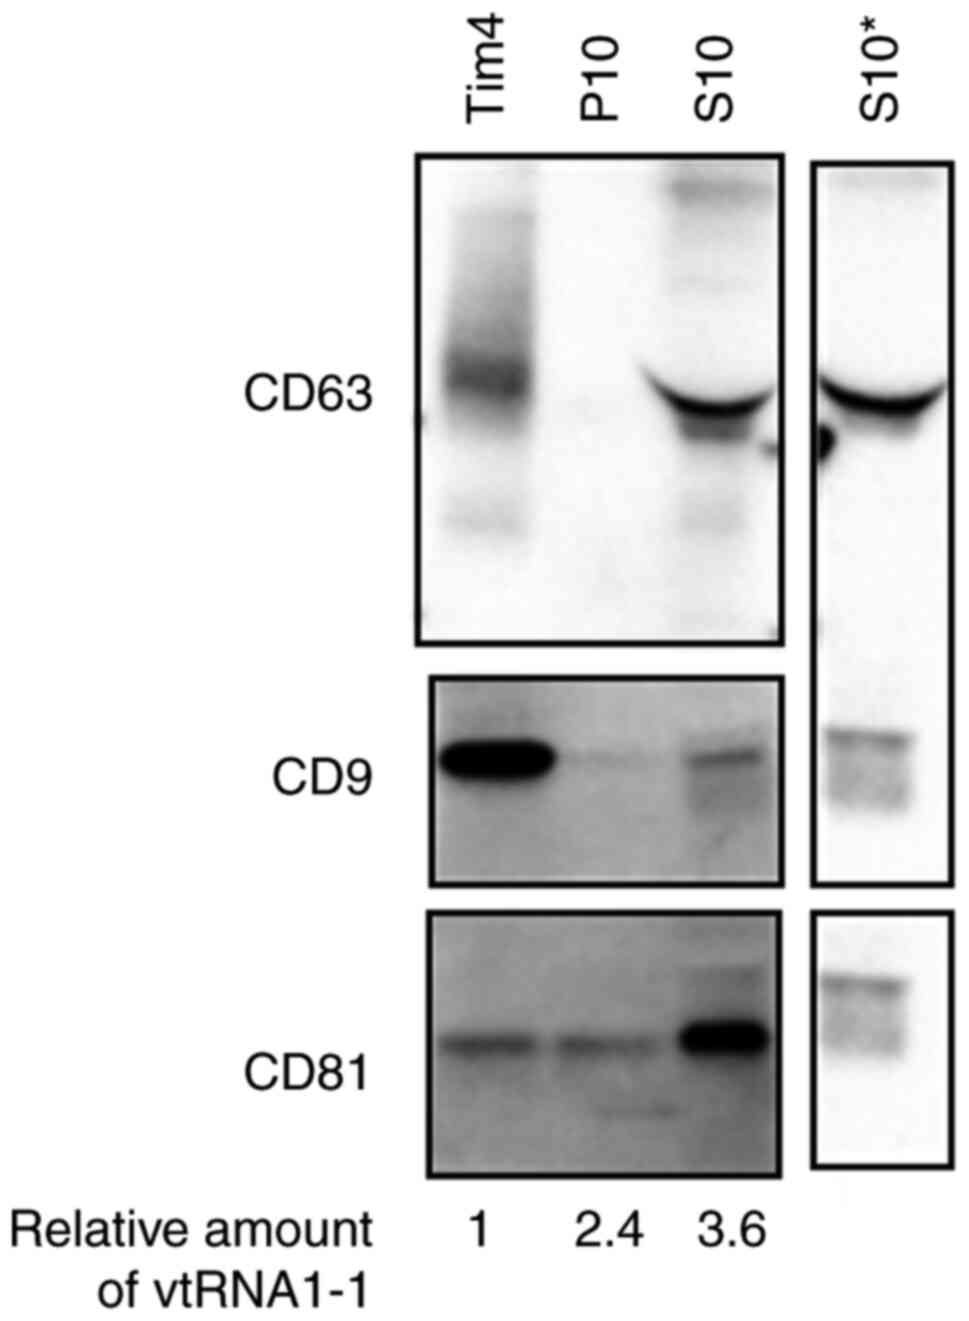 | Figure 3.Sub-localisation of serum vtRNA1-1.
Western blotting was used to assess the expression of CD63, CD9 and
CD81 in each fraction (Tim4, S10 and P10). The representative
results from four similar experiments are presented, images were
cropped from different blots and the original full-length blots
were presented in Fig. S1. The
loaded Tim4, P10 and S10 fractions were equivalent to 5, 5 and 1 µl
serum, respectively. The amounts of vtRNA1-1 in the corresponding
fraction were determined using RT-qPCR and the relative amounts
normalised to the amount in the Tim4 fraction are indicated at the
bottom (mean values, n=7). *Primary antibody was excluded from
comparison because of the presence of non-specific signals. S10,
supernatant fraction; P10, pellet fraction; vtRNA, vault RNA. |
Serum levels of vtRNA1-1 in patients
with blood diseases
To investigate the clinical significance of serum
vtRNA1-1, serum vtRNA1-1 levels in patients with blood diseases
were quantified. Bacteriophage MS2 RNA was added as a spiked RNA to
the lysis buffer in advance and its Ct value was used
for correction of inconsistent extraction rate and PCR efficiency.
DNA contamination rates were evaluated using PCR without RT and
were negligible [mean ± standard deviation (SD) 0.52±1.08%; n=7].
Thereafter, the serum levels of vtRNA1-1 in 102 individuals with
various blood malignancies and non-malignant diseases, in different
disease status, including transplant donors were assessed.
Diagnoses and disease status were presented in Table II. The mean and median serum
vtRNA1-1 levels in all individuals were 8.10±0.54 log10
cps/ml and 8.06 log10 cps/ml (range, 6.52–10.01),
respectively (Table III). Mean
and median of RNA extraction rates for 102 serum samples determined
using Ct values of spiked MS2 RNA were 49.7% (SD 27.1%)
and 51.9% (range, 1.1–127.5%), respectively. The inconsistent RNA
extraction rates were apparent. Without correction using the spiked
controls, the mean value decreased to 7.72 log10 cps/ml
and the SD increased to 0.69; the variance increased from 0.29 to
0.47. These findings indicated that correction using spiked RNA was
necessary to determine accurate values for serum vtRNA1-1
levels.
| Table II.Diagnosis and disease status. |
Table II.
Diagnosis and disease status.
| A, Patients with
malignant disease (n=76) |
|---|
|
|---|
|
|
| Disease status,
n |
|---|
|
|
|
|
|---|
| Diagnosis | n | AD | CTx | ICTx | ID |
|---|
| Total | 76 | 22 | 28 | 5 | 21 |
| Myeloid
neoplasm | 29 | 11 | 10 | 4 | 4 |
| Acute
myeloid leukemia | 8 | 1 | 2 | 4 | 1 |
|
Myelodysplastic syndrome | 4 | 2 | 1 | 0 | 1 |
|
Myeloproliferative
neoplasms | 16 | 7 | 7 | 0 | 2 |
| Chronic
myelomonocytic leukemia | 1 | 1 | 0 | 0 | 0 |
| Lymphoid
neoplasm | 47 | 11 | 18 | 1 | 17 |
|
Non-Hodgkin lymphoma | 26 | 8 | 7 | 0 | 11 |
| Hodgkin
lymphoma | 2 | 0 | 1 | 0 | 1 |
| Acute
lymphoid leukemia | 2 | 1 | 1 | 0 | 0 |
| Chronic
lymphocytic leukemia | 1 | 1 | 0 | 0 | 0 |
|
Multiple myeloma | 15 | 1 | 9 | 1 | 4 |
|
Langerhans cell
histiocytosis | 1 | 0 | 0 | 0 | 1 |
|
| B, Patients with
nonmalignant disease (n=26) |
|
|
|
| Disease status,
n |
|
|
|
|
|
Diagnosis | n | AD | CTx | ICTx | AD |
|
| Total | 26 | 0 | 1 | 0 | 25 |
| Iron deficiency
anemia | 3 | 0 | 0 | 0 | 3 |
| Hemophilia A | 2 | 0 | 0 | 0 | 2 |
| Factor XIII
deficiency | 4 | 0 | 0 | 0 | 4 |
| Pernicious
anemia | 1 | 0 | 0 | 0 | 1 |
| Immune
thrombocytopeniaa | 6 | 0 | 1 | 0 | 5 |
| Aplastic
anemia | 4 | 0 | 0 | 0 | 4 |
| Castleman
disease | 1 | 0 | 0 | 0 | 1 |
| Stress
erythrocytosis | 1 | 0 | 0 | 0 | 1 |
| Heart disease | 1 | 0 | 0 | 0 | 1 |
| Transplant
donor | 3 | 0 | 0 | 0 | 3 |
| Table III.Serum vtRNA1-1 levels in relation to
age, sex, diagnosis and disease status. |
Table III.
Serum vtRNA1-1 levels in relation to
age, sex, diagnosis and disease status.
|
|
| vtRNA1-1,
log10 cps/ml |
|
|---|
|
|
|
|
|
|---|
| Group | n | Mean (SD) | Median (range) |
P-valued |
|---|
| Total | 102 | 8.10 (0.54) | 8.06
(6.52–10.01) |
|
| Age |
|
|
| NS |
| <65
years | 45 | 8.11 (0.52) | 8.16
(6.79–9.38) |
|
| ≥65
years | 57 | 8.10 (0.55) | 8.04
(6.52–10.01) |
|
| Sex |
|
|
|
|
|
Male | 52 | 8.21 (0.56) | 8.10
(6.52–9.38) | P<0.05 |
|
Female | 50 | 7.99 (0.49) | 8.00
(6.79–10.01) |
|
| Diagnosis |
|
|
| NS |
| Myeloid
malignancy | 29 | 8.05 (0.75) | 8.04
(6.52–10.01) |
|
|
Lymphoid malignancy | 47 | 8.16 (0.47) | 8.04
(7.37–9.38) |
|
|
Non-malignant disease | 26 | 8.06 (0.33) | 8.09
(7.28–8.76) |
|
| Disease
statusd |
|
|
|
|
| AD | 22 | 8.55 (0.65) | 8.53
(7.61–10.01) |
P<0.05a, P<0.01b, P<0.05c |
|
CTx | 29 | 8.06 (0.32) | 8.04
(7.59–8.80) |
P<0.05b |
|
ICTx | 5 | 6.98 (0.53) | 6.83
(6.52–7.90) |
P<0.01c |
| ID | 46 | 8.04 (0.34) | 8.05
(7.28–8.76) |
|
The ID group included patients with malignancy in
complete remission for >1 year and patients with non-malignant
diseases which were under control. Therefore, among the four
groups, this group was the closest to a group of healthy
individuals; therefore, the ID group was taken as a control. The
mean and median serum vtRNA1-1 levels in the ID group (n=46) were
8.04 log10 cps/ml (SD 0.34) and 8.05 log10
cps/ml (range, 7.28–8.76), respectively (Table III). Comparison of demographic
values demonstrated that vtRNA1-1 levels in males were
significantly higher compared with those in females. No correlation
was observed between age and vtRNA1-1 levels (RS
−0.0203, P=0.840, n=102; Tables
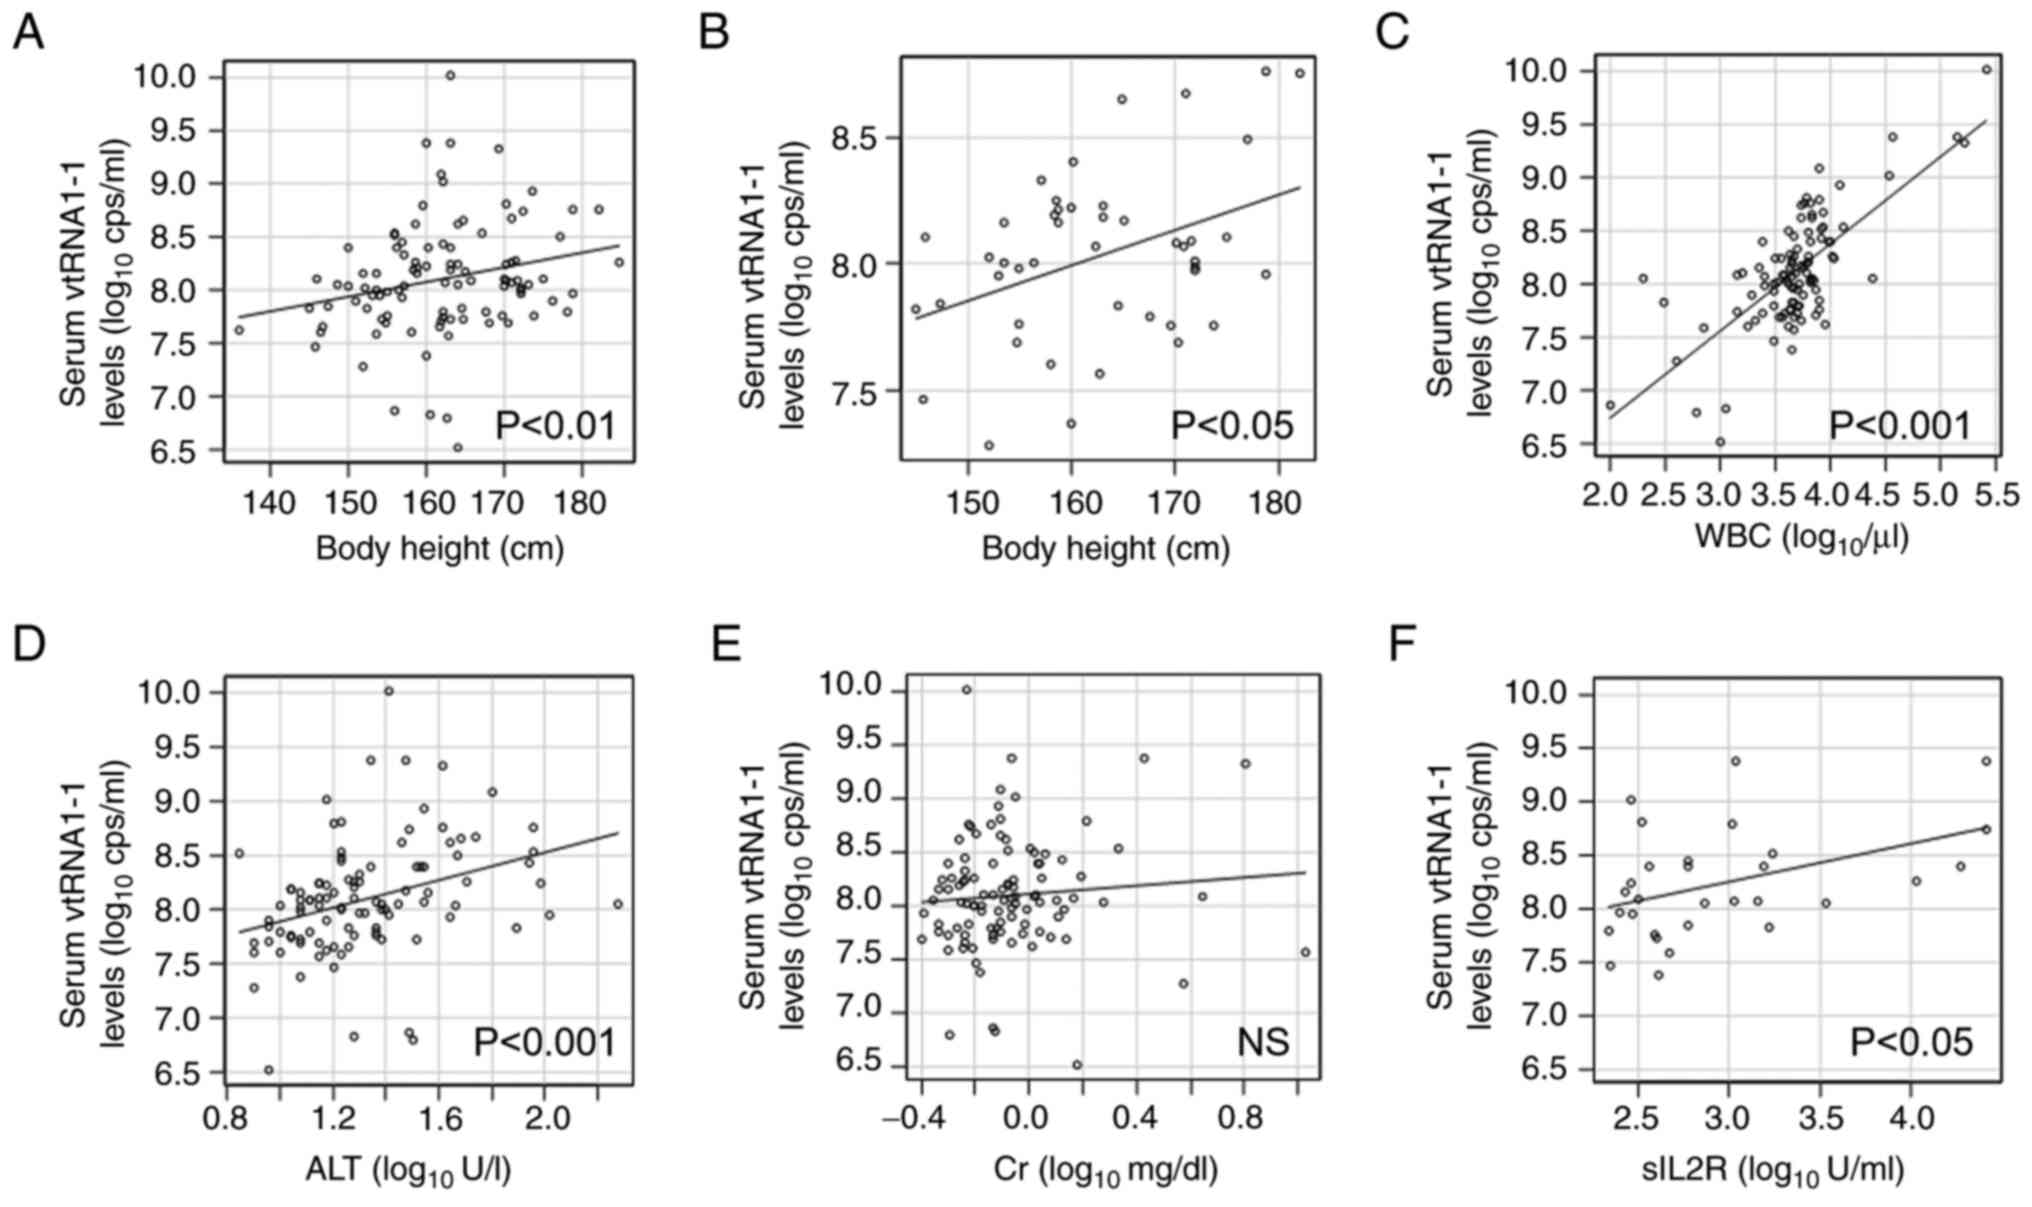
III and IV). There was a
significant correlation between serum vtRNA1-1 levels and physical
constitution except body mass index (RS 0.275,
P<0.01, n=101; Fig. 4A,
Table III). Even in the ID
group, body height remained significantly correlated with vtRNA1-1
levels (RS 0.304, P<0.05, n=45; Fig. 4B), which suggested that physique,
but not obesity, had certain correlation with serum vtRNA1-1
levels. Comparison of laboratory data with vtRNA1-1 levels
demonstrated that blood counts, particularly leukocyte counts,
regardless of leukocyte components, had a strong significant
correlation with serum vtRNA1-1 levels (RS 0.596,
P<0.001, n=102; Fig. 4C,
Table IV). Furthermore, liver
enzymes and C-reactive protein levels were significantly correlated
with serum vtRNA1-1 levels (RS 0.419, P<0.001,
n=102 and RS 0.220, P<0.05, n=96,
respectively; Fig. 4D, Table IV). However, creatinine levels
demonstrated no correlation with serum vtRNA1-1 levels
(RS 0.117, P=0.243, n=102; Fig. 4E, Table IV).
| Table IV.Age, physical constitution, and
laboratory data and their correlations with serum vtRNA1-1
levels. |
Table IV.
Age, physical constitution, and
laboratory data and their correlations with serum vtRNA1-1
levels.
| Characteristic | n | Mean (SD) | Median (range) |
RS | P-value |
|---|
| Age, years | 102 | 62.4 (16.8) | 66 (13–94) | −0.0203 |
|
| Physical
constitution |
|
|
|
|
|
| Body
height, cm | 101 | 162 (9.1) | 162 (136–185) | 0.275 | P<0.01 |
| Body
weight, kg | 102 | 57.2 (11.9) | 55.1
(29.1–100) | 0.303 | P<0.01 |
| Body
mass index, kg/m2 | 101 | 21.6 (3.4) | 21.5
(13.2–34.3) | 0.151 |
|
| Body
surface area, m2 | 101 | 1.60 (0.19) | 1.58
(1.11–2.24) | 0.296 | P<0.01 |
| Blood counts |
|
|
|
|
|
| White
blood cells, ×103/µl | 102 | 11.0 (32.2) | 4.8 (0.1–256) | 0.596 | P<0.001 |
|
Granulocytes,
×103/µl | 100 | 4.4 (8.8) | 2.9 (0–80.9) | 0.416 | P<0.001 |
|
Monocytes,
×103/µl | 100 | 0.75 (4.27) | 0.26 (0–42.9) | 0.407 | P<0.001 |
|
Lymphoid cells,
×103/µl | 100 | 3.1 (12.9) | 1.4
(0.056–126) | 0.441 | P<0.001 |
| Red
blood cells, ×104/µl | 102 | 381 (98) | 404 (153–609) | 0.267 | P<0.01 |
|
Reticulocytes,
×104/µl | 98 | 7.2 (4.8) | 6.7
(0.22–27.6) | 0.145 |
|
|
Platelets,
×103/µl | 102 | 188 (226) | 171 (8–2173) | 0.127 |
|
| Chemistry |
|
|
|
|
|
| Total
protein, g/dl | 94 | 6.6 (0.8) | 6.7 (4.2–8.7) | 0.109 |
|
|
Albumin, g/dl | 93 | 3.9 (0.7) | 4.0 (1.5–5.5) | 0.037 |
|
| Total
bilirubin, mg/dl | 101 | 0.85 (0.57) | 0.7 (0.2–4.6) | −0.060 |
|
|
Aspartate aminotransferase,
U/l | 102 | 27.1 (17.0) | 22 (9–111) | 0.374 | P<0.001 |
| Alanine
aminotransferase, U/l | 102 | 27.4 (25.8) | 19 (7–189) | 0.419 | P<0.001 |
|
Alkaline phosphatase, U/l | 99 | 92.3 (72.2) | 76 (33–695) | 0.308 | P<0.01 |
|
γ-glutamyl transpeptidase,
U/l | 93 | 48.8 (64.0) | 27 (8–417) | 0.245 | P<0.05 |
| Lactate
dehydrogenase, U/l | 101 | 262 (208) | 201 (75–1339) | 0.318 | P<0.01 |
|
Creatine kinase, U/l | 44 | 113 (110) | 90.5 (7–617) | −0.094 |
|
|
C-Reactive protein, mg/dl | 96 | 1.77 (5.88) | 0.09
(0.01–33.2) | 0.220 | P<0.05 |
|
Creatinine, mg/dl | 102 | 1.06 (1.24) | 0.78
(0.4–10.6) | 0.117 |
|
| Soluble
interleukin-2 receptor, U/ml | 30 | 3389 (7201) | 589.8
(218.1–26004) | 0.368 | P<0.05 |
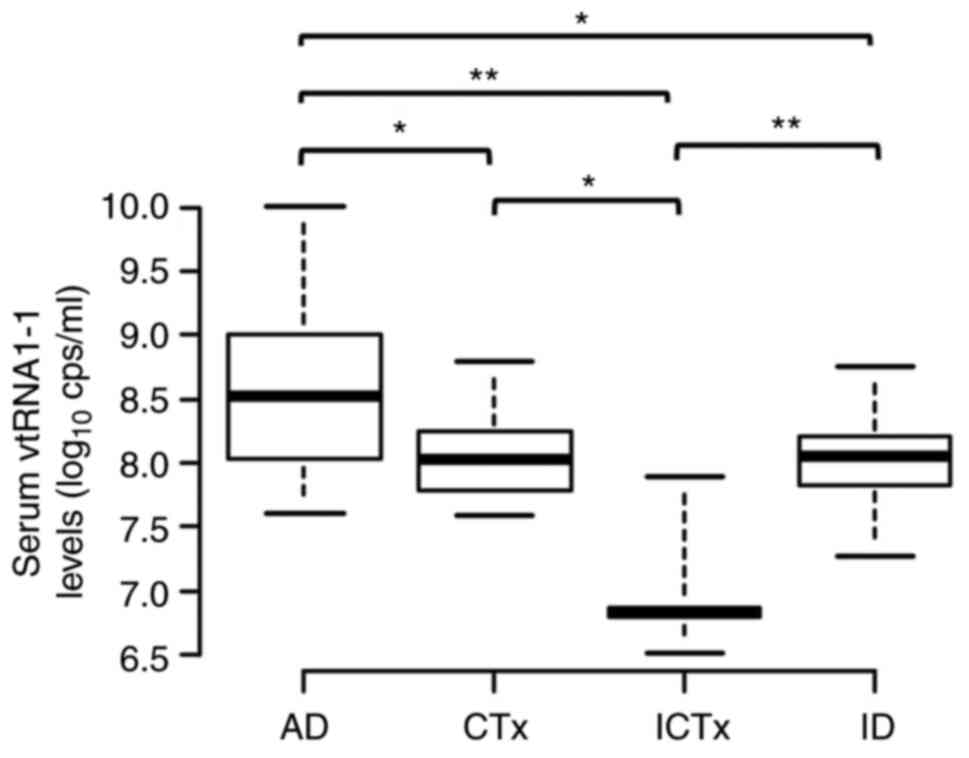
The serum levels of vtRNA1-1 were not significantly
different between myeloid and lymphoid malignancies. However, serum
levels of vtRNA1-1 varied significantly in different disease status
(median vtRNA1-1 levels of AD, CTx, ICTx, and ID groups were 8.53,
8.04, 6.83 and 8.05 log10 cps/ml, respectively; Table III; Fig. 5). The serum vtRNA1-1 levels
increased to a maximum of 10.01 log10 cps/ml in patients
with active blood malignancies, levels which were demonstrated in a
patient with advanced myeloid leukaemia. Furthermore, markedly
increased levels of vtRNA1-1, >9.0 log10 cps/ml, were
demonstrated in patients with primary myelofibrosis, chronic
lymphocytic leukaemia, hairy cell leukaemia, large granular
lymphocytic leukaemia and anaplastic large cell lymphoma. In
patients with lymphoid malignancy, levels of soluble interleukin-2
receptor, a biomarker of lymphoma (21), were significantly correlated with
serum vtRNA1-1 levels (RS 0.368, P<0.05, n=30;
Fig. 4F; Table IV). However, patients who received
intensive chemotherapy (particularly those with myeloid malignancy)
and required hospitalisation, had significantly lower serum levels
of vtRNA1-1 (n=29; ICTx vs. AD, P<0.01; ICTx vs. CTx, P<0.05;
ICTx vs. ID, P<0.01).
Discussion
The present study developed a method of quantifying
the serum levels of vtRNA1-1 using RT-qPCR with MS2 RNA as a spiked
control. Due to inconsistencies in RNA extraction from clinical
samples, correction with internal controls was preferable for
measuring serum RNA levels. However, the use of internal controls
for measuring the levels of non-coding RNAs remains controversial
(18). Instead of internal
controls, MS2 RNA was spiked in the lysis buffer and used to
correct vtRNA1-1 values, which demonstrated that the variance of
corrected vtRNA1-1 values was decreased compared with that of the
uncorrected, measured values. These results supported the use of
spiked RNA as a control.
Using the affinity purification method, with
Tim4-bound beads, exosomes were purified as demonstrated by the
presence of CD63, an exosome-specific marker. The relative amounts
of vtRNA1-1 appeared to have no association with the intensity of
any band. Serum vtRNA1-1 was not confined to exosomes, but appeared
to be distributed widely in the extracellular space. This finding
was consistent with a recent report that vtRNAs were enriched in
non-vesicular fractions of cell lines in culture medium (22). Because of their resistance to
detergent-mediated disruption, vtRNA1-1 may not be contained in
vesicles but may be present as ribonucleoproteins (22). In the present study, serum vtRNA1-1
in the Tim4 fractions were more resistant to the freeze-thaw
process than those in the other fractions. The lipid bilayer
membranes of exosomes may partly protect vtRNA1-1 from destruction
through freezing and thawing whereas vtRNA1-1 included in
ribonucleoproteins are more susceptible as they lack such
protection. In either case, vtRNA1-1 was protected from RNase in
the serum as it was stable for 3 weeks at 4°C.
To the best of our knowledge, the present was the
first study to measure serum vtRNA1-1 levels in patients with blood
diseases to evaluate the clinical significance of this vtRNA.
Ramayanti et al (18)
previously reported the measurement of relative levels of serum and
plasma vtRNA1-1 in patients with head and neck cancer and used them
as controls for normalising microRNA levels considering their small
variation. In the present study, certain patients received
different intensities of chemotherapy and others were not subjected
to any intervention. Among all these patients, increased vtRNA1-1
levels were demonstrated in patients with bulky leukaemia and
lymphoma. Myeloid and lymphoid malignancies correlated with
increased levels of vtRNA1-1. Lactate dehydrogenase levels have
frequently been used as a tumour marker of haematological
malignancy in clinical practice (23,24)
and were significantly correlated with vtRNA1-1 levels. Although
the increase in serum vtRNA1-1 levels may depend on specific
disease types, requiring further study of more cases, the present
study indicated that serum vtRNA1-1 levels could be used as a
biomarker to monitor tumour mass in response to treatment. Serum
vtRNA1-1 levels were significantly decreased only in the ICTx
group, which underwent intensive chemotherapy, which not only
reduces tumour mass but also extensively eliminates normal
haematological cells (25,26). Furthermore, significant correlation
was demonstrated between serum vtRNA1-1 levels and leukocyte
counts. Therefore, serum vtRNA1-1 appeared to originate largely
from haematological cells regardless of whether they were malignant
or normal. Moreover, the correlation of serum vtRNA1-1 with body
height, but not with body mass index, led to a hypothesis that the
serum vtRNA1-1 levels partially reflect the bone marrow capacity.
Therefore, correlation between bone marrow cellularity and serum
vtRNA1-1 levels should be further evaluated.
Metabolism of extracellular RNAs is largely unknown.
No correlation of renal function, represented by creatinine levels,
with serum vtRNA1-1 levels was demonstrated, which indicated that
renal excretion of vtRNA1-1 was negligible. Conversely, significant
correlation was demonstrated between serum vtRNA1-1 levels and
liver enzyme levels, and leakage of vtRNA1-1 from damaged liver
cells or decreased hepatic clearance of serum vtRNA1-1 may be the
mechanism underlying this correlation. However, patients with
severe liver dysfunction were not included in the cohort used in
this study. It was recently reported that vtRNA1-1 was not detected
in normal hepatic cells but its expression was increased in
metastatic tumour cells (15).
Therefore, infiltrating inflammatory cells were a possible origin
of increased serum vtRNA1-1 levels. The time course of the serum
vtRNA1-1 levels during severe liver damage due to different causes
would be informative and should be considered in future
studies.
The results of the present study suggested that
serum vtRNA1-1 level was a potential biomarker of haematological
activities. However, advanced solid tumours and inflammatory or
infectious diseases, which induce immune cell response, remain to
be evaluated. Because serum levels of vtRNA1-1 vary significantly,
depending upon haematological activities, which can be detected
using routine clinical examination, serum vtRNA1-1 may be used as
an internal control for measuring the levels of other non-coding
RNAs, such as microRNAs.
In conclusion, serum vtRNA1-1 remained stable at 4°C
and was not confined to exosomes. Serum vtRNA1-1 levels varied
significantly in patients with haematological malignancies, with
varying disease status, which suggested serum vtRNA1-1 as a
potential biomarker of haematological cells, either malignant or
normal. These findings supported the need for further investigation
of serum vtRNA1-1 as a potential biomarker of haematological
activities.
Supplementary Material
Supporting Data
Acknowledgements
The authors would like to thank Ms. Misaki Kato
(Division of Clinical laboratory Medicine, Department of
Multidisciplinary Internal Medicine, Tottori University Faculty of
Medicine, Yonago) for their technical assistance.
Funding
Funding: No funding was received.
Availability of data and materials
The datasets used and/or analysed during the current
study are available from the corresponding author on reasonable
request.
Authors' contributions
HK, YHas, HS and TM designed the study. HK, YHat and
TM performed the study. HK wrote the first draft of the manuscript.
HS and TM supervised the study and reviewed and edited the
manuscript. YHat and TM confirm the authenticity of all the raw
data. All authors read and approved the final manuscript.
Ethics approval and consent to
participate
This study was approved by the Ethics Committee at
Tottori University Faculty of Medicine (approval no. 18A115).
Informed consent was obtained through an opt-out approach. All
methods were performed in accordance with Declaration of
Helsinki.
Patient consent for publication
Not applicable.
Competing interests
The authors declare that they have no competing
interests.
Glossary
Abbreviations
Abbreviations:
|
AD
|
active disease
|
|
CTx
|
chemotherapy
|
|
ICTx
|
intensive chemotherapy
|
|
ID
|
indolent disease
|
|
RS
|
Spearman correlation coefficient
|
|
RT-qPCR
|
reverse transcription-quantitative
PCR
|
|
SD
|
standard deviation
|
References
|
1
|
Kedersha NL and Rome LH: Isolation and
characterization of a novel ribonucleoprotein particle: Large
structures contain a single species of small RNA. J Cell Biol.
103:699–709. 1986. View Article : Google Scholar : PubMed/NCBI
|
|
2
|
Stadler PF, Chen JJ, Hackermüller J,
Hoffmann S, Horn F, Khaitovich P, Kretzschmar AK, Mosig A, Prohaska
SJ, Qi X, et al: Evolution of vault RNAs. Mol Biol Evol.
26:1975–1991. 2009. View Article : Google Scholar : PubMed/NCBI
|
|
3
|
Kickhoefer VA, Searles RP, Kedersha NL,
Garber ME, Johnson DL and Rome LH: Vault ribonucleoprotein
particles from rat and bullfrog contain a related small RNA that is
transcribed by RNA polymerase III. J Biol Chem. 268:7868–7873.
1993. View Article : Google Scholar : PubMed/NCBI
|
|
4
|
Landgraf P, Rusu M, Sheridan R, Sewer A,
Iovino N, Aravin A, Pfeffer S, Rice A, Kamphorst AO, Landthaler M,
et al: A mammalian microRNA expression atlas based on small RNA
library sequencing. Cell. 129:1401–1414. 2007. View Article : Google Scholar : PubMed/NCBI
|
|
5
|
Lee K, Kunkeaw N, Jeon SH, Lee I, Johnson
BH, Kang GY, Bang JY, Park HS, Leelayuwat C and Lee YS: Precursor
miR-886, a novel noncoding RNA repressed in cancer, associates with
PKR and modulates its activity. RNA. 17:1076–1089. 2011. View Article : Google Scholar : PubMed/NCBI
|
|
6
|
Nandy C, Mrázek J, Stoiber H, Grässer FA,
Hüttenhofer A and Polacek N: Epstein-Barr virus-induced expression
of a novel human vault RNA. J Mol Biol. 388:776–784. 2009.
View Article : Google Scholar : PubMed/NCBI
|
|
7
|
Li F, Chen Y, Zhang Z, Ouyang J, Wang Y,
Yan R, Huang S, Gao GF, Guo G and Chen JL: Robust expression of
vault RNAs induced by influenza A virus plays a critical role in
suppression of PKR-mediated innate immunity. Nucleic Acids Res.
43:10321–10337. 2015.PubMed/NCBI
|
|
8
|
Amort M, Nachbauer B, Tuzlak S, Kieser A,
Schepers A, Villunger A and Polacek N: Expression of the vault RNA
protects cells from undergoing apoptosis. Nat Commun. 6:70302015.
View Article : Google Scholar : PubMed/NCBI
|
|
9
|
Gopinath SC, Wadhwa R and Kumar PK:
Expression of noncoding vault RNA in human malignant cells and its
importance in mitoxantrone resistance. Mol Cancer Res. 8:1536–1546.
2010. View Article : Google Scholar : PubMed/NCBI
|
|
10
|
Chen J, OuYang H, An X and Liu S: Vault
RNAs partially induces drug resistance of human tumor cells MCF-7
by binding to the RNA/DNA-binding protein PSF and inducing oncogene
GAGE6. PLoS One. 13:e01913252018. View Article : Google Scholar : PubMed/NCBI
|
|
11
|
Bracher L, Ferro I, Pulido-Quetglas C,
Ruepp MD, Johnson R and Polacek N: Human vtRNA1-1 levels modulate
signaling pathways and regulate apoptosis in human cancer cells.
Biomolecules. 10:6142020. View Article : Google Scholar : PubMed/NCBI
|
|
12
|
Ferro I, Gavini J, Gallo S, Bracher L,
Landolfo M, Candinas D, Stroka DM and Polacek N: The human vault
RNA enhances tumorigenesis and chemoresistance through the lysosome
in hepatocellular carcinoma. Autophagy. 18:191–203. 2022.
View Article : Google Scholar : PubMed/NCBI
|
|
13
|
Horos R, Buscher M, Kleinendorst R,
Alleaume AM, Tarafder AK, Schwarzl T, Dziuba D, Tischer C, Zielonka
EM, Adak A, et al: The small non-coding vault RNA1-1 acts as a
riboregulator of autophagy. Cell. 176:1054–1067. e122019.
View Article : Google Scholar : PubMed/NCBI
|
|
14
|
Buscher M, Horos R, Huppertz I, Haubrich
K, Dobrev N, Baudin F, Hennig J and Hentze MW: Vault RNA1-1
riboregulates the autophagic function of p62 by binding to lysine 7
and arginine 21, both of which are critical for p62
oligomerization. RNA. 28:742–755. 2022. View Article : Google Scholar : PubMed/NCBI
|
|
15
|
Gallo S, Kong E, Ferro I and Polacek N:
Small but powerful: The human vault RNAs as multifaceted modulators
of pro-survival characteristics and tumorigenesis. Cancers (Basel).
14:27872022. View Article : Google Scholar : PubMed/NCBI
|
|
16
|
Nolte-'t Hoen EN, Buermans HP, Waasdorp M,
Stoorvogel W, Wauben MH and 't Hoen PA: Deep sequencing of RNA from
immune cell-derived vesicles uncovers the selective incorporation
of small non-coding RNA biotypes with potential regulatory
functions. Nucleic Acids Res. 40:9272–9285. 2012. View Article : Google Scholar : PubMed/NCBI
|
|
17
|
Shurtleff MJ, Yao J, Qin Y, Nottingham RM,
Temoche-Diaz MM, Schekman R and Lambowitz AM: Broad role for YBX1
in defining the small noncoding RNA composition of exosomes. Proc
Natl Acad Sci USA. 114:E8987–E8995. 2017. View Article : Google Scholar : PubMed/NCBI
|
|
18
|
Ramayanti O, Verkuijlen SAWM, Novianti P,
Scheepbouwer C, Misovic B, Koppers-Lalic D, van Weering J, Beckers
L, Adham M, Martorelli D, et al: Vesicle-bound EBV-BART13-3p miRNA
in circulation distinguishes nasopharyngeal from other head and
neck cancer and asymptomatic EBV-infections. Int J Cancer.
144:2555–2566. 2019. View Article : Google Scholar : PubMed/NCBI
|
|
19
|
Nakai W, Yoshida T, Diez D, Miyatake Y,
Nishibu T, Imawaka N, Naruse K, Sadamura Y and Hanayama R: A novel
affinity-based method for the isolation of highly purified
extracellular vesicles. Sci Rep. 6:339352016. View Article : Google Scholar : PubMed/NCBI
|
|
20
|
Kanda Y: Investigation of the freely
available easy-to-use software ‘EZR’ for medical statistics. Bone
Marrow Transplant. 48:452–458. 2013. View Article : Google Scholar : PubMed/NCBI
|
|
21
|
Motokura T, Kobayashi Y, Fujita A,
Nakamura Y, Taniguchi T, Uchimaru K and Asano S: Clinical
significance of serial measurement of the serum levels of soluble
interleukin-2 receptor and soluble CD8 in malignant lymphoma. Leuk
Lymphoma. 16:355–362. 1995. View Article : Google Scholar : PubMed/NCBI
|
|
22
|
Jeppesen DK, Fenix AM, Franklin JL,
Higginbotham JN, Zhang Q, Zimmerman LJ, Liebler DC, Ping J, Liu Q,
Evans R, et al: Reassessment of exosome composition. Cell.
177:428–445. e182019. View Article : Google Scholar : PubMed/NCBI
|
|
23
|
Schneider RJ, Seibert K, Passe S, Little
C, Gee T, Lee BJ III, Miké V and Young CW: Prognostic significance
of serum lactate dehydrogenase in malignant lymphoma. Cancer.
46:149–143. 1980. View Article : Google Scholar
|
|
24
|
Geva M, Pryce A, Shouval R, Fein JA,
Danylesko I, Shem-Tov N, Yerushalmi R, Shimoni A, Szydlo R, Pavlu J
and Nagler A: High lactate dehydrogenase at time of admission for
allogeneic hematopoietic transplantation associates to poor
survival in acute myeloid leukemia and non-Hodgkin lymphoma. Bone
Marrow Transplamt. 56:2690–2696. 2021. View Article : Google Scholar : PubMed/NCBI
|
|
25
|
Tilly H, Castaigne S, Bordessoule D,
Casassus P, Le Prisé PY, Tertian G, Desablens B, Henry-Amar M and
Degos L: Low-dose cytarabine versus intensive chemotherapy in the
treatment of acute nonlymphocytic leukemia in the elderly. J Clin
Oncol. 8:272–279. 1990. View Article : Google Scholar : PubMed/NCBI
|
|
26
|
Carella AM, Podesta M, Frassoni F, Raffo
MR, Pollicardo N, Pungolino E, Vimercati R, Sessarego M, Parodi C,
Rabitti C, et al: Collection of ‘normal’ blood repopulating cells
during early hemopoietic recovery after intensive conventional
chemotherapy in chronic myelogenous leukemia. Bone Marrow
Transplant. 12:267–271. 1993.PubMed/NCBI
|
|
27
|
Du Bois D and Du Bois EF: A formula to
estimate the approximate surface area if height and weight be
known. Arch Intern Med. 17:863–871. 1916. View Article : Google Scholar
|