Introduction
Salusin-β is a 20-amino acid bioactive peptide
encoded by the human torsion dystonia gene torsin family 2 member A
(TOR2A). The TOR2A gene undergoes selective splicing and
translation within the cell, which results in the formation of a
242-amino acid residue, preprosalusin (1,2).
Cleavage of the N-terminal portion of preprosalusin produces
prosalusin, which then undergoes further cleavage of the signal
peptide to produce the active salusin-β peptide molecule (1). Salusin-β is expressed in the
neuroendocrine system, monocytes and macrophages (2). It has previously been reported that
salusin-β serves a regulatory role in various physiological
processes, including blood pressure regulation, heart rate
modulation, intracellular signaling, promotion of mitosis and
proinflammatory factor expression (3–5).
Notably, salusin-β has been implicated in the pathogenesis of
atherosclerosis, a cardiovascular disease characterized by arterial
plaque formation (6). Aydin and
Aydin (7) employed Pearson
correlation analysis and reported that, in a rat model of lipid
metabolism syndrome, serum concentrations of salusin-β and
high-density lipoprotein (HDL) cholesterol were found to be
decreased compared with those in the control group, while glucose
and triglyceride (TG) levels were increased. These findings
suggested a potential association between salusin-β and lipid
metabolism in the context of lipid metabolism syndrome.
Additionally, Chen and Jin (8)
reported that a reduction in salusin-β inhibits cellular lipid
accumulation and reduces cholesterol levels. However, the precise
mechanism by which salusin-β can regulate lipid metabolism remains
to be fully elucidated.
Adiponectin receptor 1 (adipoR1) is a pivotal
component of adipokine signaling and is responsible for mediating
the physiological effects of adiponectin. AdipoR1 has seven
transmembrane domains (9).
However, different from other types of G protein-coupled receptors
(GPCRs), the N-terminus can bind intracellular adaptive proteins,
whereas the C-terminus binds to extracellular adiponectin (9). AdipoR1 activation by binding to
adiponectin triggers various downstream signaling pathways that can
regulate lipid metabolism. In particular, adipoR1 is predominantly
expressed in skeletal muscle and can activate adenosine
monophosphate-activated protein kinase (AMPK), which phosphorylates
acetyl-CoA carboxylase (ACC). ACC serves an important role in the
regulation of carnitine palmitoyl transferase 1A (CPT-1A), an
enzyme involved in mitochondrial fatty acid β-oxidation (9,10).
Impaired fatty acid β-oxidation contributes to dyslipidemia
(10). Therefore, adipoR1 is an
important protein involved in the regulation of lipid
metabolism.
Based on the aforementioned biological functions of
salusin-β and adipoR1 and their opposing biological effects on
lipid metabolism, in addition to our pilot study showing an
association between the expression levels of salusin-β and adipoR1,
a hypothesis that salusin-β can regulate fatty acid oxidation via
adipoR1 in HepG2 cells was proposed. The present study aimed to
explore the potential association and molecular mechanisms of
salusin-β and adipoR1 in lipid metabolism by manipulating salusin-β
expression using lentiviral vectors in vitro, to provide
valuable insights into the pathogenesis of dyslipidaemia and to
identify potential therapeutic targets.
Materials and methods
Materials and reagents
Premix Taq™ DNA Polymerase (cat. no. RR003A), T4 DNA
Ligase (cat. no. 2011A), XhoI (cat. no. 1094A) and
BamHI (cat. no. 1010A) were purchased from Takara Bio, Inc.
AgeI (cat. no. R3552) and EcoRI (cat. no. R3101) were
purchased from New England BioLabs, Inc. Anti-salusin-β antibodies
(cat. no. PAC026Hu08) were purchased from Wuhan USCN Business Co.,
Ltd. Anti-adipoR1 (cat. no. ab70362), anti-CPT-1A (cat. no.
ab234111) and anti-GAPDH (cat. no. ab185059) antibodies were
purchased from Abcam. Anti-AMPK (cat. no. 5831),
anti-phosphorylated (p-)AMPK (cat. no. 2535), anti-ACC (cat. no.
3676) and anti-p-ACC (cat. no. 11818) antibodies were purchased
from Cell Signaling Technology, Inc. HRP-labelled goat anti-rabbit
IgG antibodies (cat. no. E-AB-1102) and the BCA Protein
Colorimetric Assay Kit (cat. no. E-BC-K318-M) were purchased from
Elabscience Biotechnology, Inc. Stock solutions of 10 mM oleic acid
(OA; Shanghai Macklin Biochemical Co., Ltd.) and 20 mM palmitic
acid (PA; Shanghai Macklin Biochemical Co., Ltd.) prepared in 10%
fatty acid-free BSA (Sigma-Aldrich; Merck KGaA) were diluted in the
high-glucose DMEM (Procell Life Science & Technology Co., Ltd.)
medium to obtain the desired final concentration of free fatty
acids (FFAs) mixture (OA/PA molar ratio, 2:1). Oil Red O stock
solution (0.5%; Beijing Solarbio Science & Technology Co.,
Ltd.) was prepared with isopropanol alcohol. The TG assay kit (cat.
no. A110-1-1) was purchased from Nanjing Jiancheng Bioengineering
Institute.
Construction of recombinant
plasmids
Based on the human TOR2A gene sequence from the
National Center for Biotechnology Information (NCBI) gene library
(NM_001134430.3) (https://www.ncbi.nlm.nih.gov/nuccore/NM_001134430.3),
the nucleotide sequence of salusin-β encoded by bases 598–657 was
determined. Primers containing restriction enzyme sites and
protective bases were designed to target salusin-β and the
specificity of the sequence was confirmed through Basic Local
Alignment Search Tool (BLAST) analysis in the NCBI database
(https://www.ncbi.nlm.nih.gov/tools/primer-blast/index.cgi?LINK_LOC=BlastHome).
The primers used were as follows: Salusin-β forward,
5′-CGCGGATCCGCCATCTTCATCTTCATCAG-3′
(the BamHI enzyme restriction site is underlined) and
reverse, 5′-CCGCTCGAGAGGAGGCGCTCTTCC-3′ (the
XhoI enzyme restriction site is underlined). Considering the
potential off-target effects and poor interference efficiency of
short hairpin RNA (shRNA/sh), three pairs of shRNA sequences
targeting salusin-β were designed using the BLOCK-iT™ RNAi Designer
(Thermo Fisher Scientific, Inc.), and referred to as
sh-Salusin-β1, sh-Salusin-β2 and
sh-Salusin-β3 (Table
I). The sequence structure of the shRNA sense strand was as
follows: 5′-′CCGG′ (hanging end for AgeI restriction
enzyme), salusin-β target sequence (21 bp), ‘CTCGAG’ (loop),
reverse complement of the target sequence and ‘TTTTTG’
(transcription termination sequence for RNA polymerase III)-3′. The
antisense strand sequence of the shRNA was complementary to the
sense strand, while the 5′-′AATT′ sequence served as the hanging
end for the EcoRI restriction enzyme. Single-stranded
salusin-β nucleotides, primers and shRNA were then synthesized.
Lentivirus vectors pHAGE (cat. no. 118692; Addgene, Inc.) and
pLKO.1 (cat. no. 8453; Addgene, Inc.), envelope plasmids psPAX2
(cat. no. 12260; Addgene, Inc.) and pMD2G (cat. no. 12259; Addgene,
Inc.), the pLKO.1-sh-Mock plasmid (containing a non-mammalian
targeting shRNA sequence
5′-CCGGCAACAAGATGAAGAGCACCAACTCGAGTTGGTGCTCTTCATCTTGTTGTTTTTG-3′;
cat. no. SHC002; Sigma-Aldrich; Merck KGaA) and Top10 competent
cells (cat. no. B528412; Sangon Biotech Co., Ltd.) were donated by
the Basic Medicine Laboratory at Wuhan Huazhong University of
Science and Technology (Wuhan, China). The single-stranded
nucleotides of salusin-β synthesized by Sangon Biotech Co., Ltd.
were added to a PCR reaction system containing Premix Taq™ DNA
Polymerase (Takara Bio, Inc.) and amplified with the primers
containing restriction sites (Table
II); the thermocycling conditions, agarose gel and
visualization methods are described in the subsequent s-qPCR
section. The PCR products were then purified according to the
manufacturer's instructions of the TaKaRa MiniBEST Agarose Gel DNA
Extraction Kit Ver.4.0 (cat. no. 9762; Takara Bio, Inc.), and
incubated with BamHI at 30°C for 3 h, followed by digestion
with XhoI at 37°C for 3 h. The resulting salusin-β DNA
fragments were ligated into the pHAGE vector at a molar ratio
between 3:1 and 10:1 using T4 DNA ligase (11,12).
The double-stranded shRNA nucleotides were obtained through the
annealing of sense and antisense strands before being ligated into
the pLKO.1 vector using AgeI and EcoRI restriction
sites at 37°C for 15 min. After 12 h ligation at 16°C, the products
were added to 100 µl Top10 competent cells, mixed gently, and
placed on ice for 30 min, followed by a 90 sec incubation at 42°C
in a water bath and rapidly returned to ice for 2 min.
Subsequently, 800 µl LB liquid medium (Biosharp Life Sciences) was
added, and the mixture was shaken at 25 × g at 37°C for 1 h. Then,
200 µl bacterial culture was evenly spread on LB agar plates
containing ampicillin (100 µg/ml) and incubated for 16 h at 37°C in
the inverted position. Monoclonal bacterial colonies were then
randomly selected as PCR templates, with the forward and reverse
primer sequences listed in Table
II, and amplified using Premix Taq™ DNA Polymerase (Takara Bio,
Inc; the thermocycling conditions, agarose gel and visualization
methods are described in the subsequent s-qPCR section). The
recombinant plasmids were confirmed through Sanger sequencing,
followed by large-scale plasmid extraction using the SanPrep Column
Plasmid Mini-Preps Kit (cat. no. B518191; Sangon Biotech Co.,
Ltd.), for subsequent experiments.
 | Table I.Salusin-β-specific shRNA
sequences. |
Table I.
Salusin-β-specific shRNA
sequences.
| shRNA | Sequence
(5′-3′) |
|---|
|
sh-Salusin-β1 | Sense:
CCGGGCCATCTTCATCTTCATCAGACTCGAGTCTGATGAAGATGAAGATGGCTTTTTG |
|
| Antisense:
AATTCAAAAAGCCATCTTCATCTTCATCAGACTCGAGTCTGATGAAGATGAAGATGGC |
|
sh-Salusin-β2 | Sense:
CCGGGGCTTCTCAAACTCGGGCATCCTCGAGGATGCCCGAGTTTGAGAAGCCTTTTTG |
|
| Antisense:
AATTCAAAAAGGCTTCTCAAACTCGGGCATCCTCGAGGATGCCCGAGTTTGAGAAGCC |
|
sh-Salusin-β3 | Sense:
CCGGGCTTCTCAAACTCGGGCATCACTCGAGTGATGCCCGAGTTTGAGAAGCTTTTTG |
|
| Antisense:
AATTCAAAAAGCTTCTCAAACTCGGGCATCACTCGAGTGATGCCCGAGTTTGAGAAGC |
| Table II.Primers used for PCR analysis. |
Table II.
Primers used for PCR analysis.
| Gene target | Sequence
(5′-3′) |
|---|
| WPRE | F:
CGCTATGTGGATACGCTGCTTTA |
|
| R:
GCAACCAGGATTTATACAAGGAGGA |
|
sh-Salusin-β1 | F:
CGAGACTAGCCTCGAGCGGCC |
|
| R:
AAGATGAAGATGGCCCGGTGTTTCGT |
|
sh-Salusin-β2 | F:
CGAGACTAGCCTCGAGCGGCC |
|
| R:
CTCGAGGATGCCCGAGTTTGAGAAGC |
|
sh-Salusin-β3 | F:
CGAGACTAGCCTCGAGCGGCC |
|
| R:
CGAGTGATGCCCGAGTTTGAGAAGCC |
| Salusin-β | F:
CGCGGATCCGCCATCTTCATCTTCATCAG |
|
| R:
CCGCTCGAGAGGAGGCGCTCTTCC |
| AdipoR1 | F:
ACGGTGGAACTGGCTGAAC |
|
| R:
CCATGTAGCAGATAGTCGTTGTC |
| GAPDH | F:
GTCTCCTCTGACTTCAACAGCG |
|
| R:
ACCACCCTGTTGCTGTAGCCAA |
Cell culture and lentivirus
packaging
293T cells (cat. no. CRL-3216TM; American Type
Culture Collection) were obtained from Wuhan Huazhong University of
Science and Technology (Wuhan, China). The HepG2 liver cancer cell
line (cat. no. ECL-0103) was purchased from Enova (Wuhan)
Biotechnology Co., Ltd. and authenticated by short tandem repeat
analysis. Cells were cultured in complete medium composed of
high-glucose DMEM (Procell Life Science & Technology Co., Ltd.)
supplemented with 10% FBS (Invitrogen; Thermo Fisher Scientific,
Inc.) and 1% penicillin/streptomycin at 37°C in a humidified
atmosphere of 5% CO2. Cells at passages 10–15 were used
for experiments and the medium was refreshed every 48–72 h.
For lentivirus packaging using a second-generation
transduction system, when the cell confluence reached 50–60%, 293T
cells were transfected with 4 µg constructed recombinant plasmid
(pHAGE-Salusin-β or pLKO.1-sh-Salusin-β) or the corresponding blank
vector plasmid (pHAGE or pLKO.1-sh-Mock), along with 3 µg psPAX2
and 1 µg pMD2.G packaging plasmids (mass ratio of the three
plasmids, 4:3:1). Transfection was performed at 37°C using the
Simple-fect reagent (Signaling Dawn Biotech) following the
manufacturer's instructions. After 24 h, the medium was replaced
with fresh medium. Cell supernatants were collected at 48 and 72 h
and centrifuged at 800 × g for 10 min at 4°C, then filtered through
a 0.45-µm filter to obtain the viral suspension. The viral
suspension was sorted into 1.5-ml Eppendorf tubes (Eppendorf SE; 1
ml/tube), and stored at −80°C. To verify the presence of the target
gene, primers were designed for the woodchuck hepatitis virus
post-transcriptional regulatory element (WPRE) gene on the pHAGE
vector (Table II). This gene is
not found in humans and the specificity of the primers was
confirmed by conducting a BLAST analysis in the NCBI RNA virus gene
database (https://www.ncbi.nlm.nih.gov/tools/primer-blast/primertool.cgi?ctg_time=1699883569&job_key=KSP3XoH-jFarbBxpEQk4W2sSKWlGATJ0Rw&CheckStatus=Check).
Additionally, a forward primer was designed for the U6 promoter in
the pLKO.1-sh-Salusin-β recombinant interference vector and
different reverse primers were designed for the three different
shRNA sequences targeting salusin-β. RNA was extracted from the
viral suspension and PCR was performed to amplify the specific
fragments of WPRE and sh-Salusin-β. The successful viral synthesis
was initially detected by 1.5% agarose gel electrophoresis and
subsequently verified by Sanger sequencing. The sequencing results
and BLAST analysis of WPRE PCR products are shown in Fig. S1. The specific PCR products of
sh-Salusin-β1-3 were sequenced and then aligned with the
sequence of recombinant plasmid pLKO.1-sh-Salusin-β1-3
using SnapGene v6.0.2 software (GSL Biotech LLC; Fig. S2, Fig. S3, Fig. S4).
Preparation of transmission electron
microscopy (TEM) specimens
After collecting the supernatant of lentivirus
packaging, 3 ml pre-cooled 2.5% glutaraldehyde (Shanghai Macklin
Biochemical Co., Ltd.) was added to 293T cells (confluence, ~100%)
in a 10-cm dish. Cells were fixed for 1 h at room temperature, then
scraped off from the dish and centrifuged at 600 × g for 5 min at
4°C to obtain cell pellets. Cells were resuspended in ~1 ml of
supernatant, then transferred to a 1.5-ml Eppendorf tube. Cells
were allowed to settle vertically for 1 h at room temperature
before the supernatant was discarded and 1 ml pre-cooled 2.5%
glutaraldehyde was added. Samples were fixed overnight for 16 h at
4°C. Subsequently, the samples were transported to the Electron
Microscopy Room at Wuhan University People's Hospital (Wuhan,
China) for further processing. Samples were washed thrice with PBS
for 10 min, then fixed using 1% osmium tetroxide at 4°C for 1 h.
After three additional rinses with PBS, the samples were dehydrated
using an ascending ethanol series (50, 70, 90, 95, 100, 100 and
100%). Following infiltration and embedding in epoxy resin at 60°C
for 24 h, the samples were sliced into 50-nm sections using a
microtome. The resulting sections were then stained with uranyl
acetate for 30 min and lead citrate for 15 min at room temperature.
Finally, the lentivirus morphology was observed using the JEM-1230
transmission electron microscope (JEOL, Ltd.).
Measurement of lentiviral titer and
MOI
293T cells (1×10⁵ cells/well) were seeded
into 6-well plates and supplemented with 0, 5, 10, 15, 20 or 30 µl
modified virus and complete medium containing 8 µg/ml polybrene
(Biosharp Life Sciences) to a volume of 2 ml. After 24 h of
incubation at 37°C, the medium was replaced with fresh complete
medium. On day 3, cells were digested with 0.25% trypsin at 37°C
for 5 min and the resulting cell suspension from each well was
divided into two equal parts and seeded into 6-well plates. On day
4, the medium was replaced with either complete medium containing 2
µg/ml puromycin or fresh complete medium as a control. Cell
viability was observed using a light inverted microscope to see if
the cells were floating. Floating cells indicate that the cells are
dead. When cells in the control puromycin-treated group died,
trypan blue (cat. no. C0040; Beijing Solarbio Science &
Technology Co., Ltd.) was used to stain the 293T cells at 37°C for
3 min and live cell counting were performed on the treated cells
through a light microscope (Olympus Corporation). The ‘number of
live cells’ was calculated for the puromycin-treated cells, whereas
the ‘number of control cells’ was calculated for control cells. The
titer of each viral dose group was then calculated according to the
following formula: Titer (TU/ml)=(number of live cells × number of
initial cells)/(number of control cells × virus volume) and the
mean of the six viral dose groups was taken to obtain the final
viral titer.
Based on the reference range of the MOI for
lentivirus-infected 293T cells being 1–3 (13), MOIs of 0, 1, 2, 3, 4 and 5 were
used to screen the optimal MOI values for subsequent experiments.
293T cells were seeded (8×10⁵ cells/well) into 6-well
plates and when the cell density reached 80% on day 2
(~2×10⁶ cells) at 37°C for 24 h, an appropriate volume
of virus was added for infection [volume of virus added/well
(µl)=(MOI × number of cells/titer) ×1,000]. After incubation at
37°C for 24 h, fresh medium containing 2 µg/ml puromycin was added
to the cells for selection. Following further incubation at 37°C
for 3–5 days, when floating clumps of dead cells appeared, the
corresponding minimum MOI value was considered to be the optimal
MOI for 293T cells.
Transient cell transfection and
FFA-induced steatosis of HepG2 cells
HepG2 or 293T cells were seeded (1×10⁵
cells/well) in 6-well plates 1 day prior to transfection. When the
cell density reached 60–70%, a mixture containing 1 ml modified
virus (pHAGE, pHAGE-Salusin-β, pLKO.1-sh-Mock or
pLKO.1-sh-Salusin-β) suspension, 840 µl medium and 160 µl polybrene
(final concentration, 8 µg/ml) was added to the cells. The control
group was treated without the virus suspension. After incubation at
37°C for 24 h, RNA and proteins were immediately isolated from the
cells for gene expression analysis using semi-quantitative PCR
(s-qPCR) and protein expression analysis using western blotting
(WB).
To investigate the mechanism of the regulatory
effect of salusin-β on the AMPK/ACC/CPT-1A signaling pathway via
adipoR1, HepG2 cells were first infected with modified lentivirus
(pHAGE, pHAGE-Salusin-β, pLKO.1-sh-Mock or pLKO.1-sh-Salusin-β) at
37°C for 24 h. Subsequently, the cells were treated with either an
adipoR1 agonist (10 µM AdipoRon; Selleck Chemicals) or an adipoR1
inhibitor (1 µM thapsigargin; Sigma-Aldrich; Merck KGaA) at 37°C
for 24 h, before the protein expression levels of downstream
molecules were evaluated.
To assess the impact of salusin-β on lipid
metabolism, transiently-transfected HepG2 cells were incubated with
200 µM FFAs to induce lipid accumulation at 37°C for 24 h. The
control group was treated at 37°C for 24 h with the same volume of
10% BSA solution as the FFA-treated groups.
S-qPCR
Total RNA was extracted from the cells using RNAiso
Plus reagent (Takara Bio, Inc.) and quantified using a Nano400
analyzer (Hangzhou Allsheng Instruments Co., Ltd.). RNA was diluted
to a concentration of 500 ng/µl and reverse transcribed into cDNA
using Reverse Transcriptase XL (AMV) (Takara Bio, Inc.) according
to the manufacturer's protocol. A preliminary gradient cycle number
PCR experiment determined that 30 cycles were optimal for the
exponential amplification of the salusin-β and adipoR1 genes.
According to the manufacturer's instructions, Premix Taq™ DNA
Polymerase was used to separately amplify the target gene and
internal reference gene (GAPDH) in different tubes from the same
batch. The following thermocycling conditions were used for PCR:
Initial denaturation at 95°C for 3 min; 30 cycles of 94°C for 30
sec, 64°C for salusin-β/60°C for adipoR1 and GAPDH for 30 sec and
72°C for 30 sec; and a final extension at 72°C for 5 min. After
amplification, the PCR products were electrophoresed on a 2%
agarose gel containing the nucleic acid stain SuperRed/GelRed (cat.
no. BS354B; Biosharp Life Sciences) in Tris-acetate-EDTA buffer
with a constant voltage of 120 V. Subsequently, the gel was
visualized using the Tanon-1600 Gel Imaging System (Tanon Science
and Technology Co., Ltd.). The cumulative optical density values
were measured using the ImageJ software (version 1.52a; National
Institutes of Health), before the expression of the target gene was
normalized to that of GAPDH as the internal reference gene for
relative quantification. The primer sequences used for PCR
amplification are provided in Table
II. All PCR amplification products in the present study were
verified by sequencing and BLAST analysis (Fig. S5, Fig. S6, Fig. S7).
WB
WB was performed to assess the protein levels of
salusin-β, adipoR1, CPT-1A, p-AMPK and p-ACC in 293T and HepG2
cells. Total protein was extracted from cells using RIPA lysis
buffer (Dalian Meilun Biology Technology Co., Ltd.) supplemented
with 1X PMSF protease inhibitor and 1X phosphatase inhibitor.
Protein concentrations were determined using a BCA protein
quantification kit. Samples were mixed with 5X SDS loading buffer
and heated at 95°C for 10 min. Each lane was loaded with 20 µg
protein and proteins were separated by 10% SDS-PAGE. Proteins were
transferred onto a PVDF membrane. The membrane was blocked with 5%
skimmed milk powder at room temperature for 1 h, washed with
Tris-buffered saline-0.1% Tween-20 (TBST) and incubated overnight
for 14 h at 4°C with primary anti-salusin-β (1:500), anti-adipoR1
(1:1,000), anti-AMPK (1:1,000), anti-p-AMPK (1:1,000), anti-ACC
(1:1,000), anti-p-ACC (1:1,000), anti-CPT-1A (1:1,000) and
anti-GAPDH (1:5,000) antibodies. After washing with TBST, the
membrane was incubated with an HRP-conjugated secondary antibodies
(1:2,000) at room temperature for 1 h, followed by additional
washing. Meilunbio® FGSuper Sensitive ECL Luminescence
Reagent (Dalian Meilun Biology Technology Co., Ltd.) was used for
protein band visualization. GAPDH was used as the internal
reference. Measurements of the protein band grayscale values were
performed using ImageJ software (version 1.52a; National Institutes
of Health). The relative protein expression levels were calculated
as the ratio of the gray value of the target band to the gray value
of the internal reference protein band. The phosphorylation levels
of AMPK and ACC were determined by calculating the ratio of p-AMPK
(Thr172)/AMPK and p-ACC (Ser79)/ACC, respectively.
Oil Red O staining
Oil Red O staining was performed to assess
intracellular lipid droplet levels. HepG2 cells (1×10⁵
cells/well) were seeded in 6-well plates at 37°C for 24 h, washed
with PBS, fixed with 4% paraformaldehyde at room temperature for 15
min and then washed twice with PBS. Cells were incubated with 60%
isopropanol alcohol for 1 min, followed by staining with fresh Oil
Red O working solution (oil red O dye storage
solution/ddH2O ratio, 3:2) for 20 min at room
temperature. After staining, the cells were washed with 60%
isopropanol alcohol for 30 sec, treated with 10% hematoxylin at
room temperature for 2 min and then washed with PBS to remove
excess dye. The stained HepG2 cells were imaged using a light
Olympus microscope (Olympus Corporation). ImageJ software was
utilized to analyze the staining area in the images and quantify
the intracellular lipid content.
TG assay
HepG2 cells (1×10⁵ cells/well) were
seeded in 6-well plates and incubated at 37°C for 24 h. After
infection with lentivirus at 37°C for 24 h, the cells were further
incubated with 200 µM FFAs at 37°C for 24 h. Subsequently, the
cells were treated with RIPA lysis buffer at 4°C for 30 min,
followed by centrifugation at 10,000 × g for 10 min at 4°C to
collect the lysate. Cellular intracellular TG levels were then
determined using a commercial kit according to the manufacturer's
instructions. Protein quantification was performed using the BCA
method. Intracellular lipid deposition was assessed by calculating
the TG/protein content.
Statistical analysis
All data were analyzed using GraphPad Prism software
(version 8.0; Dotmatics). Each experiment was performed with three
replicates, and the mean value was used for subsequent analysis.
One-way ANOVA followed by Tukey's test was used to analyze
statistically significant differences among multiple groups. All
measurement data are presented as the mean ± standard error of the
mean. P<0.05 was considered to indicate a statistically
significant difference.
Results
Construction and identification of the
recombinant pHAGE-Salusin-β and pLKO.1-sh-Salusin-β plasmids
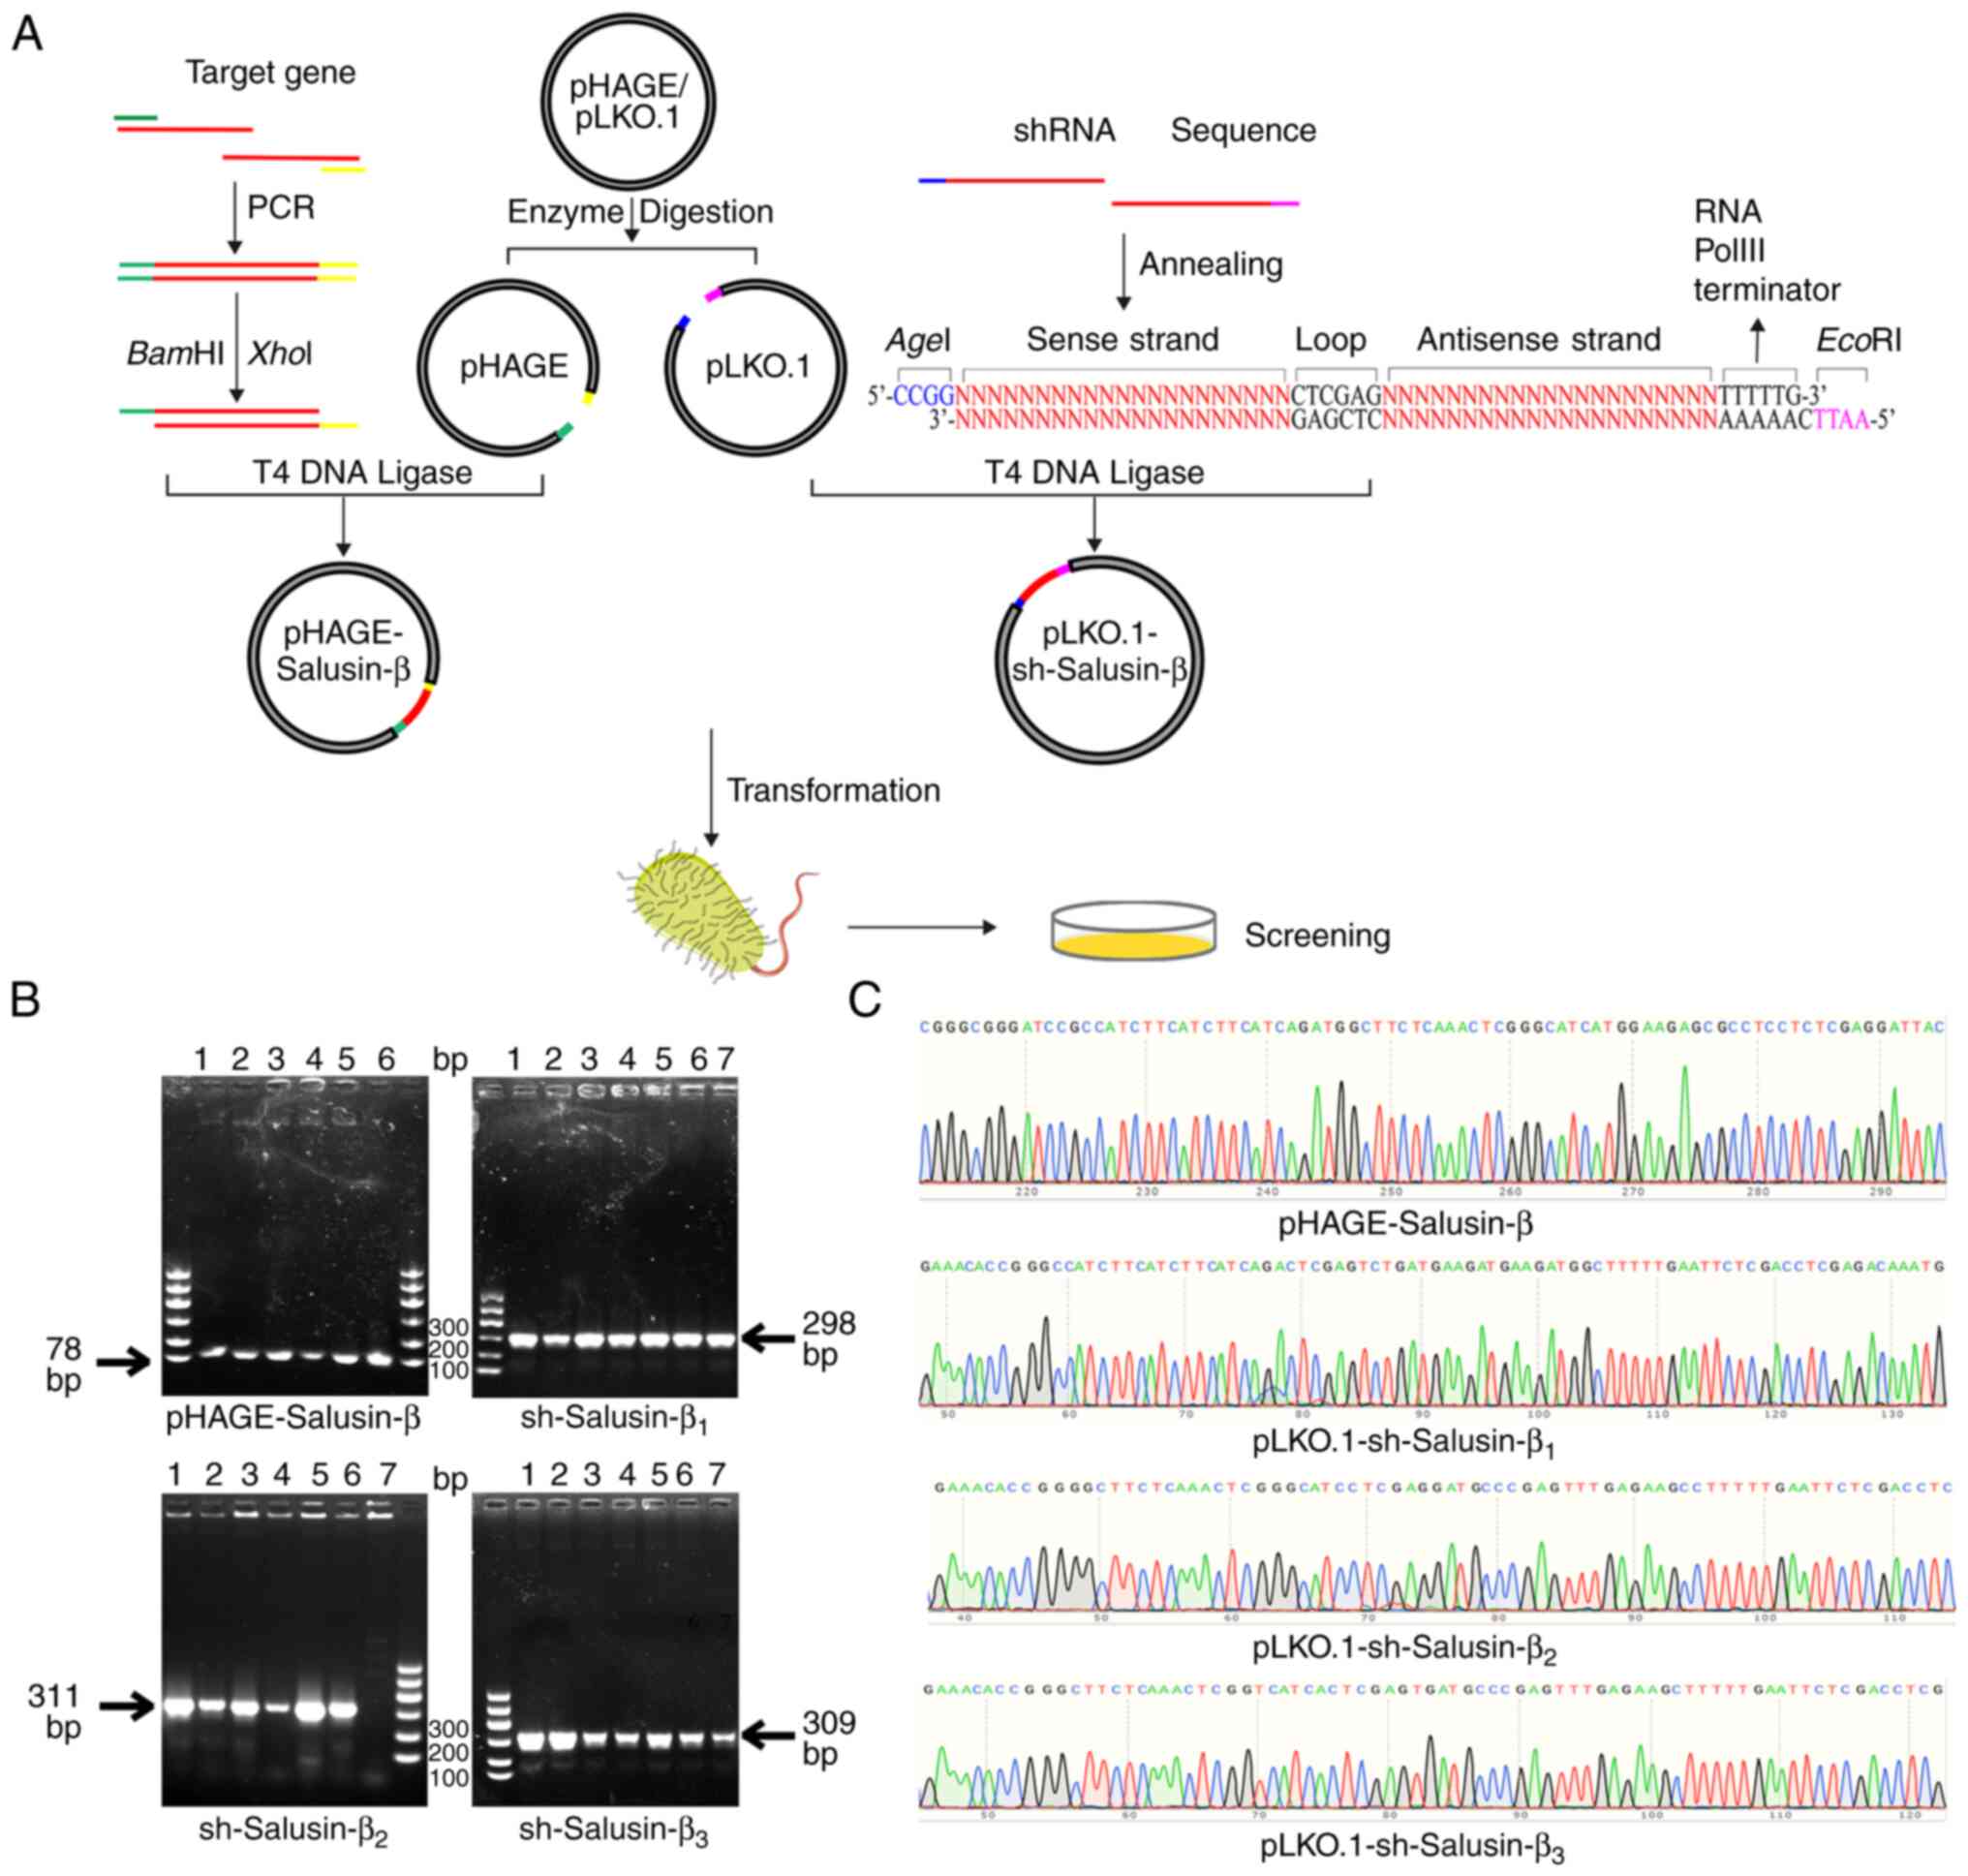
A recombinant pHAGE-Salusin-β plasmid and three
recombinant pLKO.1-sh-Salusin-β plasmids were successfully
constructed (Fig. 1A). Monoclonal
colony PCR results were analyzed using agarose gel electrophoresis
(Fig. 1B). The PCR product from
the pHAGE-Salusin-β monoclonal clone (78 bp) appeared as a band at
~100 bp. By contrast, the amplified products of
sh-Salusin-β1, sh-Salusin-β2 and
sh-Salusin-β3 (298, 311 and 309 bp, respectively)
corresponded to bands at ~300 bp, consistent with the expected
sizes of the amplified sequences. Sequencing analysis confirmed an
identical match with the original sequences (Fig. 1C), which indicated the successful
construction of the recombinant pHAGE-Salusin-β overexpression
plasmid and the three recombinant pLKO.1-sh-Salusin-β interference
plasmids.
Construction and validation of
lentiviral vectors for salusin-β interference in 293T cells
293T cells were separately transfected with
recombinant pHAGE-Salusin-β and pLKO.1-sh-Salusin-β plasmids, along
with psPAX2 and pMD2.G packaging plasmids, and the viral suspension
was collected from the cell supernatant at 48 and 72 h (Fig. 2A). On day 4, microscopic analysis
of the transfected cells demonstrated distinct cellular changes,
including small lesions, floating granules and cell fusion
(Fig. 2B). TEM confirmed the
presence of spherical virus particles in the cytoplasm of the
transfected cells, which suggested successful packaging and
synthesis of lentiviral particles (Fig. 2C). Subsequently, the harvested
viruses were subjected to PCR analysis, and the results confirmed
the presence of a specific fragment of 98 bp corresponding to WPRE
in the pHAGE and pHAGE-Salusin-β construct, as well as the specific
PCR products for sh-Salusin-β1 (298 bp), sh-Salusin-β2 (311 bp) and
sh-Salusin-β3 (309 bp) in the pLKO.1-sh-Salusin-β1-3
constructs (Fig. 2D). These
findings confirmed the successful introduction of lentiviral
vectors into 293T cells and the production of functional lentiviral
particles.
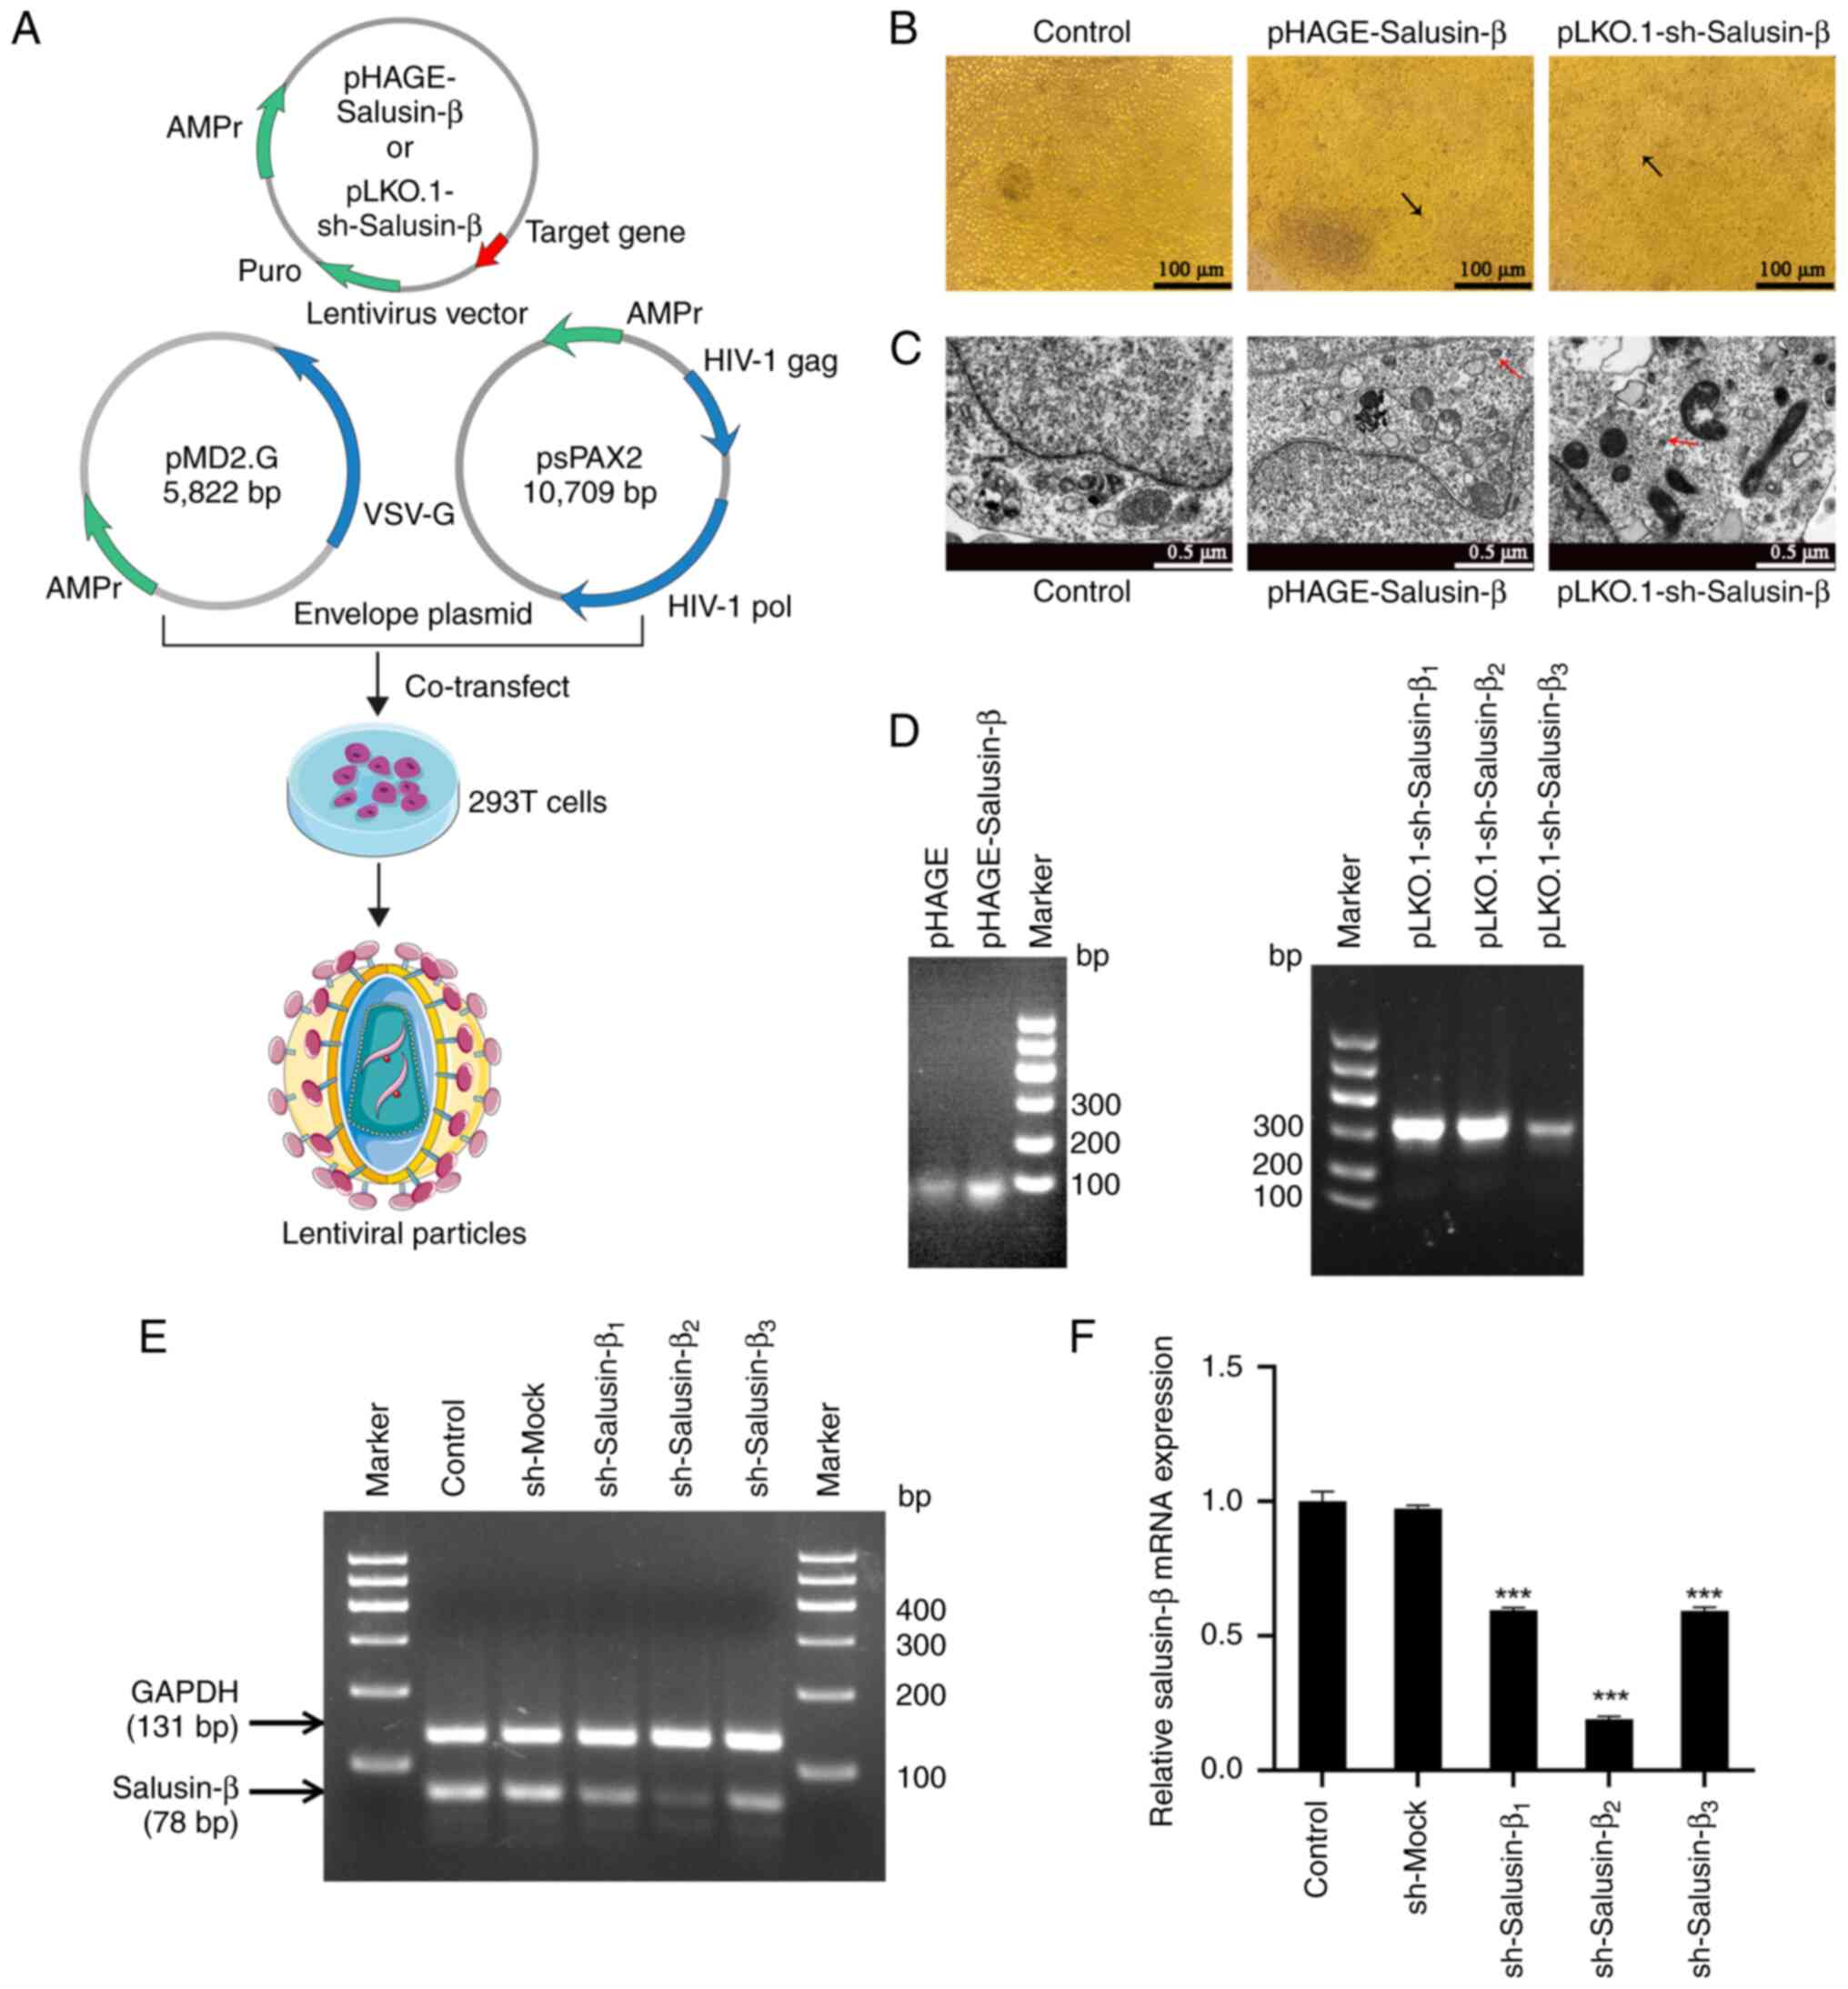 | Figure 2.Packaging and identification of the
recombinant lentiviruses. (A) Schematic representation of the
process used for lentivirus synthesis. (B) Representative images of
the cytopathic effect in 293T cells. On day 4 of lentivirus
packaging, small lesions appeared in the corresponding
plasmid-transfected groups, whereby the transfected cells fused to
form syncytia (indicated by black arrows). Scale bar, 100 µm. (C)
Transmission electron microscopy images of 293T cells transfected
with recombinant lentiviral vectors and control cells. Red arrows
indicate lentiviral particles. Scale bar, 0.5 µm. (D) Gel
electrophoresis of PCR target gene products from the lentiviral
particles harvested from the 293T cell culture medium. (E) Gel
electrophoresis and semi-quantitative PCR of salusin-β mRNA from
293T cells after lentivirus-mediated transduction of the shRNA
against salusin-β or a sequence without a hairpin structure for 24
h. (F) Relative mRNA expression levels of salusin-β in the
different groups of transfected 293T cells. Data are presented as
the mean ± standard error of the mean (n=3). ***P<0.001 vs.
sh-Mock group. Control, negative control group without lentiviral
treatment; pHAGE, empty lentiviral treatment group used as a
control for pHAGE-Salusin-β; sh-Mock, lentiviral treatment group
containing a non-targeting shRNA sequence as a control for
sh-Salusin-β; pHAGE-Salusin-β, lentiviral treatment group for
overexpression of Salusin-β; pLKO.1-sh-Salusin-β1-3 and
sh-Salusin-β1-3, lentiviral treatment group for
interference of Salusin-β. sh/shRNA, short hairpin RNA; puro,
puromycin resistance; AMPr, ampicillin resistance; HIV-1, human
immunodeficiency virus type 1; pol, polymerase; VSV-G, vesicular
stomatitis virus G. |
Following the transfection of 293T cells with the
lentiviral constructs for 24 h, the mRNA expression levels of
salusin-β were evaluated using s-qPCR. Nucleic acid electrophoresis
demonstrated a noticeable decrease in the signal intensity of the
target bands (78 bp) in the three groups of cells expressing
pLKO.1-sh-Salusin-β (Fig. 2E).
Compared with those in the sh-Mock group treated with lentivirus
containing a nonsense shRNA, the relative expression levels of
salusin-β mRNA were significantly reduced in the
sh-Salusin-β1, sh-Salusin-β2 and
sh-Salusin-β3 groups, with the sh-Salusin-β2
group exhibiting the most pronounced decrease (Fig. 2F). By contrast, no significant
difference in relative salusin-β mRNA expression was observed
between the sh-Mock group and the control group without lentiviral
treatment. These results confirmed the successful knockdown of
salusin-β mRNA expression by the three recombinant
pLKO.1-sh-Salusin-β vectors in 293T cells, with
sh-Salusin-β2 exhibiting the strongest effect.
Consequently, pLKO.1-sh-Salusin-β2 was selected as the optimal
recombinant vector for subsequent experiments.
Salusin-β expression negatively
regulates adipoR1 expression in 293T cells
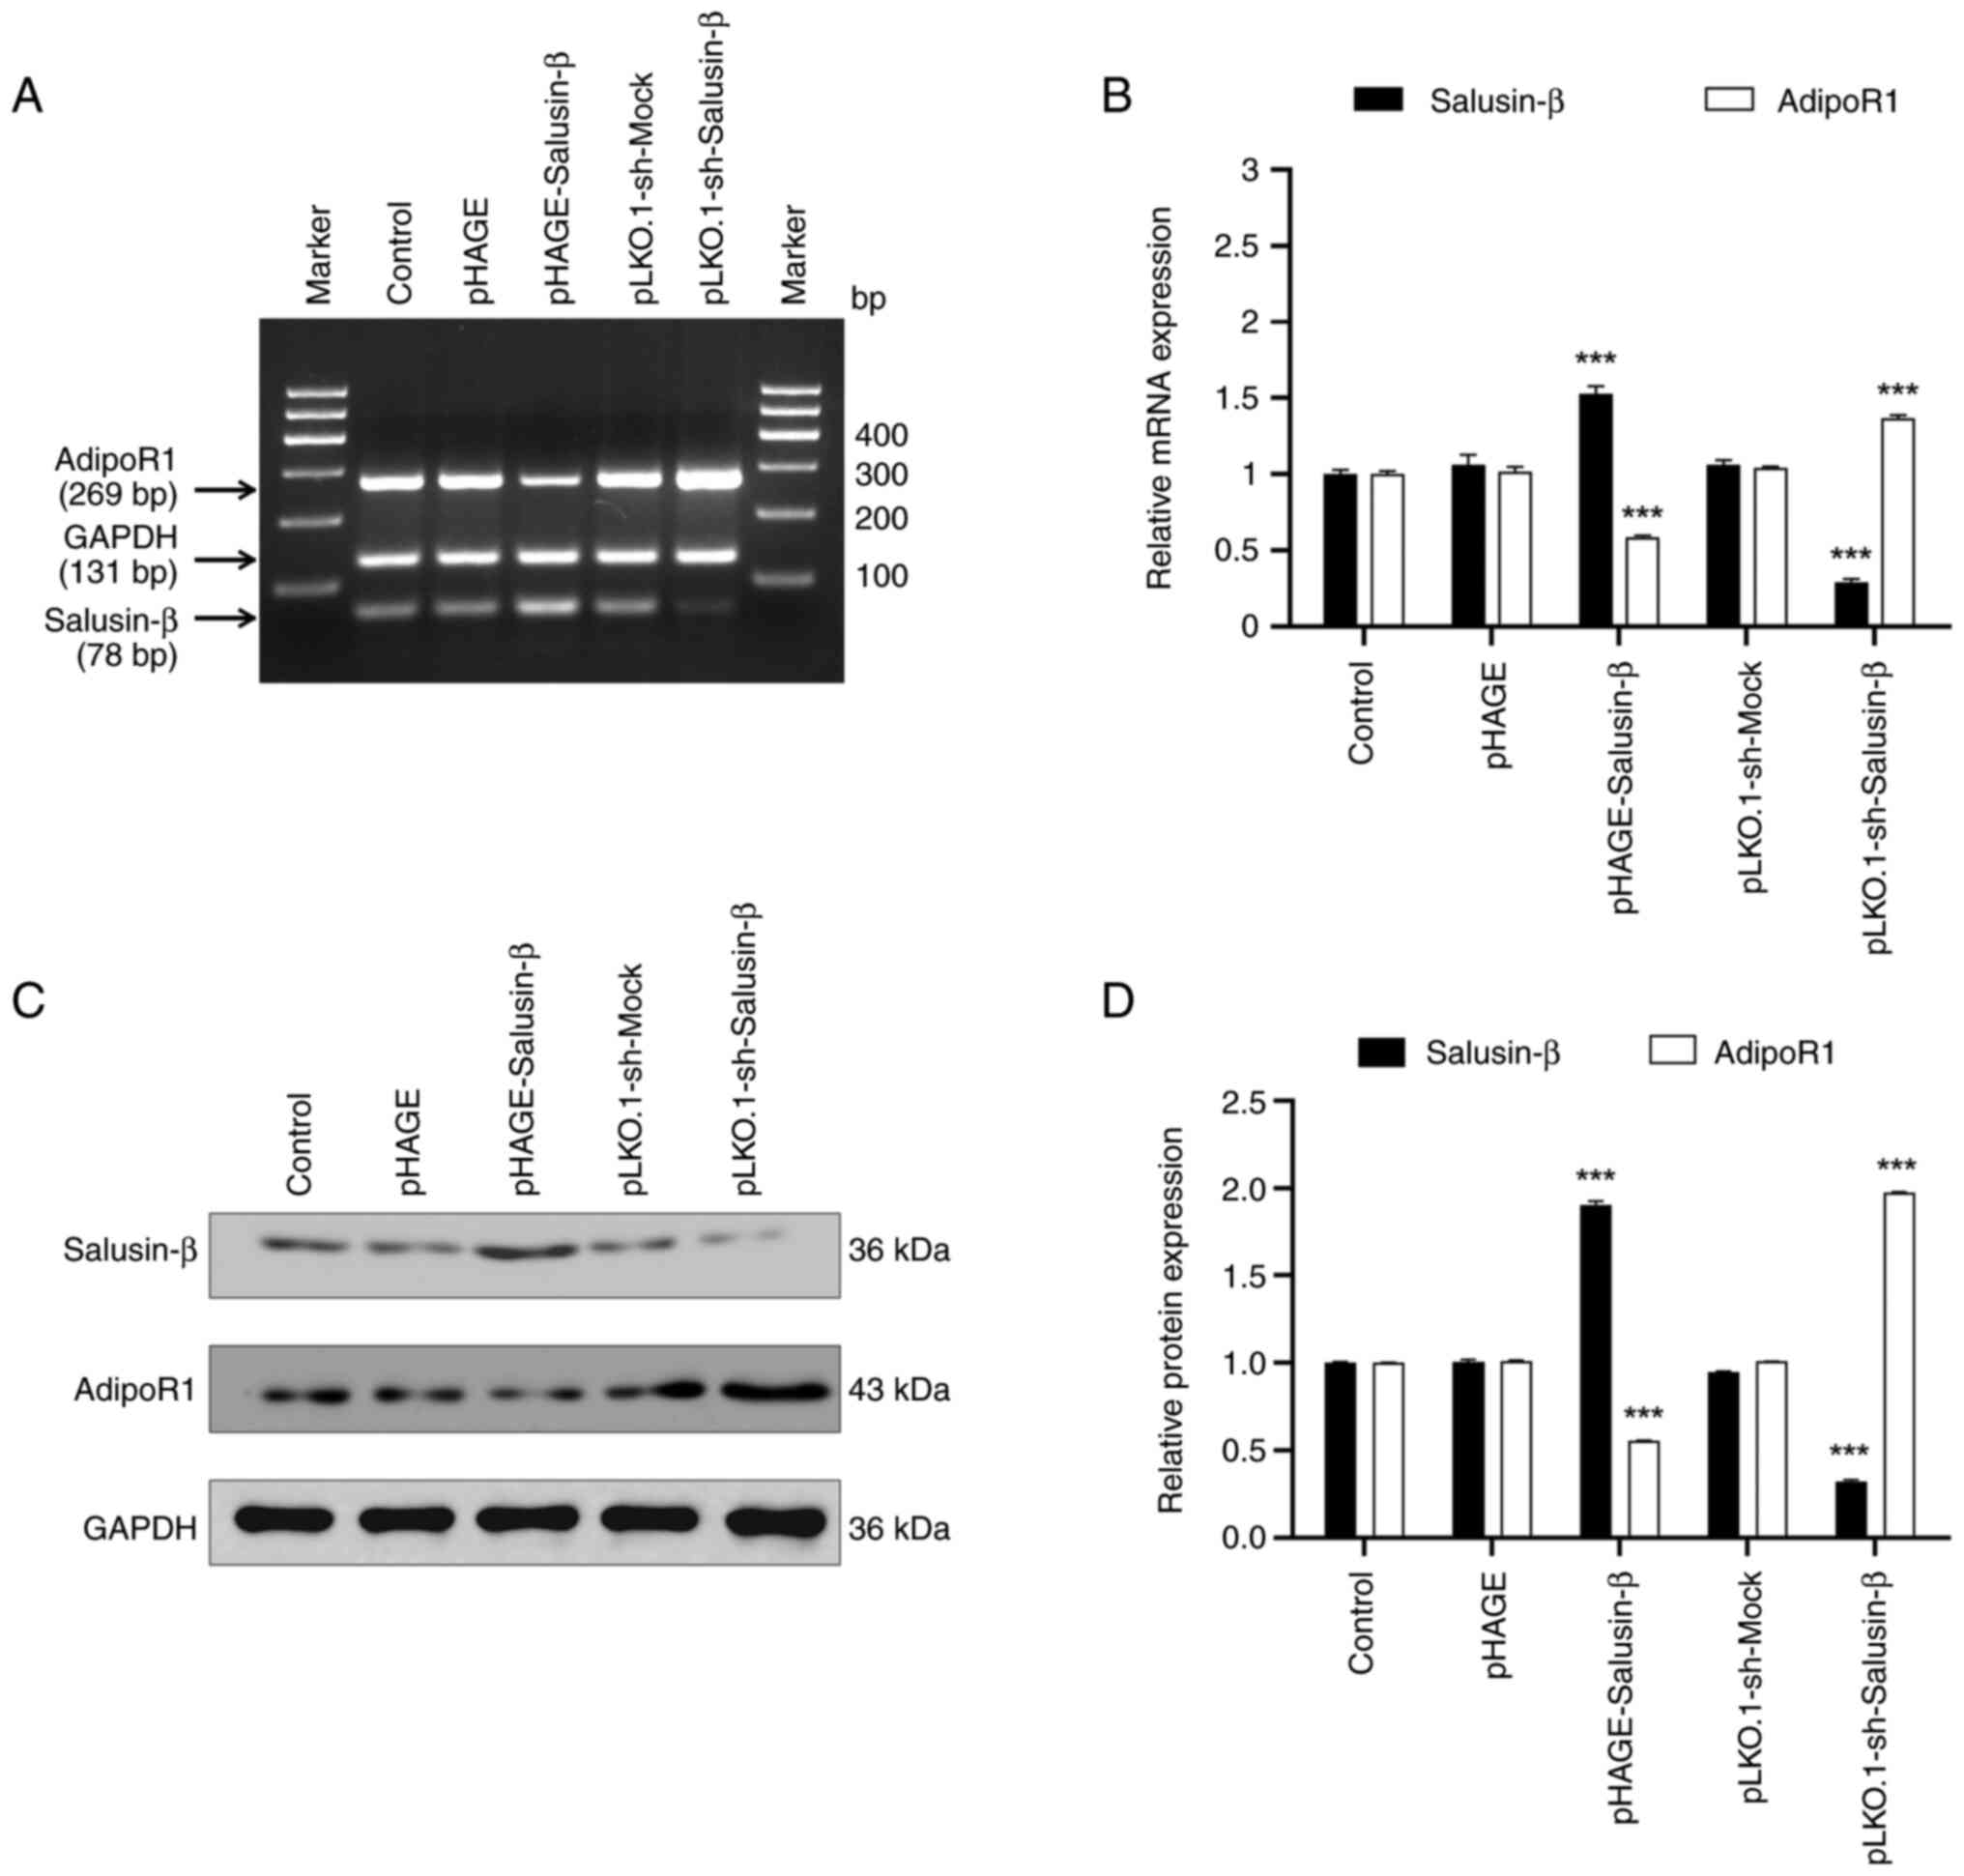
To explore the association between salusin-β and the
lipid metabolism-related protein adipoR1, 293T cells were divided
into control and treatment groups before undergoing transient
lentivirus transfection. S-qPCR results demonstrated that salusin-β
mRNA expression was altered depending on whether cells were
transfected with the salusin-β overexpression plasmid or shRNA
plasmids (Fig. 3A and B). There
was no significant difference in salusin-β mRNA expression between
the control group and the groups infected with non-load lentivirus
(pHAGE and pLKO.1-sh-Mock groups), which indicated that successful
transfection occurred. In the pHAGE-Salusin-β transfection group,
increased salusin-β expression led to a decrease in adipoR1 mRNA
expression. Conversely, salusin-β shRNA transfection was found to
reduce salusin-β mRNA expression whilst increasing adipoR1 mRNA
expression. WB analysis confirmed this relationship at the protein
expression level (Fig. 3C and D).
Specifically, salusin-β overexpression significantly decreased
relative adipoR1 protein expression, whilst knocking down salusin-β
expression significantly increased adipoR1 protein expression.
These findings suggested that salusin-β inhibited adipoR1 mRNA and
protein expression in 293T cells.
Salusin-β expression is inversely
associated with adipoR1 expression in HepG2 cells
Based on the aforementioned results demonstrating
the relationship between salusin-β and adipoR1 expression in 293T
cells, HepG2 cells were selected to further investigate this
relationship because the liver is closely associated with lipid
metabolism and adipoR1 may serve a key role in regulating lipid
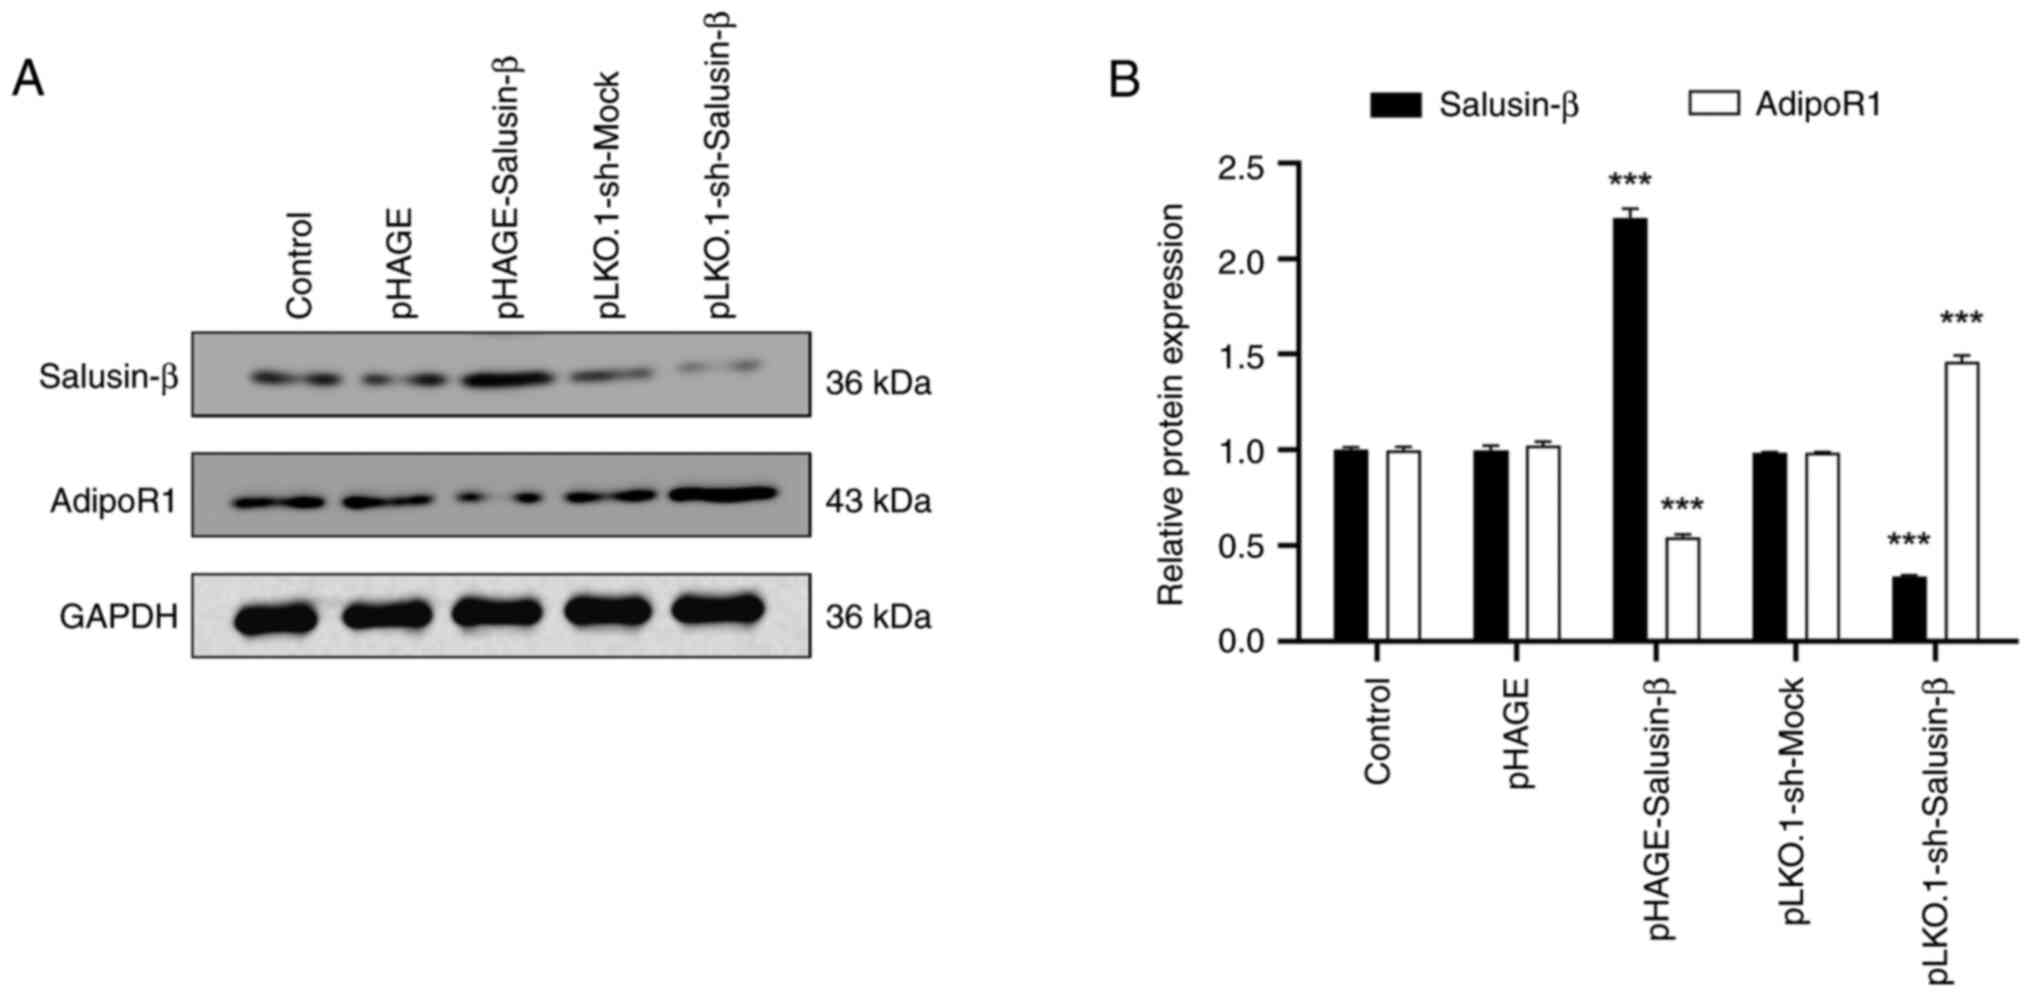
metabolism (14,15). WB analysis was conducted on
transfected HepG2 cells to assess the protein expression levels of
salusin-β and adipoR1 (Fig. 4A and
B). These results demonstrated that the overexpression of
salusin-β in HepG2 cells led to a reduction of adipoR1 protein
expression. Furthermore, transfecting HepG2 cells with
pLKO.1-sh-Salusin-β2 decreased the protein expression
levels of salusin-β and increased adipoR1 protein expression. These
changes in protein expression levels were consistent with those
observed in the same corresponding treatment groups of 293T cells,
which further confirmed the relationship between salusin-β and
adipoR1 expression.
Salusin-β regulates AMPK and ACC
phosphorylation and CPT-1A expression through adipoR1 in HepG2
cells
To investigate the potential regulatory effect of
salusin-β on the AMPK/ACC/CPT-1A signaling pathway, the protein
levels of p-AMPK and p-ACC, in addition to CPT-1A expression, were
examined to assess their modulation by salusin-β. In HepG2 cells,
overexpression of salusin-β significantly suppressed AMPK
phosphorylation and CPT-1A protein expression, with similar trends
observed for p-ACC protein levels (Fig. 5A). However, the western blot
analyses showed that there were no marked differences in the total
protein expression levels of AMPK and ACC among the treatment
groups (Fig. 5A and B). Treatment
of HepG2 cells overexpressing salusin-β with the adipoR1 agonist,
AdipoRon, led to a significant increase in the protein expression
levels of adipoR1 and CPT-1A and increased p-AMPK and p-ACC levels,
in contrast to the effects observed for salusin-β overexpression
alone. Conversely, transfection of HepG2 cells with
sh-Salusin-β2 resulted in a significant increase in the
protein levels of p-AMPK, p-ACC and CPT-1A, all of which were
reversed by thapsigargin treatment (Fig. 5B). These findings provide further
evidence that salusin-β could specifically modulate the levels of
AMPK and ACC phosphorylation, in addition to CPT-1A protein
expression, through its interaction with adipoR1.
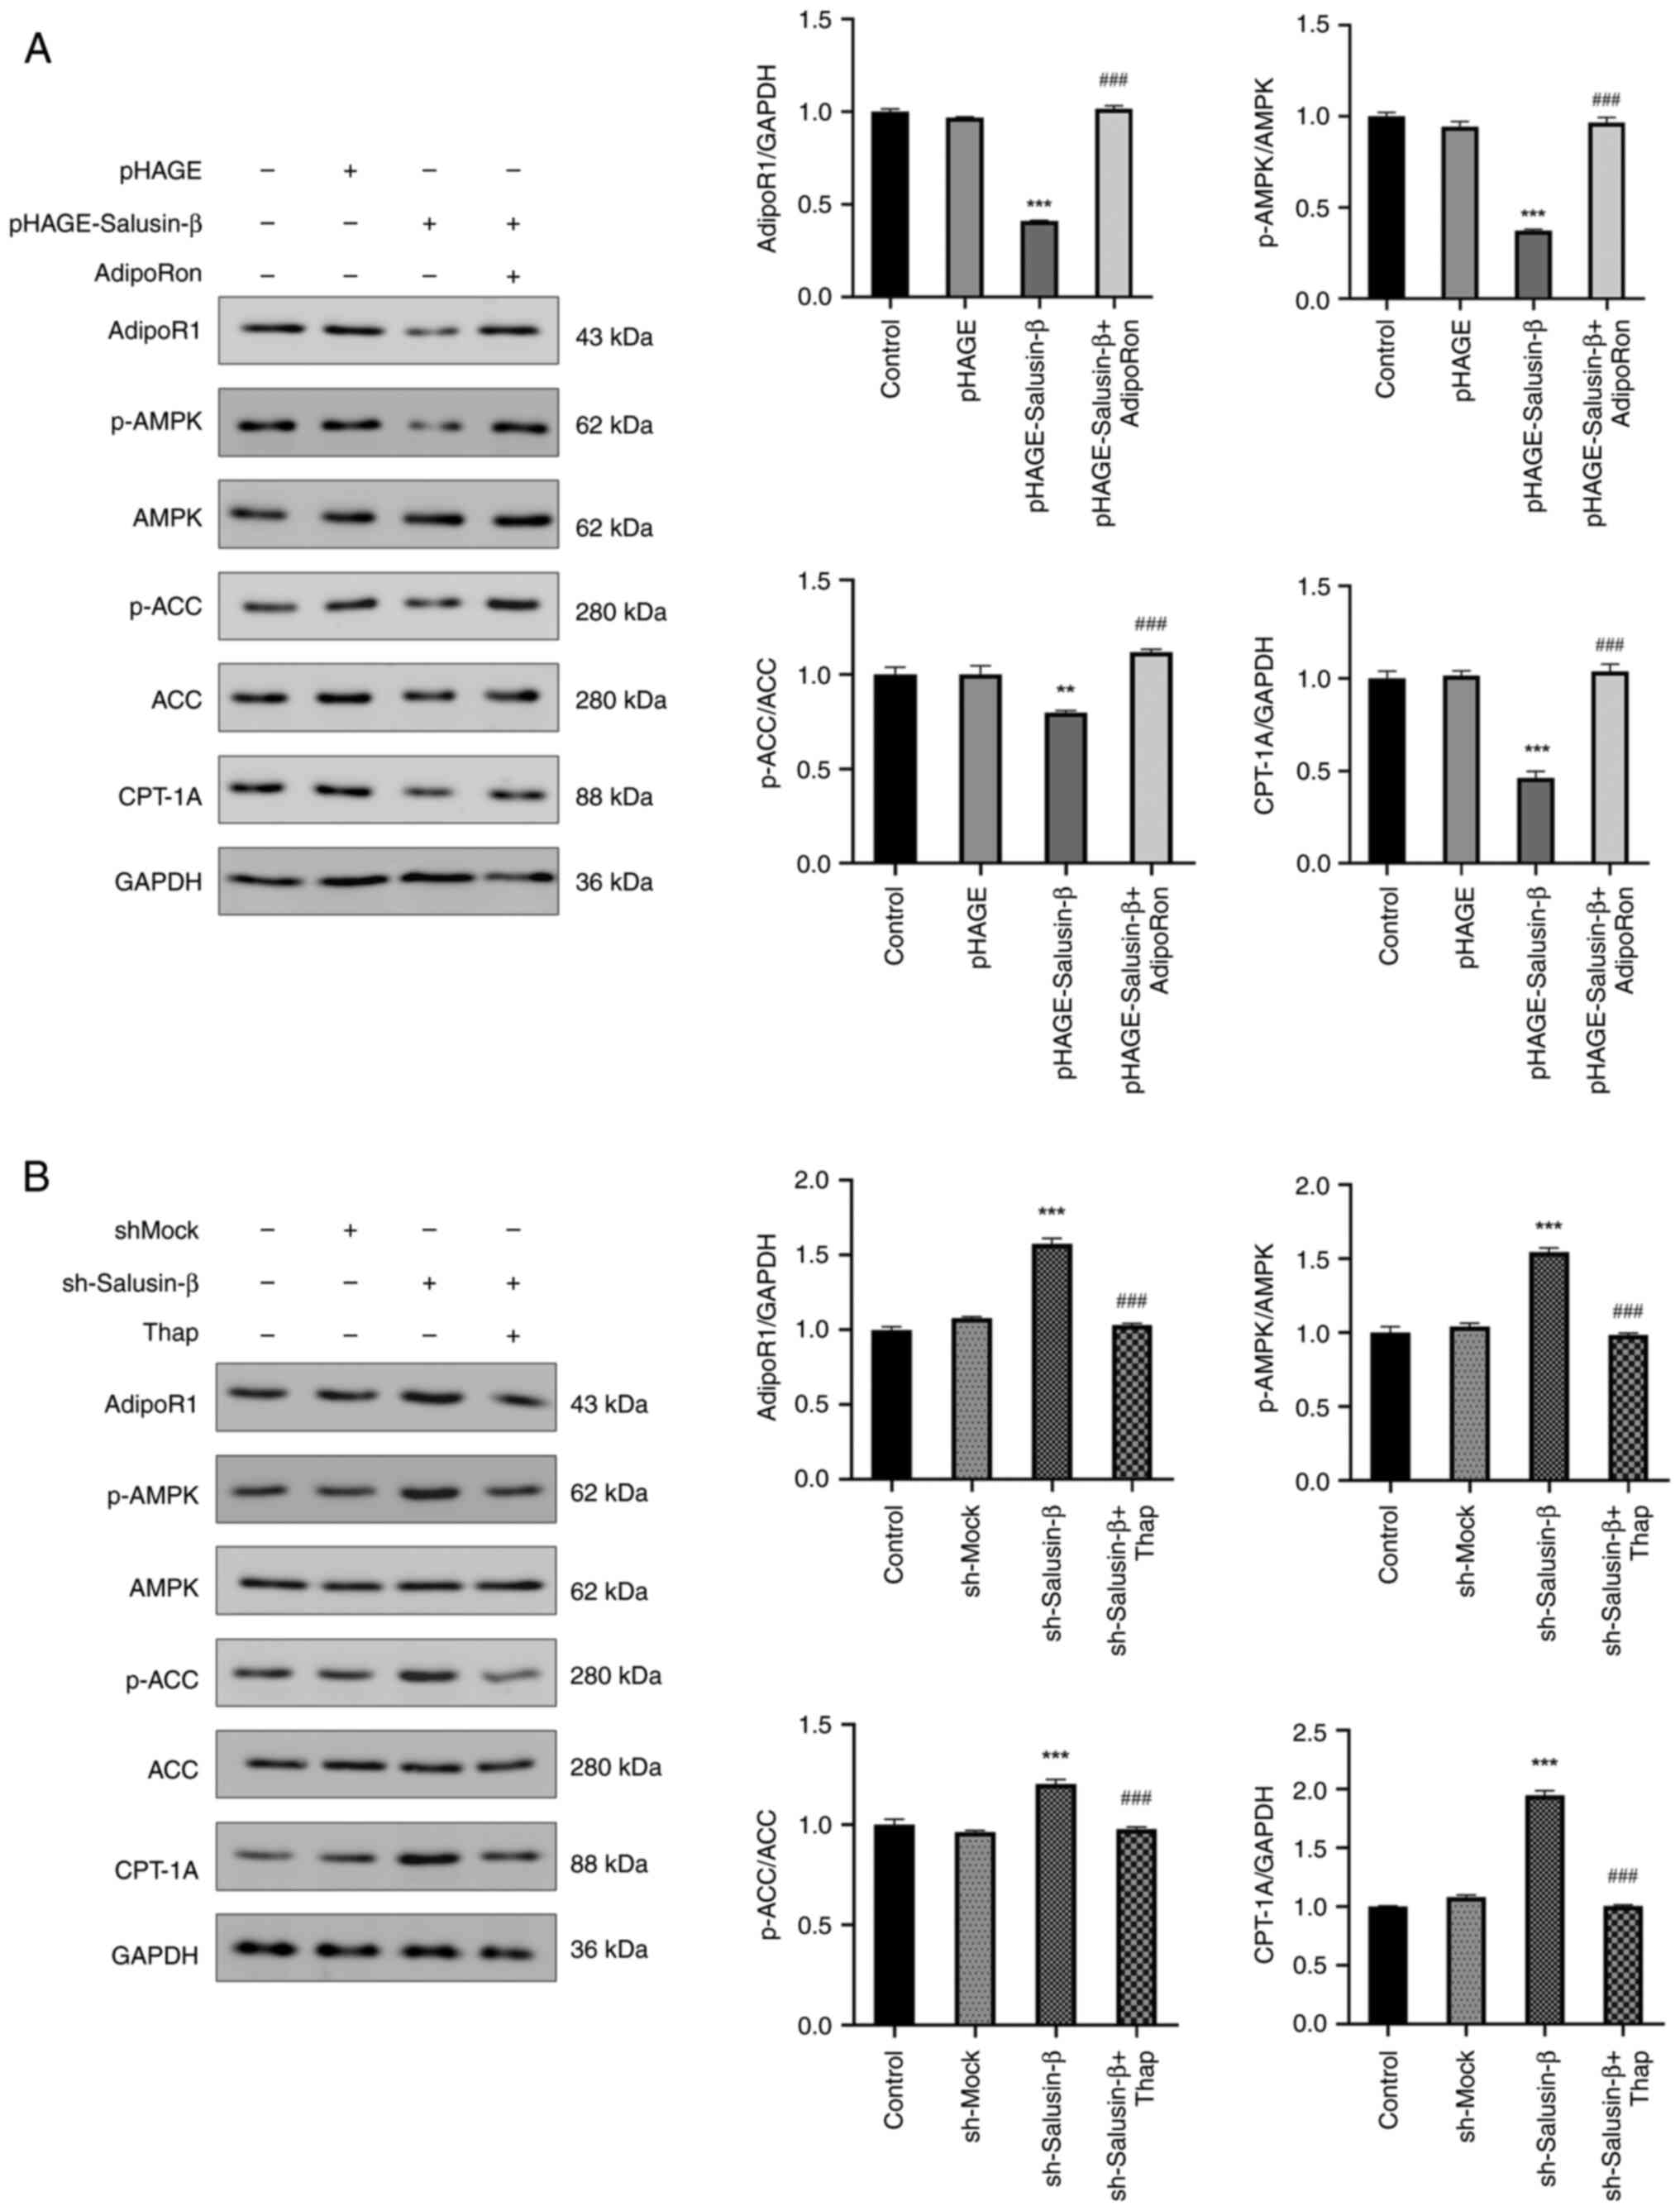 | Figure 5.Salusin-β inhibits AMPK and ACC
phosphorylation and CPT-1A expression in HepG2 cells. Protein
expression levels, analyzed by western blotting, of adipoR1,
p-AMPK, AMPK, p-ACC, ACC and CPT-1A in HepG2 cells from each group
after 24 h of lentiviral transfection treated with (A) AdipoRon or
(B) thap. Data are presented as the mean ± standard error of the
mean (n=3). **P<0.01, ***P<0.001 vs. control group.
###P<0.001 vs. pHAGE-Salusin-β or sh-Salusin-β group.
ACC, acetyl-CoA carboxylase; adipoR1, adiponectin receptor 1; AMPK,
5′AMP-dependent protein kinase; CPT-1A, carnitine palmitoyl
transferase 1A; p-, phosphorylated; sh, short hairpin RNA; thap,
thapsigargin. |
Salusin-β-mediated downregulation of
adipoR1 promotes lipid deposition in HepG2 cells
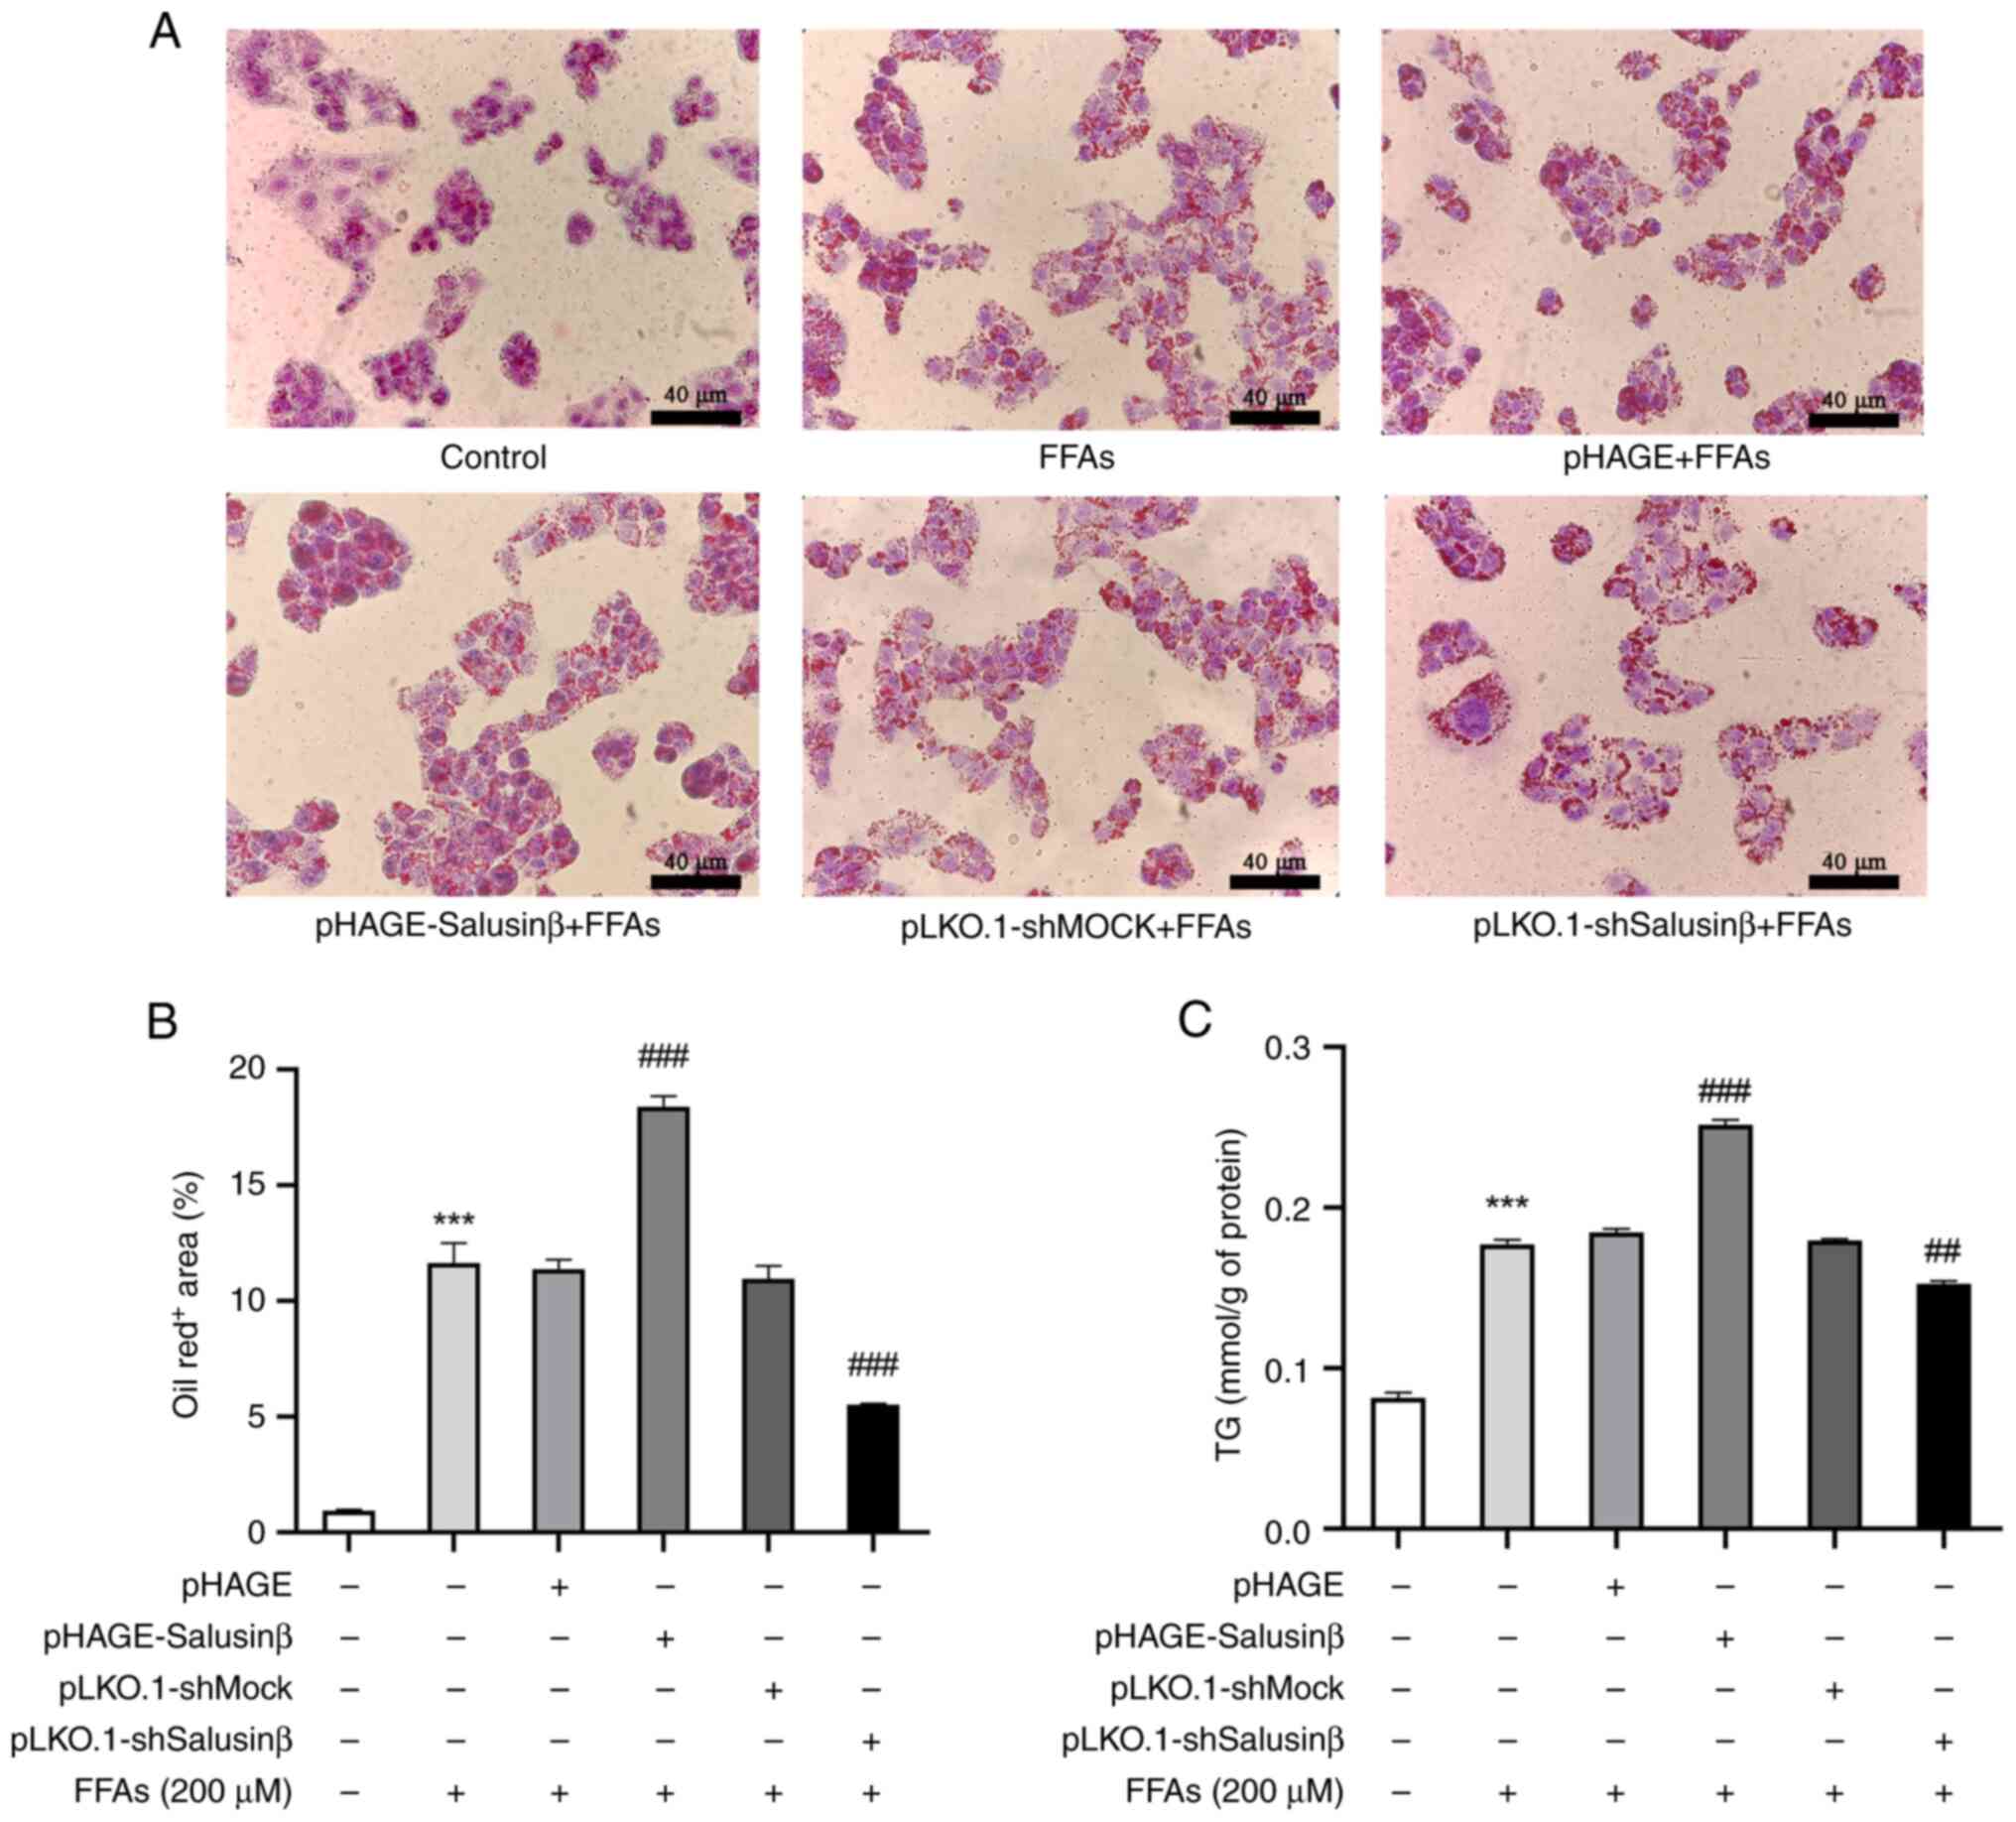
To further validate the impact of salusin-β-mediated
downregulation of adipoR1 on cellular lipid deposition in
vitro, HepG2 cells transfected with lentiviral vectors were
subjected to treatment with FFAs, while a model group induced by
FFAs alone and a control group without treatment were also
established (Fig. 6A). FFA
treatment significantly increased intracellular lipid droplet
formation in the model group compared with the control group. In
particular, overexpression of salusin-β potentiated the FFA-induced
intracellular TG levels and augmented lipid deposition compared
with the model group, whereas salusin-β knockdown resulted in
reduced TG levels and attenuated intracellular lipid accumulation
(Fig. 6B and C). These findings
further supported the impact of salusin-β on increasing lipid
deposition in HepG2 cells whilst also highlighting its regulatory
role in lipid metabolism.
Discussion
Salusin-β is a bioactive peptide that is involved in
certain cardiovascular diseases and has been previously associated
with abnormal lipid metabolism (16). A previous clinical study reported
that serum salusin-β levels are positively associated with TG
levels and the TG/HDL ratio in children and adolescents with
hypertension (17). A previous
in vitro study on renal cells reported that salusin-β
knockdown reduced lipid droplet formation and cholesterol levels
(18). In addition, increased
salusin-β expression has been associated with atherosclerosis
progression and elevated low-density lipoprotein cholesterol levels
in a mouse model (19). Despite
these associations, the underlying mechanisms through which
salusin-β can modulate lipid metabolism remain elusive. In the
present study, the role of salusin-β in lipid metabolism regulation
was investigated using both overexpression and knockdown approaches
in vitro. The 293T cell line was transfected with lentivirus
vectors to modulate the expression levels of salusin-β, and then
the expression levels of lipid metabolism-related genes were
examined. The results demonstrated that salusin-β overexpression
suppressed adipoR1 expression in 293T cells, while a decrease in
salusin-β levels resulted in increased expression levels of
adipoR1. Therefore, in 293T cells, there was a clear inverse
relationship between the expression of salusin-β and adipoR1, which
indicated a complex interplay between these proteins.
Adiponectin is a key regulator of lipid metabolism
that primarily exerts its effects through binding to its receptors,
adipoR1 and adipoR2 (20,21). A number of previous studies have
reported that adiponectin, through its interaction with adipoR1,
serves a pivotal role in lipid metabolism regulation, whereas
salusin-β has been reported to exert contrasting effects (22,23).
Considering the critical involvement of the liver in lipid
metabolism and the crucial role of hepatocellular lipid deposition
in the pathogenesis of fatty liver and related disorders, enhancing
hepatocytic lipid metabolism represents a potentially promising
therapeutic strategy (14,15). Consequently, HepG2 cells were
selected to be the experimental model in the present study.
Lentiviral particles harboring the salusin-β-encoding sequence or
the shRNA sequence were employed to transfect HepG2 cells.
Subsequently, WB was conducted to evaluate changes in adipoR1
protein expression. Consistent with the aforementioned observations
in 293T cells, overexpression of salusin-β significantly suppressed
adipoR1 expression, whilst salusin-β knockdown had the opposite
effect, which further suggested a negative association between
salusin-β and adipoR1. However, the precise molecular mechanisms
underlying the interaction between salusin-β and adipoR1, in
addition to the potential effects on the downstream signaling
pathways, warranted further investigation. Further experiments in
HepG2 cells were conducted, which also demonstrated consistent
alterations in the expression levels of adipoR1 and downstream
signaling molecules. In particular, salusin-β overexpression led to
the inhibition of AMPK and ACC phosphorylation and the reduction of
CPT-1A expression, suggesting its potential involvement in
suppressing fatty acid oxidation. Collectively, these results
provided evidence to support the pivotal role of salusin-β in
modulating lipid metabolism through the adipoR1 signaling pathway
in HepG2 cells.
AMPK is a critical regulator of certain metabolic
diseases and consists of α, β and γ subunits, with Thr172 on the α
subunit acting as the main activation site (24,25).
Phosphorylation of Thr172 leads to AMPK activation and the
subsequent phosphorylation of ACC at Ser79, resulting in its
inactivation and reduced malonyl CoA synthesis (26,27).
Malonyl CoA is an intermediate in fat synthesis, and its inhibitory
effect on CPT-1 is a key regulatory mechanism for maintaining the
balance of fatty acid metabolism, while CPT-1 promotes fatty acid
β-oxidation to enhance fat catabolism (28–30).
AdipoR1 has been previously associated with the AMPK signaling
pathway, with studies reporting its ability to induce
Ca2+ influx, activate
Ca(2+)/calmodulin-dependent protein kinase kinase β and
upregulate AMPK expression, thereby promoting lipid metabolism
(31,32). Conversely, reduced AMPK
phosphorylation is associated with lipid accumulation in liver
cells (33,34). Notably, salusin-β knockdown in
HUVECs has been reported to reverse AMPK and ACC deactivation
induced by high glucose (35).
Based on these previous findings and those from the present study,
specifically the salusin-β-mediated inhibition of adipoR1
expression in HepG2 cells, it was therefore hypothesized that
salusin-β may modulate AMPK and ACC phosphorylation, as well as
CPT-1A protein levels, through adipoR1, thus influencing lipid
metabolism in liver cells. To test this hypothesis, the protein
levels of p-AMPK and p-ACC, and CPT-1A expression were examined in
different treatment groups of HepG2 cells. WB analysis demonstrated
that salusin-β knockdown increased the p-AMPK/AMPK and p-ACC/ACC
ratios, in addition to increasing CPT-1A protein expression. By
contrast, salusin-β overexpression reduced AMPK and ACC
phosphorylation and CPT-1A protein expression. These findings
supported the notion that salusin-β can interact with the
adipoR1/AMPK signaling pathway, specifically by inhibiting AMPK and
ACC phosphorylation and CPT-1A protein expression, by
downregulating adipoR1 expression.
According to the data presented in the current
study, the inhibitory effect of salusin-β on fatty acid oxidation
in HepG2 cells was, at least, partially revealed. Significant
changes in CPT-1A protein expression in HepG2 cells were observed
after the expression of salusin-β was altered. CPT-1A is a key
enzyme in the mitochondrial membrane that is involved in the
regulation of fatty acid transport and β-oxidation, which in turn
regulates intracellular lipid metabolism (26,28).
The results of the present study suggested that by inhibiting
CPT-1A, salusin-β may inhibit the ability of hepatocytes to
efficiently break down fatty acids by oxidative metabolism, which
may lead to lipid accumulation. Therefore, changes in CPT-1A
protein expression may be a potential mechanism by which salusin-β
inhibits fatty acid oxidation in hepatocytes. In addition, Oil Red
O staining was used in the present study to observe the effect of
salusin-β on lipid accumulation in HepG2 cells. The results
demonstrated that after salusin-β overexpression, lipid deposition
and TG levels were significantly increased in FFA-induced HepG2
cells. This further supported the inhibitory effects of salusin-β
on fatty acid metabolism in hepatocytes. In conclusion, based on
the results obtained in the present study, it could be suggested
that salusin-β may regulate lipid metabolism by acting on the
adipoR1/AMPK/ACC/CPT-1A signaling pathway and promoting the
deposition of lipids in hepatocytes.
Based on the present experimental findings, a novel
hypothesis was proposed (Fig. 7).
In HepG2 cells, increased expression of salusin-β leads to the
inhibition of adipoR1 expression. This inhibition of adipoR1 then
suppresses AMPK activation, which results in reduced p-AMPK levels.
Consequently, the activation of ACC by p-AMPK is diminished, which
leads to decreased p-ACC and enhanced malonyl CoA synthesis.
However, the increased levels of malonyl CoA in turn inhibit the
production of CPT-1A, which reduces the entry of long-chain
acyl-CoA into the mitochondria and ultimately inhibits fatty acid
oxidation.
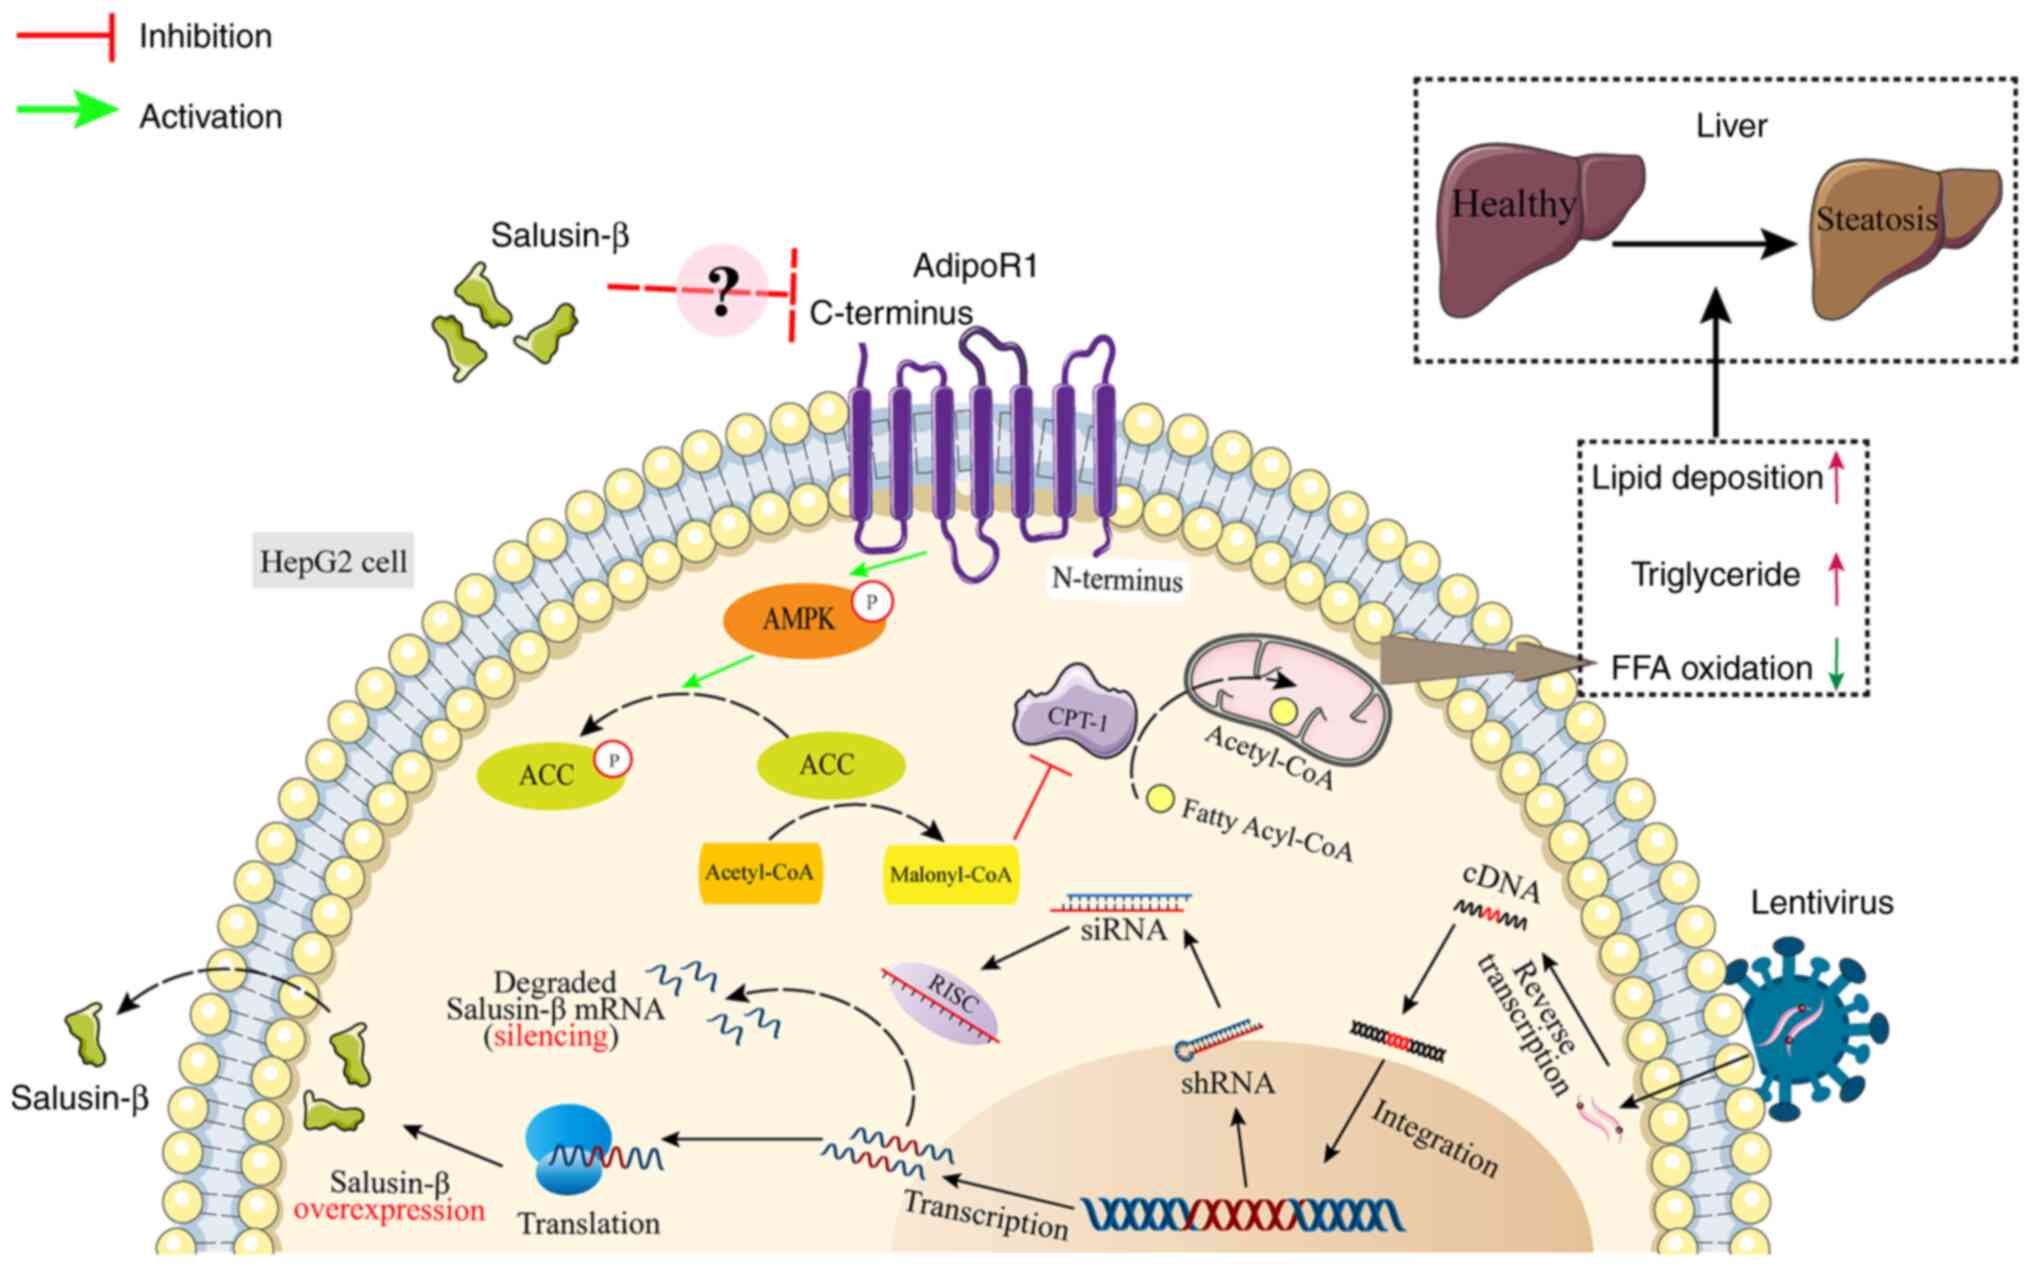 | Figure 7.Schematic diagram of the signaling
pathway investigated in the present study. Salusin-β decreases
adipoR1 expression, which reduces the phosphorylation of AMPK and
ACC in cells. ACC promotes the synthesis of Malonyl-CoA, which
inhibits CPT-1, reducing the transfer of long-chain fatty acyl-CoA
from the cytoplasm to mitochondria, thus inhibiting fatty acid
β-oxidation. ACC, acetyl-CoA carboxylase; adipoR1, adiponectin
receptor 1; AMPK, 5′AMP-dependent protein kinase; CPT-1, carnitine
palmitoyl transferase 1; FFA, free fatty acid; p, phosphorylated;
RISC, RNA-induced silencing complex; shRNA, short hairpin RNA;
siRNA, small interfering RNA. |
The present study focused on the regulation of
adipoR1 and downstream signaling molecules by modulating salusin-β
gene expression. Further research is needed to understand the
precise mechanism of the interaction between salusin-β and adipoR1,
in addition to its impact on the signaling pathway. A previous
study utilized artificial liposomes embedded with endogenous
membrane proteins to reveal the direct physical interaction between
salusin-β and the ATP synthase β-chain, indicating a potential
ligand-receptor binding scenario (36). Salusin-β may potentially activate
undiscovered GPCRs (37). This
suggests that there may be a physical interaction between salusin-β
and adipoR1. However, adipoR1 exhibits a distinct topology compared
with other typical GPCRs, with the C-terminal binding to
adiponectin located outside the cell whilst the N-terminal binds to
adapter proteins inside the cell (9). Additionally, there may be other
signaling molecules acting as intermediaries, establishing
connections between salusin-β and adipoR1 and influencing the
signaling pathway of adipoR1. These specific molecular mechanisms
require further investigation. Furthermore, the present study was
limited to common lipid metabolism-related molecules. Changes in
salusin-β and adipoR1 expression may involve other lipid metabolism
pathways. Therefore, further experiments are warranted to elucidate
these mechanisms in greater detail.
Supplementary Material
Supporting Data
Acknowledgements
The authors would like to thank Professor Qiuhong
Duan (Department of Basic Medicine at the Wuhan Huazhong University
of Science and Technology, Wuhan, China) for donating the
lentivirus vectors.
Funding
The present study was supported by the ESI Top 1% Discipline
Establishment Project for the Hubei University of Chinese Medicine
(grant nos. 100702020506 and 100702020518) and the Research Plan
Projects of the Hubei Provincial Department of Education (grant no.
B2018099).
Availability of data and materials
The datasets used and/or analyzed during the current
study are available from the corresponding author on reasonable
request.
Authors' contributions
YW, XD and XL proposed the study concepts. AX, LW
and HZ designed the study. AX, HZ and MN performed the research.
LW, ML and XD provided help and advice with experiments. AX, ML and
JP analyzed the data. AX, YW and HZ wrote the manuscript. AX and YW
confirm the authenticity of all the raw data. All authors
contributed to editorial changes to the manuscript. All authors
read and approved the final version of the manuscript.
Ethics approval and consent to
participate
Not applicable.
Patient consent for publication
Not applicable.
Competing interests
The authors declare that they have no competing
interests.
References
|
1
|
Chen MX, Deng BY, Liu ST, Wang ZB and Wang
SZ: Salusins: Advance in cardiovascular disease research. J Pharm
Pharmacol. 75:363–369. 2023. View Article : Google Scholar : PubMed/NCBI
|
|
2
|
Shichiri M, Ishimaru S, Ota T, Nishikawa
T, Isogai T and Hirata Y: Salusins: Newly identified bioactive
peptides with hemodynamic and mitogenic activities. Nat Med.
9:1166–1172. 2003. View
Article : Google Scholar : PubMed/NCBI
|
|
3
|
Xu XL, Zeng Y, Zhao C, He MZ, Wang F and
Zhang W: Salusin-β induces smooth muscle cell proliferation by
regulating cyclins D1 and E expression through MAPKs signaling
pathways. J Cardiovasc Pharmacol. 65:377–385. 2015. View Article : Google Scholar : PubMed/NCBI
|
|
4
|
Esfahani M, Saidijam M, Najafi R, Goodarzi
MT and Movahedian A: The effect of salusin-β on expression of pro-
and anti-inflammatory cytokines in human umbilical vein endothelial
cells (HUVECs). ARYA Atheroscler. 14:1–10. 2018.PubMed/NCBI
|
|
5
|
Wang Z, Takahashi T, Saito Y, Nagasaki H,
Ly NK, Nothacker HP, Reinscheid RK, Yang J, Chang JK, Shichiri M
and Civelli O: Salusin beta is a surrogate ligand of the mas-like G
protein-coupled receptor MrgA1. Eur J Pharmacol. 539:145–150. 2006.
View Article : Google Scholar : PubMed/NCBI
|
|
6
|
Arkan A, Atukeren P, Ikitimur B, Simsek G,
Koksal S, Gelisgen R, Ongen Z and Uzun H: The importance of
circulating levels of salusin-α, salusin-β, and heregulin-β1 in
atherosclerotic coronary arterial disease. Clin Biochem. 87:19–25.
2021. View Article : Google Scholar : PubMed/NCBI
|
|
7
|
Aydin S and Aydin S: Salusin-alpha and
-beta expression in heart and aorta with and without metabolic
syndrome. Biotech Histochem. 89:98–103. 2014. View Article : Google Scholar : PubMed/NCBI
|
|
8
|
Chen H and Jin G: Downregulation of
Salusin-β protects renal tubular epithelial cells against high
glucose-induced inflammation, oxidative stress, apoptosis and lipid
accumulation via suppressing miR-155-5p. Bioengineered.
12:6155–6165. 2021. View Article : Google Scholar : PubMed/NCBI
|
|
9
|
Khoramipour K, Chamari K, Hekmatikar AA,
Ziyaiyan A, Taherkhani S, Elguindy NM and Bragazzi NL: Adiponectin:
Structure, physiological functions, role in diseases, and effects
of nutrition. Nutrients. 13:11802021. View Article : Google Scholar : PubMed/NCBI
|
|
10
|
Wang Q, Liu S, Zhai A, Zhang B and Tian G:
AMPK-mediated regulation of lipid metabolism by phosphorylation.
Biol Pharm Bull. 41:985–993. 2018. View Article : Google Scholar : PubMed/NCBI
|
|
11
|
Trudel P, Provost S, Massie B, Chartrand P
and Wall L: pGATA: A positive selection vector based on the
toxicity of the transcription factor GATA-1 to bacteria.
Biotechniques. 20:684–693. 1996.PubMed/NCBI
|
|
12
|
Yu F, Li X, Wang F, Liu Y, Zhai C, Li W,
Ma L and Chen W: TLTC, a T5 exonuclease-mediated low-temperature
DNA cloning method. Front Bioeng Biotech. 11:11675342023.
View Article : Google Scholar : PubMed/NCBI
|
|
13
|
Zhang Y, Ndzouboukou JB, Lin X, Hou H,
Wang F, Yuan L, Gan M, Yao Z, Fu H, Cao J and Fan X: SARS-CoV-2
evolves to reduce but not abolish neutralizing action. J Med Virol.
95:e282072023. View Article : Google Scholar : PubMed/NCBI
|
|
14
|
Sen P, Qadri S, Luukkonen PK,
Ragnarsdottir O, McGlinchey A, Jäntti S, Juuti A, Arola J,
Schlezinger JJ, Webster TF, et al: Exposure to environmental
contaminants is associated with altered hepatic lipid metabolism in
non-alcoholic fatty liver disease. J Hepatol. 76:283–293. 2022.
View Article : Google Scholar : PubMed/NCBI
|
|
15
|
Alannan M, Fayyad-Kazan H, Trézéguet V and
Merched A: Targeting lipid metabolism in liver cancer.
Biochemistry. 59:3951–3964. 2020. View Article : Google Scholar : PubMed/NCBI
|
|
16
|
Wang Y, Wang S, Zhang J, Zhang M, Zhang H,
Gong G, Luo M, Wang T and Mao X: Salusin-β is superior to salusin-α
as a marker for evaluating coronary atherosclerosis. J Int Med Res.
48:3000605209038682020.PubMed/NCBI
|
|
17
|
Kołakowska U, Kuroczycka-Saniutycz E,
Wasilewska A and Olański W: Is the serum level of salusin-β
associated with hypertension and atherosclerosis in the pediatric
population? Pediatr Nephrol. 30:523–531. 2015. View Article : Google Scholar : PubMed/NCBI
|
|
18
|
Wang WJ, Jiang X, Gao CC and Chen ZW:
Salusin-β participates in high glucose-induced HK-2 cell
ferroptosis in a Nrf-2-dependent manner. Mol Med Rep. 24:6742021.
View Article : Google Scholar : PubMed/NCBI
|
|
19
|
Zhou CH, Liu LL, Wu YQ, Song Z and Xing
SH: Enhanced expression of salusin-β contributes to progression of
atherosclerosis in LDL receptor deficient mice. Can J Physiol
Pharmacol. 90:463–471. 2012. View Article : Google Scholar : PubMed/NCBI
|
|
20
|
Fang H and Judd RL: Adiponectin regulation
and function. Compr Physiol. 8:1031–1063. 2018. View Article : Google Scholar : PubMed/NCBI
|
|
21
|
Pascolutti R, Erlandson SC, Burri DJ,
Zheng S and Kruse AC: Mapping and engineering the interaction
between adiponectin and T-cadherin. J Biol Chem. 295:2749–2759.
2020. View Article : Google Scholar : PubMed/NCBI
|
|
22
|
Katsiki N, Mantzoros C and Mikhailidis DP:
Adiponectin, lipids and atherosclerosis. Curr Opin Lipidol.
28:347–354. 2017. View Article : Google Scholar : PubMed/NCBI
|
|
23
|
Niepolski L and Grzegorzewska AE: Salusins
and adropin: New peptides potentially involved in lipid metabolism
and atherosclerosis. Adv Med Sci. 61:282–287. 2016. View Article : Google Scholar : PubMed/NCBI
|
|
24
|
Herzig S and Shaw RJ: AMPK: Guardian of
metabolism and mitochondrial homeostasis. Nat Rev Mol Cell Biol.
19:121–135. 2018. View Article : Google Scholar : PubMed/NCBI
|
|
25
|
Cantó C and Auwerx J: AMP-activated
protein kinase and its downstream transcriptional pathways. Cell
Mol Life Sci. 67:3407–3423. 2010. View Article : Google Scholar : PubMed/NCBI
|
|
26
|
Fang K, Wu F, Chen G, Dong H, Li J, Zhao
Y, Xu L, Zou X and Lu F: Diosgenin ameliorates palmitic
acid-induced lipid accumulation via AMPK/ACC/CPT-1A and
SREBP-1c/FAS signaling pathways in LO2 cells. BMC Complement Altern
Med. 19:2552019. View Article : Google Scholar : PubMed/NCBI
|
|
27
|
Zhang Z, Ni L, Zhang L, Zha D, Hu C, Zhang
L, Feng H, Wei X and Wu X: Empagliflozin regulates the
AdipoR1/p-AMPK/p-ACC pathway to alleviate lipid deposition in
diabetic nephropathy. Diabetes Metab Syndr Obes. 14:227–240. 2021.
View Article : Google Scholar : PubMed/NCBI
|
|
28
|
McGarry JD, Leatherman GF and Foster DW:
Carnitine palmitoyltransferase I. The site of inhibition of hepatic
fatty acid oxidation by malonyl-CoA. J Biol Chem. 253:4128–4136.
1978. View Article : Google Scholar : PubMed/NCBI
|
|
29
|
Saggerson D: Malonyl-CoA, a key signaling
molecule in mammalian cells. Annu Rev Nutr. 28:253–272. 2008.
View Article : Google Scholar : PubMed/NCBI
|
|
30
|
Dai J, Liang K, Zhao S, Jia W, Liu Y, Wu
H, Lv J, Cao C, Chen T, Zhuang S, et al: Chemoproteomics reveals
baicalin activates hepatic CPT1 to ameliorate diet-induced obesity
and hepatic steatosis. Proc Natl Acad Sci USA. 115:E5896–E5905.
2018. View Article : Google Scholar : PubMed/NCBI
|
|
31
|
Liu L, Yao L, Wang S, Chen Z, Han T, Ma P,
Jiang L, Yuan C, Li J, Ke D, et al: 6-gingerol improves ectopic
lipid accumulation, mitochondrial dysfunction, and insulin
resistance in skeletal muscle of ageing rats: Dual stimulation of
the AMPK/PGC-1α signaling pathway via plasma adiponectin and
muscular adipoR1. Mol Nutr Food Res. 63:e18006492019. View Article : Google Scholar : PubMed/NCBI
|
|
32
|
Iwabu M, Yamauchi T, Okada-Iwabu M, Sato
K, Nakagawa T, Funata M, Yamaguchi M, Namiki S, Nakayama R, Tabata
M, et al: Adiponectin and adipoR1 regulate PGC-1alpha and
mitochondria by Ca(2+) and AMPK/SIRT1. Nature. 464:1313–1319. 2010.
View Article : Google Scholar : PubMed/NCBI
|
|
33
|
Chen L, Xin FJ, Wang J, Hu J, Zhang YY,
Wan S, Cao LS, Lu C, Li P, Yan SF, et al: Conserved regulatory
elements in AMPK. Nature. 498:E8–10. 2013. View Article : Google Scholar : PubMed/NCBI
|
|
34
|
Long JK, Dai W, Zheng YW and Zhao SP:
miR-122 promotes hepatic lipogenesis via inhibiting the LKB1/AMPK
pathway by targeting Sirt1 in non-alcoholic fatty liver disease.
Mol Med. 25:262019. View Article : Google Scholar : PubMed/NCBI
|
|
35
|
Zhu X, Zhou Y, Cai W, Sun H and Qiu L:
Salusin-β mediates high glucose-induced endothelial injury via
disruption of AMPK signaling pathway. Biochem Biophys Res Commun.
491:515–521. 2017. View Article : Google Scholar : PubMed/NCBI
|
|
36
|
Shichiri M, Nonaka D, Lee LJ and Tanaka K:
Identification of the salusin-β receptor using proteoliposomes
embedded with endogenous membrane proteins. Sci Rep. 8:178652018.
View Article : Google Scholar : PubMed/NCBI
|
|
37
|
Watanabe T, Nishio K, Kanome T, Matsuyama
TA, Koba S, Sakai T, Sato K, Hongo S, Nose K, Ota H, et al: Impact
of salusin-alpha and -beta on human macrophage foam cell formation
and coronary atherosclerosis. Circulation. 117:638–648. 2008.
View Article : Google Scholar : PubMed/NCBI
|