Introduction
Although ovarian cancer ranks 7th among all cancers
in women in terms of prevalence, almost 60–70% of those who have
ovarian cancer eventually succumb to the disease (1). Ovarian cancer has a considerably
higher mortality rate compared to breast cancer (approximately 20%
mortality rate), which has a much higher incidence (1,2). In
fact, ovarian cancer is the most lethal gynecologic malignancy
(3). Failure to obtain better
survival rates in ovarian cancer is caused by drug resistance. Over
the past 3 decades, surgical tumor debulking, followed by
chemotherapy is the standard treatment for advanced ovarian cancer.
Although response rates and complete responses in advanced disease
are >80 and 40–60%, respectively, after a first-line treatment
with carboplatin and paclitaxel, a majority of patients eventually
relapse with a median progression-free survival of 18 months
(3,4). Prompt adjustment of the chemotherapy
regimen based on early detection of tumor resistance to the drugs
and discovering targets to reverse drug resistance may further
improve the outcomes of this disease.
Lack of a detailed understanding of drug resistance
mechanisms may delay, circumvent or prevent the development of drug
resistance. Proper tools for studying drug resistance mechanisms
are important but difficult to obtain in a clinical situation. A
number of reported findings on paclitaxel resistance were achieved
mainly by in vitro studies with cell lines that have
acquired drug resistance. To date, possible drug resistance
mechanisms reported include enhanced expression of P-glycoprotein,
alterations in tubulin structure through gene mutations in the
tubulin β chain and changes in the ratio of tubulin isomers within
the polymerized microtubule (5–8).
In view of the existence of post-translational
protein processing and modification, inconsistencies were often
identified between the expression levels of genes and proteins. The
application of proteomic techniques may perform high throughput
comparisons at the protein level and are ideally suitable in
identifying differences in expressed proteins between
chemosensitive and chemoresistant cells. In order to better
understand chemoresistance in ovarian cancer, we established a
protein screening in 2 human ovarian cancer cell lines and their
taxol-resistant variants. Phosphorylated cofilin 1 (p-CFL1) was
selected, validated in vivo and in vitro and a
correlation between p-CFL1 and taxol resistance was confirmed.
Materials and methods
Cell culture, drugs and cytotoxicity
assay
The human epithelial ovarian cancer cell line SKOV3,
used in this study, was purchased from the Cell Culture Center,
Institute of Basic Medical Science, Chinese Academy of Medical
Sciences. Human epithelial ovarian cancer cell line A2780 and its
taxol-resistant subtype A2780/TR were kindly supplied by the Cancer
Institute of the Guangxi Medical University. SKOV3/TR2500 and
SKOV3/TR30, 2 taxol-resistant variants from SKOV3, were induced in
our laboratory (9). For inducing
SKOV3/TR2500, SKOV3 was cultured in taxol (6 mg/ml; Bristol-Myers
Squibb Co., USA) at 2.5 μM for 1 h, and the pulse was repeated 21
times for 18 months. For inducing SKOV3/TR30, cells underwent
intermittent stimulation for 24 h in taxol at 10, 20 and 30 nM
successively, repeating each concentration 10 times. The process
lasted 12 months. All cell lines were maintained in Dulbecco’s
modified Eagle’s medium/high glucose (DMEM/HG) containing 10% fetal
calf serum without or with taxol, respectively. Cells were cultured
in a humidified incubator at 37°C with 5% carbon dioxide, 95%
humidity and passaged when cultures were 70–80% confluent.
In vitro cytotoxicity was measured using a
tetrazolium-based semi-automated colorimetric (MTT) assay, as
previously described (10,11). The absorbance values were normalized
assigning the value of the parent cell lines in the media without
the drug to 1.0 and the value of the no-cell control to 0.
Experiments were performed in duplicate. The half maximal
inhibitory concentration (IC50) value (the concentration
of drugs that produced a 50% reduction in absorbance) and the
relative resistance of treated cells were analyzed. The drug used
was taxol (6 mg/ml).
To identify the level of CFL1 and p-CFL1 in
chemosensitive and chemoresistant cell lines, cells were cultured
in DMEM/HG without FBS for 48 h to delete the effects of the
surrounding factors and were stimulated with 10 nM taxol for 0, 5,
10, 15, 30 and 60 min, respectively. The cells were then collected
immediately and total proteins were extracted.
Two-dimensional gel electrophoresis
(2-DE) and image analysis
Cells (5×10⁷) were lysed in urea-thiourea
buffer {2 M thiourea, 7 M urea, 4%
3-[(3-cholamidopropyl)-dimethy-lammonio]-1-propanesulfonate
(CHAPS), 1 mM EDTA, 65 mM dithiothreitol (DTT) (Sigma) and 0.1 g/l
RNase A, 0.1 g/l DNase I} containing complete protease inhibitor
cocktail (1:25; Roche Diagnostics, Mannheim, Germany) for 30 min on
ice and centrifuged at 13,000 rpm (Biofuge Fresco centrifuge;
Heraeus), at 4°C for 1 h (12). The
protein concentration was determined by the Bradford protocol using
a Bradford protein assay kit (Bio-Rad, Hercules, CA, USA). The
protein samples were stored at −80°C in aliquots until used. 2-DE
was performed as described in previous studies (13).
Separation in the first dimension was performed in a
PROTEAN isoelectric focusing (IEF) cell (Bio-Rad) with 1000 μg of
total protein, which was diluted with 350 μl rehydration solution
(8 M urea, 4% CHAPS, 20 mM DTT, 0.5% immobilized pH gradient buffer
and traces of bromophenol blue) on 18-cm ReadyStrip IPG strips (pH
3.0–10.0, NL; Amersham Biosciences, Little Chalfont, UK) according
to the manufacturer’s instructions with active rehydration and
final IEF at 10,000 V until 60,000 V•h. Following equilibration for
2×15 min with an equilibration solution [50 mM Tris-HCl (pH 8.8), 6
M urea, 30% w/v glycerol, 2% w/v SDS, 0.3% DTT and a trace of
bromophenol blue] containing DTT and 1.85% iodoacetamide
successively, the second-dimension separation was performed with
12% SDS-polyacrylamide gel (1 mm gel thick, 20.5-cm height) using
Protein II xi 2-D cell (Bio-Rad), with a constant current of 20
mA/gel for the initial 40 min and 30 mA/gel thereafter. Gels were
stained with colloidal Coomassie Brilliant Blue R-350 (Sigma) and
compared with ImageMaster 2D Platinum software (Amersham
Biosciences). Samples for each cell line were performed 3 times
before determining the final differential spots.
Matrix-assisted laser desorption
ionization-time-of-flight (MALDI-TOF)-mass spectrometric analysis
and database search
Spots of interest were excised manually and
destained with the destaining solution (15 mM potassium
ferricyanide, 50 mM sodium thiosulfate) and then in-gel digestion
was performed as previously described (13,14).
Samples were cleaved with 1:1 ratio by matrix
(α-cyano-4-hydroxycinnamic acid in 50% acetonitrile/0.1%
trifluoroacetic acid) and sample solution. Peptides were separated
by high-performance liquid chromatography and analyzed using Bruker
Reflex III MALDI-TOF mass spectrometer (Bruker Daltonics, Bremen,
Germany). For MALDI peptide mapping, Mascot search engines
(www.matrixscience.com) were employed for
searching Swiss-Prot (us.expasy.org) and NCBInr databases
(www.ncbi.nlm.nih.gov).
Western blot analysis
Protein extracts were prepared from exponentially
growing cells by Laemmli sample buffer. Protein concentrations were
determined by the Bio-Rad assay (all were from Bio-Rad). For
western blot analysis, 60 μg of protein from the total cell lysates
was fractionated by SDS-polyacrylamide gel electrophoresis
(SDS-PAGE). The proteins on these gels were then transferred onto
nitrocellulose membranes (Pierce Biotechnology, Inc., Rockford, IL,
USA), and the membranes were incubated with the indicated
antibodies. After treatment with blocking buffer without 5% non-fat
milk (washing buffer), a dilute solution (1:5,000) of horseradish
peroxidase-linked anti-rabbit goat serum (Cell Signaling
Technology, Inc., USA) was added. Membranes were then washed with
washing buffer and immune detection was performed using the
enhanced chemiluminescence (ECL) kit (Pierce Biotechnology, Inc.).
The following primary antibodies and dilutions were used:
anti-CFL1, 1:1,000 (Cytoskeleton, Inc., Denver, CO, USA); and
anti-p-CFL1, 1:2,000 (a kind gift from Dr James R. Bamburg).
Clinicopathological data
Forty-four patients with ovarian carcinomas were
involved in this study. The median age of the patients at diagnosis
was 52.6 years (ranging from 39–67 years). The patients involved in
this study met the following criteria. i) All patients had primary,
histologically proven epithelial ovarian carcinomas. ii) All
patients received primary treatment followed by 6–9 cycles of
standard chemotherapy, which consisted of taxol (175
mg/m2) combined with cisplatin (75 mg/m2) at
3-week intervals at the Department of Gynecology and Obstetrics of
the Peking Union Medical College Hospital between 2002 and 2005.
iii) The evaluation of response to chemotherapy was based on the
information available within an interval of 3–26 months following
the beginning of chemotherapy. Chemosensitive patients were defined
as demonstrating a complete response to chemotherapy, with a
platinum-free interval >6 months. Chemoresistant patients were
defined as demonstrating a complete response to chemotherapy,
following a platinum-free interval <6 months; best response to
chemotherapy was partial remission, a stable state or progressive
disease (15). All cases were
staged according to the criteria of the International Federation of
Gynecologists and Obstetricians (FIGO). The medical charts of all
patients were reviewed and information regarding age at diagnosis,
tumor stage, date and type of initial debulking surgery, residual
tumor size after initial surgery (defined as the diameter of the
largest individual nodule or plaque after initial surgery), date
and type of chemotherapy, number of cycles, date of
re-cytoreductive surgery, serum CA125 level and status at last
follow-up was recorded. Histological types included serous,
mucinous, endometrioid, Brenner and clear cell carcinomas. A
clinical data summary is presented in Table I. There was no significant
difference between chemosensitive and chemoresistant groups in age,
FIGO stage and histological subtype. All paraffin-embedded tissue
blocks were available for analysis from the primary tumor and/or
from the tumor obtained during re-cytoreductive surgery following
chemotherapy.
 | Table IDistribution of stage, grade,
histological subtypes and patient age in both chemosensitive and
taxol-resistant epithelial ovarian carcinoma cases. |
Table I
Distribution of stage, grade,
histological subtypes and patient age in both chemosensitive and
taxol-resistant epithelial ovarian carcinoma cases.
| Characteristics | Sensitive (n=22) n
(%) | Resistant (n=22) n
(%) | Total (n=44) n
(%) | P-value |
|---|
| Age (years) | | | | 1.000 |
| <60 | 18 (81.8) | 17 (77.3) | 35 (79.5) | |
| ≥60 | 4 (18.2) | 5 (22.7) | 9 (20.5) | |
| Histology | | | | 0.963 |
| Serous papillary
cystadenocarcinoma | 12 (54.5) | 13 (59.1) | 25 (56.8) | |
| Mucinous
cystadenoma | 2 (9.1) | 2 (9.1) | 4 (9.1) | |
| Endometriod
carcinoma | 5 (22.7) | 3 (13.6) | 8 (18.2) | |
| Transitional cell
carcinoma | 1 (4.5) | 2 (9.1) | 3 (6.8) | |
| Clear cell
carcinoma | 2 (9.1) | 2 (9.1) | 4 (9.1) | |
| Grade | | | | 1.000 |
| G ½ | 5 (22.7) | 4 (18.2) | 9 (20.5) | |
| G 3 | 17 (77.3) | 18 (81.8) | 35 (79.5) | |
| Stage | | | | 0.451 |
| II | 4 (18.2) | 6 (27.3) | 10 (22.7) | |
| III | 17 (77.3) | 13 (59.1) | 30 (68.2) | |
| IV | 1 (4.5) | 3 (13.6) | 4 (9.1) | |
| CA125 (U/ml) | | | | 0.380 |
| <35 | 0 | 4 (18.2) | 4 (9.1) | |
| >35 to
≤200 | 8 (36.4) | 7 (31.8) | 15 (34.1) | |
| >200 to
≤1,000 | 7 (31.8) | 5 (22.7) | 12 (27.3) | |
| >1,000 to
≤3,000 | 5 (22.7) | 4 (18.2) | 9 (20.5) | |
| >3,000 | 2 (9.1) | 2 (9.1) | 4 (9.1) | |
| Chemotherapy | | | | 0.728 |
| Paclitaxel +
DDP | 17 (77.3) | 16 (72.7) | 33 (75.0) | |
| DDP + CTX | 5 (22.7) | 6 (27.3) | 11 (25.0) | |
Immunohistochemistry (IHC)
techniques
Immunohistochemical studies were performed on
paraffin-embedded tumor specimens obtained at the time of initial
debulking or re-cytoreductive surgery, using the avidin-biotin
complex (ABC) method as previously described (16,17).
Briefly, tissue sections were deparaffinized in toluene, rehydrated
in graded alcohols and soaked for 5 min in 3% hydrogen peroxide to
block endogenous peroxidase. After being washed in
phosphate-buffered saline (PBS), the slides were incubated with
antibody. This was followed by a biotinylated secondary rabbit
antibody (Envision + R system) and the ABC complex (Dako,
Denmark).
Both positive and negative controls were used.
Normal kidney and brain were used as positive controls for CFL1 and
p-CFL1, respectively. Negative controls were obtained by replacing
primary antibodies with PBS.
The immunostaining was interpreted by a professional
pathologist without knowledge of the clinical course of the
disease. Two features of the immunoreactions were recorded using a
semi-quantitative scale: the relative number of positive cells (0,
<25, 25–50, >50–75 and >75%) and the intensity of the
reaction (−, +, ++, +++, ++++). The pattern of immunostaining
(membrane, cytoplasmic) was also recorded separately. The results
were interpreted as negative (0 and 1+) or
positive/overexpressed (2+/3+) according to
the scoring system as previously described (15).
Statistical analysis
Results are expressed as the means ± SD of more than
3 repeated experiments. Statistical analyses were carried out by
One-way ANOVA, Student’s t-test and Chi-square test. If necessary,
data were logarithmically converted into a normal distribution of
variables to remove heterogeneity of variance before analysis. The
Kolmogorov-Smirnov test and Mann-Whitney U test were used to
evaluate the association of immunostaining with taxol resistance.
The proportion of concordant pairs (P) along with its 95%
confidence interval were selected to compare the immunostaining in
the taxol-sensitive and -resistant groups. In all tests, P<0.05
was considered to indicate a statistically significant difference.
All statistical tests were performed using the SPSS software
(v.14.0).
Results
Characteristics of the taxol-resistant
cell lines
Taxol-resistant sublines were established from SKOV3
by episodic exposure to taxol over a period of 16 months. The
resultant taxol-resistant sublines were then maintained and
passaged in a drug-free medium. The stability of drug resistance
was examined at monthly intervals. IC50 and the
resistance index (RI) values of the 5 cell lines are shown in
Table II and Fig. 1. The resistant phenotype was
significantly stable as demonstrated by the IC50 and RI
values that had no significant change during a period of 4 months
(except SKOV3/TR2500 in 2 months) in a drug-free medium.
| Table IICytotoxicity of the two
taxol-sensitive and three taxol-resistant sublines. |
Table II
Cytotoxicity of the two
taxol-sensitive and three taxol-resistant sublines.
| Cell lines | IC50
(μM) | RI (resistant
index) |
|---|
| SKOV3 | 1.02±0.35 | 1 |
| SKOV3/TR2500 | 328.83±58.60 |
261.98±32.89b |
| SKOV3/TR30 | 757.46±80.85 |
622.76±71.37b |
| A2780 | 2.25±0.69 | 1 |
| A2780/TR | 21.72±3.14 | 8.96±2.01b |
Protein screening between the
taxol-sensitive and the taxol-resistant ovarian cancer cell lines
through 2-DE
To discover proteins which have differential
expression between the taxol-resistant clones and their parental
cell lines, proteomics technology was selected to reveal
differences in posttranslational modifications that may be relevant
to the protein function. Total cell extracts of the 2
taxol-sensitive cell lines (SKOV3, A2780) and the 3 taxol-resistant
cell lines (SKOV/TR2500, SKOV/TR30 and A2780/TR) were compared by
2-DE (Fig. 2A). Samples of each
cell line were assessed 3 times before determining the final
differential spots.
All 1,003 spots were detected on each gel by the
auto-detect spots analysis software and manual clean-up after
Coomassie Brilliant Blue R-350 staining. Approximately 95% of all
spots were matched on duplicate gels and the intensity of the
identical spot from different duplicate gels demonstrated no
significant change. All the maps showed great similarity between
the resistant sublines and their parental cell lines in which the
matching rate reached 90%. The matching rate ranged from 80 to 85%
between the 2 different parental cell lines, SKOV3 and A2780. In
the matched spots, a 2-fold or higher difference in spot intensity
was considered significant. The pI (isoelectric point) of the
differentially expressed spots mostly ranged between 5 and 9, and
the molecular weight was ~14–70 kDa (Tables III and IV). Resistance-dependent differences in
expression are highlighted with arrows (Fig. 2A).
| Table IIIUpregulated proteins in the 3
resistant sublines identified by MADI-TOF-MS. |
Table III
Upregulated proteins in the 3
resistant sublines identified by MADI-TOF-MS.
| Spot | Protein name | Theoretical NCBInr
IDa | Mr (Da)/pI | Peptides | Sequence
coverage | Scoreb | Biological
function | Cell lines |
|---|
|
|---|
| Match | Total |
|---|
| 69 | Cofilin 1 | gi|5031635 | 18491/8.26 | 7 | 12 | 51% | 132 | Cytoskeleton | SK/TR30
SK/TR2500
A2780/TR |
| 67 | Destrin | gi|5802966 | 18493/8.51 | 5 | 11 | 32% | 65 | Cytoskeleton | SK/TR30
SK/TR2500
A2780/TR |
| 01 | Villin2 | gi|21614499 | 69199/5.94 | 47 | 69 | 60% | 130 | Cytoskeleton | A2780/TR |
| 81 | T-complex protein
1, γ subunit (TCP-1) | gi|20455521 | 60364/6.46 | 31 | 43 | 49% | 196 | Cytoskeleton | A2780/TR |
| 28 | Heat shock protein
27 | gi|54696638 | 22768/5.98 | 15 | 57 | 73% | 148 | Chaperone | SK/TR30
SK/TR2500 |
| 27 | Prohibitin | gi|46360168 | 29802/5.57 | 14 | 46 | 67% | 140 | Chaperone | SK/TR30
SK/TR2500 |
| 79 | Lasp-1 | gi|5453710 | 29786/6.11 | 22 | 33 | 47% | 69 | Chaperone | A2780/TR |
| 26 | Proteasome subunit,
α type 1 | gi|30582133 | 29579/6.15 | 15 | 55 | 42% | 68 | Catalytic
proteins | SK/TR30
SK/TR2500 |
| 16 | ATP synthase D
chain mitochondrial, | gi|23273230 | 18348/5.22 | 10 | 17 | 72% | 130 | Catalytic
activity | SK/TR2500 |
| 71 | Superoxide
dismutase 2, mitochondrial (SOD2) | gi|10835187 | 24735/8.35 | 14 | 22 | 68% | 133 | Redox
regulation | SK/TR30
SK/TR2500 |
| 18 | Stathmin1 | gi|15680064 | 17292/5.76 | 9 | 14 | 51% | 101 | Signal
transduction | SK/TR2500 |
| 22 | Protein disulfide-
isomerase, ER60 precursor | gi|2245365 | 56748/5.91 | 24 | 49 | 53% | 140 | Metabolic
enzyme | SK/TR30 |
| Table IVDownregulated proteins in 3 resistant
sublines identified by MADI-TOF-MS. |
Table IV
Downregulated proteins in 3 resistant
sublines identified by MADI-TOF-MS.
| Spot | Protein name | NCBInr IDa | Theoretical Mr
(Da)/pI | Peptides | Sequence
coverage | Scoreb | Biological
function | Cell lines |
|---|
|
|---|
| Match | Total |
|---|
| 25 | Annexin III | gi|1421662 | 36222/5.63 | 20 | 36 | 57% | 157 | Protein
transportation | SK/TR30
SK/TR2500 |
| 12 | Annexin IV | gi|1703319 | 35729/5.85 | 21 | 38 | 58% | 86 | Protein
transportation | SK/TR30
SK/TR2500 |
| 9 | Annexin I | gi|404271 | 38559/6.64 | 23 | 34 | 63% | 199 | Protein
transportation | SK/TR30 |
| 55 | Peroxiredoxin
6 | gi|4758638 | 24888/6.02 | 14 | 20 | 52% | 131 | Redox
regulation | SK/TR30
SK/TR2500 |
Identification of candidate protein spots
through mass spectrometry
Twenty-two protein spots in all samples were
observed to be significantly different in spot intensity by
statistical analysis (P<0.05), 16 of which were identified by
matrix-assisted laser desorption ionization-time-of-flight-mass
spectrometry (MALDI-TOF-MS) analysis (Tables III and IV). Protein identification was repeated
at least once using spots from different gels in order to guarantee
reliability. The results showed that the matched spots from
different gels were the same protein. A total of 16 proteins were
found to be differentially expressed between SKOV3 compared to
SKOV3/TR2500, SKOV3 compared to SKOV3/TR30 and A2780 compared to
A2780/TR protein preparations. Twelve of the proteins were
upregulated and 4 were downregulated in the resistant sublines
(Tables III and IV), among which cofilin 1 (CFL1) and
destrin were the only 2 spots displaying differences in all 3
taxol-resistant cell lines compared with their parental cell lines
(Fig. 2B and Table III). The alteration of CFL1 was
the most marked with the upregulated range from 3- to 20-fold and
that of destrin was 2- to 10-fold in all of the differentially
expressed proteins. The score for protein matching by Mascot for
the CFL1 (spot no. 69) was much higher compared to destrin (spot
no. 67). These results suggest that CFL1 is a candidate protein
which may be correlated with taxol resistance in ovarian cancer
cell lines.
Upregulated CFL1 in taxol-resistant cell
lines is the phosphorylated form of CFL1
After CFL1 was detected through 2-DE and
MALDI-TOF-MS, CFL1 expression in all cell lines was validated
through western blot analysis. The result revealed that there was
no significant difference in the expression of CFL1 between the
taxol-resistant and taxol-sensitive cell lines (Fig. 3).
It is known that CFL1 may be phosphorylated at the
serine-3 residue, and this phosphorylated form is an active form
which leads to the inhibition of CFL1 as an actin depolymerization
factor (16). In addition,
dephosphorylated CFL1 and p-CFL1 have a similar molecular weight.
Since these forms may not be differentiated by SDS-PAGE, we
detected the level of p-CFL1 in vitro. The result showed
that the phosphorylated form was overexpressed in taxol-resistant
cells compared to the parental ones (P<0.01) (Fig. 3). These findings indicated that the
phosphorylated form of CFL1 was upregulated in taxol-resistant
cells but not the total CFL1 in vitro.
Considering that taxol-resistant cell lines were
induced in vitro during at least 12 months and surrounding
factors may influence the level of CFL1, especially p-CFL1, we
detected the levels of p-CFL1 and CFL1 in chemoresistant and
chemosensitive cell lines (SKOV3 and SKOV3/TR2500, A2780 and
A2780/TR) after being cultured in DMEM/HG without FBS for 48 h to
deplete the effects of the environmental factors (such as FBS).
p-CFL1 in taxol-resistant cells remained at a high level while it
decreased in taxol-sensitive cells (P<0.05). When
taxol-resistant cell lines were stimulated by taxol, the
concentrations of p-CFL1 and CFL1 remained stable and did not
display time dependence in our experimental conditions. In
taxol-sensitive cell lines, the level of p-CFL1 increased and CFL1
was unchanged; β-actin was chosen as a reference (Fig. 4). From the above mentioned results,
we conclude that p-CFL1 is associated with the drug resistance of
taxol in ovarian cancer cell lines, and the surrounding factors did
not influence the high level of p-CFL1 in taxol-resistant cells.
The higher expression of p-CFL1 may be considered a characteristic
of taxol-resistant cells.
Validation of overexpression of p-CFL1 in
chemoresistant ovarian cancer tissues by immunostaining
We identified that p-CFL1 was correlated with
ovarian cancer cell resistant to taxol in vitro.
Furthermore, we also detected the expression levels of CFL1 and
p-CFL1 in primary human ovarian cancer tissues.
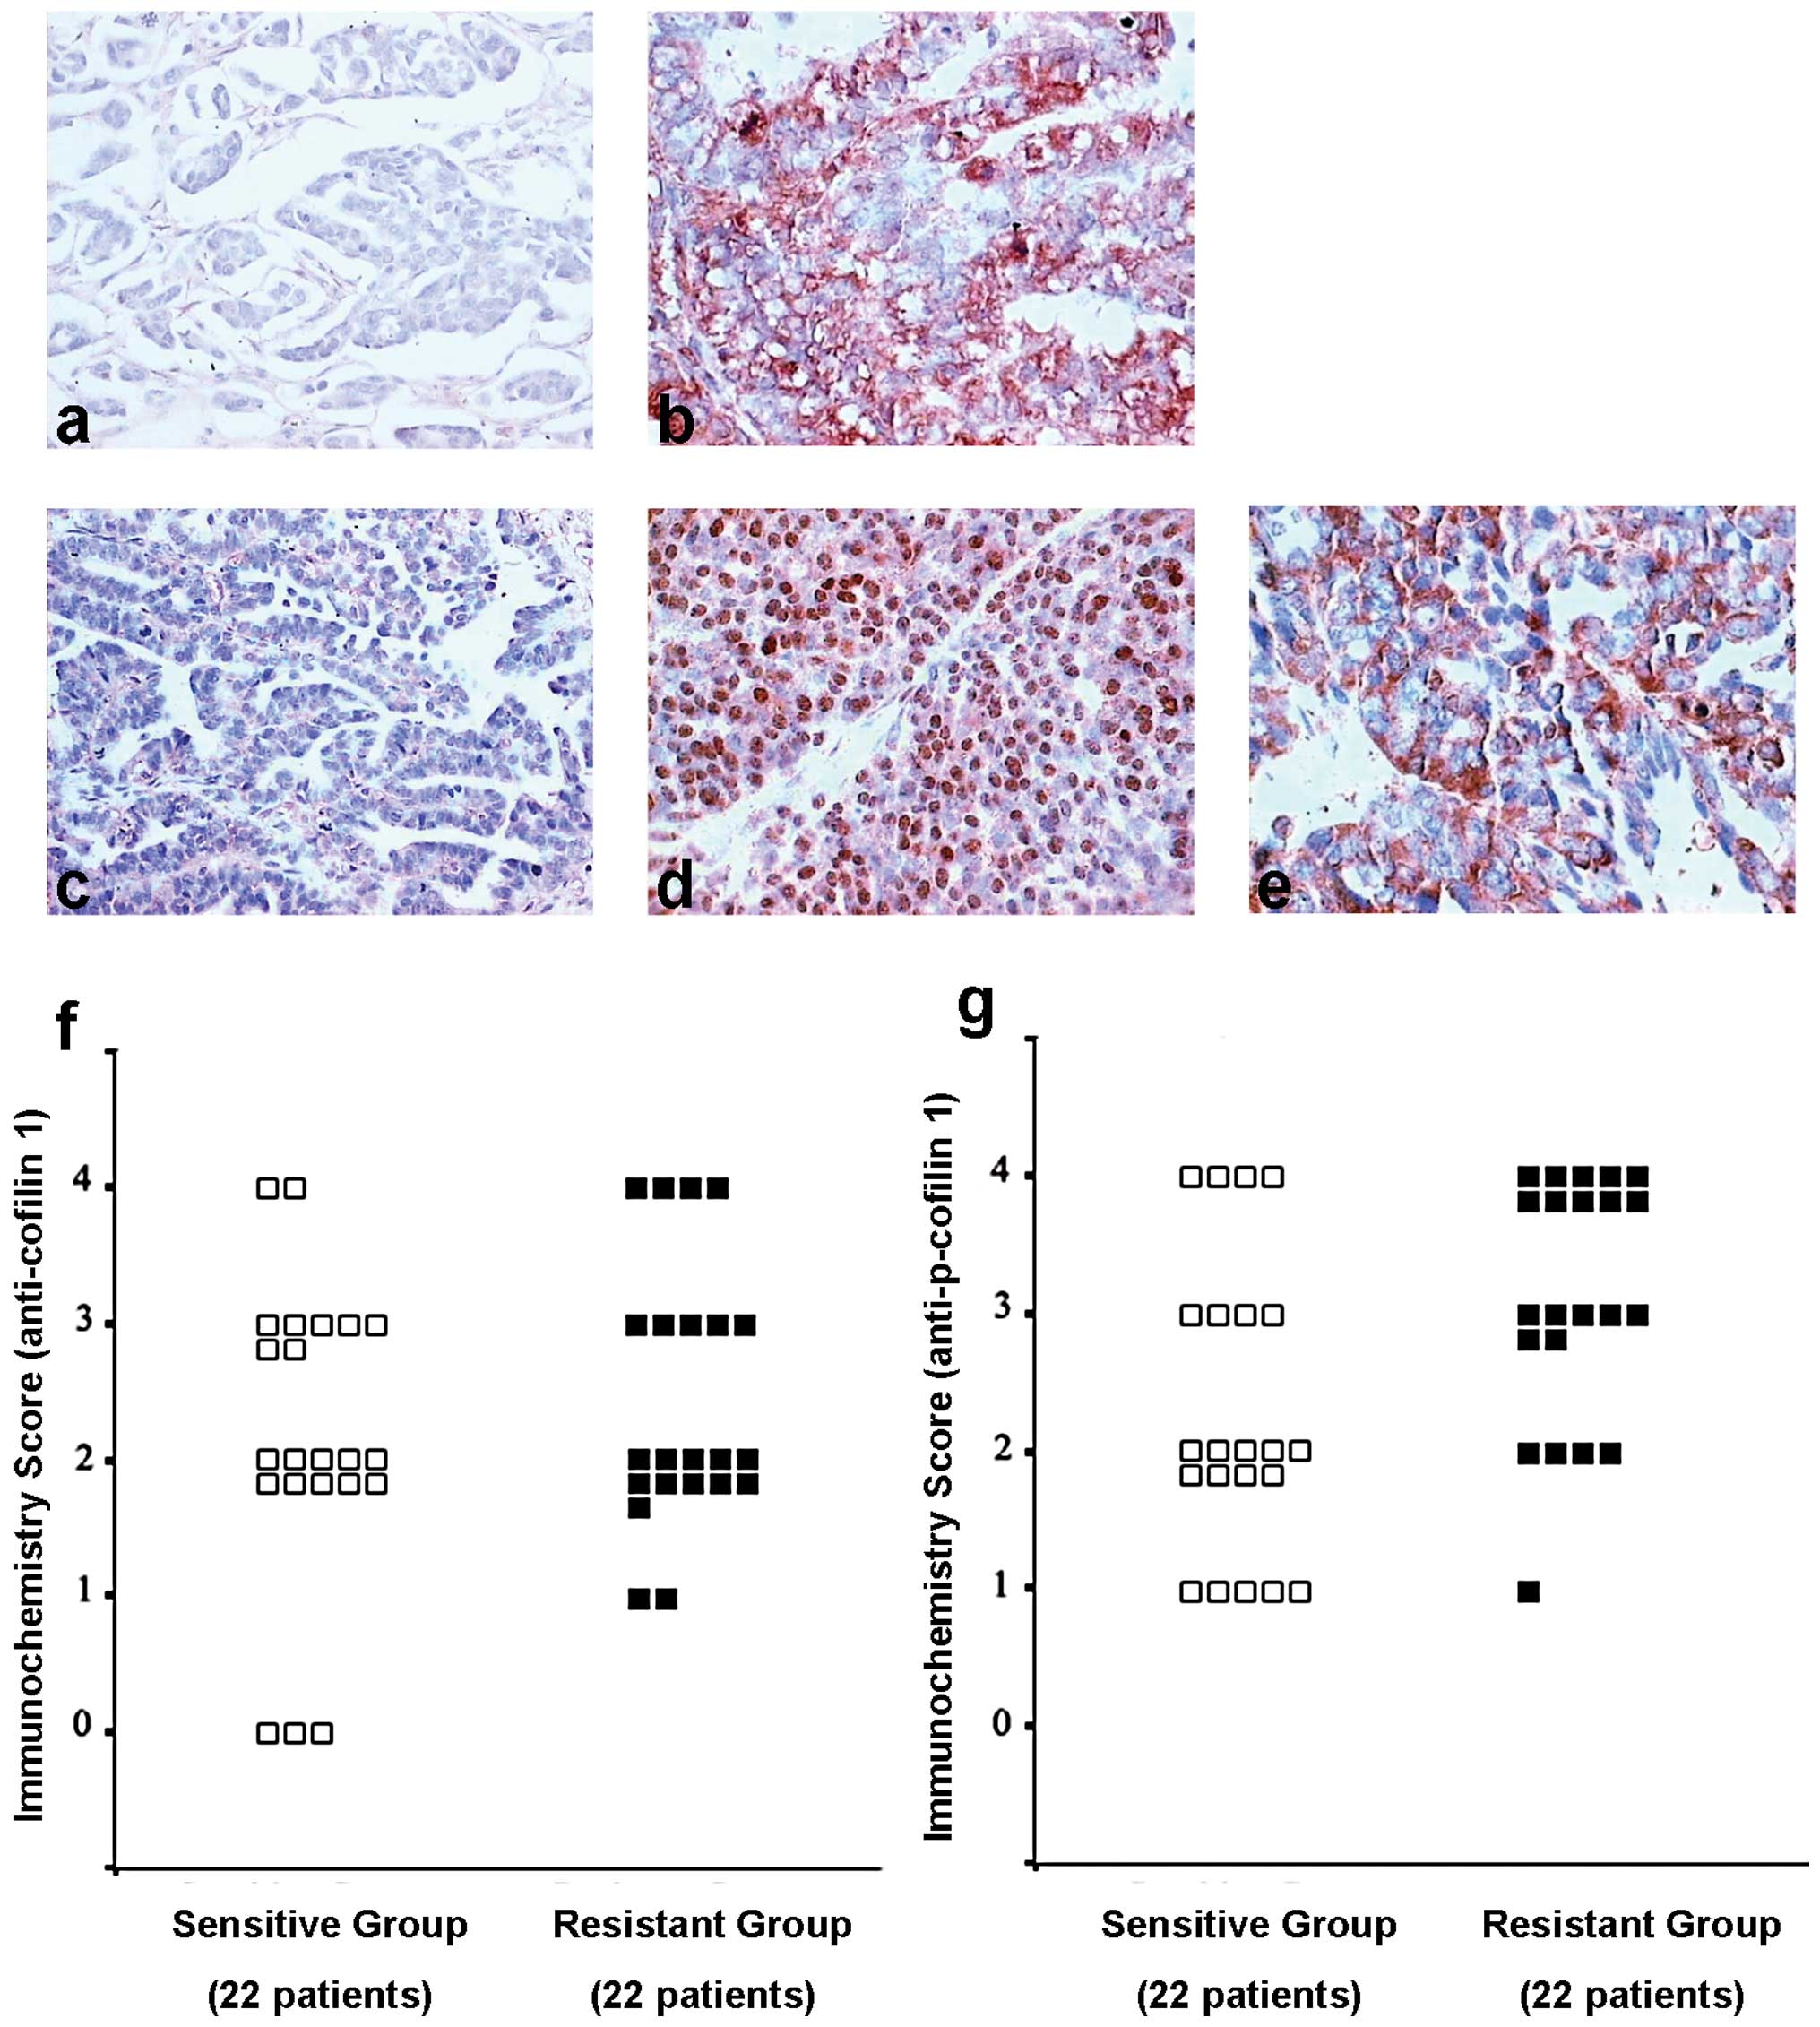
Immunostaining of CFL1 was positive in 86.4% (19/22)
of the chemosensitive and 90.9% (20/22) of the chemoresistant
ovarian carcinomas, but this was not statistically significant
(P=0.991, U=263.6) (Fig. 5a, b and
f). However, immunostaining of p-CFL1 was positive in 77.3%
(17/22) of chemosensitive and in 95.9% (21/22) of the
chemoresistant ovarian carcinomas, which was statistically
significant (P=0.014<0.05, U=157.5) (Fig. 5c-e and g). These results indicated
that p-CFL1 in taxol-resistant ovarian cancer tissues was
overexpressed in vivo and in vitro.
Discussion
The goal of this study was to detect proteins which
may be correlated with chemoresistance to taxol in ovarian cancer,
which may assist us in the early diagnosis of taxol chemoresistance
in clinical treatment. Although the results of the experiments with
cells in culture may not always mirror the situation in human
tumors in vivo, we employed 2 schemes for assessing toxicity
using one cell line (SKOV3), together with other taxol-sensitive
and -resistant cell lines (A2780 and A2780/TR) and proteomic
analysis to report markers of taxol resistance.
2-DE analysis comparing the taxol-resistant with the
sensitive cell lines yielded several differentially expressed
proteins. Twelve proteins were identified by mass spectrometry to
have upregulated expression: CFL1, destrin, villin2, TCP-1, hsp27,
prohibitin, lasp-1, proteasome subunit-α type, SOD2, stathmin 1,
and ER60 precursor, and 4 proteins were downregulated: Annexin 3,
Annexin 4, Annexin 1 and peroxiredoxin 6. Approximately half of the
differentially expressed proteins identified in this study are
related to the organization or activity of the actin cytoskeleton,
which may explain the failure of strategies based on changes in the
expression of P-glycoprotein and tubulin in clinical treatment.
Although alterations of actin associated with drug resistance have
been reported, hsp27 and stathmin were also confirmed to be
relevant to drug resistance in previous studies (18–21).
Unfortunately, their high expression was not observed in these
resistant cell lines. Only 2 protein spots, CFL1 and destrin, were
upregulated in all 3 taxol-resistant cell lines, which were
unexpected candidates for drug resistance. CFL1 and destrin are
both actin-depolymerizing proteins and are involved in the
organization of the cytoskeleton. A number of authors have reported
CFL1 and destrin differential expression in cancer cells (13,22–25).
To the best of our knowledge, we report for the first time their
function related with drug resistance in ovarian cancer. Since the
score of CFL1 (spot no. 69) for protein matching by Mascot was much
higher than destrin (spot no. 67), as well as destrin and CFL1
sharing ~70% identical sequence of DNA (26–27),
the study was focused on CFL1. However, the results of the western
blot analysis showed that the expression levels of CFL1 in all cell
lines were similar. It is known that CFL1 has phosphorylated and
dephosphorylated forms, and these forms may be differentiated from
each other by their different isoelectric points (27). Based on the above-mentioned fact, we
detected the level of p-CFL1 and found a high level of p-CFL1 in
the taxol-resistant cell lines. As a result, the differential
protein spot in 2-D gel was possibly p-CFL1 not CFL1.
CFL1 is one of the major proteins responsible for
cell migration processes, playing a key role in actin filament
dynamics and apoptosis induced by oxidants (28–30).
Bernstein and Bamburg suggest that CFL1 plays a major role in cell
biology, and that any interference with its normal activity is
likely to have severe repercussions (29). The spontaneous overexpression of
CFL1 may be detected in invasive sub-populations of breast tumor
cells in rats, as well as in biopsies of oral, renal, non-small
cell lung cancer (NSCLC) and ovarian carcinoma. High CFL1 levels
are correlated with lower overall survival rates and resistance to
several alkylating drugs in NSCLC patients (13,23–25).
The overexpression of CFL was also detected in cisplatin-resistant
cells (13). However, there are no
reports demonstrating what role CFL plays in drug resistance. Our
research suggests that the phosphorylation of CFL1 was involved in
taxol-resistance. In our study, CFL1 was selected through proteomic
analysis and we investigated its relationship with taxol
resistance. After in vitro and in vivo identification
of the results of 2-DE, we found that the level of CFL1 did not
increase whereas p-CFL1 increased significantly. CFL1 has been
known to promote actin depolymerization and filament severing.
Several experiments suggested that this feature of CFL1 was
involved in its inhibitory action. Both its actin depolymerization
activity and its inhibitory action on the receptor were dependent
on its phosphorylation state (31).
A strong differential expression of p-CFL1 between taxol-sensitive
and -resistant cell lines in the proteomic analysis suggested that
an alteration in the cellular levels of p-CFL1 may be associated
with drug resistance. Considering that the chemoresistant cells
were induced in vitro for approximately 1 year, we removed
the effects of the surrounding factors as far as possible and
identified that the level of p-CFL1 in taxol-resistant cells was
not effected by the surrounding factors (such as FBS). We also
discovered that p-CFL1 could stably exist at high levels in
taxol-resistant cells which may be used as a marker of
taxol-resistant cells. Fortunately in the clinical sample, similar
results were obtained. Thus, we speculated that high levels of
p-CFL1 expression may be associated with epithelial ovarian cancer
cell resistance to chemotherapy in vitro.
A number of researchers (31) have identified that the activity of
CFL1 is reversibly regulated by phosphorylation and
dephosphorylation, with the dephosphorylated form being inactive.
Based on our results, we suggested that CFL1 functions in
chemoresistance and yet must first pass through the process of
phosphorylation. LIM-kinase (LIMK) and TES-kinase are possibly
responsible for this site phosphorylation and thereby inactivate
CFL1 (31,32). It is necessary to fully elucidate
the pathways by which the dephosphorylated CFL1 or p-CFL1 affect
drug resistance.
In conclusion, our study indicates the potency of a
proteomic approach to study drug resistance in cancer cells. These
findings support that p-CFL1 may be an important regulator in the
development of taxol resistance. Clearly, a greater number of
investigations are required to elucidate how the protein acts in
the taxol activity pathway that may induce taxol resistance in
epithelial ovarian cancer cells. Its distinct function in the
regulation of taxol resistance encourages us to pursue the use of
marker proteins as a clinical utility for early detection of drug
resistance and for preventing a poor prognosis.
Acknowledgements
We thank Dr James R. Bamburg (University of
California, San Francisco, USA) for the kind gift of anti-p-CFL1,
Dr Theo Rein (Max Planck Institute for Psychiatry, Munich, Germany)
for the kind gift of plasmid pRK5cof, Dr Sutherland K. Maciver
(University of Edinburgh, Scotland, UK) for the kind gift of
pCFL-EGFP and Dr Xuemin Zhang and colleagues (Institute of Basic
Medical Sciences, National Center of Biomedical Analysis, Beijing,
China) for the proteomic technical assistance. We again thank Dr
James R. Bamburg and Dr Sutherland K. Maciver for critical comments
regarding the manuscript and helpful discussions. This study was
supported by the Key Research Foundation of Peking Union Medical
College Hospital (200203*).
References
|
1
|
Cicchillitti L, Della Corte A, Di Michele
M, Donati MB, Rotilio D and Scambia G: Characterisation of a
multimeric protein complex associated with ERp57 within the nucleus
in paclitaxel-sensitive and -resistant epithelial ovarian cancer
cells: The involvement of specific conformational states of
β-actin. Int J Oncol. 37:445–454. 2010.PubMed/NCBI
|
|
2
|
Bovicelli A, D’Andrilli G and Giordano A:
New players in ovarian cancer. J Cell Physiol. 226:2500–2504. 2011.
View Article : Google Scholar : PubMed/NCBI
|
|
3
|
Kurman RJ and Shih IeM: The origin and
pathogenesis of epithelial ovarian cancer: a proposed unifying
theory. Am J Surg Pathol. 34:433–443. 2010. View Article : Google Scholar : PubMed/NCBI
|
|
4
|
Kim A, Ueda Y, Naka T and Enomoto T:
Therapeutic strategies in epithelial ovarian cancer. J Exp Clin
Cancer Res. 31:142012. View Article : Google Scholar : PubMed/NCBI
|
|
5
|
Rein DT, Volkmer A, Bauerschmitz G, et al:
Combination of a MDR1-targeted replicative adenovirus and
chemotherapy for the therapy of pretreated ovarian cancer. J Cancer
Res Clin Oncol. 138:603–610. 2012. View Article : Google Scholar : PubMed/NCBI
|
|
6
|
Kavallaris M: Microtubules and resistance
to tubulin-binding agents. Nat Rev Cancer. 10:194–204. 2010.
View Article : Google Scholar : PubMed/NCBI
|
|
7
|
Umezu T, Shibata K, Kajiyama H, et al:
Taxol resistance among the different histological subtypes of
ovarian cancer may be associated with the expression of class III
beta-tubulin. Int J Gynecol Pathol. 27:207–212. 2008.PubMed/NCBI
|
|
8
|
Wang Y, Chen Q, Jin S, et al:
Up-regulation of P-glycoprotein is involved in the increased
paclitaxel resistance in human esophageal cancer radioresistant
cells. Scand J Gastroenterol. 47:802–808. 2012. View Article : Google Scholar : PubMed/NCBI
|
|
9
|
Yan XD, Li M, Yuan Y, Mao N and Pan LY:
Biological comparison of ovarian cancer resistant cell lines to
cisplatin and Taxol by two different administrations. Oncol Rep.
17:1163–1169. 2007.PubMed/NCBI
|
|
10
|
Carmichael J, DeGraff WG, Gazdar AF, Minna
JD and Mitchell JB: Evaluation of a tetrazolium-based semiautomated
colorimetric assay: assessment of chemosensitivity testing. Cancer
Res. 47:936–942. 1987.PubMed/NCBI
|
|
11
|
Preusser M, Spiegl-Kreinecker S, Lötsch D,
et al: Trabectedin has promising antineoplastic activity in
high-grade meningioma. Cancer. March 5–2012.(Epub ahead of print).
View Article : Google Scholar
|
|
12
|
Gorg A, Obermaier C, Boguth G, et al: The
current state of two-dimensional electrophoresis with immobilized
pH gradients. Electrophoresis. 21:1037–1053. 2000. View Article : Google Scholar : PubMed/NCBI
|
|
13
|
Yan XD, Pan LY, Yuan Y, Lang JH and Mao N:
Identification of platinum-resistance associated proteins through
proteomic analysis of human ovarian cancer cells and their
platinum-resistant sublines. J Proteome Res. 6:772–780. 2007.
View Article : Google Scholar
|
|
14
|
Joubert-Caron R, Le Caer JP, Montandon F,
et al: Protein analysis by mass spectrometry and sequence database
searching: a proteomic approach to identify human lymphoblastoid
cell line proteins. Electrophoresis. 21:2566–2575. 2000. View Article : Google Scholar : PubMed/NCBI
|
|
15
|
Swenerton K, Muss H and Robinson E:
Salvage Chemotherapy for Refractory Disease. Ovarian Cancer
Controversies on Management. Gershenson DM and McGuire WP:
Churchill Livingstone; New York: pp. 169–194. 1998
|
|
16
|
Hsu SM, Raine L and Fanger H: Use of
avidin-biotin-peroxidase complex (ABC) in immunoperoxidase
techniques: a comparison between ABC and unlabeled antibody (PAP)
procedures. J Histochem Cytochem. 29:577–580. 1981. View Article : Google Scholar : PubMed/NCBI
|
|
17
|
Beamer LC, Grant ML, Espenschied CR, et
al: Reflex immunohistochemistry and microsatellite instability
testing of colorectal tumors for Lynch syndrome among US cancer
programs and follow-up of abnormal results. J Clin Oncol.
30:1058–1063. 2012. View Article : Google Scholar
|
|
18
|
Tanaka Y, Fujiwara K, Tanaka H, Maehata K
and Kohno I: Paclitaxel inhibits expression of heat shock protein
27 in ovarian and uterine cancer cells. Int J Gynecol Cancer.
14:616–620. 2004. View Article : Google Scholar : PubMed/NCBI
|
|
19
|
Alli E, Yang JM, Ford JM and Hait WN:
Reversal of stathmin-mediated resistance to paclitaxel and
vinblastine in human breast carcinoma cells. Mol Pharmacol.
71:1233–1240. 2007. View Article : Google Scholar : PubMed/NCBI
|
|
20
|
Song TF, Zhang ZF, Liu L, Yang T, Jiang J
and Li P: Small interfering RNA-mediated silencing of heat shock
protein 27 (HSP27) Increases chemosensitivity to paclitaxel by
increasing production of reactive oxygen species in human ovarian
cancer cells (HO8910). J Int Med Res. 37:1375–1388. 2009.
View Article : Google Scholar
|
|
21
|
Balasubramani M, Nakao C, Uechi GT, et al:
Characterization and detection of cellular and proteomic
alterations in stable stathmin-overexpressing, taxol-resistant
BT549 breast cancer cells using offgel IEF/PAGE difference gel
electrophoresis. Mutat Res. 722:154–164. 2011. View Article : Google Scholar
|
|
22
|
Estornes Y, Gay F, Gevrey JC, et al:
Differential involvement of destrin and cofilin-1 in the control of
invasive properties of Isreco1 human colon cancer cells. Int J
Cancer. 121:2162–2171. 2007. View Article : Google Scholar : PubMed/NCBI
|
|
23
|
Castro MA, Dal-Pizzol F, Zdanov S, et al:
CFL1 expression levels as a prognostic and drug resistance marker
in nonsmall cell lung cancer. Cancer. 116:3645–3655. 2010.
View Article : Google Scholar : PubMed/NCBI
|
|
24
|
Muller CB, de Barros RL, Castro MA, et al:
Validation of cofilin-1 as a biomarker in non-small cell lung
cancer: application of quantitative method in a retrospective
cohort. J Cancer Res Clin Oncol. 137:1309–1316. 2011. View Article : Google Scholar : PubMed/NCBI
|
|
25
|
Nishimura S, Tsuda H, Kataoka F, et al:
Overexpression of cofilin 1 can predict progression-free survival
in patients with epithelial ovarian cancer receiving standard
therapy. Hum Pathol. 42:516–521. 2011. View Article : Google Scholar : PubMed/NCBI
|
|
26
|
Vartiainen MK, Mustonen T, Mattila PK, et
al: The three mouse actin-depolymerizing factor/cofilins evolved to
fulfill cell-type-specific requirements for actin dynamics. Mol
Biol Cell. 13:183–194. 2002. View Article : Google Scholar : PubMed/NCBI
|
|
27
|
Dai YP, Bongalon S, Mutafova-Yambolieva VN
and Yamboliev IA: Distinct effects of contraction agonists on the
phosphorylation state of cofilin in pulmonary artery smooth muscle.
Adv Pharmacol Sci. 2008:3627412008.PubMed/NCBI
|
|
28
|
Klamt F, Zdanov S, Levine RL, et al:
Oxidant-induced apoptosis is mediated by oxidation of the
actin-regulatory protein cofilin. Nat Cell Biol. 11:1241–1246.
2009. View
Article : Google Scholar : PubMed/NCBI
|
|
29
|
Bernstein BW and Bamburg JR: ADF/cofilin:
a functional node in cell biology. Trends Cell Biol. 20:187–195.
2010. View Article : Google Scholar : PubMed/NCBI
|
|
30
|
Teng B, Lukasz A and Schiffer M: The
ADF/cofilin-pathway and actin dynamics in podocyte injury. Int J
Cell Biol. 2012:3205312012. View Article : Google Scholar : PubMed/NCBI
|
|
31
|
Ruegg J, Holsboer F, Turck C and Rein T:
Cofilin 1 is revealed as an inhibitor of glucocorticoid receptor by
analysis of hormone-resistant cells. Mol Cell Biol. 24:9371–9382.
2004. View Article : Google Scholar : PubMed/NCBI
|
|
32
|
Scott RW, Hooper S, Crighton D, et al: LIM
kinases are required for invasive path generation by tumor and
tumor-associated stromal cells. J Cell Biol. 191:169–185. 2010.
View Article : Google Scholar : PubMed/NCBI
|