Introduction
Thymidylate synthase (TS) is an enzyme that plays an
important role in the DNA synthesis and catalyzes the methylation
of deoxyuridine monophosphate (dUMP) to deoxythymidine
monophosphate (dTMP) (1,2). TS is also a target enzyme of
5-fluorouracil (5-FU), which is an anticancer chemotherapeutic
agent for various human cancers (3). The anticancer activity of 5-FU has
been described to be closely associated with the intratumoral
expression of TS, orotate phosphoribosyltransferase (OPRT) and
dihydropyrimidine dehydrogenase (DPD) (4). TS expression has been described to be
significantly correlated with proliferative activity and poor
prognosis in patients with various thoracic neoplasms such as
non-small cell lung cancer (NSCLC) (5,6) and
thymic epithelial tumors (7).
Moreover, TS expression had been described to be significantly
associated with chemotherapeutic outcome in patients with NSCLC,
malignant pleural mesothelioma (MPM) and pulmonary metastatic tumor
(PMT) from colorectal cancer (8–12).
These studies suggest that the overexpression of TS is closely
related to aggressive features and chemotherapeutic response of
various thoracic neoplasms.
S-1 is an oral anticancer agent comprised of tegafur
(FT), 5-chloro-2, 4-dihydroxypyridine (CDHP), and potassium oxonate
(Oxo), in a molar ratio of 1:0.4:1 (13). S-1 is a potent inhibitor of
DPD-inhibitory fluoropyrimidine (DIF), and is effective against
patients with lung, colon and gastric cancers (4,14).
Pemetrexed inhibits multiple enzymes in the folate metabolic
pathway, and TS is the main target (15). In vitro study using NSCLC
cell lines demonstrated that high expression level of TS
gene at baseline conferred resistance to pemetrexed and TS levels
were correlated with pemetrexed efficacy in a variety of solid
tumors (16–18). Moreover, recent clinical studies
have described that a high expression level of TS could be a
possible biomarker for predicting poor outcome after TS-inhibitor
treatment such as S-1 or pemetrexed in NSCLC or MPM (8–11). The
results of these studies indicated that TS expression could be a
chemoresistance protein for TS targeting therapy. However, as it is
difficult to obtain an adequate specimen for immunohistochemical
analysis in patients with advanced thoracic neoplasms, in selected
patients, therefore, the expression of TS protein is evaluated by
immunohistochemical staining.
Recently, the usefulness of
2-[18F]-fluoro-2-deoxy-D-glucose (18F-FDG)
positron emission tomography (PET) for the diagnosis of thoracic
neoplasms has been investigated (19–25).
The previous studies demonstrated that the primary tumor
standardized uptake value (SUV) measurement on 18F-FDG
PET is a useful marker for predicting outcome after treatment in
patients with thoracic neoplasms (19–25).
Even if an adequate specimen is not obtained, we can clearly image
18F-FDG uptake within the primary tumor. The amount of
18F-FDG uptake within tumor cells is determined by the
glucose metabolism, hypoxia and angiogenesis 18F-FDG
uptake is strongly associated with the expression of glucose
transporter 1 (Glut1) (24). Glut1
is thought to be a possible intrinsic marker of hypoxia, and the
expression of Glut1 has been found to be regulated by hypoxia in
hypoxia-inducible factor-1α (HIF-1α). Atkin et al(25) have documented that the direct
correlation between TS expression and HIF-1α expression was
recognized in primary rectal cancers, and the microenviromental
factor such as acidosis or alternations in the availability of
glucose and other enzymatic substrates, are more active in human
cancers, thereby affecting the level of TS or HIF-1α expression.
Recent immunohistochemical data demonstrated that TS expression was
significantly correlated with Glut1, HIF-1α and angiogenesis in
patients with primary lung cancer (6). However, it remains unclear whether the
patients with various thoracic neoplasms have a significant
relationship between 18F-FDG uptake on PET and TS
protein expression.
Based on the above background, we investigated the
relationship between 18F-FDG uptake on PET and TS
expression in patients with various thoracic neoplasms. Moreover,
correlation of TS expression was determined with OPRT, DPD,
vascular endothelial growth factor (VEGF), microvessel density
(MVD), CD34 and p53.
Materials and methods
Patients
Between April, 2003 and May, 2009, we analyzed 148
consecutive patients with PMT treated by lung resection for
pulmonary metastasis from extrathoracic malignancies, 21
consecutive patients, 34 consecutive patients with pulmonary
neuroendocrine (NE) tumors treated by curative resection, and 49
consecutive patients with thymic epithelial tumors who underwent
18F-FDG PET at Shizuoka Cancer Center (Shizuoka, Japan).
In 148 patients with PMT [adenocarcinoma (AC) with 106, squamous
cell carcinoma (SQC) with 15, sarcoma with 20 and other with 8],
the primary site was colon in 80 patients, breast in 9, head and
neck in 14, genital system in 12, esophagus in 3, gastrointestinal
tract in 7, soft tissue and bone in 20 and other sites in 3. In 21
patients with MPM, 16 patients had a histology of epithelial type,
2 biphasic type, 1 sarcomatous type, and 2 unspecific type. In 34
patients with pulmonary NE tumors, the pathological diagnoses were:
typical carcinoid (n=5), atypical carcinoid (n=1), small-cell lung
carcinoma (SCLC) (n=12) and large cell neuroendocrine carcinoma
(LCNEC) (n=16). High-grade NE tumor was SCLC and LCNEC. In 49
patients with thymic epithelial tumors, there was 38 patients with
thymoma and 11 patients with thymic carcinoma.
NSCLC patients were consecutively assigned to the
study between December, 2002 and March, 2004, and
18F-FDG PET was performed as part of the preoperative
work-up. These patients underwent surgical management, and the
primary lesions were resected. Finally, 140 patients with NSCLC (95
with AC, 43 with SQC and 2 with large cell carcinoma) were
evaluated.
Of the total 392 patients, 231 patients were male
and 161 female. The age of the patients ranged from 16 to 89 years,
and the median age was 62 years. None of the patients had
insulin-dependent diabetes, and the serum glucose levels in all
patients just before 18F-FDG PET study was less than 120
mg/dl. The authors’ approach to the evaluation and resection of
these tumors has been described previously (6,7,12,23,24,26–28).
The study protocol was approved by the Institutional Review
Board.
Immunohistochemical staining
Immunohistochemical staining was performed according
to the procedure described in the previous studies (7,24). The
following antibodies were used: a rabbit polyclonal antibody
against TS (clone RTSSA, 1:1,600 dilution; Taiho Pharmaceutical,
Co., Ltd., Saitama, Japan); a rabbit polyclonal antibody against
OPRT (1:1,200 dilution; Taiho Pharmaceutical, Co., Ltd.); a rabbit
polyclonal antibody against DPD (clone RDPDPA, 1:500 dilution;
Taiho Pharmaceutical, Co., Ltd.); a monoclonal antibody against
VEGF (1:200 dilution; Immuno-Biological Laboratories Co., Ltd.,
Fujioka, Japan); a mouse monoclonal antibody against CD34 (1:800
dilution; Nichirei, Tokyo, Japan); a mouse monoclonal antibody
against p53 (D07, 1:50 dilution; Dako). Antibodies against TS, OPRT
and DPD were kindly donated by Taiho Pharmaceutical, Co., Ltd.
(Tokyo, Japan).
The expression of TS, OPRT and DPD was considered if
nuclear or cytoplasmic staining was present. For TS, OPRT and DPD,
a semi-quantitative scoring method was used: 1, <10%; 2, 10–25%;
3, 25–50%; 4, 51–75% and 5, >75% of cells stained positively.
The tumors in which stained tumor cells made up more than 25% of
the tumor were graded as positive.
The expression of VEGF was quantitatively assessed
according to the percentage of immunoreactive cells in a total of
1,000 neoplastic cells. The number of CD34-positive vessels was
counted in four selected hot spots in a 0.26 mm2 field
area. MVD was defined as the mean count of microvessels per 0.26
mm2 field area.
For p53, microscopic examination for the nuclear
reaction product was performed and scored. According to a previous
study (24), p53 expression in more
than 10% of tumor cells was defined as high expression. Sections
were assessed using a light microscope in a blinded fashion by at
least two of the authors.
18F-FDG PET imaging
Patients fasted for at least 4 h before
18F-FDG PET examination. Patients received an
intravenous injection of 200–250 MBq of 18F-FDG and then
rested for approximately 1 h before undergoing imaging (24). Image acquisition was performed using
an Advance NXi PET scanner and Discovery PET-CT scanner (GE Medical
Systems, Milwaukee, WI, USA). Two-dimensional emission scanning was
performed from the groin to the top of the skull. PET/CT image was
independently reviewed by two experienced physicians. Acquired data
were reconstructed by iterative ordered subset expectation
maximization. To evaluate 18F-FDG accumulation, the
tumor was first examined visually, and then the peak standardized
uptake value (SUV) of the entire tumor was determined.
SUVmax was defined as the peak SUV value on one pixel
with the highest counts within the region of interest (ROI). The
ROI, measuring 3 cm in diameter, was set at the mediastinum at the
level of the aortic arch and the mean SUV of the mediastinum was
calculated.
Statistical analysis
Probability values of <0.05 indicated a
statistically significant difference. Fisher’s exact test was used
to examine the association of two categorical variables.
Correlation of different variables was analyzed using the
nonparametric Spearman’s rank test. Statistical analysis was
performed using JMP 8 (SAS Institute Inc., Cary, NC, USA) for
Windows.
Results
Immunohistochemical staining and
SUVmax by 18F-FDG uptake
Each protein revealed a profile pattern of the
unique expression. The immunohistochemical staining was evaluated
for the 392 thoracic tumor lesions. The mean scoring (mean ± SD) of
TS, OPRT and DPD was 2.54±1.00, 2.53±1.15 and 2.37±1.21,
respectively. A positive expression of TS, OPRT and DPD was
recognized in 58 (230/392), 46 (179/392) and 55% (217/392),
respectively. The staining pattern of VEGF was uniformly localized
in the cytoplasm and/or membrane of neoplastic tissue. The median
rate of VEGF positivity was 25% (range, 1–88%), and the value of
25% was chosen as a cutoff point. Positive expression was
recognized in 53% of cases (208/392). The median number of
CD34-positive vessels was 24 (2–68), and the value of cutoff point
was 24. Positive expression of CD34 was seen in 50% of cases
(196/392). Positive expression of p53 was recognized in 46% of
cases (180/392).
The SUVmax of the primary tumors in 392
patients ranged from 0.8 to 31.9 (median, 5.2). A median value of
5.2 was used as the cutoff SUV in the following analyses, and the
SUVmax in more than 5.2 was defined as positive
expression. Positive expression of SUVmax was seen in
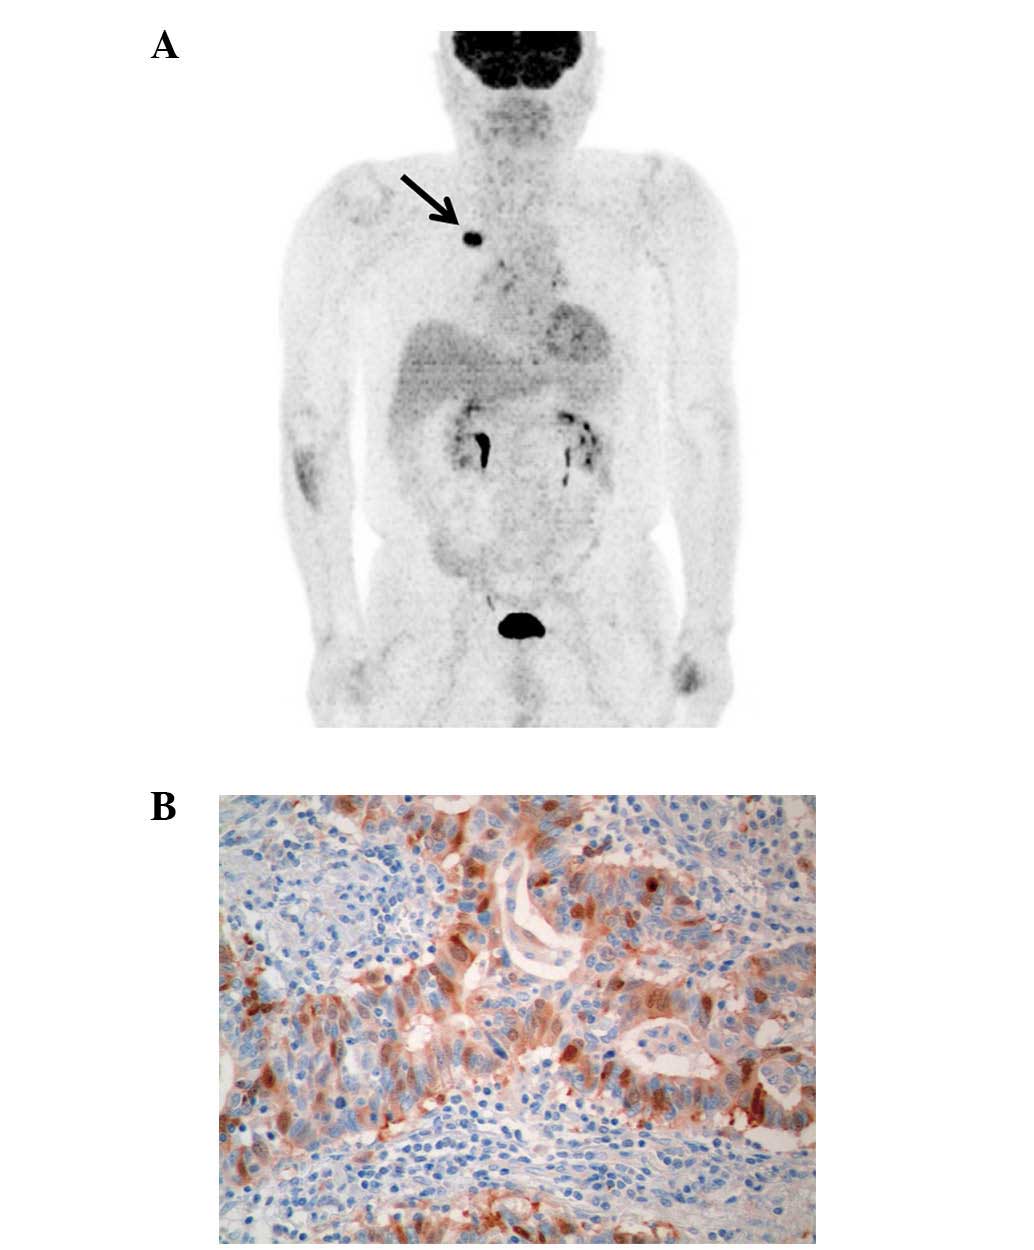
50% of cases (197/392). Fig. 1 is
representative imaging of TS expression and 18F-FDG PET.
Fig. 2 shows the rate of positive
expression of these different biomarkers according to disease
types.
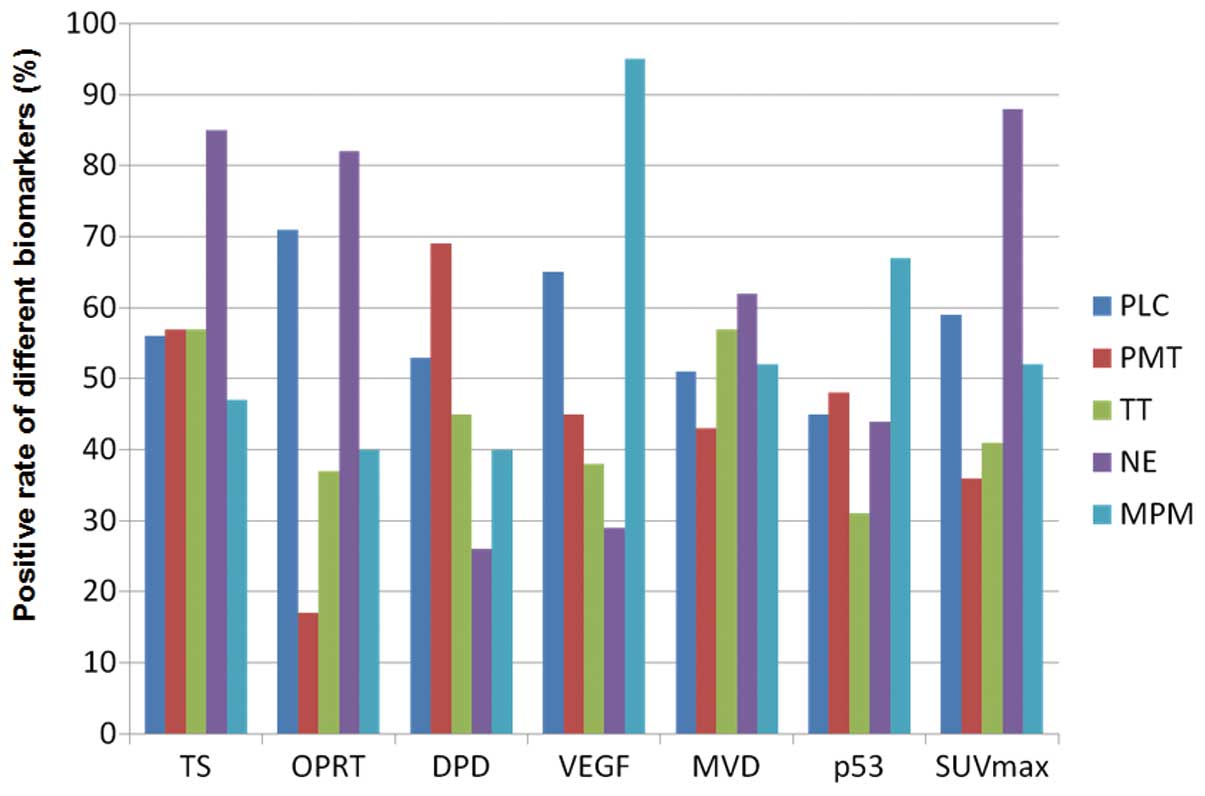 | Figure 2Positive rate according to different
biomarkers (PLC, primary lung cancer; PMT, pulmonary metastatic
tumor; TT, thymic epithelial tumor; NE, neuroendocrine tumor; MPM,
malignant pleural mesothelioma). Positive rates of TS expression in
PLC, PMT, TT, NE and MPM were 56, 57, 57, 85 and 47%, respectively.
Those of OPRT, DPD, VEGF, MVD, p53 and SUVmax in PLC,
PMT, TT, NE and MPM were 71, 17, 37, 82 and 40%, respectively, 53,
69, 45, 26 and 40%, respectively, 65, 45, 38, 29 and 95%,
respectively, 51, 43, 57, 62 and 52%, respectively, 45, 48, 31, 44
and 67%, respectively, and 59, 36, 41, 88 and 52%, respectively.
TS, thymidylate synthase; OPRT, orotate phosphoribosyltransferase;
DPD, dihydropyrimidine dehydrogenase; VEGF, vascular endothelial
growth factor; MVD, microvessel density determinate by CD34;
SUVmax, maximal standardized uptake value. |
Relationship between TS expression and
different variables
Table I shows a
comparison of the different variables according to TS expression. A
positive TS expression was significantly correlated with male,
SUVmax and the expression of OPTT, DPD, VEGF, CD34 and
p53. In the analysis according to primary disease types, the
positive rate of TS expression in NE tumor (n=34) was significantly
higher than that in NSCLC (n=140; P=0.001), PMT (n=148; P=0.001),
thymic epithelial tumors (n=49; P=0.008) and MPM (n=21; P=0.005).
No statistically significant difference in the TS expression was
observed among NSCLC, PMT, thymic epithelial tumors and MPM. Next,
the positive rate of TS expression was compared according to
histological types. Two hundred and one patients had a histology of
adenocarcinoma (AC), 58 squamous cell carcinoma (SQC), 28
high-grade NE tumors, 20 sarcoma, 38 thymoma and 16 MPM with
epithelial type. The positive rates of AC, SQC, high-grade NE
tumors, sarcoma, thymoma and MPM with epithelial type were 51, 86,
96, 35, 47 and 47%, respectively. The positive rate of TS
expression was significantly lower in patients with AC than in SQC
(P<0.001) and high-grade NE tumors (P<0.001), demonstrating
no significant difference (P=0.26). No significantly significant
difference was recognized between AC and sarcoma, between AC and
thymoma and between SQC and high-grade NE tumors. Finally, we
compared the positive rate of TS expression between primary lung
cancer and PMT according to histological type (AC or SQC). The
positive rate of TS expression (P=0.002) in histology with AC was
significantly higher in PMT (61%; n=106) than in NSCLC (39%, n=95),
whereas that (P=0.021) with SQC was significantly higher in NSCLC
(n=43; 93%) than in PMT (n=15; 67%). In patients with NSCLC, TS
expression was significantly higher in SQC than in AC (P<0.001),
however, no statistically significant difference in the TS
expression was observed between AC and SQC in patients with PMT
(P=0.782).
 | Table IDifferent variables according to TS
expression. |
Table I
Different variables according to TS
expression.
| Variables | TS positive
(n=230) | TS negative
(n=162) | P-value |
|---|
| Age (≤65/>65
years) | 108/122 | 85/77 | 0.305 |
| Gender
(male/female) | 153/77 | 78/84 | <0.001 |
| Primary site
(thoracic/extrathoracic) | 146/84 | 98/64 | 0.597 |
| SUVmax
(low/high) | 75/155 | 120/42 | <0.001 |
| DPD (low/high) | 92/138 | 83/79 | 0.031 |
| OPRT
(low/high) | 90/140 | 123/39 | <0.001 |
| VEGF
(low/high) | 79/151 | 105/57 | <0.001 |
| CD34
(low/high) | 81/149 | 115/47 | <0.001 |
| p53 (low/high) | 92/138 | 120/42 | <0.001 |
Correlation between TS expression and
different variables
Table II shows the
correlation between TS expression and various biomarkers according
to disease types. The expression of TS was closely correlated with
18F-FDG uptake, OPRT, DPD and angiogenesis (VEGF and
MVD). In the analysis according to histological types, however, the
relationship between TS expression and 18F-FDG uptake
showed a statistically significant correlation in patients with
pulmonary AC, high-grade NE tumor, thymoma and MPM with epithelial
type (Table III). In 58 patients
with SQC, TS expression was not closely associated with these
biomarkers including SUVmax by 18F-FDG
uptake. Of 11 patients with thymic carcinoma, 8 patients had a
histological type of SQC, and TS expression in thymic carcinoma was
not closely correlated with 18F-FDG uptake.
| Table IICorrelation between TS expression and
biomarkers according to the primary sites. |
Table II
Correlation between TS expression and
biomarkers according to the primary sites.
|
SUVmax | OPRT | DPD | VEGF | CD34 |
|---|
| Total (n=392) |
| Spearman γ | 0.464 | 0.460 | 0.134 | 0.384 | 0.419 |
| 95% CI | 0.381–0.541 | 0.373–0.539 | 0.030–0.236 | 0.293–0.467 | 0.331–0.499 |
| P-value |
<0.001 |
<0.001 | 0.009 |
<0.001 |
<0.001 |
| Primary lung cancer
(n=140) |
| Spearman γ | 0.596 | 0.583 | −0.103 | 0.634 | 0.551 |
| 95% CI | 0.473–0.696 | 0.457–0.685 | −0.269–0.068 | 0.520–0.726 | 0.419–0.659 |
| P-value |
<0.001 |
<0.001 | 0.224 |
<0.001 |
<0.001 |
| Pulmonary
metastatic tumors (n=148) |
| Spearman γ | 0.201 | 0.311 | 0.395 | 0.321 | 0.186 |
| 95% CI | 0.036–0.355 | 0.153–0.454 | 0.245–0.527 | 0.163–0.462 | 0.021–0.341 |
| P-value | 0.014 | 0.001 | <0.001 | <0.001 | 0.023 |
| Thymic epithelial
tumors (n=49) |
| Spearman γ | 0.616 | 0.650 | 0.636 | 0.755 | 0.525 |
| 95% CI | 0.398–0.768 | 0.444–0.791 | 0.425–0.781 | 0.596–0.857 | 0.279–0.707 |
| P-value |
<0.001 |
<0.001 |
<0.001 |
<0.001 |
<0.001 |
| Neuroendocrine
tumors (n=34) |
| Spearman γ | 0.634 | 0.788 | −0.069 | 0.336 | 0.567 |
| 95% CI | 0.367–0.804 | 0.607–0.891 | −0.406–0.285 | −0.012–0.612 | 0.274–0.764 |
| P-value |
<0.001 |
<0.001 | 0.697 | 0.052 |
<0.001 |
| Malignant pleural
mesothelioma (n=21) |
| Spearman γ | 0.665 | 0.446 | 0.709 | 0.480 | 0.554 |
| 95% CI | 0.315–0.855 | 0.004–0.742 | 0.388–0.786 | 0.047–0.761 | 0.148–0.801 |
| P-value | 0.001 | 0.042 |
<0.001 | 0.027 | 0.009 |
| Table IIICorrelation between TS expression and
biomarkers according to the histological types. |
Table III
Correlation between TS expression and
biomarkers according to the histological types.
|
SUVmax | OPRT | DPD | VEGF | CD34 |
|---|
| Adenocarcinoma | | | | | |
| Total patients
(n=201) | | | | | |
| Spearman γ | 0.298 | 0.225 | 0.271 | 0.363 | 0.351 |
| 95% CI | 0.161–0.421 | 0.008–0.355 | 0.133–0.398 | 0.232–0.481 | 0.218–0.469 |
| P-value |
<0.001 | 0.001 |
<0.001 |
<0.001 |
<0.001 |
| Primary lung
cancer (n=95) | | | | | |
| Spearman γ | 0.575 | 0.503 | 0.240 | 0.592 | 0.478 |
| 95% CI | 0.418–0.699 | 0.331–0.643 | 0.034–0.426 | 0.438–0.712 | 0.301–0.623 |
| P-value |
<0.001 |
<0.001 | 0.019 |
<0.001 |
<0.001 |
| Pulmonary
metastatic tumors (n=106) | | | | | |
| Spearman γ | 0.114 | 0.261 | 0.259 | 0.202 | 0.141 |
| 95% CI | −0.083–0.304 | 0.069–0.435 | 0.066–0.433 | 0.006–0.383 | −0.056–0.328 |
| P-value | 0.241 | 0.006 | 0.007 | 0.037 | 0.147 |
| Squamous cell
carcinoma | | | | | |
| Total patients
(n=58) | | | | | |
| Spearman γ | 0.222 | 0.202 | −0.104 | 0.256 | 0.115 |
| 95% CI | −0.045–0.461 | −0.067–0.443 | −0.360–0.165 | −0.009–0.488 | −0.155–0.369 |
| P-value | 0.093 | 0.128 | 0.437 | 0.052 | 0.389 |
| Primary lung
cancer (n=43) | | | | | |
| Spearman γ | 0.285 | 0.150 | −0.101 | 0.309 | 0.1765 |
| 95% CI | −0.025–0.546 | −0.166–0.438 | −0.397–0.214 | 0.001–0.5646 | −0.139–0.460 |
| P-value | 0.063 | 0.335 | 0.520 | 0.043 | 0.257 |
| Pulmonary
metastatic tumors (n=15) | | | | | |
| Spearman γ | 0.103 | 0.277 | 0.174 | 0.076 | −0.035 |
| 95% CI | −0.445–0.595 | −0.289–0.700 | −0.385–0.641 | −0.466–0.578 | −0.549–0.498 |
| P-value | 0.714 | 0.316 | 0.534 | 0.786 | 0.900 |
| High-grade
neuroendocrine tumors (n=28) | | | | | |
| Spearman γ | 0.395 | 0.729 | −0.274 | 0.242 | 0.476 |
| 95% CI | 0.014–0.675 | 0.480–0.869 | −0.594–0.121 | −0.154–0.573 | 0.113–0.726 |
| P-value | 0.037 |
<0.001 | 0.157 | 0.213 | 0.010 |
| Sarcoma
(n=20) | | | | | |
| Spearman γ | 0.246 | 0.331 | 0.559 | 0.416 | 0.116 |
| 95% CI | −0.233–0.629 | −0.145–0.682 | 0.141–0.808 | −0.046–0.732 | −0.356–0.542 |
| P-value | 0.295 | 0.154 | 0.010 | 0.068 | 0.624 |
| Thymoma
(n=38) | | | | | |
| Spearman γ | 0.489 | 0.529 | 0.632 | 0.701 | 0.409 |
| 95% CI | 0.192–0.704 | 0.243–0.731 | 0.383–0.795 | 0.483–0.837 | 0.093–0.651 |
| P-value | 0.002 |
<0.001 |
<0.001 |
<0.001 | 0.012 |
| Thymic carcinoma
(n=11) | | | | | |
| Spearman γ | −0.055 | 0.588 | 0.137 | 0.345 | −0.224 |
| 95% CI | −0.646–0.577 | −0.038–0.883 | −0.519–0.692 | −0.339–0.791 | −0.735–0.451 |
| P-value | 0.872 | 0.056 | 0.687 | 0.297 | 0.508 |
| Malignant pleural
mesothelioma (epithelial type) (n=16) | | | | | |
| Spearman γ | 0.614 | 0.475 | 0.729 | 0.423 | 0.496 |
| 95% CI | 0.153–0.855 | −0.043–0.792 | 0.352–0.903 | −0.107–0.766 | −0.015–0.802 |
| P-value | 0.012 | 0.063 | 0.001 | 0.102 | 0.051 |
Discussion
This is the first study to investigate the
relationship between 18F-FDG uptake on PET and TS
expression in patients with various thoracic tumors. The expression
of TS in thoracic neoplasms had a positivity of 58% (230/392), and
the positive rates of TS expression in NSCLC, PMT, thymic
epithelial tumor, NE tumor and MPM were 56, 57, 57, 85 and 47%,
respectively. The positivity of TS expression in NE tumors was
significantly higher than that in other thoracic tumors. The
analysis according to histology revealed that high-grade NE tumor
or SQC had a higher positive rate of TS expression as compared with
the other histological types. The relationship between TS
expression and 18F-FDG uptake had a statistically
significant correlation in primary lung AC, high-grade NE tumor,
thymoma and MPM. Our results indicated that SUVmax by
18F-FDG uptake may be an alternative biomarker for
predicting TS expression in patients with primary lung AC,
high-grade NE tumor, thymoma and MPM.
High-level TS expression is related to an aggressive
tumor phenotype and a poor outcome in a variety of malignant tumors
(5). Several researchers have
documented that TS level is generally lower in AC than in SQC
(29,30). In lung cancer, TS expression has
been described to be higher in NE tumor than in SQC (21). In thymic epithelial tumors, TS
expression was correlated with the grade of malignancy and was
closely associated with poor outcome (7). Recently, Takeda et al(8) reported that a low expression level of
TS was associated with a better response and longer survival in
advanced NSCLC treated by chemotherapeutic regimens including S-1,
and TS expression was considered as predictive biomarkers of S-1
treatment. Although their study included a small sample size
(n=22), 16 (73%) patients had AC, 1 patient SQC and 5 patients
other histology. Their preliminary study suggests that TS
expression seems to be a predictive marker for S-1 treatment in
patients with AC. Sun et al(9) described the clinical significance of
TS expression in 193 patients with advanced non-squamous NSCLC
treated with pemetrexed-based chemotherapy, and higher response
rates for pemetrexed-based chemotherapy were associated with
TS-negativity, and survival in pemetrexed-based chemotherapy was
significantly longer in groups with TS-negativity. Two studies have
described that a low expression level of TS are predictive of
improved outcome in patients with MPM treated by pemetrexed-based
chemotherapy (10,11). In patients with PMT, however, it
remains unknown whether TS protein expression within pulmonary
metastatic tumors is associated with aggressiveness and poor
outcome. The results of these studies indicated that TS expression
could be a prognostic and predictive marker for outcome after
chemotherapy including TS-inhibitor regimens.
Currently, paraffin-embedded specimens obtained by
biopsy are the usual materials available for immunohistochemical
analysis in patients with NSCLC and MPM treated by chemotherapy.
But, these tumor samples are sometimes too small for the detection
of molecular markers in heterogeneous tumor tissue by
immunohistochemistry. In NSCLC or MPM with advanced disease, if an
adequate specimen is not available for immunohistochemical
staining, the biopsy may bias the immunohistochemical analysis of
TS protein expression. However, 18F-FDG PET is
appropriate for the detection of primary tumor lesions in patients
with advanced NSCLC or MPM (19,21).
In our study, SUVmax by 18F-FDG uptake was
correlated with the expression level of TS in patients with primary
lung AC and MPM. Our recent study documented that TS expression was
significantly correlated with Glut1, HIF-1α and angiogenesis in
patients with primary lung AC, but not primary lung SQC (6), although it remains unclear whether
these hypoxic markers in MPM patients are closely related to the
expression level of TS. Therefore, it may be reasonable that
SUVmax by 18F-FDG uptake could be an
alternative marker for the expression of TS in patients with
primary lung AC. Further study is warranted to evaluate whether the
SUVmax could be a useful biomarker for predicting the
chemoresistance to TS-inhibitor regimens (chemotherapy including
S-1 or pemetrexed) for these patients.
The patients with primary lung SQC had a high uptake
of 18F-FDG and a high expression of TS, demonstrating no
statistically significant correlation, thus SUVmax by
18F-FDG uptake was not useful for predicting the
chemoresistance to TS-inhibitor treatment in patients with SQC.
Since TS-inhibitor regimens are not generally administered to
patients with high-grade NE tumor and thymoma, further study is
warranted for evaluating whether the expression level of TS could
be predictive of outcome after TS-targeting therapy in these
populations.
In conclusion, TS is highly expressed in high-grade
NE tumors. TS expression has a statistically significant
correlation with SUVmax by 18F-FDG uptake in
primary lung AC, high-grade NE tumors, thymoma and MPM. Considering
that TS is a possible marker for predicting chemoresistance to TS
targeting therapy such as S-1 or pemetrexed, SUVmax by
18F-FDG uptake in primary lung AC may be an alternative
marker for the expression level of TS. Further study is warranted
for investigating whether SUVmax by 18F-FDG
uptake could be a useful marker for predicting outcome after S-1 or
pemetrexed treatment.
References
|
1
|
Brundage MD, Davies D and Mackillop WJ:
Prognostic factors in non-small cell lung cancer: a decade of
progress. Chest. 122:1037–1057. 2002. View Article : Google Scholar : PubMed/NCBI
|
|
2
|
Danenberg PV: Thymidylate synthase - a
target enzyme in cancer chemotherapy. Biochim Biophys Acta.
473:73–92. 1977.
|
|
3
|
Wada H, Hitomi S and Teramatsu T: Adjuvant
chemotherapy after complete resection in non-small cell lung
cancer. West Japan Study Group for Lung Cancer Surgery. J Clin
Oncol. 14:1048–1054. 1996.
|
|
4
|
Nakano J, Huang C, Liu D, et al:
Evaluation of biomarkers associated with 5-FU sensitivity for
non-small-cell lung cancer patients postoperatively treated with
UFT. Br J Cancer. 95:607–615. 2006. View Article : Google Scholar : PubMed/NCBI
|
|
5
|
Nakagawa T, Otake Y, Yanagihara K, et al:
Expression of thymidylate synthase is correlated with proliferative
activity in non-small cell lung cancer (NSCLC). Lung Cancer.
43:145–149. 2004. View Article : Google Scholar : PubMed/NCBI
|
|
6
|
Kaira K, Ohde Y, Nakagawa K, et al:
Thymidylate synthase expression is closely associated with outcome
in patients with pulmonary adenocarcinoma. Med Oncol. 29:1663–1672.
2012. View Article : Google Scholar : PubMed/NCBI
|
|
7
|
Kaira K, Serizawa M, Koh Y, et al:
Expression of thymidylate synthase, orotate
phosphoribosyltransferase and dihydropyrimidine dehydrogenase in
thymic epithelial tumors. Lung Cancer. 74:419–425. 2011. View Article : Google Scholar
|
|
8
|
Takeda M, Okamoto I, Hirabayashi N, et al:
Thymidylate synthase and dihydropyrimidine dehydrogenase expression
levels are associated with response to S-1 plus carboplatin in
advanced non-small cell lung cancer. Lung Cancer. 73:103–109. 2011.
View Article : Google Scholar : PubMed/NCBI
|
|
9
|
Sun JM, Han J, Ahn JS, et al: Significance
of thymidylate synthase and thyroid transcription factor 1
expression in patients with nonsquamous non-small cell lung cancer
treated with pemetrexed-based chemotherapy. J Thorac Oncol.
6:1392–1399. 2011. View Article : Google Scholar : PubMed/NCBI
|
|
10
|
Righi L, Papotti MG, Ceppi P, et al:
Thymidylate synthase but not excision repair cross-complementation
group 1 tumor expression predicts outcome in patients with
malignant pleural mesothelioma treated with pemetrexed-based
chemotherapy. J Clin Oncol. 28:1534–1539. 2010. View Article : Google Scholar
|
|
11
|
Zucali PA, Giovannetti E, Destro A, et al:
Thymidylate synthase and excision repair cross-complementing
group-1 as predictors of responsiveness in mesothelioma patients
treated with pemetrexed/carboplatin. Clin Cancer Res. 17:2581–2590.
2011. View Article : Google Scholar : PubMed/NCBI
|
|
12
|
Kaira K, Okumura T, Ohde Y, et al:
Prognostic significance of thymidylate synthase expression in the
adjuvant chemotherapy after resection for pulmonary metastases from
colorectal cancer. Anticancer Res. 31:2763–2771. 2011.
|
|
13
|
Shirasaka T, Shimamato Y, Ohshimo H, et
al: Development of a novel form of an oral 5-fluorouracil
derivative (S-1) directed to the potentiation of the tumor
selective cytotoxicity of 5-fluorouracil by two biochemical
modulators. Anticancer Drugs. 7:548–557. 1996. View Article : Google Scholar : PubMed/NCBI
|
|
14
|
Kawahara M, Furuse K, Segawa Y, et al:
Phase II study of S-1, a novel oral fluorouracil, in advanced
non-small-cell lung cancer. Br J Cancer. 85:939–943. 2011.
View Article : Google Scholar : PubMed/NCBI
|
|
15
|
Shih C, Chen VJ, Gossett LS, et al:
LY231514, a pyrrolo[2,3-d] pyrimidine-based antifolate that
inhibits multiple folate-requiring enzymes. Cancer Res.
57:1116–1123. 1997.
|
|
16
|
Giovannetti E, Backus HH, Wouters D, et
al: Changes in the status of p53 affect drug sensitivity to
thymidylate synthase (TS) inhibitors by altering TS levels. Br J
Cancer. 96:769–775. 2007. View Article : Google Scholar : PubMed/NCBI
|
|
17
|
Gomez HL, Santillana SL, Vallejos CS, et
al: A phase II trial of pemetrexed in advanced breast cancer:
clinical response and association with molecular target expression.
Clin Cancer Res. 12:832–838. 2006. View Article : Google Scholar : PubMed/NCBI
|
|
18
|
Rose MG, Frarrell MP and Schmitz JC:
Thymidylate synthase: a critical target for cancer chemotherapy.
Clin Colorectal Cancer. 1:220–229. 2002. View Article : Google Scholar : PubMed/NCBI
|
|
19
|
Sasaki R, Komaki R, Macapinlac H, et al:
[18F]fluorodexyglucose uptake by positron emission
tomography predicts outcome of non-small-cell lung cancer. J Clin
Oncol. 23:1136–1143. 2005.
|
|
20
|
Higashi K, Ueda Y, Arisaka Y, et al:
18F-FDG uptake as a biologic prognostic factor for
recurrence in patients with surgically resected non-small cell lung
cancer. J Nucl Med. 43:39–45. 2002.
|
|
21
|
Bernard F, Sterman D, Smith RJ, et al:
Prognostic value of FDG PET imaging in malignant pleural
mesothelioma. J Nucl Med. 40:1241–1245. 1999.PubMed/NCBI
|
|
22
|
Song YS, Lee WW, Chung JH, et al:
Correlation between FDG uptake and glucose transporter type 1
expression in neuroendocrine tumors of the lung. Lung Cancer.
61:54–60. 2008. View Article : Google Scholar : PubMed/NCBI
|
|
23
|
Kaira K, Okumura T, Ohde Y, et al:
Correlation between 18F-FDG uptake on PET and molecular
biology in metastatic pulmonary tumors. J Nucl Med. 52:705–711.
2011.PubMed/NCBI
|
|
24
|
Kaira K, Endo M, Abe M, et al: Biologic
correlation of 2-[18F]-fluoro-2-deoxy-D-glucose uptake
on positron emission tomography in thymic epithelial tumors. J Clin
Oncol. 28:3746–3753. 2010.
|
|
25
|
Atkin GK, Daley FM, Bourne S, et al: The
impact of surgically induced ichaemia on protein levels in patients
undergoing rectal cancer surgery. Br J Cancer. 95:928–933. 2006.
View Article : Google Scholar : PubMed/NCBI
|
|
26
|
Kaira K, Endo M, Shukuya T, et al:
18F-FDG uptake on PET could be a predictive marker of
excision repair cross-complementation group 1 (ERCC1) expression in
patients with thoracic neoplasms? Neoplasma. 59:257–263. 2012.
View Article : Google Scholar
|
|
27
|
Kaira K, Ohde Y, Endo M, et al: Expression
of 4F2hc (CD98) in pulmonary neuroendocrine tumors. Oncol Rep.
26:931–937. 2011.PubMed/NCBI
|
|
28
|
Kaira K, Oriuchi N, Takahashi T, et al:
L-type amino acid transporter 1 (LAT1) expression in malignant
pleural mesothelioma. Anticancer Res. 31:4075–4082. 2011.PubMed/NCBI
|
|
29
|
Ceppi P, Volante M, Saviozzi S, et al:
Squamous cell carcinoma of the lung compared with other histotypes
shows higher messenger RNA and protein levels for thymidylate
synthase. Cancer. 107:1589–1596. 2006. View Article : Google Scholar : PubMed/NCBI
|
|
30
|
Hashimoto H, Ozeki Y, Sato M, et al:
Significance of thymidylate synthase gene expression level in
patients with adenocarcinoma of the lung. Cancer. 106:1595–1601.
2006. View Article : Google Scholar : PubMed/NCBI
|
|
31
|
Ibe T, Shimizu K, Nakano T, et al:
High-grade neuroendocrine carcinoma of the lung shows increased
thymidylate synthase expression compared to other histotypes. J
Surg Oncol. 102:11–17. 2010. View Article : Google Scholar
|