Introduction
Soft tissue tumors are not rare findings in daily
orthopedic practice. Several imaging modalities have been applied
to assess these tumors, including plain radiography, nuclear
medicine, computed tomography (CT), magnetic resonance imaging
(MRI), ultrasonography (US), angiography and positron emission
tomography. Most general practitioners, however, find it difficult
to distinguish benign from malignant lesions (1). Although MRI and CT are the most common
modalities for evaluating soft tissue masses, many patients have
difficulty undergoing these examinations. Additionally, their cost
may be prohibitive.
Clinical radiologists and orthopedic oncologists are
urgently seeking a tool that can identify malignant potential in
these soft tissue tumors. Among the various imaging modalities, US
is most often available clinically. It also has the advantages of
being simple, easy and inexpensive, and it can offer results in
real-time. Conversely, US has not been found to be reliable for
examining soft tissue tumors as little information is available
about differentiating benign from malignant lesions by US (2).
In recent years, the resolution of US has undergone
marked development. Concurrently, a new-generation contrast medium
for US has been approved for use. Several previous studies
confirmed that intratumoral blood flow was a useful factor for
differentiating benign and malignant tumors (2–4). It is
possible that combining US with contrast medium can increase the
accuracy of detecting malignant potential in soft tissue tumors.
The aim of the present study was to elucidate the usefulness of
contrast-enhanced color Doppler US (CDUS) in the preoperative
differential diagnosis of benign and malignant soft tissue
tumors.
Materials and methods
Between January 2010 and December 2013, a total of
180 patients (87 male, 93 female) were enrolled in the present
study. The patient ages ranged from 1 to 91 years (mean 58.1±20.0
years). The patients were treated at Osaka City University Hospital
in Osaka, Japan. The institutional Ethics Review Board of Osaka
City University Graduate School of Medicine approved the protocol
of the present study.
All the patients who presented with soft tissue
masses were screened by US at the first or second visit to our
institution. Histologic confirmation is often important for the
diagnosis. Thus, ultimately, all these patients underwent biopsy or
tumor resection. A pathologist with expertise in sarcoma pathology
examined the specimens according to standard criteria for bone and
soft tissue sarcoma subtyping based on the World Health
Organization classification system (5). All the patients provided written
permission to use their samples.
We used the HI VISION Avius US apparatus
(Hitachi-Aloka Medical, Tokyo, Japan). The linear array transducers
had multi-frequencies of 5.0 MHz. Sonazoid (Daiichi Sankyo, Tokyo,
Japan), a second-generation contrast medium designed for US, was
used to assess the vascularity of the tumors. Sonazoid was injected
intravenously as a 0.5-ml bolus followed by a 10-ml normal saline
flush using a 22-gauge peripheral intravenous cannula. US images
were recorded on a hard disk starting 40 sec after the injection
and continuing for up to 2 min.
Before injecting the Sonazoid, gray-scale US was
used to measure the maximum size, depth of the soft tissue masses,
tumor margins, shape (round, ovoid, lobulated), echogenicity
(hyperintense, isointense, hypointense) and textural pattern
(homogeneous or heterogeneous). US also identified its anatomical
location. Tumor margins were assessed as well-defined (clear-cut
and thin capsule-like) or ill-defined (uncertain margin with
respect to adjacent normal tissue).
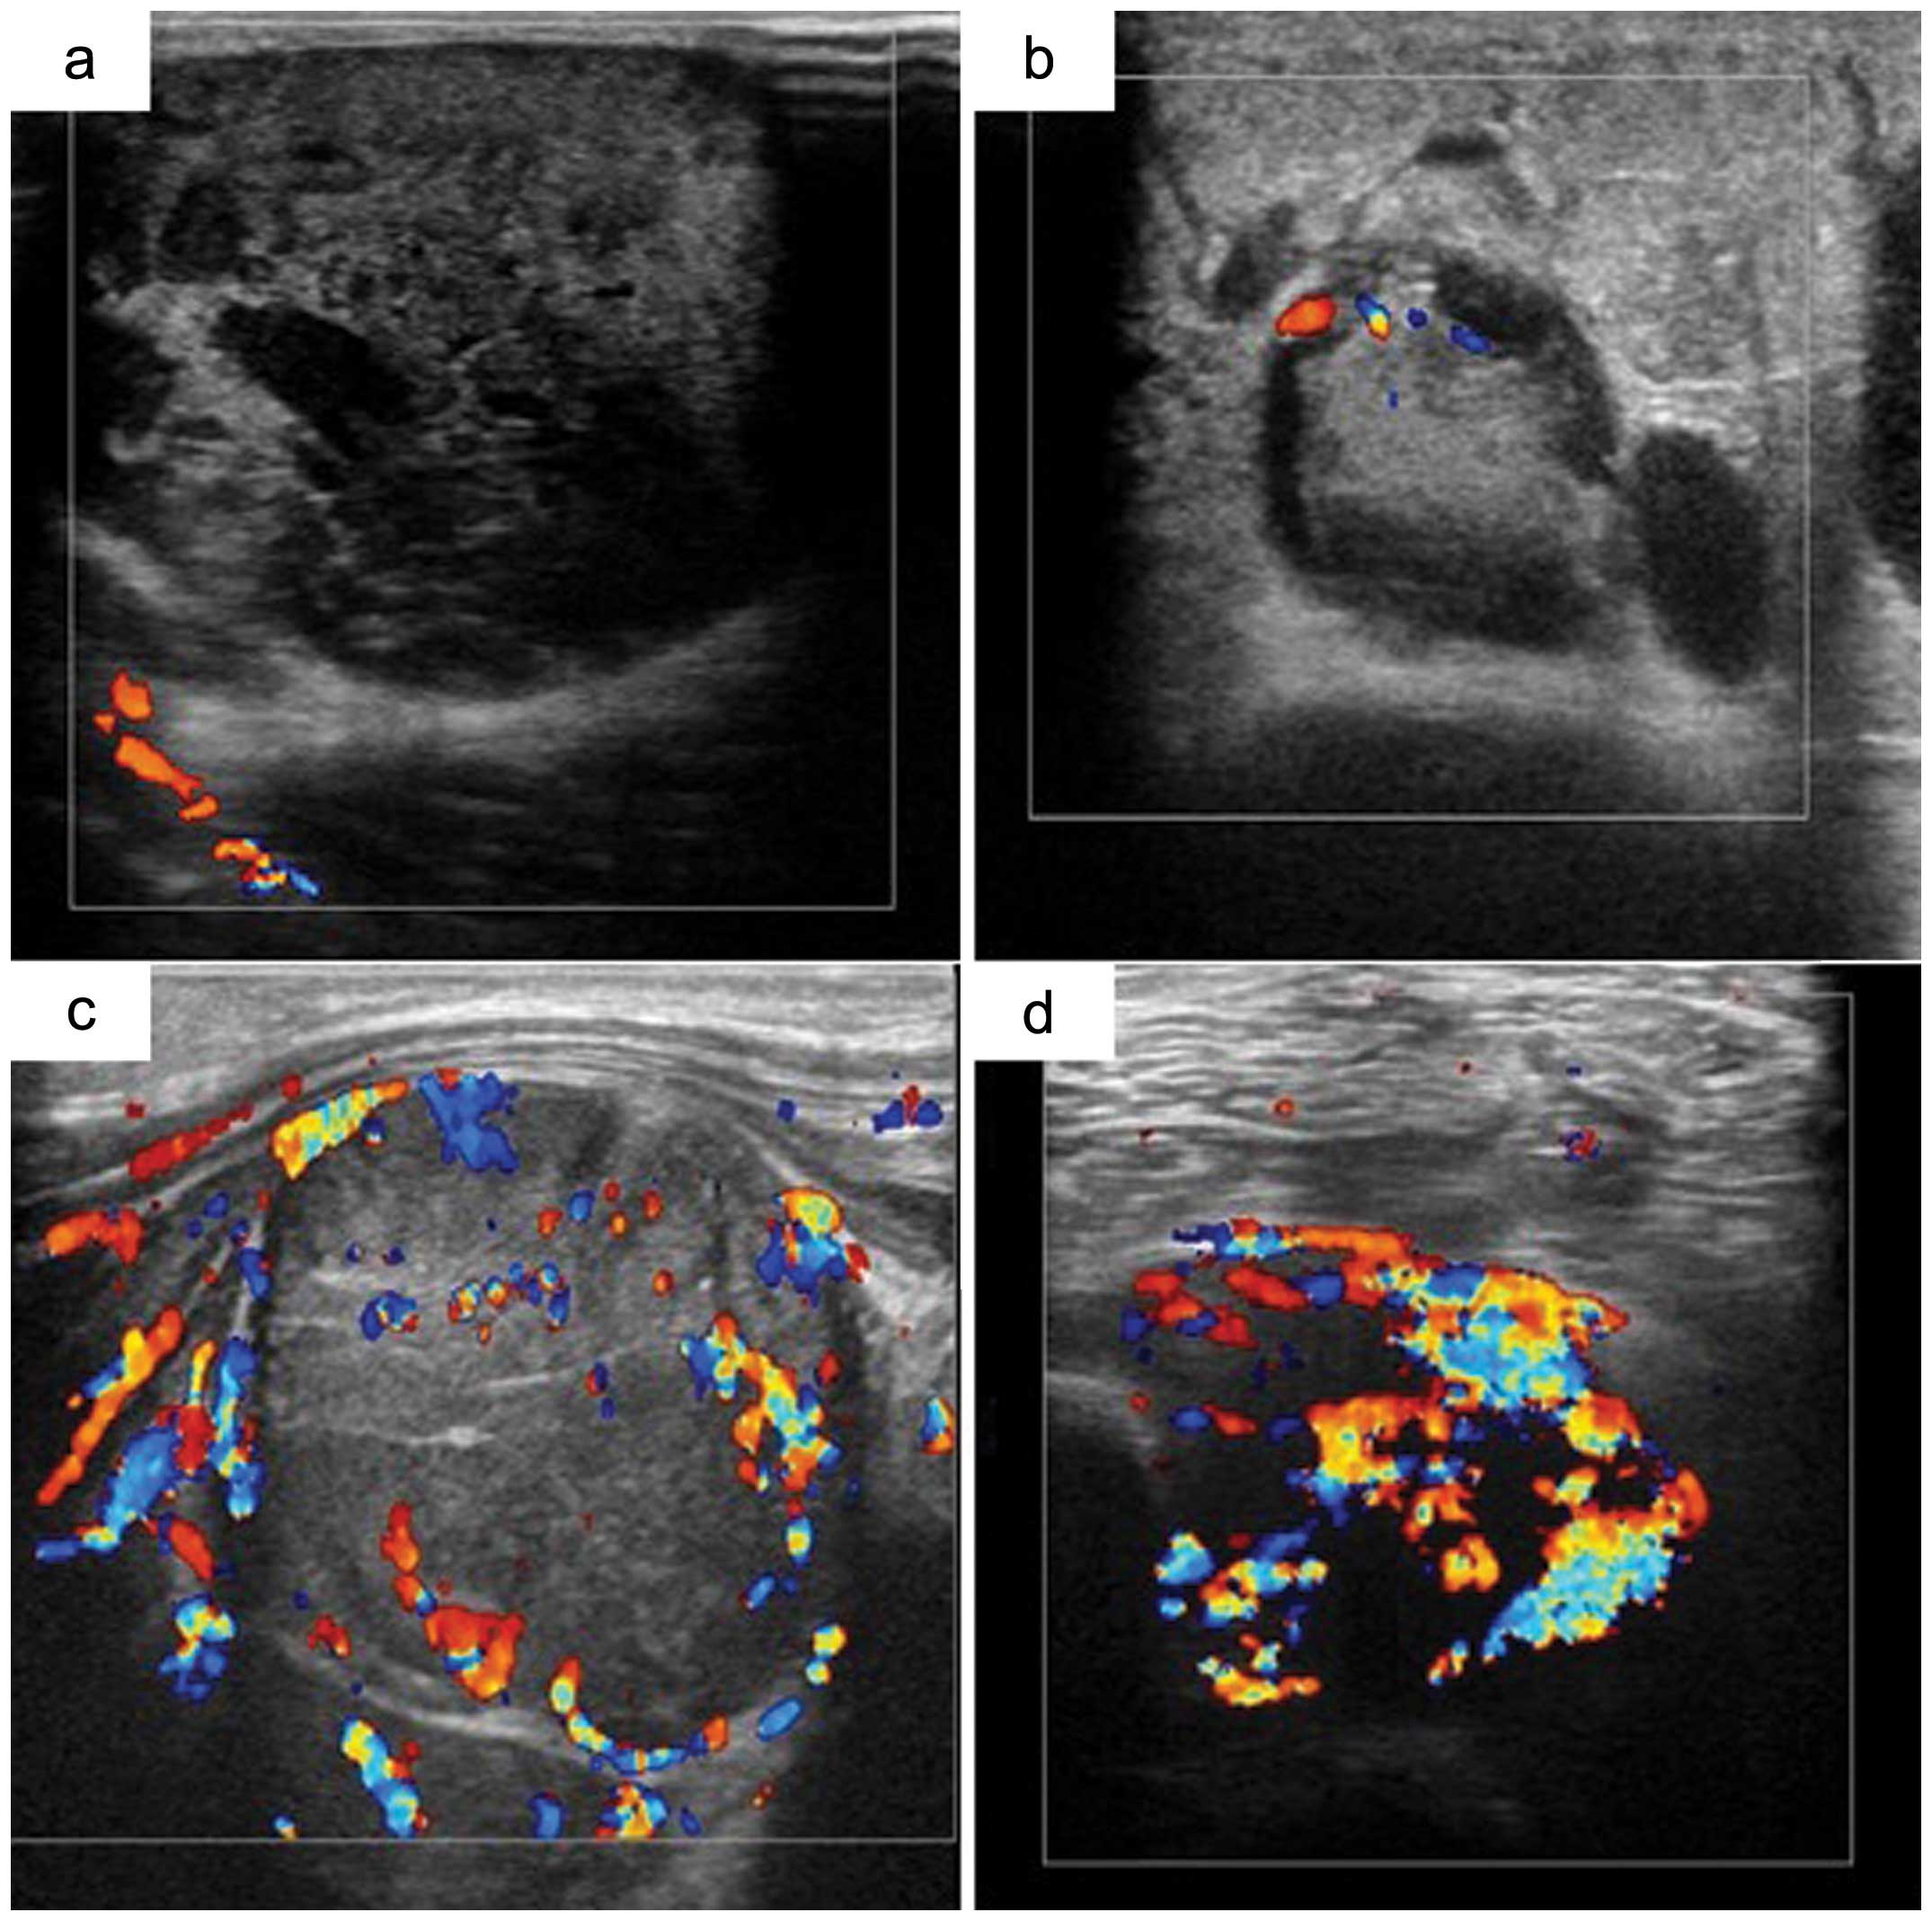
CDUS was used to evaluate the blood flow with and
without Sonazoid. Based on Giovagnorio et al criteria
(3), the CDUS grades were: I
(avascular); II (hypovascular with a single vascular pole); III
(hypervascular with multiple peripheral poles); or IV
(hypervascular with internal vessels). Grade I and II masses were
categorized as benign, whereas grades III and IV masses were
classified as malignant (Fig.
1).
We assessed the vascular velocity inside the tumor
by measuring the main artery from 1 to 3 vessels and the mean value
was calculated. The peak systolic flow velocity (Vp), mean flow
velocity (Vm), resistivity index (RI) and pulsatility index (PI) of
each detected intratumoral artery were assessed with power Doppler
US (PDUS). The RI was defined by the following equation: (peak
systolic velocity - end-diastolic velocity)/peak systolic velocity.
The PI was defined as follows: (peak systolic velocity -
end-diastolic velocity)/time average velocity.
Statistical analysis
Quantitative data are presented as the means ±
standard deviation. The Mann-Whitney U, Fisher’s exact and
χ2 tests were used for unpaired comparisons between the
quantitative parameters. Statistical analysis was performed using
Excel statistics software for Windows (version 2012; SSRI Co.,
Ltd., Tokyo, Japan). A value of p<0.05 was considered to
indicate a statistically significant difference.
Results
Patient characteristics
A total of 118 benign and 62 malignant tumors were
included in the present study (Table
I). Benign soft tissue masses were located in the neck (n=1),
trunk (n=13), upper arm (n=10), forearm (n=4), hand (n=18), thigh
(n=31), lower thigh (n=25) and foot (n=16). Malignant soft tissue
masses were located in the trunk (n=14), upper arm (n=8), forearm
(n=1), thigh (n=31) and lower thigh (n=8). Table II shows the histologic diagnosis of
benign and malignant tumors.
 | Table IClinical information of patient
characteristics. |
Table I
Clinical information of patient
characteristics.
| Variable | Benign (No.) | Malignant (No.) |
|---|
| 118 | 62 |
| Median age | 54 (1–84) | 64 (12–91) |
| Gender |
| Male | 50 | 37 |
| Female | 68 | 25 |
| Location of
lesion |
| Head or neck | 1 | 0 |
| Trunk | 13 | 14 |
| Arm or elbow | 10 | 8 |
| Forearm | 4 | 1 |
| Hand | 18 | 0 |
| Thigh | 31 | 31 |
| Knee of leg | 25 | 8 |
| Ankle of foot | 16 | 0 |
| Table IIHistological diagnosis of each
patient. |
Table II
Histological diagnosis of each
patient.
| No. |
|---|
| Benign soft-tissue
tumors |
| Lipoma | 23 |
| Ganglion | 16 |
| Schwannoma | 14 |
| Epidermal cyst | 8 |
| Giant tumor of
tendon sheath | 8 |
| Leiomyoma, synovial
cyst | 7 |
| Hemangioma | 6 |
| Fibroma | 5 |
| Pigmented
villonodular synovitis | 4 |
| Desmoid | 3 |
| Hematoma | 3 |
| Tenosynovitis | 3 |
| Chronic
bursitis | 2 |
| Granuloma | 2 |
| Neurofibroma | 2 |
| Lymphadenitis | 1 |
| Xanthoma | 1 |
| Tumoral
calcinosis | 1 |
| Lipoblastoma | 1 |
|
Osteochondromatosis | 1 |
| Malignant
soft-tissue tumors |
| Well
differentiated liposarcoma | 10 |
| Pleomorphic
liposarcoma | 7 |
| Metastasis | 6 |
| Malignant fibrous
histiocytoma | 5 |
| Myxoid
liposarcoma | 4 |
| Malignant
lymphoma | 4 |
| Undifferentiated
pleomorphic sarcoma | 4 |
|
Myxofibrosarcoma | 3 |
| Malignant
peripheral nerve sheath tumor | 3 |
| Dedifferentiated
liposarcoma | 2 |
| Low grade
fibromyxoid sarcoma | 2 |
|
Chondrosarcoma | 2 |
|
Rhabdomyosarcoma | 2 |
| Synovial
sarcoma | 2 |
|
Leiomyosarcoma | 2 |
| Solitary fibrous
tumor | 2 |
| Plasmacytoma | 1 |
| Epithelial
sarcoma | 1 |
Comparison of gray-scale US images
The mean sizes of benign and malignant soft tissue
tumors were calculated to be 39.8±17.3 and 78.6±31.4 mm,
respectively (Table III). The
mean depths were 5.7±2.9 and 9.0±3.2 mm, respectively. The
differences in these two factors (size and depth) were
statistically significant (p<0.001). The margins of benign soft
tissue tumors were ill-defined in 12 of 118 (10.2%) tumors, whereas
those of malignant tumors were ill-defined in 20 of 62 (32.3%)
tumors (p<0.001). Regarding the textural pattern, the benign
soft tissue tumors were homogeneous in 73 of 118 (61.9%), whereas
the malignant tumors were homogeneous in 23 of 62 (37.1%)
(p=0.0017). The differences in shape and echogenicity were not
statistically significant.
| Table IIIComparison with gray-scale of benign
and malignant tumors. |
Table III
Comparison with gray-scale of benign
and malignant tumors.
| Variable | Benign | Malignant | P-value |
|---|
| Mean size (mm) | 39.6±17.3 | 78.6±31.4 | 0.0001 |
| Mean depth
(mm) | 5.7±2.9 | 9.0±3.2 | 0.0012 |
| Shape | | | 0.71 |
| Round | 59 | 26 | |
| Ovoid | 26 | 22 | |
| Lobulated | 33 | 14 | |
| Echogenicity | | | 0.61 |
| Hyper | 38 | 21 | |
| Hypo | 63 | 27 | |
| Iso | 17 | 14 | |
| Textural
pattern | | | 0.0017 |
| Homo | 73 | 23 | |
| Hetero | 45 | 39 | |
| Tumor margin | | | 0.0002 |
| Well-defined | 106 | 42 | |
| Ill-defined | 12 | 20 | |
Comparison of CDUS findings
In total, 109 patients received intravenous
injections of Sonazoid. Before Sonazoid injection, the tumor grades
on CDUS were, respectively, I, II, III or IV in 52, 39, 14 and 13
benign tumors and in 7, 21, 12 and 21 malignant tumors. After
Sonazoid injection, the grades were I, II, III and IV,
respectively, in 23, 25, 7 and 16 benign tumors and in 2, 3, 11 and
22 malignant tumors. The probability of malignancy on CDUS findings
before Sonazoid injection were 55% sensitivity, 77% specificity,
76% negative predictive value (NPV), 56% positive predictive value
(PPV) and 69% accuracy. Following administration of Sonazoid, these
values increased to 86% sensitivity, 68% specificity, 90% NPP, 59%
PPV and 74% accuracy (Table
IV).
| Table IVComparison with CDUS findings of
benign and malignant tumors. |
Table IV
Comparison with CDUS findings of
benign and malignant tumors.
| Variable | Benign (No.) | Malignant
(No.) | Sensitivity
(%) | Specificity
(%) | Accuracy (%) |
|---|
| CDUS grade without
CM |
| Grade I, II | 91 | 28 | 54.8 | 77.1 | 69.4 |
| Grade III, IV | 27 | 34 | | | |
| CDUS grade with
CM |
| Grade I, II | 48 | 5 | 86.8 | 67.6 | 74.3 |
| Grade III, IV | 23 | 33 | | | |
Comparison of PDUS findings
PDUS analyses of benign tumors showed that the mean
Vp, Vm, RI and PI values were 18.1 cm/sec (1.5–43.0), 6.5 cm/sec
(0.4–20.2), 0.95 (0–1.7) and 4.67 (0.03–49.5), respectively
(Table V). In the malignant groups,
the corresponding values were 16.5 cm/s (4.5–41.0), 8.1 cm/s
(0.2–33.1), 1.14 (0.14–10.8) and 3.46 (0.16–18.7), respectively
(Table V). The differences between
the mean values of each parameter for the malignant and benign
tumor groups were not statistically significant.
| Table VComparison with PDUS findings of
benign and malignant tumors. |
Table V
Comparison with PDUS findings of
benign and malignant tumors.
| Variable | Benign | Malignant | P-value |
|---|
| Mean Vp
(cm/sec) | 18.1 | 16.5 | 0.45 |
| Mean Vm
(cm/sec) | 6.5 | 8.1 | 0.19 |
| Mean PI | 4.67 | 3.46 | 0.36 |
| Mean RI | 0.95 | 1.14 | 0.47 |
Discussion
Soft tissue tumors are commonly found in the
everyday practice of general surgeons, including orthopedic
surgeons. The incidence of malignant soft tissue tumors is low,
accounting for <1% of all neoplasms. In contrast, benign soft
tissue tumors occur rather frequently (6). In the USA, the annual incidence of
soft tissue tumors was calculated at ~3 cases/1,000 people, with
~0.69% of them considered malignant (7). Although the precise number of
malignant soft tissue tumors in Japan is not known, it has been
estimated at around 2 cases/10,000 people according to the Soft
Tissue Tumor Registry in Japan (JOA Musculoskeletal Tumor
Committee, 2008).
Several imaging modalities have been used to assess
soft tissue tumors, with CT and MRI playing a key role. Several
authors (8–10) noted that only MRI and CT can assess
the possible components of the tumors and can show their anatomic
location and extent. However, with the exception of lipomatous
tumors, schwannomas and myositis ossificans, they do not allow a
definitive histological diagnosis (11–13).
Nevertheless, MRI and CT can generally provide important
information for a preoperative diagnosis and for planning surgery
(14).
Various medical specialists, including
dermatologists, plastic and general surgeons, treat soft tissue
tumors. Unplanned resections can engender serious problems. The
unplanned resection of a sarcoma is defined as ‘an excisional
biopsy or unplanned resection of lesion without the benefits of
preoperative imaging and without the benefits of preoperative
imaging and without regard for the necessity of removing the lesion
with a margin of normal tissue’ (15). Occasionally, surgery is undertaken
without sufficient preoperative images (16). Since MRI and CT are not always
available locally, the patient cannot be examined immediately.
Additionally, MRI is costly and radiologists are not always
equipped to review the images. Therefore, an easy universal
screening modality to detect soft tissue masses is desirable.
We focused on US as a powerful candidate for
screening patients for soft tissue tumors. US is non-invasive, has
a low cost, and is widely available compared with CT and MRI. It is
also possible to perform US in an ambulatory practice. To date,
however, little evidence-based information has been available
concerning the use of US to evaluate soft tissue tumors. Hence, we
decided to test the usefulness of US with the latest material
available to determine if it can contribute to distinguishing
between benign and malignant soft tissue tumors.
Several previous reports have introduced the
feasibility of US in differentiating benign and malignant soft
tissue tumors (2,17–21).
In the present study, the sizes, depths, tumor margins and textural
patterns were significantly different between benign and malignant
soft tissue tumors on gray-scale US images. Lange et al
(20) noted that soft tissue masses
with an ill-defined appearance on US may be assumed to be benign.
In the present study, most tumors had a well-defined appearance,
whereas an ill-defined appearance was considered malignant; quite
different from the report of Lange et al (20). Advances in image resolution enabled
this distinction. Chiou et al (21) reported that the tumor margin, shape
and size seemed to be significant indicators for differentiating
benign from malignant soft tissue tumors, which is consistent with
the results of the present study. However, shape and echogenicity
of tumors were not significantly different.
The evaluation of intratumoral vascularity is an
important clue for distinguishing benign from malignant lesions
(19,22–24).
Malignant tumors show an increased number of vessels (23). Ma et al (24) noted that intratumoral enhancement
patterns of malignant and benign masses differ due to differences
in their vascular architecture. CDUS is able to evaluate
intratumoral blood flow in real-time. Belli et al (25) demonstrated that conventional
sonography was not reliable for diagnosing malignancy, whereas
color imaging and power Doppler imaging were quite useful. Lagalla
et al (2) stated that
malignant potential was indicated in the presence of three or more
vascular signals and tortuous and irregular internal vessels seen
by CDUS. In contrast, Chiou et al (21) denied the usefulness of CDUS features
for differentiating benign from malignant soft tissue tumors.
Giovagnorio et al (3)
classified tumors based on four vascular patterns. Among them,
hypervascular tumors with multiple peripheral poles (type III) and
hypervascular tumors with internal vessels (type IV) were assumed
to be malignant. We used their classification in the present study
to differentiate benign and malignant tumors on CDUS. The CDUS
results, however, demonstrated lower sensitivity (54.8%) and
accuracy (69.4%) than were reported in previous studies (Table VI). We concluded that the CDUS
images were not good enough to screen for malignancy in soft tissue
tumors.
| Table VIPrevious reports of US for
soft-tissue tumors. |
Table VI
Previous reports of US for
soft-tissue tumors.
| Author (Refs.) | Patient | Result (%) |
|---|
| Lagalla et
al (2) | 46 Soft-tissue
masses | US: Sensitivity
(75) |
| Specificity
(50) |
| Accuracy (61) |
| CDUS: Sensitivity
(85) |
| Specificity
(92) |
| Accuracy (89) |
| Giovagnorio et
al (3) | 71 Nodules | CDUS: Sensitivity
(90) |
| Specificity
(100) |
| Belli et al
(25) | 30 Benign | US: Sensitivity
(60) |
| 20 Malignant
tumors | Specificity
(55) |
| Accuracy (57) |
| CDUS: Sensitivity
(85) |
| Specificity
(88) |
| Accuracy (87) |
| Present study | 118 Benign | CDUS: Sensitivity
(55) |
| 62 Malignant | Specificity
(77) |
| Accuracy (69) |
| CEUS: Sensitivity
(87) |
| Specificity
(68) |
| Accuracy (74) |
Since contrast medium may cause fine vascular
structures to appear more vividly, it was expected that
contrast-enhanced CDUS may contribute to clearer differentiation of
soft tissue tumors. This method has been widely used in several
fields, including those that address hepatic, breast and prostate
diseases (26–28). Chiou et al (29) described that, for soft tissue
tumors, contrast-enhanced US was markedly better than
non-contrast-enhanced images for detecting vessels in most
tumors.
Sonazoid is a second-generation contrast agent
designed for US use and has been approved in recent years. It
consists of micro-bubbles filled with chemically stable, poorly
soluble gas. The use of Sonazoid makes it possible to evaluate
intratumoral blood flow for a longer time and in more detail than
when using the previous-generation medium Levovist. We hypothesized
that we could distinguish between benign and malignant tumors more
clearly with Sonazoid than without it.
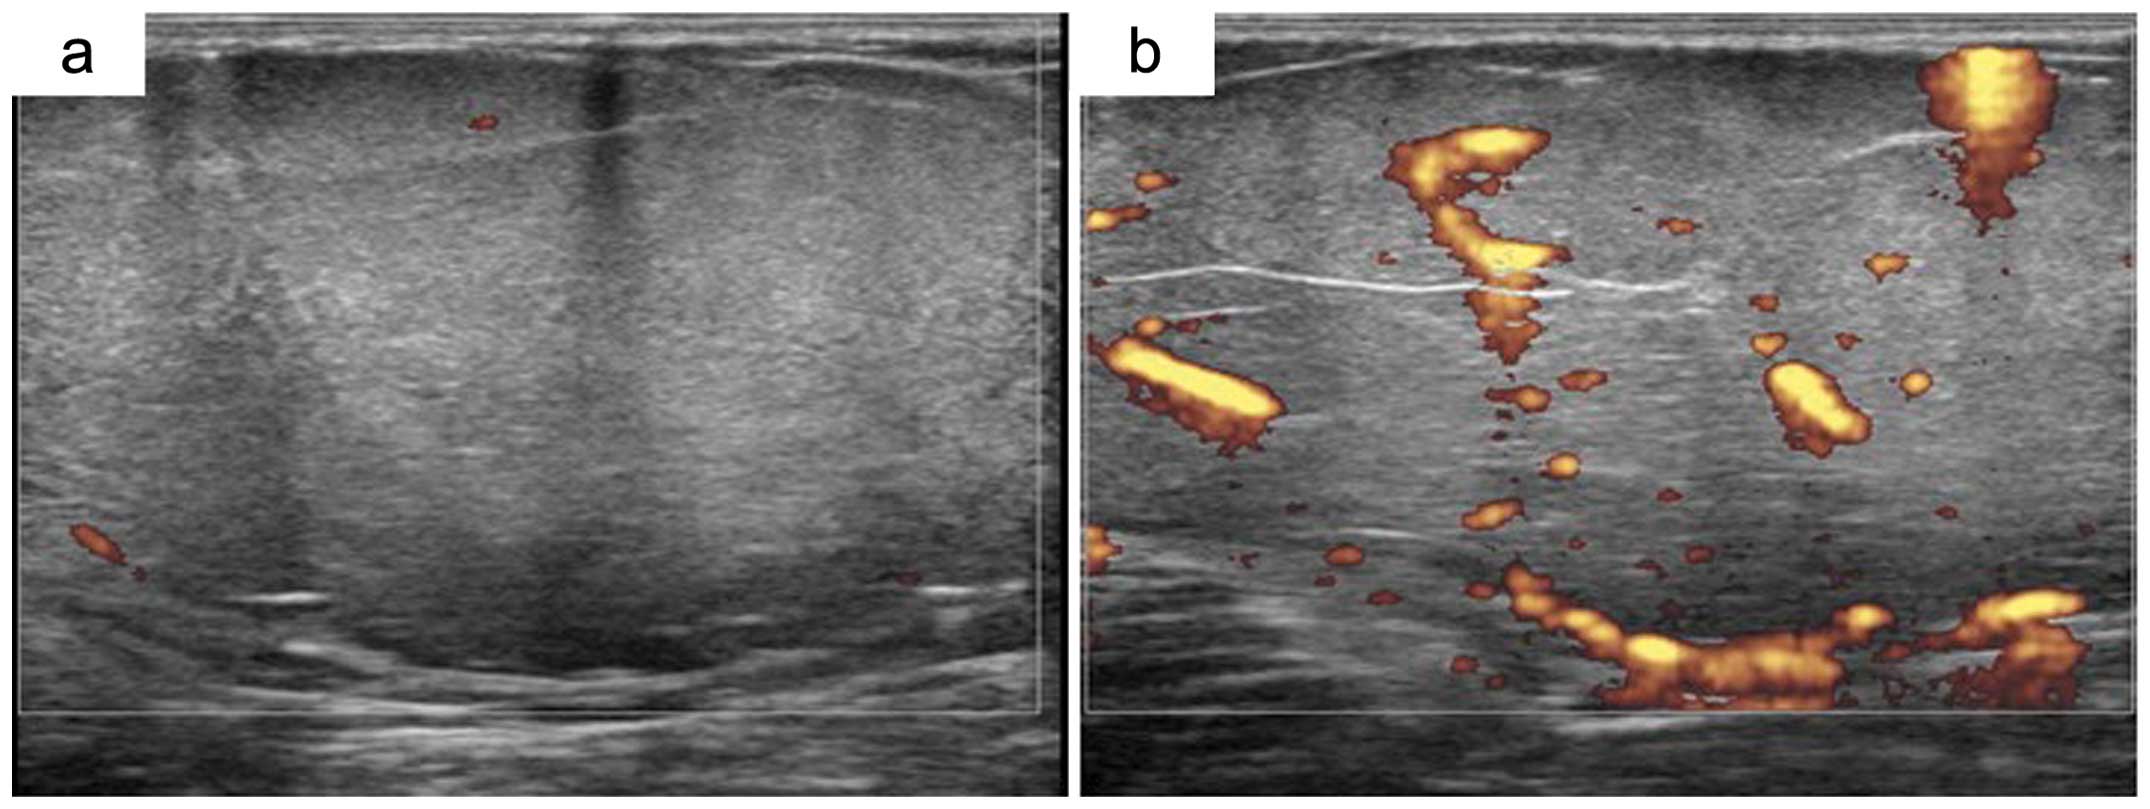
In the present study, contrast-enhanced CDUS
demonstrated higher sensitivity (86.8%) and accuracy (74.3%) than
did the CDUS-alone findings. Contrast-enhanced CDUS images enabled
the diagnoses of some low-grade malignant tumors,
well-differentiated liposarcomas and low-grade fibromyxoid
sarcomas. In 10 patients with well-differentiated liposarcomas,
CDUS images suggested vascular and hypovascular components in all
cases. After administration of contrast medium, CDUS displayed
hypervascularity in 7 of the 10 cases (Fig. 2). Both cases of low-grade
fibromyxoid sarcoma also showed hypovascularity on CDUS-alone
images, whereas after adding contrast medium, CDUS revealed
hypervascularity in both cases.
All orthopedic oncologists possibly know from
experience that during intralesional resection of a tumor the
amount of intraoperative bleeding is greater with a malignant tumor
than with a benign tumor. Hence, we hypothesized that the blood
velocity is greater inside a malignant tumor than in a benign
tumor. Additionally, malignant tumors form tortuous, deformed and
displaced vascular structures that may be highly unstable and
immature. They are characterized by a high proliferation of
endothelial cells, hyperpermeability and chaotic blood flow
(30). We surmised that the PI and
RI were also enhanced in malignant tumors and thus could indicate a
diagnosis of malignancy. Regarding PDUS findings in soft tissue
tumors, Belli et al (25)
noted that vessel characteristic analysis using PDUS had 85%
sensitivity and 88% specificity. Bodner et al (31) discovered that the RI ratio was an
indicator of malignancy. The present study, however, found no
statistically significant differences in mean Vp, Vm, RI and PI
values. Some benign tumors (such as schwannoma, hemangioma,
lymphadenitis) show hypervascularity, with Vp, Vm, RI and PI values
of these tumors being close to those for malignant tumors. In this
case, our results were not consistent with those previously
reported (25,31).
The present study has several limitations. First,
the sample size is small, and there were various histologic
diagnoses. Second, tumor vascularity varies during different phases
of tumor growth. When tumor growth progresses, areas of hypoxia and
necrosis may appear. We failed to estimate US findings in
connection with necrosis confirmed by pathology. Third, CDUS
displayed false-positive and false-negative findings for some
tumors. As already mentioned, well-differentiated liposarcomas and
low-grade fibromyxoid sarcomas were typically false-negative
tumors. Conversely, schwannoma with representative histology showed
a false-positive finding. In total, 9 of 14 (64%) patients with
schwannoma displayed hypervascularity on the images. To solve the
problem of false-positive and false-negative findings, we should
focus on these specific tumors and determine the specific findings
for each tumor. Since this histology is rare, however, it would be
difficult to accumulate these data.
In conclusion, tumor size, depth, textural pattern
and tumor margin proved to be positive parameters on gray-scale US
images for differentiating benign from malignant tumors. From the
standpoint of vascularity within the tumor, CDUS showed lower
sensitivity (54.8%) and lower accuracy (69.4%). Contrast medium
administration enhanced sensitivity and accuracy up to 86.8 and
74.4%, respectively. PDUS provided no useful information.
Contrast-enhanced CDUS proved to be a reliable diagnostic tool with
which to screen for malignant potential in soft tissue tumors.
References
|
1
|
Kransdorf MJ and Murphey MD: Radiologic
evaluation of soft-tissue masses: a current perspective. AJR Am J
Roentgenol. 175:575–587. 2000. View Article : Google Scholar : PubMed/NCBI
|
|
2
|
Lagalla R, Iovane A, Caruso G, Lo Bello M
and Derchi LE: Color Doppler ultrasonography of soft-tissue masses.
Acta Radiol. 39:421–426. 1998. View Article : Google Scholar : PubMed/NCBI
|
|
3
|
Giovagnorio F, Andreoli C and De Cicco ML:
Color Doppler sonography of focal lesions of the skin and
subcutaneous tissue. J Ultrasound Med. 18:89–93. 1999.PubMed/NCBI
|
|
4
|
Widmann G, Riedl A, Schoepf D, Glodny B,
Peer S and Gruber H: State-of-the-art HR-US imaging findings of the
most frequent musculoskeletal soft-tissue tumors. Skeletal Radiol.
38:637–649. 2009. View Article : Google Scholar : PubMed/NCBI
|
|
5
|
Jo VY and Fletcher CD: WHO classification
of soft tissue tumours: an update based on the 2013 (4th) edition.
Pathology. 46:95–104. 2014. View Article : Google Scholar : PubMed/NCBI
|
|
6
|
Simon MA and Finn HA: Diagnostic strategy
for bone and soft-tissue tumors. J Bone Joint Surg Am. 75:622–631.
1999.PubMed/NCBI
|
|
7
|
Siegel R, Naishadham D and Jemal A: Cancer
statistics, 2013. CA Cancer J Clin. 63:11–30. 2013. View Article : Google Scholar
|
|
8
|
Drapé JL: Advances in magnetic resonance
imaging of musculoskeletal tumours. Orthop Traumatol Surg Res.
99(Suppl 1): S115–S123. 2013.
|
|
9
|
Landa J and Schwartz LH: Contemporary
imaging in sarcoma. Oncologist. 14:1021–1038. 2009. View Article : Google Scholar : PubMed/NCBI
|
|
10
|
Iwamoto Y: Diagnosis and treatment of soft
tissue tumors. J Orthop Sci. 4:54–65. 1999. View Article : Google Scholar
|
|
11
|
Simon MA and Biermann JS: Biopsy of bone
and soft-tissue lesions. J Bone Joint Surg Am. 75:616–621.
1993.PubMed/NCBI
|
|
12
|
Stacy GS and Dixon LB: Pitfalls in MR
image interpretation prompting referrals to an orthopedic oncology
clinic. Radio-graphics. 27:805–828. 2007.PubMed/NCBI
|
|
13
|
Kawaguchi N, Matsumoto S and Manabe J:
Clinical diagnosis of soft tissue tumors. J Orthop Sci. 3:225–238.
1998. View Article : Google Scholar : PubMed/NCBI
|
|
14
|
ESMO/European Sarcoma Network Working
Group. Soft tissue and visceral sarcomas: ESMO Clinical Practice
Guidelines for diagnosis, treatment and follow-up. Ann Oncol.
23(Suppl 7): vii92–vii99. 2012.PubMed/NCBI
|
|
15
|
Noria S, Davis A, Kandel R, Levesque J,
O’Sullivan B, Wunder J and Bell R: Residual disease following
unplanned excision of soft-tissue sarcoma of an extremity. J Bone
Joint Surg Am. 78:650–655. 1996.PubMed/NCBI
|
|
16
|
Hoshi M, Ieguchi M, Takami M, Aono M,
Taguchi S, Kuroda T and Takaoka K: Clinical problems after initial
unplanned resection of sarcoma. Jpn J Clin Oncol. 38:701–709. 2008.
View Article : Google Scholar : PubMed/NCBI
|
|
17
|
Jin W, Kim GY, Park SY, Chun YS, Rhyu KH,
Park JS and Ryu KN: The spectrum of vascularized superficial
soft-tissue tumors on sonography with a histopathologic
correlation: part 2, malignant tumors and their look-alikes. AJR Am
J Roentgenol. 195:446–453. 2010. View Article : Google Scholar : PubMed/NCBI
|
|
18
|
Braunstein EM, Silver TM, Martel W and
Jaffe M: Ultrasonographic diagnosis of extremity masses. Skeletal
Radiol. 6:157–163. 1981. View Article : Google Scholar : PubMed/NCBI
|
|
19
|
Adler RS, Bell DS, Bamber JC, Moskovic E
and Thomas JM: Evaluation of soft-tissue masses using segmented
color Doppler velocity images: preliminary observations. AJR Am J
Roentgenol. 172:781–788. 1999. View Article : Google Scholar : PubMed/NCBI
|
|
20
|
Lange TA, Austin CW, Seibert JJ, Angtuaco
TL and Yandow DR: Ultrasound imaging as a screening study for
malignant soft-tissue tumors. J Bone Joint Surg Am. 69:100–105.
1987.PubMed/NCBI
|
|
21
|
Chiou HJ, Chou YH, Chiu SY, Wang HK, Chen
WM, Chen TH and Chang CY: Differentiation of benign and malignant
superficial soft-tissue masses using grayscale and color doppler
ultrasonography. J Chin Med Assoc. 72:307–315. 2009. View Article : Google Scholar : PubMed/NCBI
|
|
22
|
Jin W, Kim GY, Park SY, Chun YS, Nam DH,
Park JS and Ryu KN: The spectrum of vascularized superficial
soft-tissue tumors on sonography with a histopathologic
correlation: part 1, benign tumors. AJR Am J Roentgenol.
195:439–445. 2010. View Article : Google Scholar
|
|
23
|
Verstraete KL, Van der Woude HJ,
Hogendoorn PC, De-Deene Y, Kunnen M and Bloem JL: Dynamic
contrast-enhanced MR imaging of musculoskeletal tumors: basic
principles and clinical applications. J Magn Reson Imaging.
6:311–321. 1996. View Article : Google Scholar : PubMed/NCBI
|
|
24
|
Ma LD, Frassica FJ, McCarthy EF, Bluemke
DA and Zerhouni EA: Benign and malignant musculoskeletal masses: MR
imaging differentiation with rim-to-center differential enhancement
ratios. Radiology. 202:739–744. 1997. View Article : Google Scholar : PubMed/NCBI
|
|
25
|
Belli P, Costantini M, Mirk P, Maresca G,
Priolo F and Marano P: Role of color Doppler sonography in the
assessment of musculoskeletal soft tissue masses. J Ultrasound Med.
19:823–830. 2000.PubMed/NCBI
|
|
26
|
Omoto K, Matsunaga H, Take N, et al:
Sentinel node detection method using contrast-enhanced
ultrasonography with sonazoid in breast cancer: preliminary
clinical study. Ultrasound Med Biol. 35:1249–1256. 2009. View Article : Google Scholar : PubMed/NCBI
|
|
27
|
Uemura H, Sano F, Nomiya A, et al:
Usefulness of perflubutane microbubble-enhanced ultrasound in
imaging and detection of prostate cancer: phase II multicenter
clinical trial. World J Urol. 31:1123–1128. 2013. View Article : Google Scholar : PubMed/NCBI
|
|
28
|
Goto E, Masuzaki R, Tateishi R, et al:
Value of post-vascular phase (Kupffer imaging) by contrast-enhanced
ultrasonography using Sonazoid in the detection of hepatocellular
carcinoma. J Gastroenterol. 47:477–485. 2012. View Article : Google Scholar : PubMed/NCBI
|
|
29
|
Chiou HJ, Chou YH, Chen WM, Chen W, Wang
HK and Chang CY: Soft-tissue tumor differentiation using 3D power
Doppler ultrasonography with echo-contrast medium injection. J Chin
Med Assoc. 73:628–633. 2010. View Article : Google Scholar : PubMed/NCBI
|
|
30
|
Metheny-Barlow LJ and Li LY: The enigmatic
role of angiopoietin- 1 in tumor angiogenesis. Cell Res.
13:309–317. 2003. View Article : Google Scholar : PubMed/NCBI
|
|
31
|
Bodner G, Schocke MF, Rachbauer F, Seppi
K, Peer S, Fierlinger A, Sununu T and Jaschke WR: Differentiation
of malignant and benign musculoskeletal tumors: combined color and
power Doppler US and spectral wave analysis. Radiology.
223:410–416. 2002. View Article : Google Scholar : PubMed/NCBI
|