Introduction
MicroRNAs are a cluster of conserved, small,
non-coding single-stranded RNAs (18–25 nucleotides), the function
of which are to modulate gene expression by binding to the target
gene with complementary recognition sequences of 3′ untranslated
regions (3′-UTRs), leading to target mRNA degradation or negatively
regulating translational efficiency (1–3).
Growing amounts of evidence indicate that miRNA expression is
altered in almost all types of cancer (4–7). The
deregulation of miRNAs plays an important role in various cellular
processes, such as proliferation, the cell cycle, apoptosis and
metastasis contributing to tumorigenesis (8,9).
Despite growing knowledge in understanding ovarian
cancer etiology, of which more than 85% are of epithelial origin.
Epithelial ovarian cancer (EOC) remains the most lethal form of
gynecological malignancy in the USA (10–12).
EOC are classified into distinct histologic types including serous
(60% of all cancers), mucinous, endometrioid and clear cell (less
common histologies) (13,14). Shih and Kurman divided EOC into 2
types (15), type I includes
low-grade serous, low-grade endometrioid, mucinous and clear cell
carcinomas, and type II EOC includes the high-grade types (15).
The molecular mechanisms that contribute to the
tumor progression such as proliferation and metastasis still need
further exploring. We focused on ZEB2/SIP1, which are potent
repressors of E-cadherin expression, through binding to CACCT(G)
motif in the E-cadherin promoter (16) and considered to be a key factors of
epithelial-mesenchymal transition (EMT) (17). EMT are believed to be the initial
step of tumor metastasis, during EMT epithelial cells lose their
differentiated epithelial characteristics, and acquire mesenchymal
features, such as motility, and invasiveness (18). ZEB2 plays important role in the
development of a variety of cancers, such as gastric, squamous,
breast, non-small cell lung and ovarian carcinomas (19–21).
Besides E-cadherin, other genes coding for crucial proteins such as
plakophilin 2 involved in tight junctions were found to be
repressed by ZEB2 (17). Recently,
vimentin was reported to be upregulated by ZEB2, another
mesenchymal marker, which is associated with breast tumor cell
migration and invasion in a study by Bindels et al (22).
SET domain containing 7 (SET7) is a lysine
methyltransferase with the function of methylation histone and
non-histone proteins. By which it has diverse functions in
transcription regulation, diabetes, DNA repair, tumor metastasis,
proliferation and genome integrity (23–26).
The activity of SET7 is tightly controlled through
post-translational modifications, including ubiquitination,
phosphorylation and sumoylation (27,28).
Yet, the role of microRNAs in the regulation of SET7 has not been
discovered.
Considering EMT is a process regulated by numerous
factors, it is reasonable to hypothesize that different miRNAs are
involved in the regulation. However, although the miR-200 familys
in EMT have been well discussed, the roles of other miRNAs are
still poorly understood (29,30).
Thus, there is an urgent need to better understand the role of
miRNA in EOC to develop novel therapeutics for this disease.
Materials and methods
Cell culture
Human ovarian serous cystic adenocarcinoma cell line
OVCAR3 and human serous papillary cystic adenocarcinoma cell line
SKOV3 were purchased from the American Tissue Type Collection
(Manassas, VA, USA). Both cell lines are suitable transfection
hosts. Normal epithelial ovarian cells (NOE095 and HOSEpiC) were
obtained from the Chinese Academy of Sciences. All cells were
cultured in RPMI-1640 medium supplemented with 10% fetal calf serum
(Gibco), 100 IU/ml penicillin and 100 IU/ml streptomycin. These
cell lines were grown at 37°C in a humidified atmosphere with 5%
CO2. For the transfections, cells were grown to 70% and
transfected with plasmids using Lipofectamine 2000 (Invitrogen,
USA) according to the manufacturer’s recommendation.
Clinical specimens
A total of 60 cases of ovarian cancer specimens and
their adjacent normal tissues were obtained from Xiangya hospital.
The age ranged from 28 to 55, the average was (34±8). The patients
who had received radiation or chemotherapy prior to the surgery
were excluded. The tissue samples were stored in liquid nitrogen.
The survival times were calculated from the operation day to death,
via the evaluation of recurrence and metastasis. Samples were
selected from patients with complete clinicopathologic information.
The study was approved by the Xiangya hospital ethics
committee.
Antibodies and siRNAs
Primary antibodies used were rabbit anti-ZEB2
(Sigma-Aldrich), mouse anti-SET7 (Abcam) and rabbit anti β-actin
(Sigma-Aldrich). β-actin was used for normalization. The small
interfering RNAs (siRNA) targeting human ZEB2, SET7, control siRNA
were from (Sigma-Aldrich), miR-153 mimics were synthesized by
Shanghai GeneChem Inc. (Shanghai, China), miR-153 inhibitors and
inhibitor negative control (anti-miR-NC) were obtained from
Dharmacon.
Transfection of miRNA mimics and
inhibitors
Cells were seeded in a 6-well plates and transfected
with synthetic miRNA-153 mimics or miR-153 inhibitors or
miR-control or inhibitor-control at 3×10⁵ cells/well
with a final concentration of 100 nM using Lipofectamine 2000,
according to the instructions provided by the manufacturer. Total
RNA were collected 2 days post-transfection, and protein 3 days,
transfection efficiency was monitored by qRT-PCR. The sequences of
miR-153 were as follows: sense, 5′-UUGCAUAGUCACAAAAGUGAUC-3′ and
antisense, 5′-GAUCACUUUUGUGACUAUGC AA-3′. For miRNA analysis,
real-time PCR was performed using PrimeScript® miRNA
RT-PCR kit (Takara) according to the manufacturer’s instructions.
All miRNA data are expressed relative to a U6 small nuclear RNA
from the same sample.
RNA extraction and real-time PCR
Total RNA was extracted using TRIzol (Invitrogen),
and total RNA was extracted using a high Pure miRNA Isolation kit
(Roche) according to the manufacturer’s instructions, for analysis
of SET7 and ZEB2 messenger RNA (mRNA) expression, RNA were reverse
transcribed to cDNA using 1 µg of total RNA with M-MLV
reverse transcriptase, according to the manufacturer’s
instructions. The specific primers for SET7, ZEB2 and β-actin were
as follows: SET7 forward, 5′-CCTCACTTTGAACTGATGCC-3′ and reverse,
5′-CAGCAACATAAACCCTTTCTG-3′; ZEB2 forward, 5′-AGGAGCTGTCTCGCCTTG-3′
and reverse, 5′-GGCAAAAGCATCTGGAGTTC-3′; and β-actin forward,
5′-TGGCACCCAGCACAATGAA-3′ and reverse,
5′-CTAAGTCATAGTCCGCCTAGAAGCA-3′; β-actin served as the internal
control.
Plasmid construction and luciferase
assays
The wild-type and mutant SET7 or ZEB2 3′-UTR were
amplified by PCR and cloned in pMIR-Report (Ambion) to generate a
series of reporter constructs with firefly luciferase. The
luciferase assays were performed in OVCAR3 cells as described
previously, OVCAR3 cells treated with control, miR-153 mimics, or
miR-153 inhibitors were transfected with wild-type or mutants of
SET7 or ZEB2 3′-UTR luciferase reporters along with Renilla
plasmid, using Lipofectamine LTX-Plus (Invitrogen). Forty-eight
hours after transfection, the firefly and Renilla
luciferases were assayed according to the manufacturer’s protocol
(Promega), and the firefly luciferase activity was normalized to
that of Renilla luciferase. Each experiment was repeated in
triplicate. The amount of DNA was kept constant by addition of
empty vector in each transfection.
Western blotting
Cells were harvested 48 h after infection in each
group and protein concentration was determined using the
bicinchoninic acid (BCA). Subsequently, 30 µg protein were
run by 10% SDS-PAGE gel and transferred to NC membranes. NC
membranes were blocked by 5% skim milk for 1 h, then incubated
overnight at 4°C with primary antibodies, including ZEB2 (1:1,000),
SET7 (1:1,000) and β-actin (1:500). Goat anti-rabbit secondary
antibodies (1:5,000) or goat anti-mouse secondary antibodies
(1:3,000) and Western Blotting Luminol Reagent (Santa Cruz
Biotechnology) was used to visualize the protein bands.
Colony formation assay
A total of 5,000 cells were inoculated in 6-well
plates in 1.5 ml of RPMI-1640 medium supplemented with 10% fetal
bovine serum (FBS), after the infection for 3 days. The medium was
changed at the interval of 3 days; after 10 days of culturing, the
colonies (which were a cluster of cells seen under the microscope)
formed, the plates were washed with phosphate buffered-saline (PBS)
and fixed in 4% paraformaldehyde at 37°C for 30 min, after which
the colonies were stained with 0.005% crystal violet (Sigma) in PBS
for 15 min, washed and then air-dried. The colonies were counted
using microscopy (Olympus, Tokyo, Japan). This experiment was
performed in triplicate.
Wound-healing assay
SKOV3 cells were seeded in 12-well plates and
cultured to form a confluent monolayer. Wounds (2-mm) were made
with a sterile plastic scraper, the floating cells were washed away
three times with PBS. Images were captured at indicated time points
after wounds were made. After incubation in a serum-free medium for
24 h, to exclude the impact of serum medium on proliferation,
cultures were observed and images were captured under a microscope.
At least five randomly chosen areas were measured, and repeated
three times.
Transwell invasion assay
The Transwell invasion assays were performed using
the Transwell chamber (8-µm pore size, for 24-well plates;
Millipore) with a Matrigel-coated filter. OVCAR3 cells were
transfected with control, miR-153 mimics or miR-153 inhibitors
with/without ZEB2 cDNA lacking 3′-UTR. A total of 100 µl of
the cell suspension (50,000 cells) with serum-free medium was added
to the upper chamber of the Transwell, and 500 µl of
RPMI-1640 containing 10% FBS was added to the lower compartment.
After incubation for 24 h, cells on the upside were removed using
cotton swabs, and the invasive cells on the lower side were fixed,
stained with 0.1% crystal violet solution, and counted using light
microscopy. The experiments were repeated three times.
Bioinformatics analysis and statistical
analysis
The bioinformatics method was used to predict the
potential target genes of miR-153. The microRNA.org (http://www.microrna.org/microrna/), miRDB
(http://mirdb.org/cgi-bin/) and
TargetScan (http://www.targetscan.org/) databases were used, SET7
and ZEB2 was considered as the candidate gene.
Statistical significance was assessed by comparing
mean values (± SD) using a Student’s t-test for independent groups.
P<0.05 were considered to indicate a statistically significant
result. One-way analysis of variance (ANOVA) with SNK-q test for
multiple comparisons was used to analyze the data from the
Transwell migration assay and western blotting using SPSS 15.0
software. *P<0.05, **P<0.01.
Results
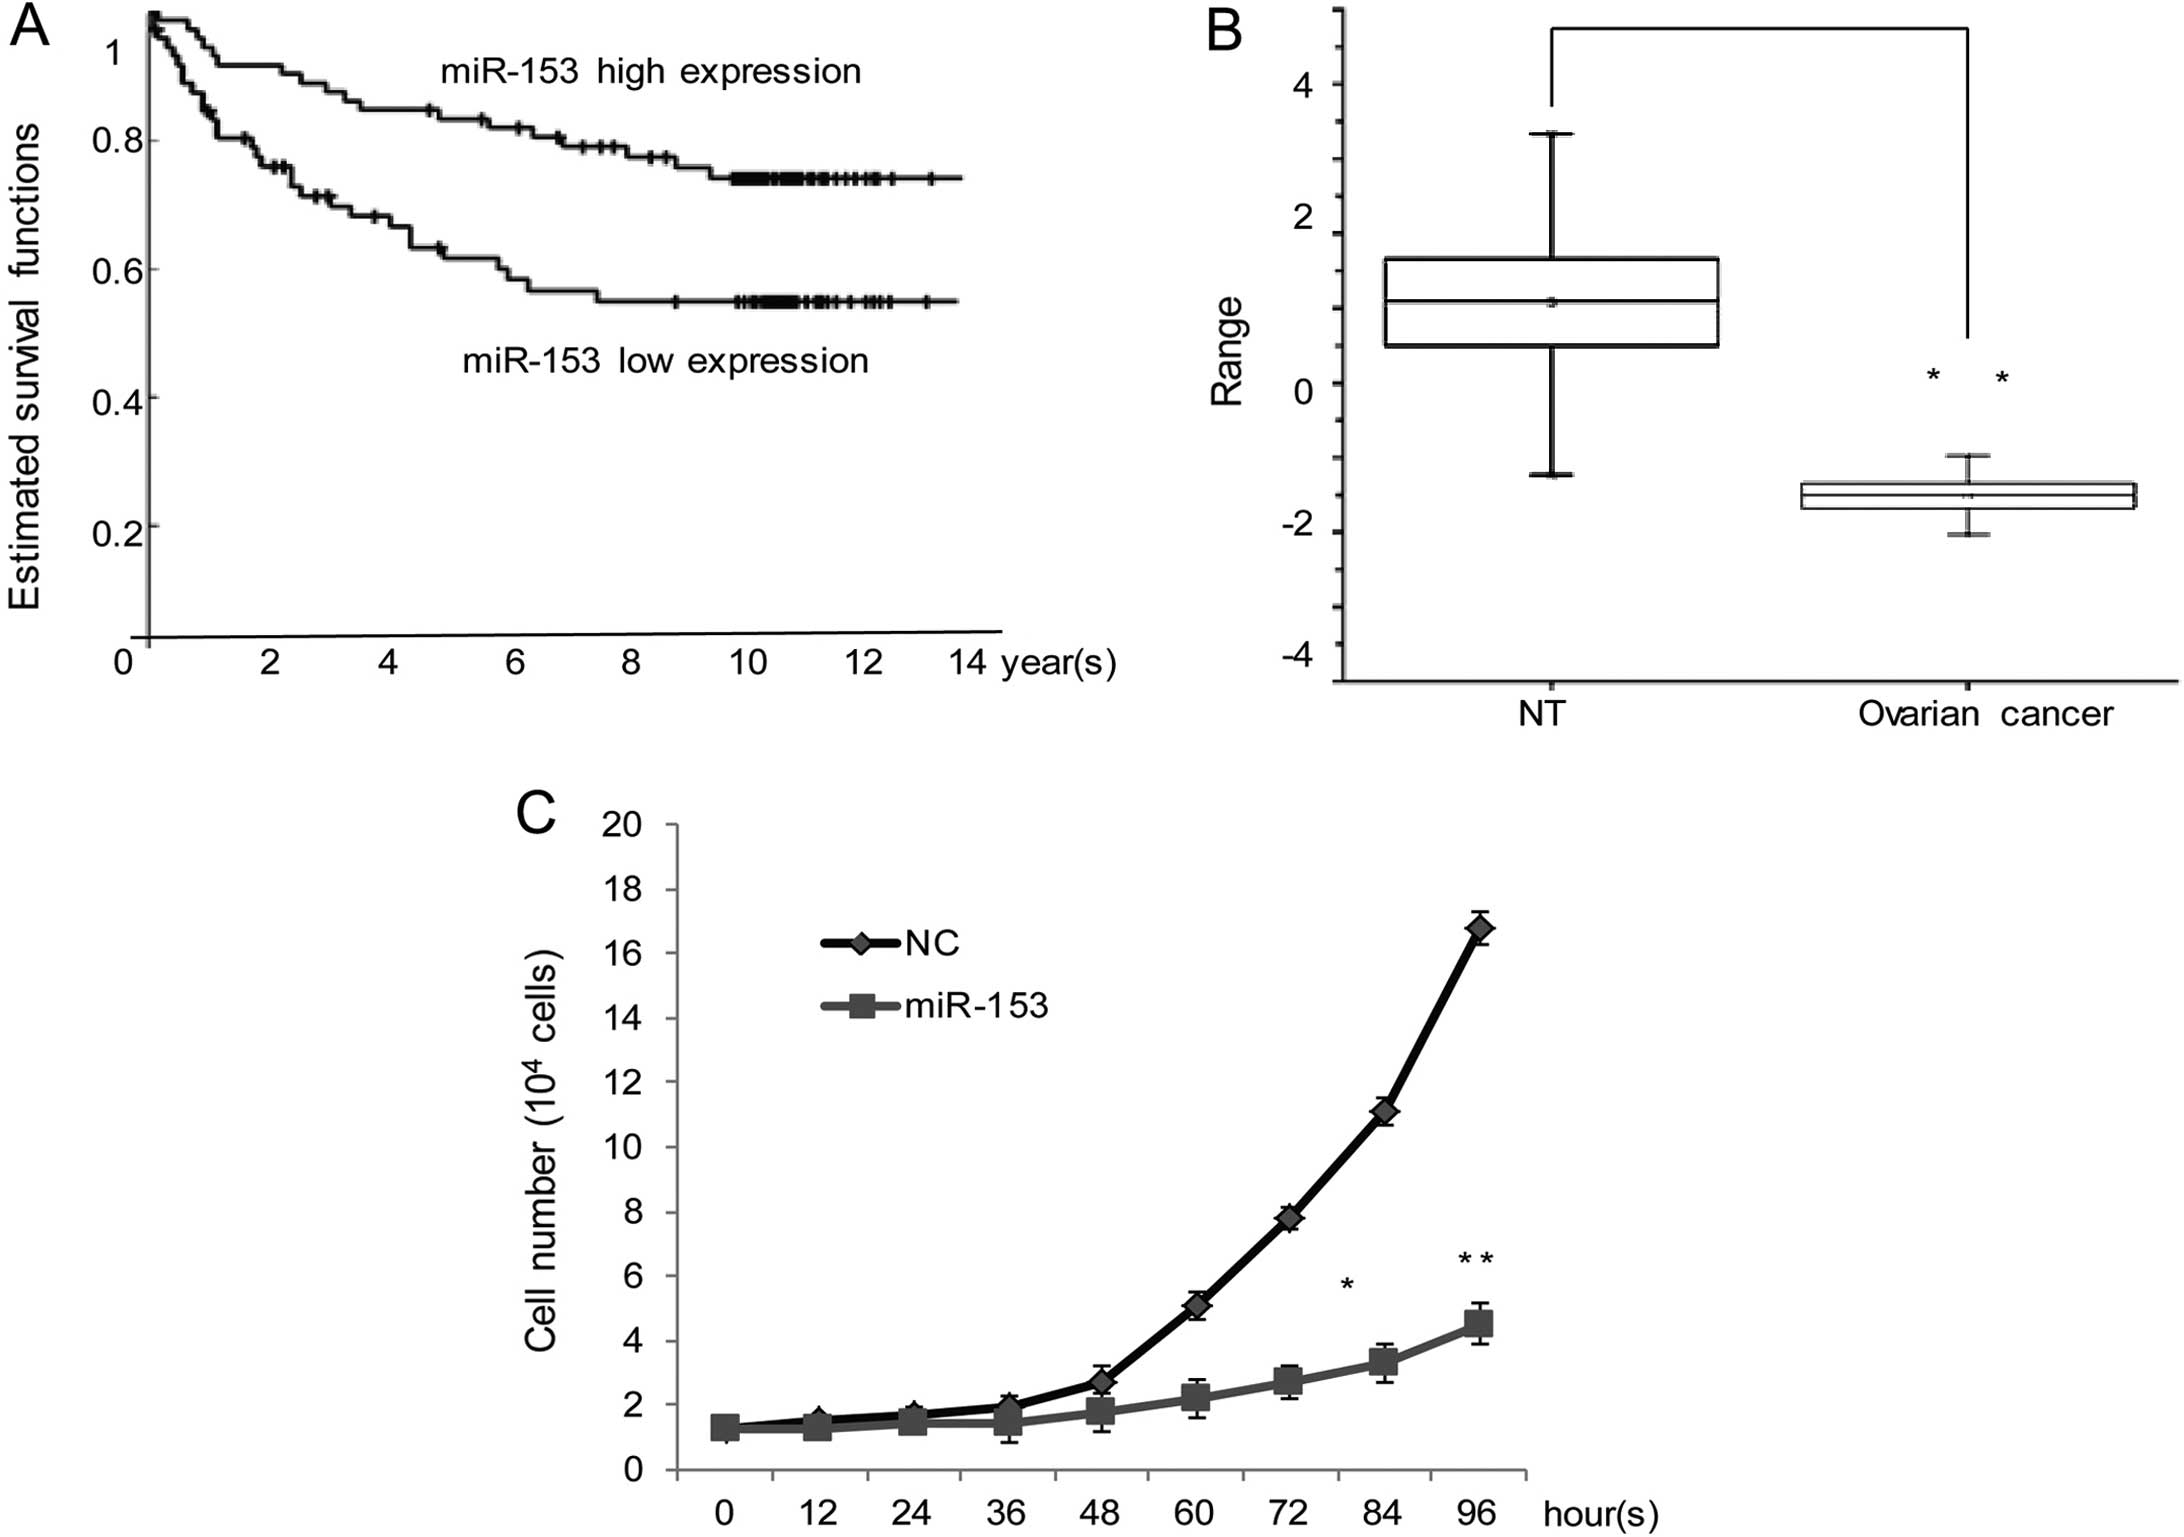
miR-153 is a potential tumor suppressor
in ovarian cancer
In order to explore the role of miR-153 during the
progress of ovarian cancer, we first enrolled 60 ovarian cancer
patients. They were divided into two groups based on their miR-153
expression levels: those with less than median of miR-153
expression levels and those with more than or equal to median of
miR-153 expression levels. The higher expression of miR-153
indicates a better overall 5-year survival (the hazard ratio,
2.4183, P<0.05) Kaplan-Meier curves were drawn, the details are
shown in Fig. 1A.
To investigate the role of miR-153 in human ovarian
cancer, the expression of miR-153 was compared using qRT-PCR in
ovarian cancer samples and corresponding noncancerous tissues. The
results showed that expression level of miR-153 in ovarian cancer
was significantly lower (median, −1.5099; max, −0.97469; min;
−2.0385) than in non-cancerous tissues (median, 1.1019]; max,
3.3357; min, −1.2377) (P<0.01, Fig.
1B). Growth assays in cells transfected with miR-control or
miR-153, OVCAR3 cells with miR-153 showed an obvious growth
inhibition (Fig. 1C). To further
explore the miR-153 impact on migration and invasion, a
wound-healing assay was conducted. As shown in Fig. 1D, 24 h after the wound were created
and measured, cells with miR-153 were significantly impaired in
wound recovery, compared with the control cells. To further assess
the effects on cell invasion, Transwell assay was performed.
Migrated cells infected with miR-153 counts for one third of those
infected with miR-control (Fig.
1E), the above data show miR-153 functions as a potential tumor
suppressor in ovarian cancer.
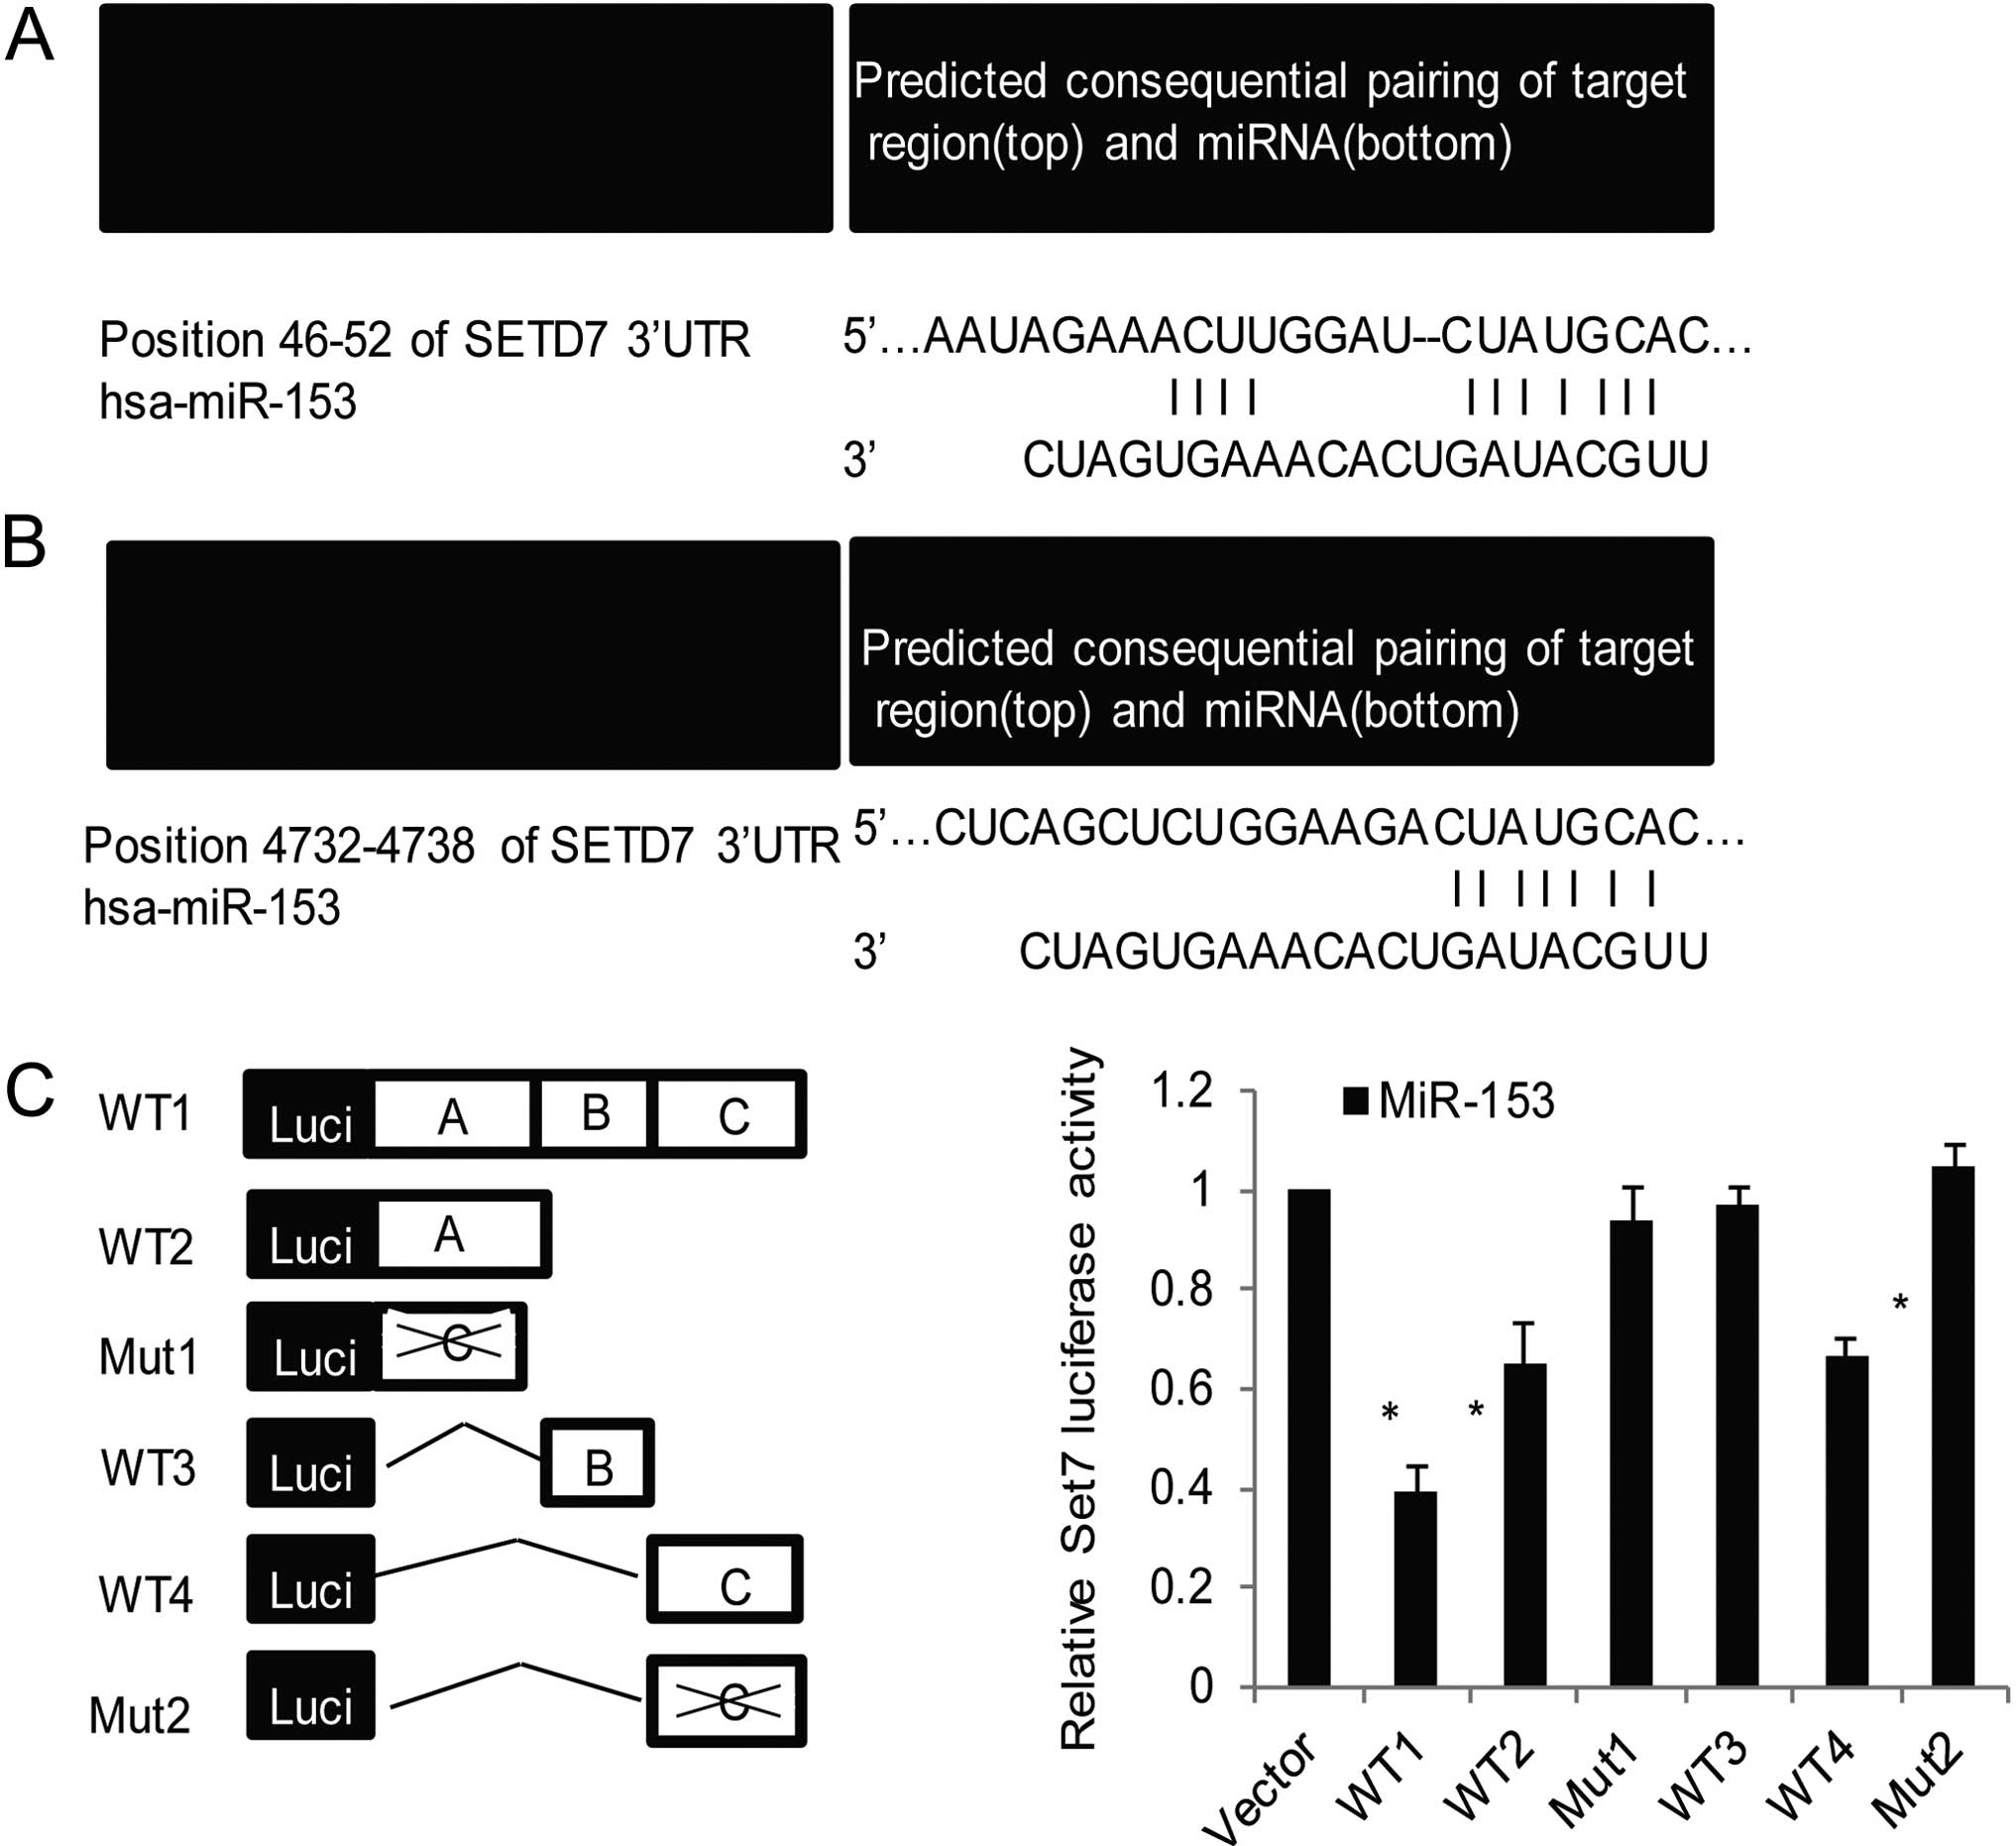
miR-153 regulates the expression and mRNA
degradation of the target gene SET7
As reported, miRNAs silence genes either by
translational inhibition or mRNA destabilization (31,32).
Connecting with the bioinformatic prediction, with analyses based
on three public algorithms (TargetScan, PicTar and miRanda),
indicated that the SET7 3′-UTR harbors two potential miR-153 target
sites (positions 46–52 and 4732–4738), both positions are highly
conserved regions in different species (Fig. 2A and B). These sites are completely
complementary to the human miR-153 heptamer motif
5′-UGCAUAG-3′.
 | Figure 2miR-153 regulates the expression and
mRNA degradation of the target gene SET7. (A) Potential targets for
miR-153 were predicted through PicTar, TargetScan and miRanda.
TargetScan represent the position 46–52 of SET7 3′-UTR was a highly
conserved sequence considered to be one of the candidate targets
for miR-153. (B) Position 4732–4738 of SET7 3′-UTR was predicted as
another target with high score. The miR-153 seed sequence
(5-UGCAUAG-3) and the corresponding complementary sequences of SET7
3′-UTR are shaded. (C) The diagram shows luciferase reporter
constructs for full-length wild-type (wt-1), deletions of wild-type
(wt-2, -3 and -4), and two point mutants (mut-1 and 2) of SET7
3′-UTR. Luciferase reporter assays were performed to identify the
binding of miR-153 to SET7 3′-UTR. OVCAR3 cells were co-transfected
with negative control (NC) or miR-153 mimics (miR-153) together
with the luciferase gene driven by different SET7 3′-UTR sequences.
The normalized luciferase activity was the control. Each bar
represents the mean ± SD for triplicate experiments. (D) OVCAR3 or
SKOV3 cells were transfected with control or miR-153 mimics for 48
h. The endogenous SET7 mRNA and protein expression were measured by
real-time qPCR or western blotting. The relative level of SET7 mRNA
was normalized to β-actin. (E) Respectively, OVCAR3 or SKOV3 cells
were transfected with control-inhibitors, or miR-153 inhibitors,
the relative mRNA and protein expression were measured. (F) miR-153
destabilizes SET7 mRNA. OVCAR3 and SKOV3 cells were transfected
with control, miR-153 mimics or miR-153 inhibitors for 36 h and
then treated with actinomycin D (5 µg/ml) for the indicated
times. The endogenous SET7 mRNA was measured by qPCR, and
normalized to β-actin. Each bar represents the mean ± SD for
triplicate experiments. 3′-UTR, 3′ untranslated region. |
To prove the proposition that SET7 is a downstream
target of miR-153, reporter assays were carried in OVCAR3 cells.
Luciferase gene is driven by wild-type or mutated SET7 3′-UTR
sequences, including the full-length or three deletions of the
wild-type SET7 3′-UTR or 2 mutants (with three point mutations) of
SET7 3′-UTR (Fig. 2C, left panel).
The results demonstrated >60% reduction in luciferase activity
with the full-length wild-type (wt-1) SET7 3′-UTR in OVCAR3 cells
transfected with miR-153. Consistent with our prediction, the site
A including the position 46–52 or site C including the position
4732–4738 plays a more important role in the binding of miR-153 to
SET7 3′-UTR, as there was more evident decrease in luciferase
activity with wt-2, wt-4 compared with that of wt-3 (Fig. 2C, right panel), point mutation of
mut-1 with site A and mut-2 with site C disrupted miR-153
repressive activity, further indicated the binding of miR-153 to
sites A and C of SET7 3′-UTR was specific. Taken together, these
results suggest that miR-153 binds to SET7 3′-UTR. We then
investigated whether binding to the SET7 3′-UTR has an effect on
the expression of SET7 mRNA and protein. For this purpose, OVCAR3
and SKOV3 cells were transfected with control or miR-153, the
results showed that miR-153 overexpression was decreased by more
than half in SET7 mRNA in the two cell lines, respectively
(Fig. 2D, left panel), and western
blot analysis showed an obvious reduction of SET7 protein
expression (Fig. 2D, right panel).
Consistently, OVCAR3 and SKOV3 cells transfected with miR-153
inhibitors resulting in an increase in SET7 mRNA by real-time
quantitative PCR (qPCR) (Fig. 2E,
left panel) and a significant rise in SET7 protein expression by
western blotting (Fig. 2E, right
panel). To further evaluate the impact of miR-153 on SET7 mRNA
stability, OVCAR3 and SKOV3 cells treated with transcription
inhibitor actinomycin D were then transfected with miR-153 mimics
or miR-153 inhibitors. Real-time qPCR showed that miR-153
overexpression led to a reduced SET7 mRNA half-time (from 8 to4 h)
while an increased SET7 mRNA half-time was due to miR-153 depletion
(Fig. 2F), further supporting the
fact that miR-153 represses SET7 expression through destabilization
of SET7 mRNA.
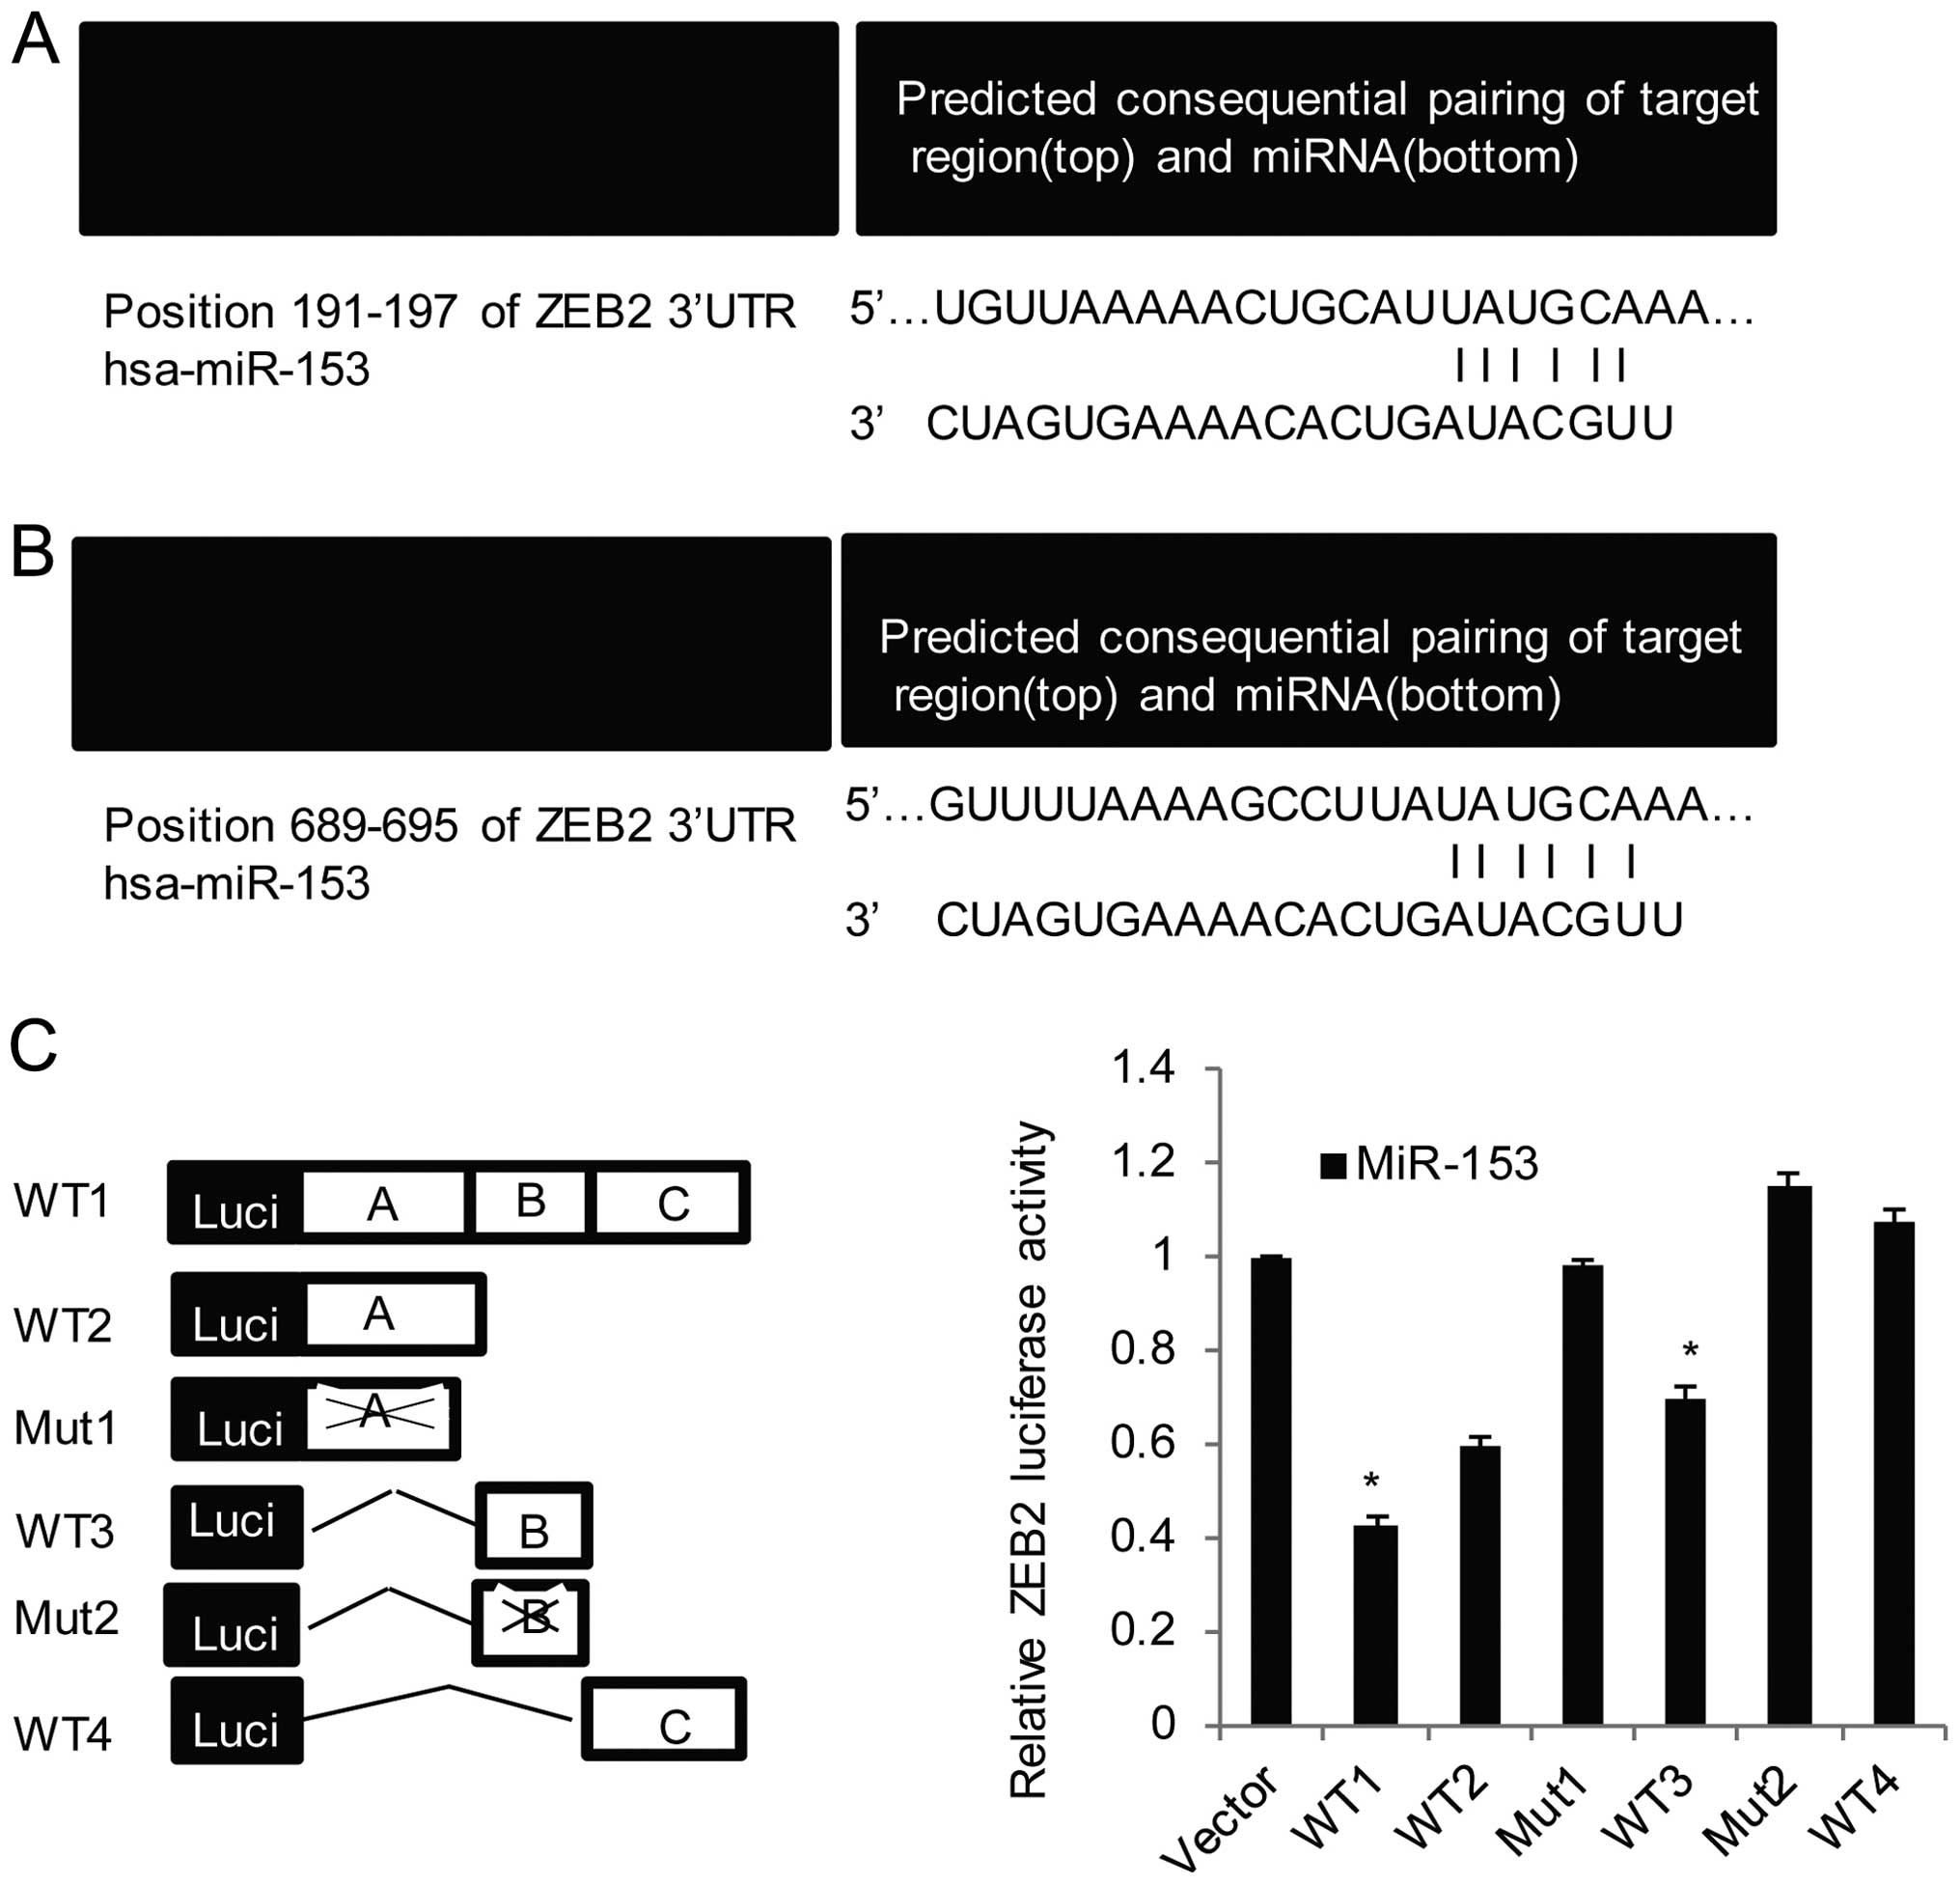
ZEB2 is a downstream target of miR-153
directly binding to its 3′-UTR
To identify ZEB2 as a target of miR-153, using
bioinformatics method as the way to discuss SET7, also two highly
conserved regions were found located in the ZEB2 3′-UTR (positions
689–695 and 191–197), (Fig. 3A and
B). The motif 5′-UGCAUA-3′ of human miR-153 are fully
complementary with ZEB2 3′-UTR.
Further, reporter assays were carried out in OVCAR3
cells with the luciferase gene driven by either four wild-type or
two mutated ZEB2 3′-UTR sequences (Fig.
3C, left panel), the results indicated the sites A (including
position 191–197) and B (including position 689–695) play a more
important role in the binding of miR-153, as there were more
evident decreases in luciferase activity with wt-2, and wt-3
compared with that of wt-4. Further, the relative mutation (mut-1
with site A and mut-2 with site B) blocked miR-153 repressive
activity on reporter gene expression (Fig. 3C, right panel). Real-time
quantitative PCR and western blot analysis showed OVCAR3 and SKOV3
cells with miR-153 overexpression (Fig.
3D) or miR-153 inhibition (Fig.
3E), the mRNA or protein level of ZEB2 reduced or increased.
The influence of ZEB2 mRNA stability by miR-153 were further
measured, as well as SET7, miR-153 overexpression also led to a
reduced ZEB2 mRNA half-life (from 12 to 6 h) while miR-153
inhibition was associated with an increased ZEB2 mRNA half-life
(Fig. 3F). As a conclusion, the
miR-153 represses ZEB2 expression may also be through
destabilization of ZEB2 mRNA, similarly to SET7.
miR-153 suppresses proliferation and
invasive potential of ovarian cancer cells by downregulating SET7
and ZEB2
Furthermore, to examine whether miR-153 regulated
EOC cell line proliferation by suppressing SET7 in vitro,
proliferation assay was detected by colony formation assay. OVCAR3
cell lines were transfected with NC (mimics negative control),
miR-153 mimics, miR-153 mimics plus SET7 overexpression, miR-153
mimics plus ZEB2 overexpression, or inhibitor NC, miR-153
inhibitor, miR-153 inhibitor plus siSET7, miR-153 inhibitor plus
siZEB2, respectively. The transfection efficiency was validated
using qRT-PCR (Fig. 4A). The colony
formation assay showed that miR-153 overexpression or
downregulation affected cell proliferation, the upregulation of
miR-153 inhibition the colony formation was reduced by SET7
overexpression and the downregulation of miR-153 expression
promoted proliferation ability could be blocked by the additional
SET7 knockdown (Fig. 4B). The above
data suggested that miR-153 that could inhibit OVCAR3 cell line
proliferation by the suppression of SET7 in vitro.
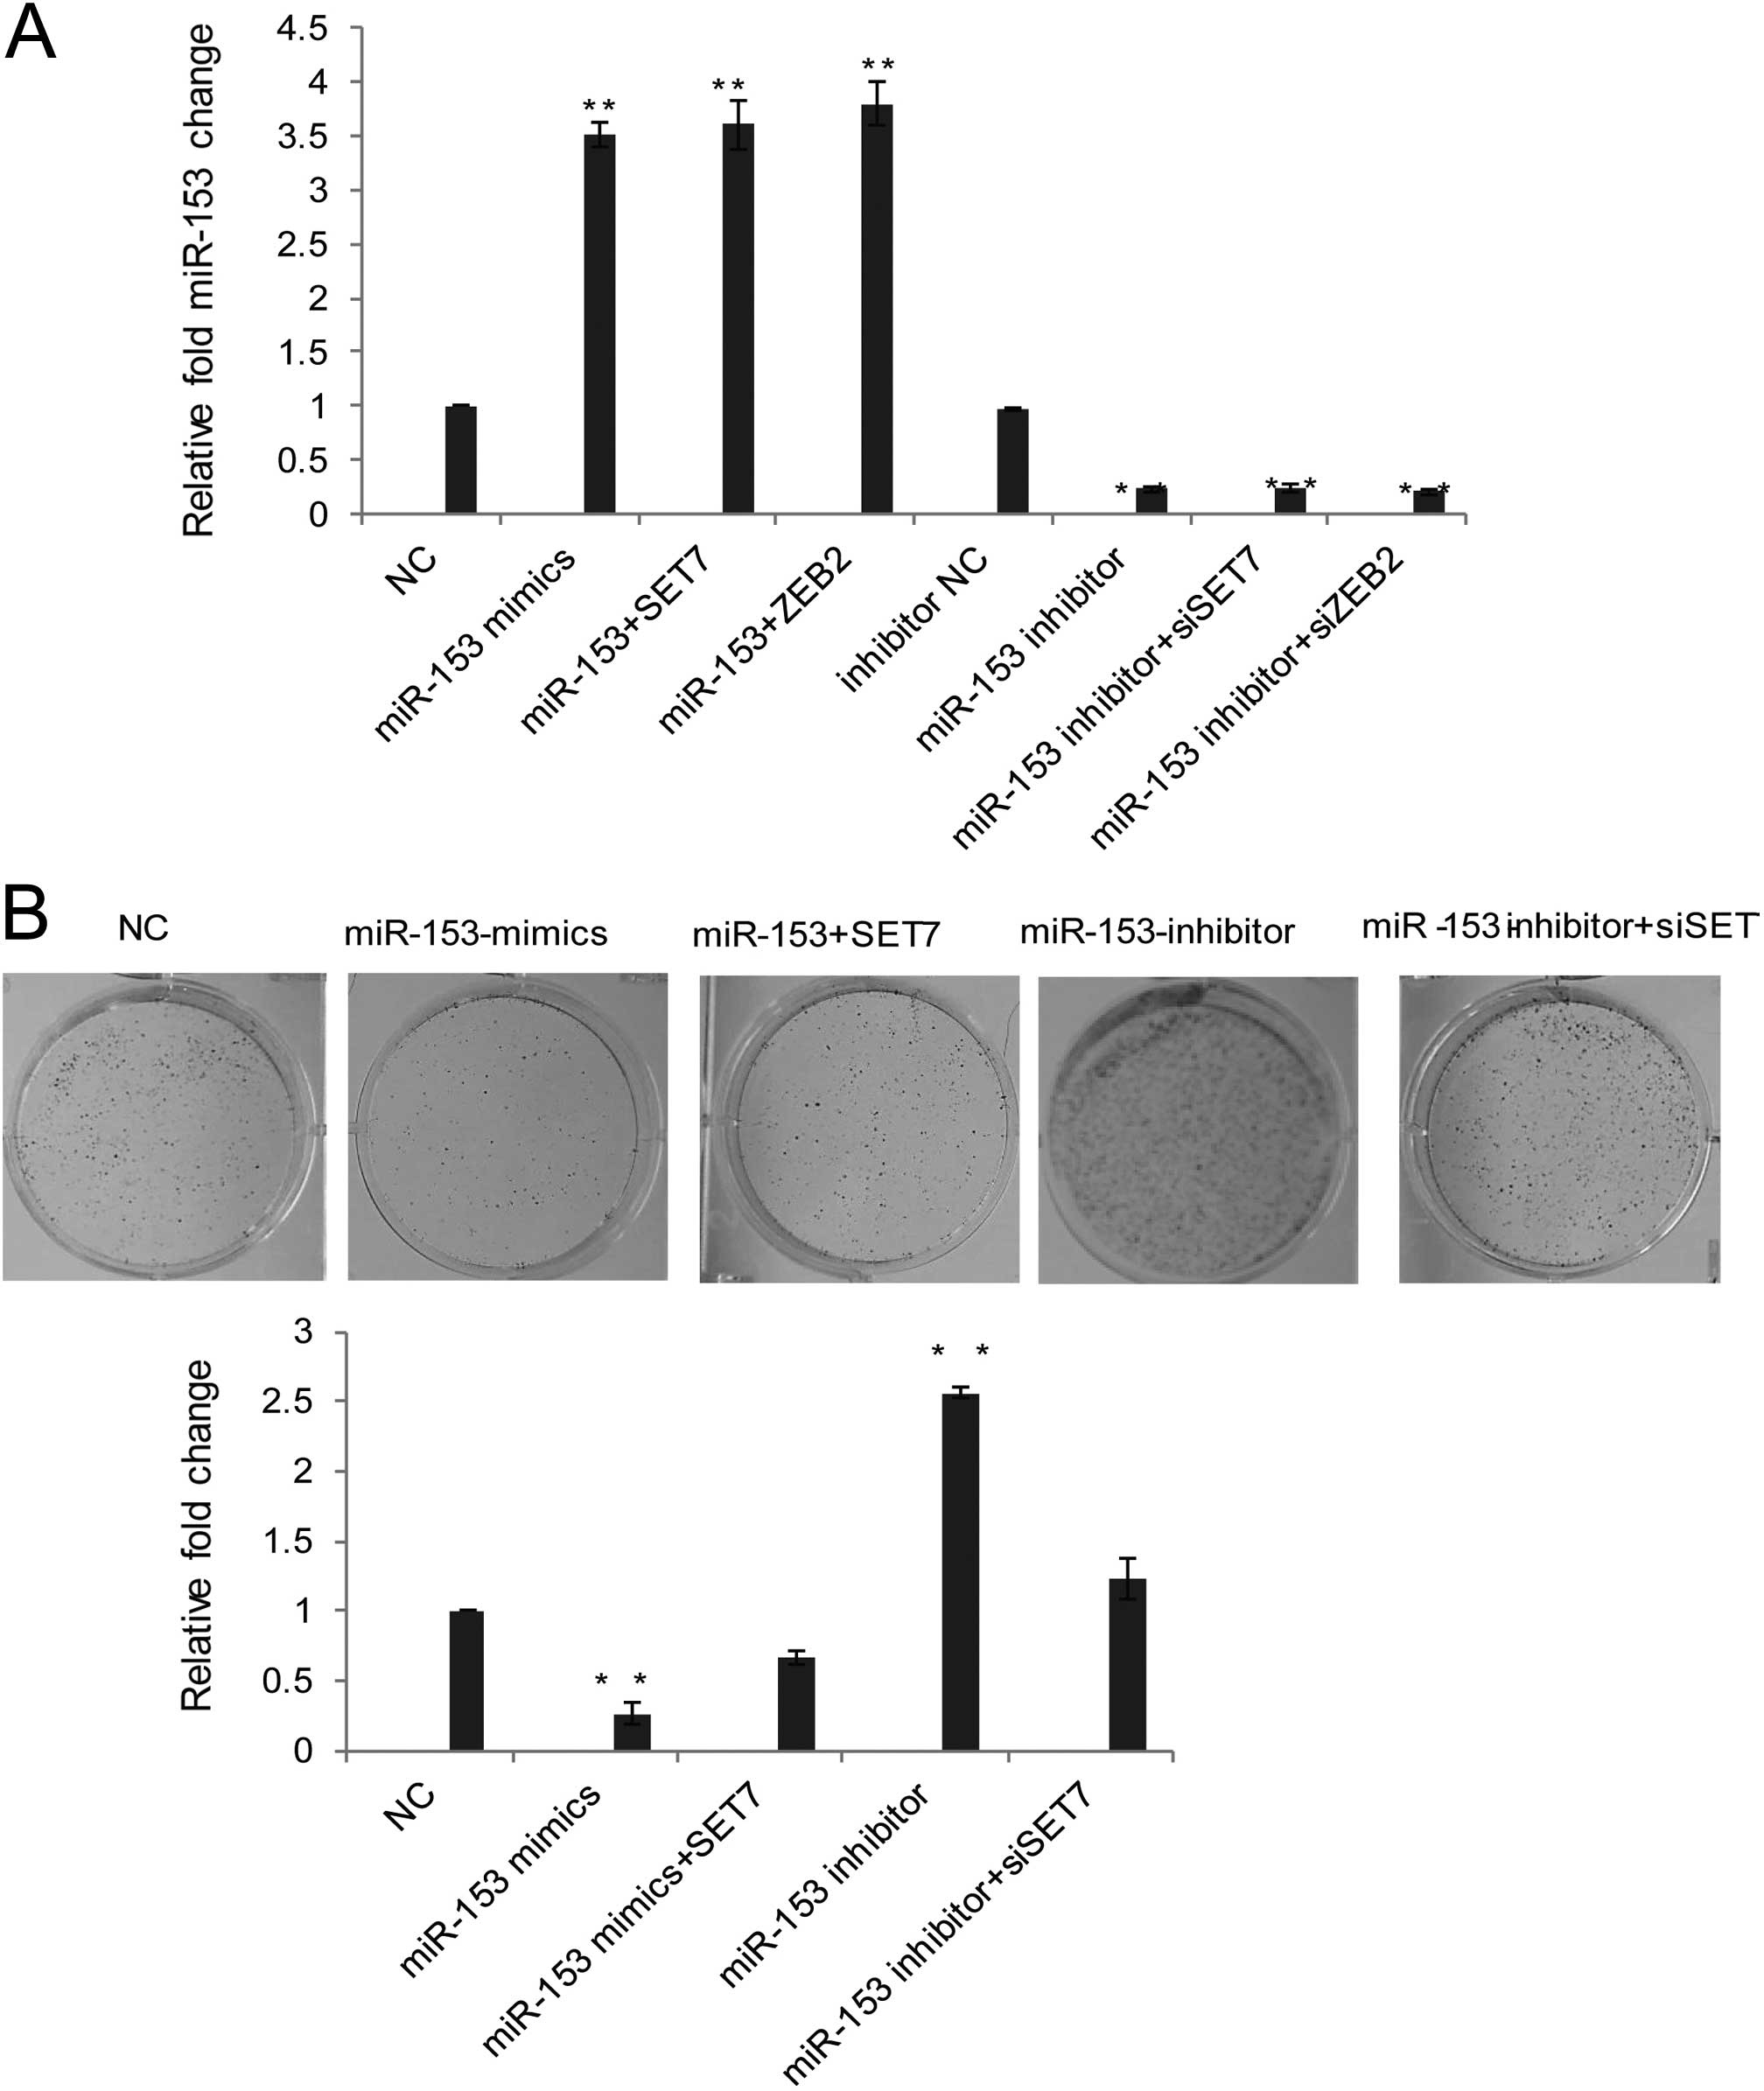 | Figure 4miR-153 suppresses proliferation and
invasive potential of ovarian cancer cells by downregulating SET7
and ZEB2. (A) The results of miR-153 expression in cell lines
transfected with NC (mimics negative control), miR-153 mimics,
miR-153 mimics plus SET7 overexpression, miR-153 mimics plus ZEB2
overexpression, or inhibitor NC, miR-153 inhibitor, miR-153
inhibitor plus siSET7, miR-153 inhibitor plus siZEB2 were validated
using qRT-PCR. (B) Clone formation assay were carried out with the
relative transfection, then stained with crystal violet.
Representative images are shown. Statistical analysis are presented
as fold-change over the vector. Error bars are the mean ± SD for
triplicate measurements. *P<0.05;
**P<0.01. (C) Wound healing assay was performed as
described in the Materials and methods. Cells treated with miR-153
mimics, miR-153 mimics plus ZEB2, miR-153 inhibitor, miR-153
inhibitor plus siZEB2, NC and inhibitor NC. All experiments were
performed in triplicate and presented as mean ± SD. (D) Transwell
assay was performed as described in the Materials and methods.
Cells treated with miR-153 mimics, miR-153 mimics plus ZEB2,
miR-153 inhibitor, miR-153 inhibitor plus siZEB2, NC and inhibitor
NC. All experiments were performed in triplicate and are presented
as mean ± SD. *P<0.05; **P<0.01
indicate significant difference compared with control group. |
We investigated the effect of miR-153 overexpression
on cell lines invasion using wound healing or Transwell invasion
assay (Fig. 1D and E). Considering
ZEB2 as a key regulator in EMT (20), and as a potential target of miR-153,
in the present study, we further proved the effect of
gain-of-function or loss-of-function of miR-153 and ZEB2 as
downstream target genes on the invasive potential in SKOV3 cells by
wound-healing assays.
The results showed that miR-153 inhibitor-treated
cells were more efficient in wound healing, whereas cells treated
with miR-153 inhibitor plus ZEB2, loss of function was resistant to
wound healing to certain degree, compared with miR-153 inhibitor
only, the representative images (left panel) and the overall
tendency was compared between NC (mimics negative control), miR-153
mimics, miR-153 mimics plus ZEB2 overexpression, or inhibitor NC,
miR-153 inhibitor, miR-153 inhibitor plus siZEB2, respectively
(Fig. 4C). In addition, Transwell
invasion assays showed that miR-153 knockdown promoted the invasion
by 4-fold. Moreover, miR-153-suppressed EMT of EOC cancer cells was
probably mediated by ZEB2, as downregulation of ZEB2 was able to
rescue the effect of knockdown miR-153 on tumor migration and
invasion, however, the overexpression of miR-153 was blocked by
ZEB2 upregulation (Fig. 4D).
Together, these results support the argument that miR-153
suppresses EMT and invasion of ovarian cancer cells and is at least
partially, mediated by targeting ZEB2.
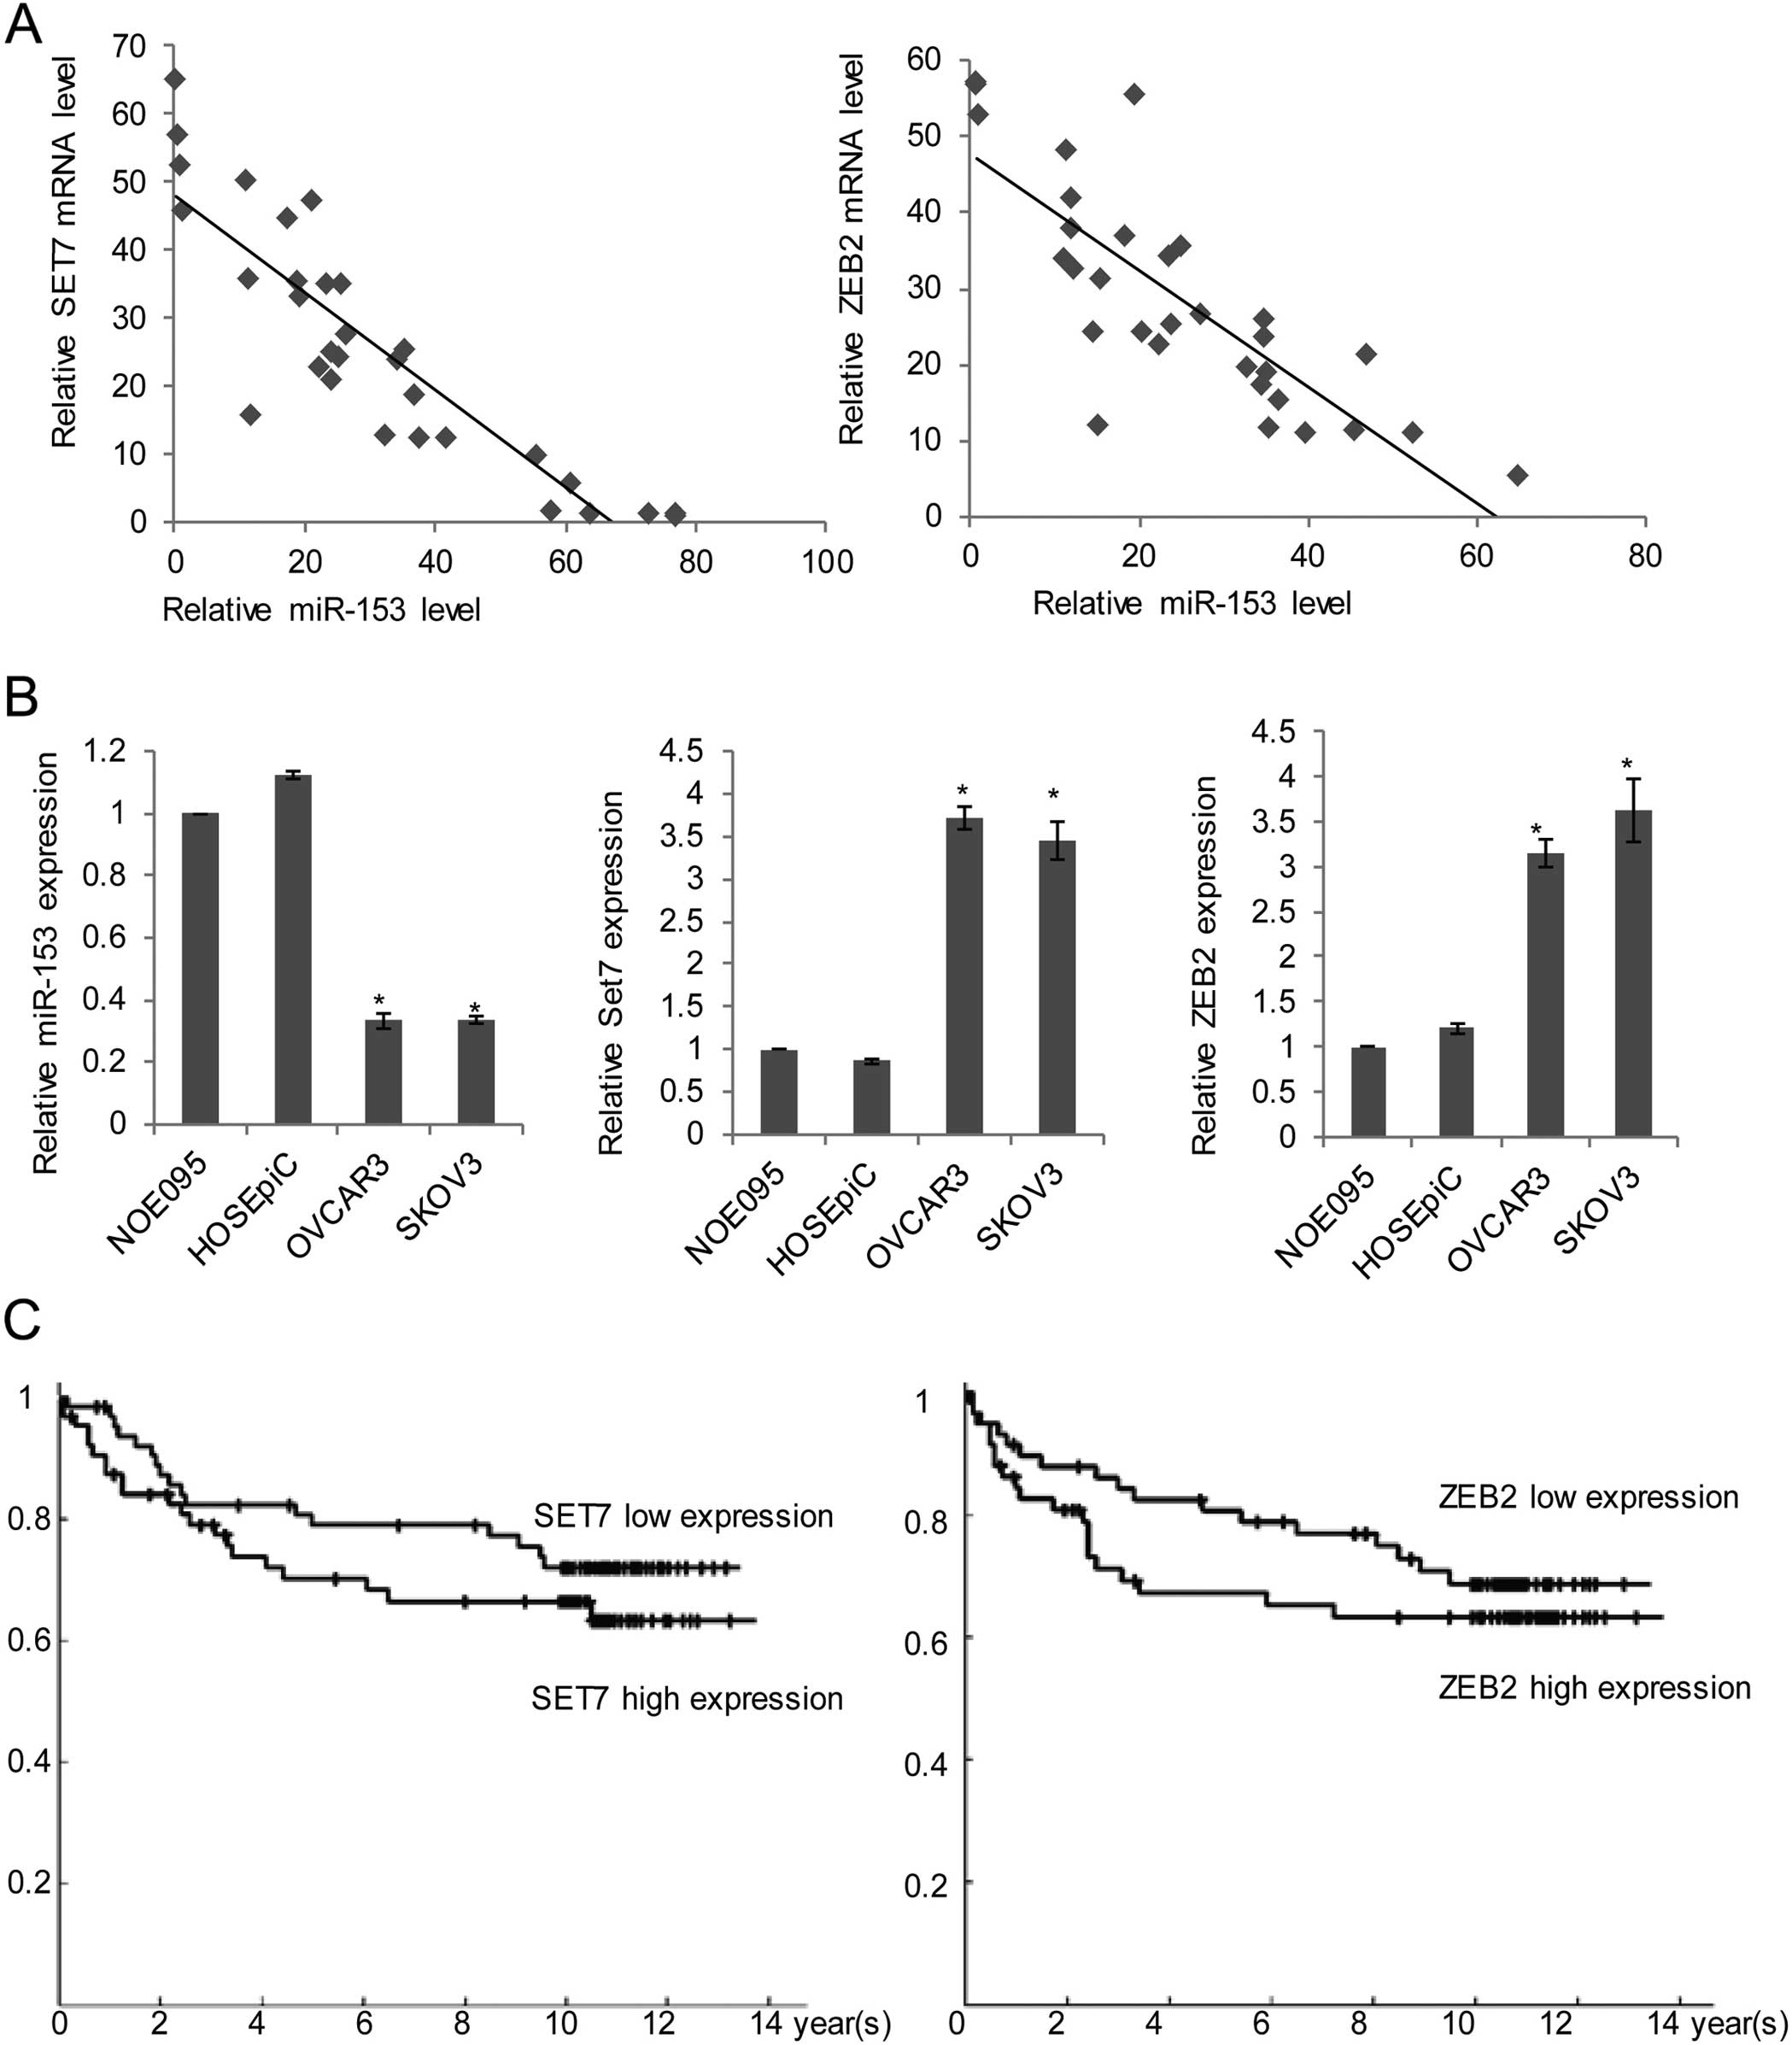
SET7 and ZEB2 are negatively correlated
with miR-153 expression in human ovarian cancer and indicate a
worse survival
Moreover, an inverse correlation was observed
between miR-153 and SET7 (R=0.7141; P<0.001; Fig. 5A, left panel), or miR-153 and ZEB2
(R=0.7669; P<0.0001; Fig. 5A,
right panel) in ovarian cancer samples. To further explore the role
of miR-153 and SET7 or ZEB2 expression in ovarian cancer
tumorigenesis, the expression of miR-153 and SET7 or ZEB2 was
examined in two ovarian cancer cell lines (OVCAR3 and SKOV3) and
two normal ovarian cell lines using qRT-PCR. As shown in Fig. 5B, left panel, the expression of
miR-153 was substantially reduced in OVCAR3 and SKOV3 cell lines
derived from ovarian cancer, compared with the normal NOE095 and
HOSEpiC cell lines. However, the expression of SET7 and ZEB2 was
significantly increased in OVCAR3 and SKOV3, comparing with NOE095
and HOSEpiC. The tendency was negatively correlated with miR-153
(Fig. 5B, middle and right panel).
The result of correlation analysis suggested a potential functional
link of miR-153 and SET7, or miR-153 and ZEB2. Further, the
patients collected were divided into different groups, based on the
single SET7 or ZEB2 expression level, Kaplan-Meier curves were
drawn (Fig. 5C). As the data
showed, the higher expression of SET7 indicates a worse 5-year
survival (the hazard ratio, 2.3353, P<0.05) (Fig. 5C, upper panel). Similarly, patients
with more than, or equal to median, of ZEB2 expression also had a
worse 5-year survival (the hazard ratio, 2.4134, P<0.05)
(Fig. 5C, lower panel). These
results indicated that by downregulation of SET7 and ZEB2, miR-153
may be involved in the proliferation and metastasis of ovarian
cancer.
Discussion
microRNAs have been reported to be upregulated or
downregulated in a various disease states and specific cell types,
the action of microRNA as either oncogenes or tumor suppressors
depended on the target gene (33,34).
By regulating the target genes with binding to their 3′-UTR, miRNAs
have been proved to play important roles in different cancers
(6,35,36).
Accumulating evidence reveals the crucial role of miRNAs involved
proliferation, invasion, prognosis and other biology processes
(2). The concept of ZEB2 as
powerful regulator of EMT has been widely accepted, and several
miRNAs have also been described as crucial EMT regulators (19).
In the present study, the expression of miR-153 was
lower in EOC tissues than that in the corresponding adjacent areas,
and the upregulation of miR-153 inhibited the proliferation and
invasion of OVCAR3 cell lines (Fig.
1C–E), while the effect of miR-153 overexpression was the
reverse (Fig. 4B–D). Furthermore,
we also discovered that the overexpression of miR-153 diminished
but the knockdown of miR-153 increased SET7/ZEB2 expression level
in OVCAR3 and SKOV3 cell lines. By directly binding the 3′-UTR of
SET7/ZEB2, miR-153 promoted SET7/ZEB2 mRNA degradation. Ectopic
miR-153 expression regulated the expression level of SET7 in the
cell lines (OVCAR3 and SKOV3). SET7 and ZEB2 as potential targets
of miR-153 in ovarian cancer was proved as miR-153 inhibited
ovarian cancer proliferation and invasion via repression of SET7
and ZEB2 in vitro. Furthermore, we discovered that silencing
of SET7 or ZEB2 partially abolished the enhancement of cell
proliferation and invasion induced by downregulated miR-153,
confirmed SET7 and ZEB2 as downstream target genes of miR-153. In
the present study, we found that SET7 and ZEB2 were negatively
associated with miR-153 in EOC tumor tissue and cell lines, higher
expression of SET7 or CARM1 indicated a worse overall 5-year
survival. On the contrary, the higher expression of miR-153
indicates a better overall 5-year survival. The above finding
indicated that miR-153 contributes to regulating
epithelial-to-mesenchymal transition (EMT). Since we are unsure
whether miR-153 has other targets related to EOC proliferation and
invasion, the changes in the development of EOC should not be
attributed as the alteration of a small number of genes. Thus,
further exploration is necessary of the potential role of miR-153
contribution to EOC. In future, miR-153-SET7 and miR-153-ZEB2
pathways may be exploited in a therapeutic approach for the
treatment of ovarian cancer.
References
|
1
|
Bartel DP: MicroRNAs: Target recognition
and regulatory functions. Cell. 136:215–233. 2009. View Article : Google Scholar : PubMed/NCBI
|
|
2
|
Shukla GC, Singh J and Barik S: MicroRNAs:
Processing, maturation, target recognition and regulatory
functions. Mol Cell Pharmacol. 3:83–92. 2011.PubMed/NCBI
|
|
3
|
Behm-Ansmant I, Rehwinkel J and Izaurralde
E: MicroRNAs silence gene expression by repressing protein
expression and/or by promoting mRNA decay. Cold Spring Harb Symp
Quant Biol. 71:523–530. 2006. View Article : Google Scholar
|
|
4
|
Chen Y, Zhang L and Hao Q: Candidate
microRNA biomarkers in human epithelial ovarian cancer: Systematic
review profiling studies and experimental validation. Cancer Cell
Int. 13:862013. View Article : Google Scholar : PubMed/NCBI
|
|
5
|
Lu J, Getz G, Miska EA, Alvarez-Saavedra
E, Lamb J, Peck D, Sweet-Cordero A, Ebert BL, Mak RH, Ferrando AA,
et al: MicroRNA expression profiles classify human cancers. Nature.
435:834–838. 2005. View Article : Google Scholar : PubMed/NCBI
|
|
6
|
Wang JL, Hu Y, Kong X, Wang ZH, Chen HY,
Xu J and Fang JY: Candidate microRNA biomarkers in human gastric
cancer: A systematic review and validation study. PLoS One.
8:e736832013. View Article : Google Scholar : PubMed/NCBI
|
|
7
|
Gaur A, Jewell DA, Liang Y, Ridzon D,
Moore JH, Chen C, Ambros VR and Israel MA: Characterization of
microRNA expression levels and their biological correlates in human
cancer cell lines. Cancer Res. 67:2456–2468. 2007. View Article : Google Scholar : PubMed/NCBI
|
|
8
|
Iorio MV and Croce CM: MicroRNA
dysregulation in cancer: Diagnostics, monitoring and therapeutics.
A comprehensive review. EMBO Mol Med. 4:143–159. 2012. View Article : Google Scholar : PubMed/NCBI
|
|
9
|
Esquela-Kerscher A and Slack FJ:
Oncomirs-microRNAs with a role in cancer. Nat Rev Cancer.
6:259–269. 2006. View
Article : Google Scholar : PubMed/NCBI
|
|
10
|
Reynolds EA and Moller KA: A review and an
update on the screening of epithelial ovarian cancer. Curr Probl
Cancer. 30:203–232. 2006. View Article : Google Scholar : PubMed/NCBI
|
|
11
|
Ozols RF, Bookman MA, Connolly DC, Daly
MB, Godwin AK, Schilder RJ, Xu X and Hamilton TC: Focus on
epithelial ovarian cancer. Cancer Cell. 5:19–24. 2004. View Article : Google Scholar : PubMed/NCBI
|
|
12
|
Shan W and Liu J: Epithelial ovarian
cancer: Focus on genetics and animal models. Cell Cycle. 8:731–735.
2009. View Article : Google Scholar : PubMed/NCBI
|
|
13
|
Farley J, Ozbun LL and Birrer MJ: Genomic
analysis of epithelial ovarian cancer. Cell Res. 18:538–548. 2008.
View Article : Google Scholar : PubMed/NCBI
|
|
14
|
Miyamoto M, Takano M, Goto T, Kato M,
Sasaki N, Tsuda H and Furuya K: Clear cell histology as a poor
prognostic factor for advanced epithelial ovarian cancer: A single
institutional case series through central pathologic review. J
Gynecol Oncol. 24:37–43. 2013. View Article : Google Scholar : PubMed/NCBI
|
|
15
|
Shih IeM and Kurman RJ: Ovarian
tumorigenesis: A proposed model based on morphological and
molecular genetic analysis. Am J Pathol. 164:1511–1518. 2004.
View Article : Google Scholar : PubMed/NCBI
|
|
16
|
Comijn J, Berx G, Vermassen P, Verschueren
K, van Grunsven L, Bruyneel E, Mareel M, Huylebroeck D and van Roy
F: The two-handed E box binding zinc finger protein SIP1
downregulates E-cadherin and induces invasion. Mol Cell.
7:1267–1278. 2001. View Article : Google Scholar : PubMed/NCBI
|
|
17
|
Vandewalle C, Comijn J, De Craene B,
Vermassen P, Bruyneel E, Andersen H, Tulchinsky E, Van Roy F and
Berx G: SIP1/ZEB2 induces EMT by repressing genes of different
epithelial cell-cell junctions. Nucleic Acids Res. 33:6566–6578.
2005. View Article : Google Scholar : PubMed/NCBI
|
|
18
|
Ansieau S, Bastid J, Doreau A, Morel AP,
Bouchet BP, Thomas C, Fauvet F, Puisieux I, Doglioni C, Piccinin S,
et al: Induction of EMT by twist proteins as a collateral effect of
tumor-promoting inactivation of premature senescence. Cancer Cell.
14:79–89. 2008. View Article : Google Scholar : PubMed/NCBI
|
|
19
|
You J, Li Y, Fang N, Liu B, Zu L, Chang R,
Li X and Zhou Q: MiR-132 suppresses the migration and invasion of
lung cancer cells via targeting the EMT regulator ZEB2. PLoS One.
9:e918272014. View Article : Google Scholar : PubMed/NCBI
|
|
20
|
Peinado H, Olmeda D and Cano A: Snail, Zeb
and bHLH factors in tumour progression: An alliance against the
epithelial phenotype? Nat Rev Cancer. 7:415–428. 2007. View Article : Google Scholar : PubMed/NCBI
|
|
21
|
Gemmill RM, Roche J, Potiron VA, Nasarre
P, Mitas M, Coldren CD, Helfrich BA, Garrett-Mayer E, Bunn PA and
Drabkin HA: ZEB1-responsive genes in non-small cell lung cancer.
Cancer Lett. 300:66–78. 2011. View Article : Google Scholar
|
|
22
|
Bindels S, Mestdagt M, Vandewalle C,
Jacobs N, Volders L, Noël A, van Roy F, Berx G, Foidart JM and
Gilles C: Regulation of vimentin by SIP1 in human epithelial breast
tumor cells. Oncogene. 25:4975–4985. 2006. View Article : Google Scholar : PubMed/NCBI
|
|
23
|
Deering TG, Ogihara T, Trace AP, Maier B
and Mirmira RG: Methyltransferase Set7/9 maintains transcription
and euchromatin structure at islet-enriched genes. Diabetes.
58:185–193. 2009. View Article : Google Scholar :
|
|
24
|
Schneider R, Bannister AJ, Myers FA,
Thorne AW, Crane-Robinson C and Kouzarides T: Histone h3 lysine 4
methylation patterns in higher eukaryotic genes. Nat Cell Biol.
6:73–77. 2004. View
Article : Google Scholar
|
|
25
|
Pradhan S, Chin HG, Estève PO and Jacobsen
SE: SET7/9 mediated methylation of non-histone proteins in
mammalian cells. Epigenetics. 4:383–387. 2009. View Article : Google Scholar : PubMed/NCBI
|
|
26
|
Tao Y, Neppl RL, Huang ZP, Chen J, Tang
RH, Cao R, Zhang Y, Jin SW and Wang DZ: The histone
methyltransferase Set7/9 promotes myoblast differentiation and
myofibril assembly. J Cell Biol. 194:551–565. 2011. View Article : Google Scholar : PubMed/NCBI
|
|
27
|
Keating ST, Ziemann M, Okabe J, Khan AW,
Balcerczyk A and El-Osta A: Deep sequencing reveals novel Set7
networks. Cell Mol Life Sci. 71:4471–4486. 2014. View Article : Google Scholar : PubMed/NCBI
|
|
28
|
Kouzarides T: Chromatin modifications and
their function. Cell. 128:693–705. 2007. View Article : Google Scholar : PubMed/NCBI
|
|
29
|
Bracken CP, Li X, Wright JA, Lawrence DM,
Pillman KA, Salmanidis M, Anderson MA, Dredge BK, Gregory PA,
Tsykin A, et al: Genome-wide identification of miR-200 targets
reveals a regulatory network controlling cell invasion. EMBO J.
33:2040–2056. 2014. View Article : Google Scholar : PubMed/NCBI
|
|
30
|
Pecot CV, Rupaimoole R, Yang D, Akbani R,
Ivan C, Lu C, Wu S, Han HD, Shah MY, Rodriguez-Aguayo C, et al:
Tumour angiogenesis regulation by the miR-200 family. Nat Commun.
4:24272013. View Article : Google Scholar : PubMed/NCBI
|
|
31
|
Cheng W, Liu T, Wan X, Gao Y and Wang H:
MicroRNA-199a targets CD44 to suppress the tumorigenicity and
multidrug resistance of ovarian cancer-initiating cells. FEBS J.
279:2047–2059. 2012. View Article : Google Scholar : PubMed/NCBI
|
|
32
|
Bartel DP: MicroRNAs: Genomics,
biogenesis, mechanism, and function. Cell. 116:281–297. 2004.
View Article : Google Scholar : PubMed/NCBI
|
|
33
|
Wu S, Huang S, Ding J, Zhao Y, Liang L,
Liu T, Zhan R and He X: Multiple microRNAs modulate p21Cip1/Waf1
expression by directly targeting its 3′ untranslated region.
Oncogene. 29:2302–2308. 2010. View Article : Google Scholar : PubMed/NCBI
|
|
34
|
Tili E, Michaille JJ and Croce CM:
MicroRNAs play a central role in molecular dysfunctions linking
inflammation with cancer. Immunol Rev. 253:167–184. 2013.
View Article : Google Scholar : PubMed/NCBI
|
|
35
|
Yanokura M, Banno K, Kobayashi Y, Kisu I,
Ueki A, Ono A, Masuda K, Nomura h, Hirasawa A, Susumu N, et al:
MicroRNA and endometrial cancer: Roles of small RNAs in human
tumors and clinical applications (Review). Oncol Lett. 1:935–940.
2010.PubMed/NCBI
|
|
36
|
Zhao S, Deng Y, Liu Y, Chen X, Yang G, Mu
Y, Zhang D, Kang J and Wu Z: MicroRNA-153 is tumor suppressive in
glioblastoma stem cells. Mol Biol Rep. 40:2789–2798. 2013.
View Article : Google Scholar : PubMed/NCBI
|