Introduction
Prostate cancer (PCa) is one of the most frequent
malignant diseases of older men, whose incidence in Northern and
Western Europe exceeds 200 new estimated cases/100,000 and is still
growing, especially in the younger age group (35–64 years)
(1). In European and North-American
countries due to development of demography this disease becomes not
only medical, but also an economical issue (2).
The cause of prostate cancer still remains unsolved
and only few risk factors are known that affect development of
malignant prostate disease. These include increasing age, the black
race and hereditary factors (3,4). Not
all forms of prostate cancer cause clinically significant disease.
According to autopsy examinations 60–70% of older men die with
prostate cancer, however only 3% of prostate cancer (5). Malignant disease is suspected on the
basis of prostate-specific antigen (PSA) levels and palpation of
the gland. Definitive diagnosis needs to be confirmed by
transrectal needle biopsy.
Unfortunately, even with the sophisticated
pre-operative staging techniques, an average of 28% of those
undergoing radical prostatectomy are found to have positive
surgical margins (6). A positive
surgical margin (PSM) is defined as the presence of tumor at the
inked surface of the resected specimen and as such implies
incomplete excision of malignant tissue (7). These patients are at increased risk of
biochemical relapse, 50–60% at 5 years, and subsequent clinical
relapse, although by no means every patient will suffer eventual
disease recurrence (8). Several
explanations are given for why a PSM is not always associated with
tumor recurrence. The surgery results in ischaemia and fibrosis,
both of which may destroy small areas of residual carcinoma as the
malignant tissue is unable to survive in its new environment.
Alternatively, it may be a result of the desmoplastic response
(6).
Evidence from randomized trials suggests that
immediate secondary therapy is beneficial for patients with adverse
pathology after surgery rather than watchful waiting (9). Since not all of the patients with PSM
develop disease recurrence, physicians face the challenge of
advising an individual on the necessity of secondary therapy.
Potential non-invasive monitoring of presence of PSM can be helpful
as an auxiliary tool in this decision making process. Recent
advances in 'omics'-based technologies have greatly facilitated the
possibilities to reliably study various types of molecules, linked
to different pathological states (10). Among these, proteomics allows the
comprehensive identification of broad spectrum of disease-specific
proteins, which are important for detailed description of certain
diseases, such as PCa (11). In
particular, urinary proteins can serve as an informative tool,
simply obtainable in sufficient amounts in non-invasive way.
Our current objective is therefore dual. First, we
want to distinguish patients with confirmed PSM or NSM after
radical prostatectomy by using sodium dodecyl
sulphate-polyacrylamide gel electrophoresis (SDS-PAGE) and its
subsequent statistical processing by partial least squares
discriminant analysis (PLS-DA). Secondly, we want to identify the
major protein differences between the groups by using 2-D PAGE and
matrix-assisted laser desorption/ionization time-of-flight mass
spectrometry (MALDI-TOF) a powerful tool for proteomics
application. Overall, the disparities in expression of urinary
proteins in PSM and NSM groups are highlighted.
Materials and methods
Chemical compounds
All reagents employed for study, as standards, and
others were purchased from Sigma-Aldrich (St. Louis, MO, USA) in
ACS purity, unless noted otherwise.
Clinical urinary samples
For purpose of this study, urine samples from
patients suffering from prostate cancer (n=30), obtained from
University Hospital in Motol, Department of urology, Prague, Czech
Republic, were studied (Table I).
All the samples were obtained 3 months after radical prostatectomy.
Tested patients were divided into two experimental groups. The
first one consisted of patients with negative surgical margins
(NSM) (n=15). The second group consisted of patients with PSM
(n=15). Enlistment of patients into realized clinical study was
approved by the Ethics committee (reference EK-377/13).
 | Table IStratification of the patients from
whom urinary samples were collected. |
Table I
Stratification of the patients from
whom urinary samples were collected.
| Patient | TNM stage | Surgical margin
status | Gleason score | PSA (ng/ml) in 3rd
month after the surgery |
|---|
| 1 | pT2a | Negative | 3+3 | 0.009 |
| 2 | pT2c | Negative | 3+3 | <0.005 |
| 3 | pT2c | Negative | 3+3 | 0.020 |
| 4 | pT2c | Negative | 3+4 | <0.005 |
| 5 | pT2c | Negative | 3+3 | 0.031 |
| 6 | pT3a | Negative | 3+3 | 0.010 |
| 7 | pT3a | Negative | 3+3 | 0.011 |
| 8 | pT2c | Negative | 3+3 | 0.006 |
| 9 | pT2c | Negative | 3+3 | <0.005 |
| 10 | pT2c | Negative | 3+3 | 0.012 |
| 11 | pT2c | Negative | 3+3 | <0.005 |
| 12 | pT2c | Negative | 3+3 | 0.006 |
| 13 | pT2c | Negative | 3+3 | 0.019 |
| 14 | pT2c | Negative | 3+3 | 0.024 |
| 15 | pT2a | Negative | 3+3 | 0.005 |
| 16 | pT2c | Positive | 3+3 | 0.027 |
| 17 | pT3a | Positive | 3+4 | 0.032 |
| 18 | pT3a | Positive | 3+3 | 0.409 |
| 19 | pT3a | Positive | 3+5 | 0.748 |
| 20 | pT2c | Positive | 3+4 | 0.266 |
| 21 | pT3a | Positive | 3+2 | 0.044 |
| 22 | pT3b | Positive | 4+3 | 0.095 |
| 23 | pT3a | Positive | 3+3 | 0.009 |
| 24 | pT2c | Positive | 3+4 | 0.011 |
| 25 | pT3b | Positive | 3+4 | 0.008 |
| 26 | pT3 | Positive | 4+3 | 0.008 |
| 27 | pT2c | Positive | 3+3 | 0.034 |
| 28 | pT3a | Positive | 3+3 | <0.005 |
| 29 | pT3a | Positive | 4+3 | 0.19 |
| 30 | pT2a | Positive | 3+4 | 0.007 |
Tumors were staged according to the 2002 TNM staging
system. Extraprostatic extension (pT3a, pT3b) was defined as the
extension of the tumor beyond the confines of the gland into the
periprostatic soft tissue. A PSM was defined as the presence of
tumor at the inked surface of the resected specimen. Histological
Gleason grading was performed by a dedicated genitourinary
pathologist. Level of serum PSA was measured 3 months after the
surgery and this test was performed in a single hospital laboratory
under standardized settings.
Determination of total protein in urinary
samples
Total protein was quantified using the Skalab 600 M
kit (Skalab, Svitavy, Czech Republic), according to the
manufacturer's instructions. Measurements were carried out on
automated spectrophotometer BS-400 (Mindray, Shenzhen, China).
Acetone precipitation of urinary
proteins
Urinary samples (50 µl) were added to 200
µl of acetone. The mixtures were stored for 3 h at −20°C and
further were centrifuged using Microcentrifuge 5417R (Eppendorf AG,
Hamburg, Germany) under 10,000 g at 4°C for 15 min. The pellets
were washed with diethylether and ethanol mixture (6:1) and
centrifuged (10,000 g at 4°C, 5 min), then solvent was removed and
the pellet was dried on air.
Sodium dodecyl sulphate-polyacrylamide
gel electrophoresis (SDS-PAGE)
Pellets were diluted in 5 µl of ACS water,
mixed with protein loading buffer (PLB) in a ratio of 1:1 and
incubated at 95°C for 5 min in Thermomixer® R (Eppendorf
AG). Further, samples were removed into the wells in the 12.5%
polyacrylamide gel. Electrophoresis was performed in 1X
Tris-glycine-SDS running buffer for 60 min in the electrophoretic
bath (Bio-Rad, Berkeley, CA, USA) at 110 v. Gels were visualized
following protocol of staining with Coomassie brilliant blue
staining (12).
Data collection
The decision was made to describe each individual by
series of values as curves extracted from electr phoreograms. This
approach was chosen among other alternatives namely description of
individuals by pairs of band positions and intensities due to its
advantages in application of machine learning algorithms. A set of
curves can be easily transformed into data matrix in comparison
with other descriptions of individuals. The extraction of curves
and estimation of molecular weight was made according to ref.
13. The data collection was
facilitated by the MATLAB programming language.
Exploratory analysis
Exploratory analysis was performed by examining
tables and plots of the observed data. The transformation was
identified to evaluate the raw data on the basis of plots and
knowledge of the expected scale of measured variables. Exploratory
analysis was used to: i) identify missing and outlying values, ii),
verify the quality of the data and find appropriate corrections,
and iii) to determine the intervals of spectra used in the
projection to latent structure discriminant analysis model relating
outputs of experiments to predictors according to the experimental
settings.
Statistical modeling
The standard projection to latent structure
discriminant analysis models (PLS-DA) were used to find parts of
curves differing in examined groups according to experimental
settings. The standard PLS 1 algorithm was used to construct latent
variables and ordinary least squares were used to determine the
coefficients of classification model relating the latent variables
to output of the experiment. The leave-one-out validation was used
to assess the quality of different models and to choose the correct
number of latent variables with respect to the performance of model
on the validation data set. The fraction of explained variation R2
was also computed to provide more detailed evaluation of trained
models. The interpretation of PLS-DA models was performed by the
examination of loading plots and S plots. The interesting parts of
curves in relation to the response were pointed out by introducing
limits to denominated values in S plots.
2-D PAGE analysis
Pellets, collected after acetone precipitation were
diluted in 125 µl of rehydration buffer (2 M urea, 7 M
thiourea, 4%
3-[(3-Cholamidopropyl)dimethylammonio]-1-propanesulfonate hydrate,
100 mM dithiothreitol, 0.2% ampholyte with pH 3.0–10.0, 0.001%
bromophenol blue), and the solution was sonicated (8×2 sec). The
resulting solution was employed for 12-h rehydration on 7-cm IPG
strips (Bio-Rad). The IPG strips, after rehydration, were focused
on Protean® IEF cell (Bio-Rad) at 20°C in 3 steps. In
the first step, electric voltage was increased linearly over 20 min
from 0 to 250 V. Second step comprised the voltage increase to
4,000 V (maintained for 2 h). In the third step the electrical
parameters were set so that the total value reached 10 kvh. The
electric current was limited to the value of 50 mA/strip. After
isoelectric focusing, strips were incubated for 10 min at 25°C on a
shaker with the First equilibration buffer [6 M urea, 20%
v/v glycerol, 2% w/v SDS, 0.375 M Tris-HCL (ph 8.8),
2% w/v dithiothreitol]. Thereafter, the solution was
replaced and the strips were incubated with the second
equilibration buffer [6 M urea, 20% v/v glycerol, 2%
w/v SDS, 0.375 M Tris-HCL (pH 8.8), 2.5% w/v
iodacetamide, 0.001% bromophenol blue] for 10 min. Strips, prepared
in this manner were washed in Tris glycine-SDS running buffer. The
strips were then placed on the back of the flatbed electrophoretic
glass plate. Subsequently, the agarose was poured between the
plates, where the strip was inserted. After solidification of
agarose, the plates were inserted in the electrophoretic bath with
Tris-glycine-SDS running buffer. Electrophoresis was set to 75 min
at a voltage of 180 V. Gels were stained using coomassie brilliant
blue and silver (12).
In-gel tryptic digestion
For excision of the spots from 2D gels of urinary
samples EXQuest™SpotCutter (Bio-Rad) was utilized. The in-gel
digestion with trypsin was performed according to a protocol of
Shevchenko et al (14). The
digests of proteins were further employed for peptide mass
fingerprinting (PMF).
Matrix-assisted laser
Desorption/Ionization time-of-flight (MALDI-TOF)
The mass spectrometry experiments were performed on
a MALDI-TOF mass spectrometer Bruker ultrafleXtreme (Bruker
Daltonik Gmbh, Bremen, Germany), using 2,5-dihydroxybenzoic acid as
matrix. The saturated matrix solution was prepared in 30%
acetonitrile and 0.1% trifluoroacetic acid. Mixture was thoroughly
vortexed and ultrasonicated using Bandelin 152 Sonorex Digital 10P
ultrasonic bath (Bandelin Electronic, Berlin, Germany) for 2 min at
50% of intensity at room temperature. For sample preparation the
dried-droplet method was utilized, where solutions of digested
proteins were mixed with matrix solution in volume ratio of 1:1.
After obtaining a homogeneous solution, 2 µl was applied on
the MTP 384 polished steel target plate (Bruker Daltonik Gmbh) and
dried under atmospheric pressure at 25°C. All measurements were
performed in the reflector positive mode in the m/z range
400–6,000 Da. The MS spectra were typically acquired by averaging
500 sub spectra from a total of 500 shots of the laser with laser
power set 5% above the threshold.
Peptide mass fingerprinting
Peptide mass fingerprinting (PMF) was done using
MASCOT server (Matrix Science, Boston, MA, USA) for comparing mass
spectra with UniProt database. For database search the following
parameters were used: trypsin was used as the enzyme, zero or one
missed cleavage was allowed, taxonomy was set to Homo
sapiens, oxidation of methionine or/and N-term
acetylation was added as variable modification, peptide tolerance
was set to ±0.5 Da, mass values were set as Mh+ and were
obtained from monoisotopic peaks.
Results and Discussion
Urine is a specific filtrate of blood; the protein
components of urine are qualitatively similar to those of blood but
much more diluted (15). An
advantage for urine over blood is that urinary proteins are stable
and do not undergo significant proteolysis within several hours of
collection. Hence, urinary proteomics presents an attractive
approach to cancer biomarker discovery, not only for urological
malignancies (16), but for other
systemic malignancies and evaluation of current health status
(17). Many advantages favor the
use of urine over blood and tissues samples, including the fact
that urine-based tests are non-invasive, and urine is
non-infectious for HIV and less infectious for many other pathogens
(18).
Evaluation of total protein profiling by
SDS-PAGE and its statistical processing
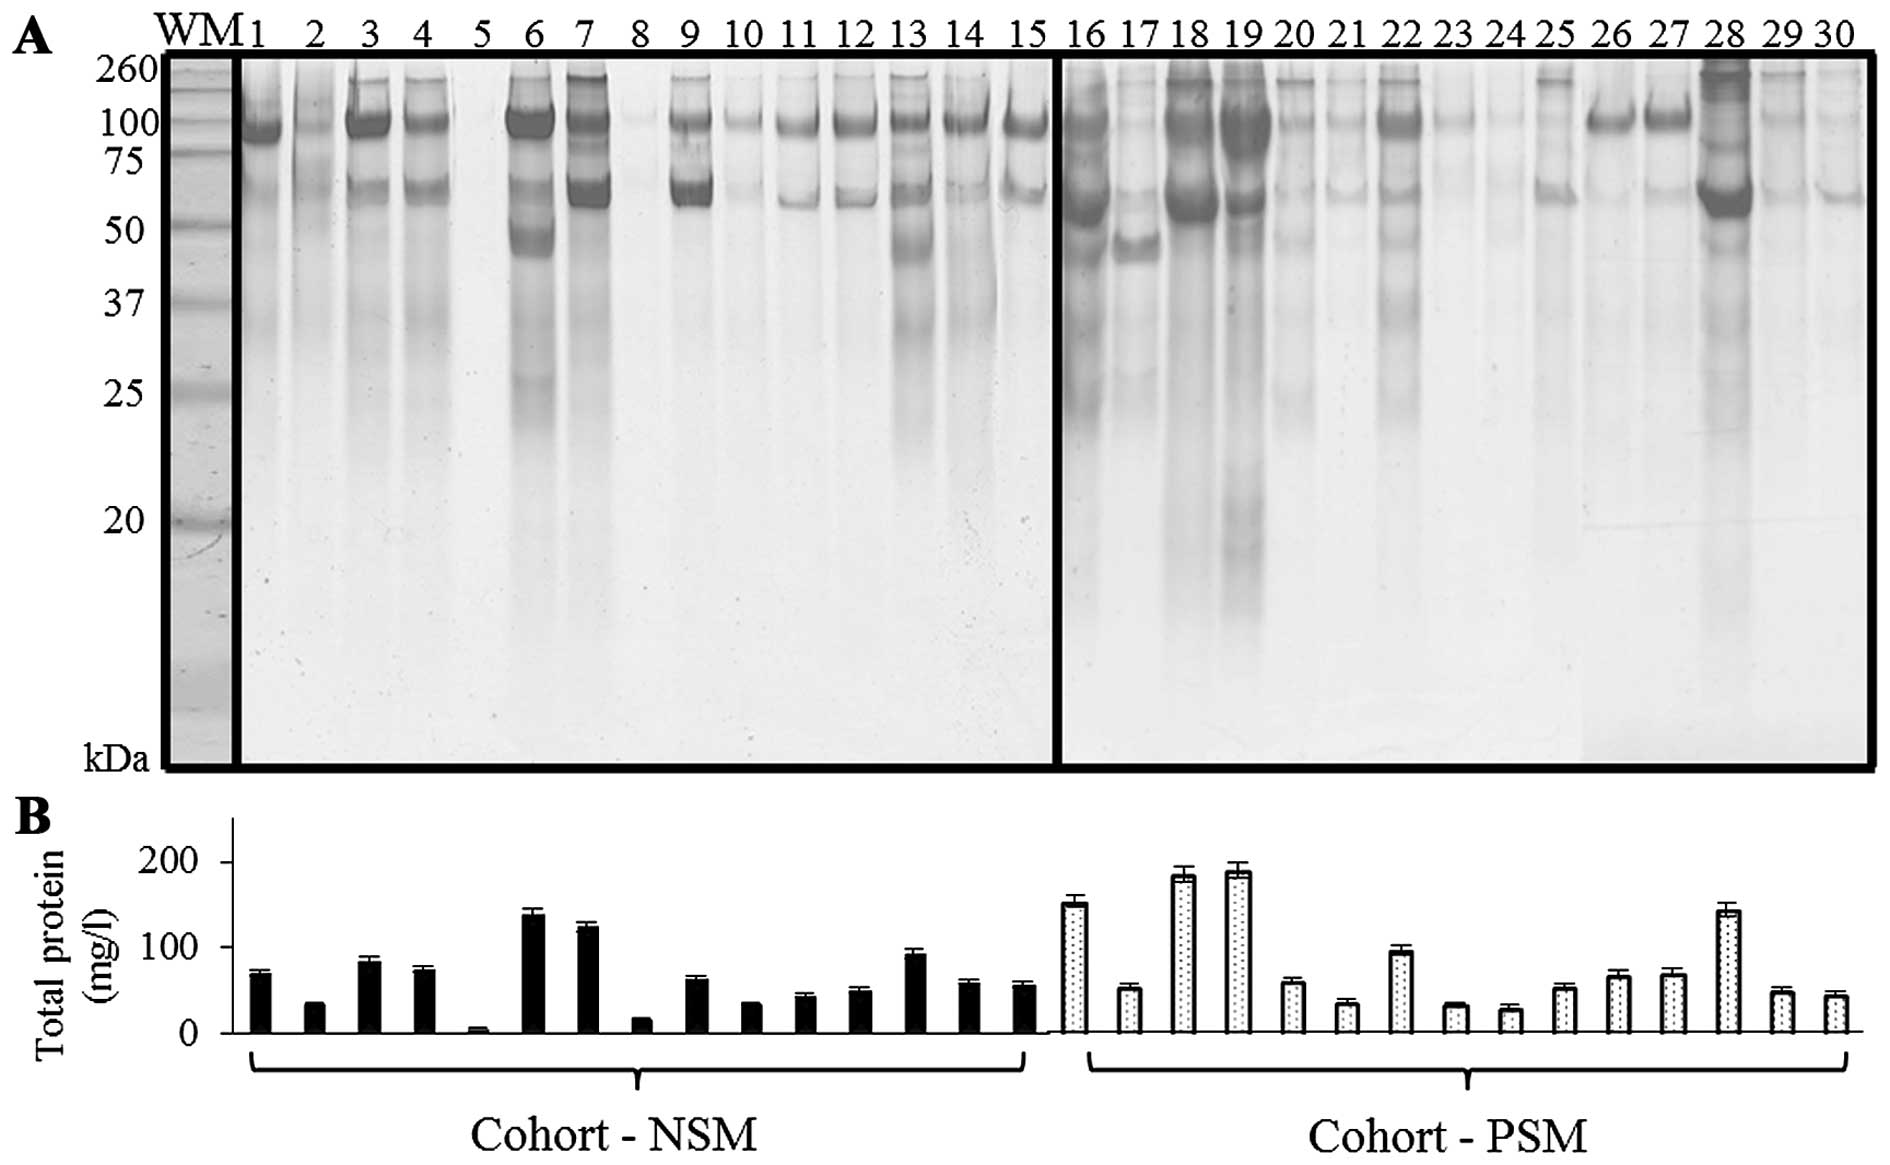
The migration of the molecular weight marker and
urinary proteins of NSM, PSM patients on SDS-PAGE is presented in
Fig. 1A. SDS-PAGE is a rapid and
simple technique for protein pattern elucidation, quantification
and determination of groups of proteins with similar molecular
weight (Mr) (19). The visualization of NSM/PSM groups
revealed proteins with relatively wide range of
Mr that, according to previously published
results, correspond to commonly present albumin
(Mr 60–70 kDa); 80–110 kDa range belongs to
transferrin and uromodulin (formerly Tamm-Horsfall protein),
together with albumin polymeric complexes can be determined, in
160–200 kDa range the major band is commonly dedicated to IgG, IgA
monomers and C3. Less distinct bands at
Mr 31 kDa were previously linked with carbonic
anhydrase (20–22). For confirmation, total proteins in
urinary specimens were quantified spectrophotometrically (Fig. 1B). Higher protein levels were
determined in PSM cohort (85.3±55.9 mg/l) when compared to NSM one
(mean 64.1±36.2 mg/l).
Since our first aim was the determination of NSM/PSM
SDS-PAGE protein patterns we employed partial least square
discriminant analysis (PLS-DA) model, which utilized curves (band
intensities) extracted from SDS-PAGE gels. To facilitate the
comparability of curves the linear interpolation of all curves was
carried out to identical values of molecular weight. Carrying out
the linear interpolation a pair of limits was introduced to exclude
marginal parts of curves and the linearization of molecular weight
was performed. The leave-one-out validation was carried out to
assess the prediction quality of the model and to choose the number
of latent variables according to the prediction accuracy criterion.
The results of leave-one-out validation of PLS DA model are
presented in Table II.
| Table IIThe evaluation of partial least
square discriminant analysis (PLS-DA) model. |
Table II
The evaluation of partial least
square discriminant analysis (PLS-DA) model.
| Model | Performance on the
validation set | Fraction of
explained variation | Estimated no. of
latent variables |
|---|
| NSM/PSM | 83.33% | 50.20% | 1 |
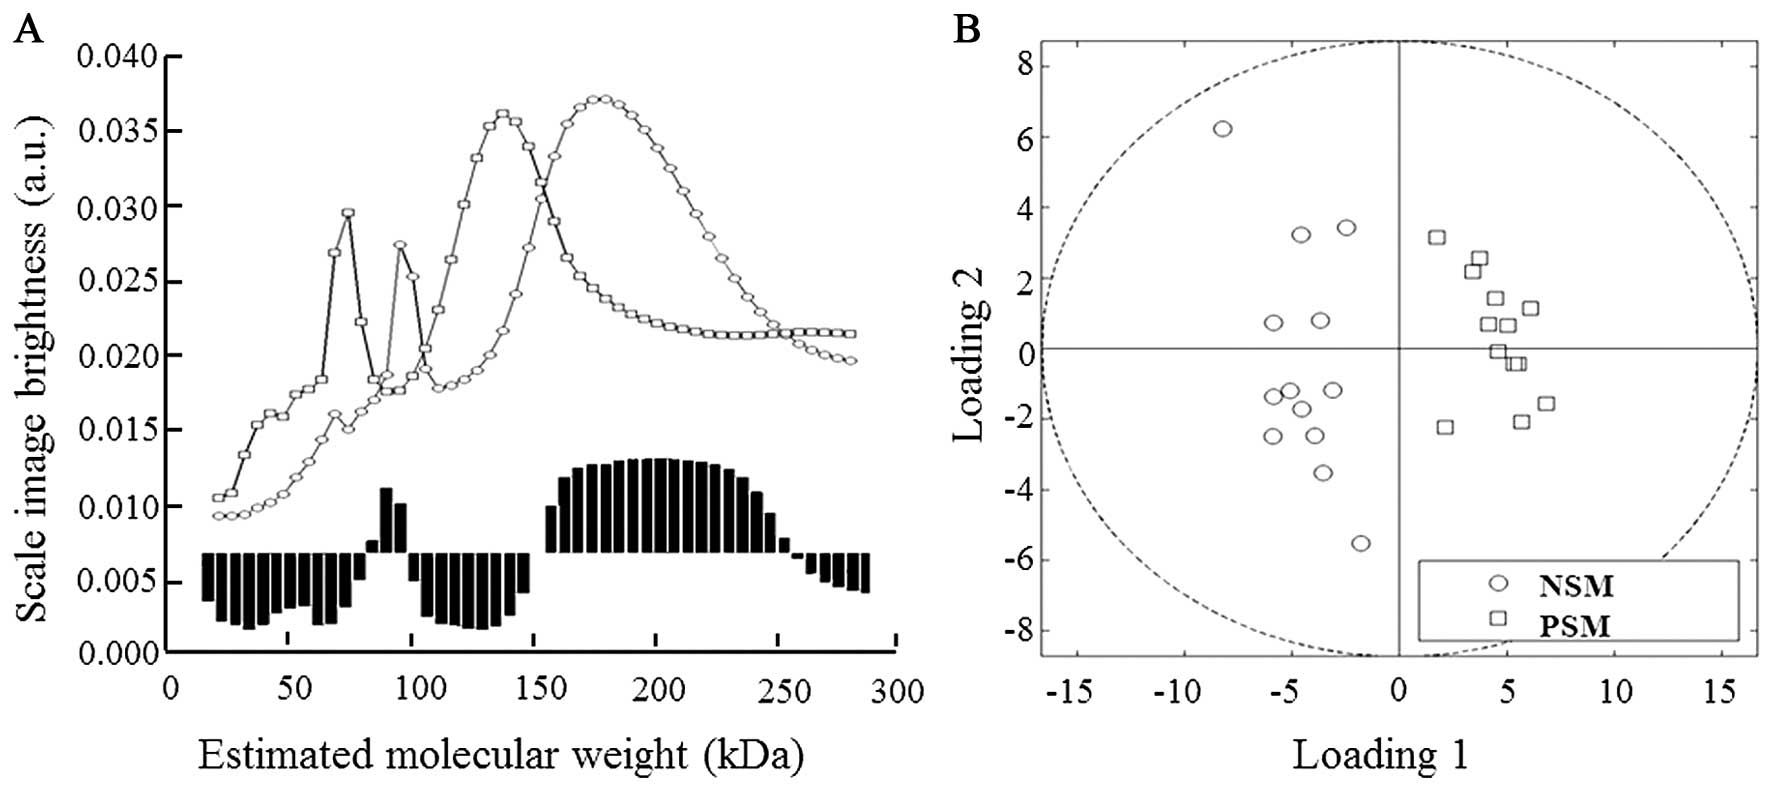
As seen in Fig. 2A,
in our NSM/PSM model the proteins in mass ranges of 80–99 and
150–235 kDa were evaluated as the most significant in
discrimination between examined groups. The quadrant expression
based on comparison of the curves projection shows separate
distribution of both NSM and PSM groups (Fig. 2B).
Obtained results revealed interesting disparities in
protein patterns; however co-migration of proteins with similar
mass decreased the separation yields and thus better separation
method was required for further analyses of proteins of
interest.
2-D electrophoresis and PMF
Because two-dimensional gel electrophoresis employs
both isoelectric focusing of target molecule, its
Mr and it is unlikely that two molecules will be
similar in two distinct properties, higher separation resolution is
provided (23). We analyzed urinary
protein profiles of patients with NSM (n=15) and PSM (n=15) by
using acetone precipitation for proteins isolation with subsequent
2-D electrophoresis and MALDI-TOF identification.
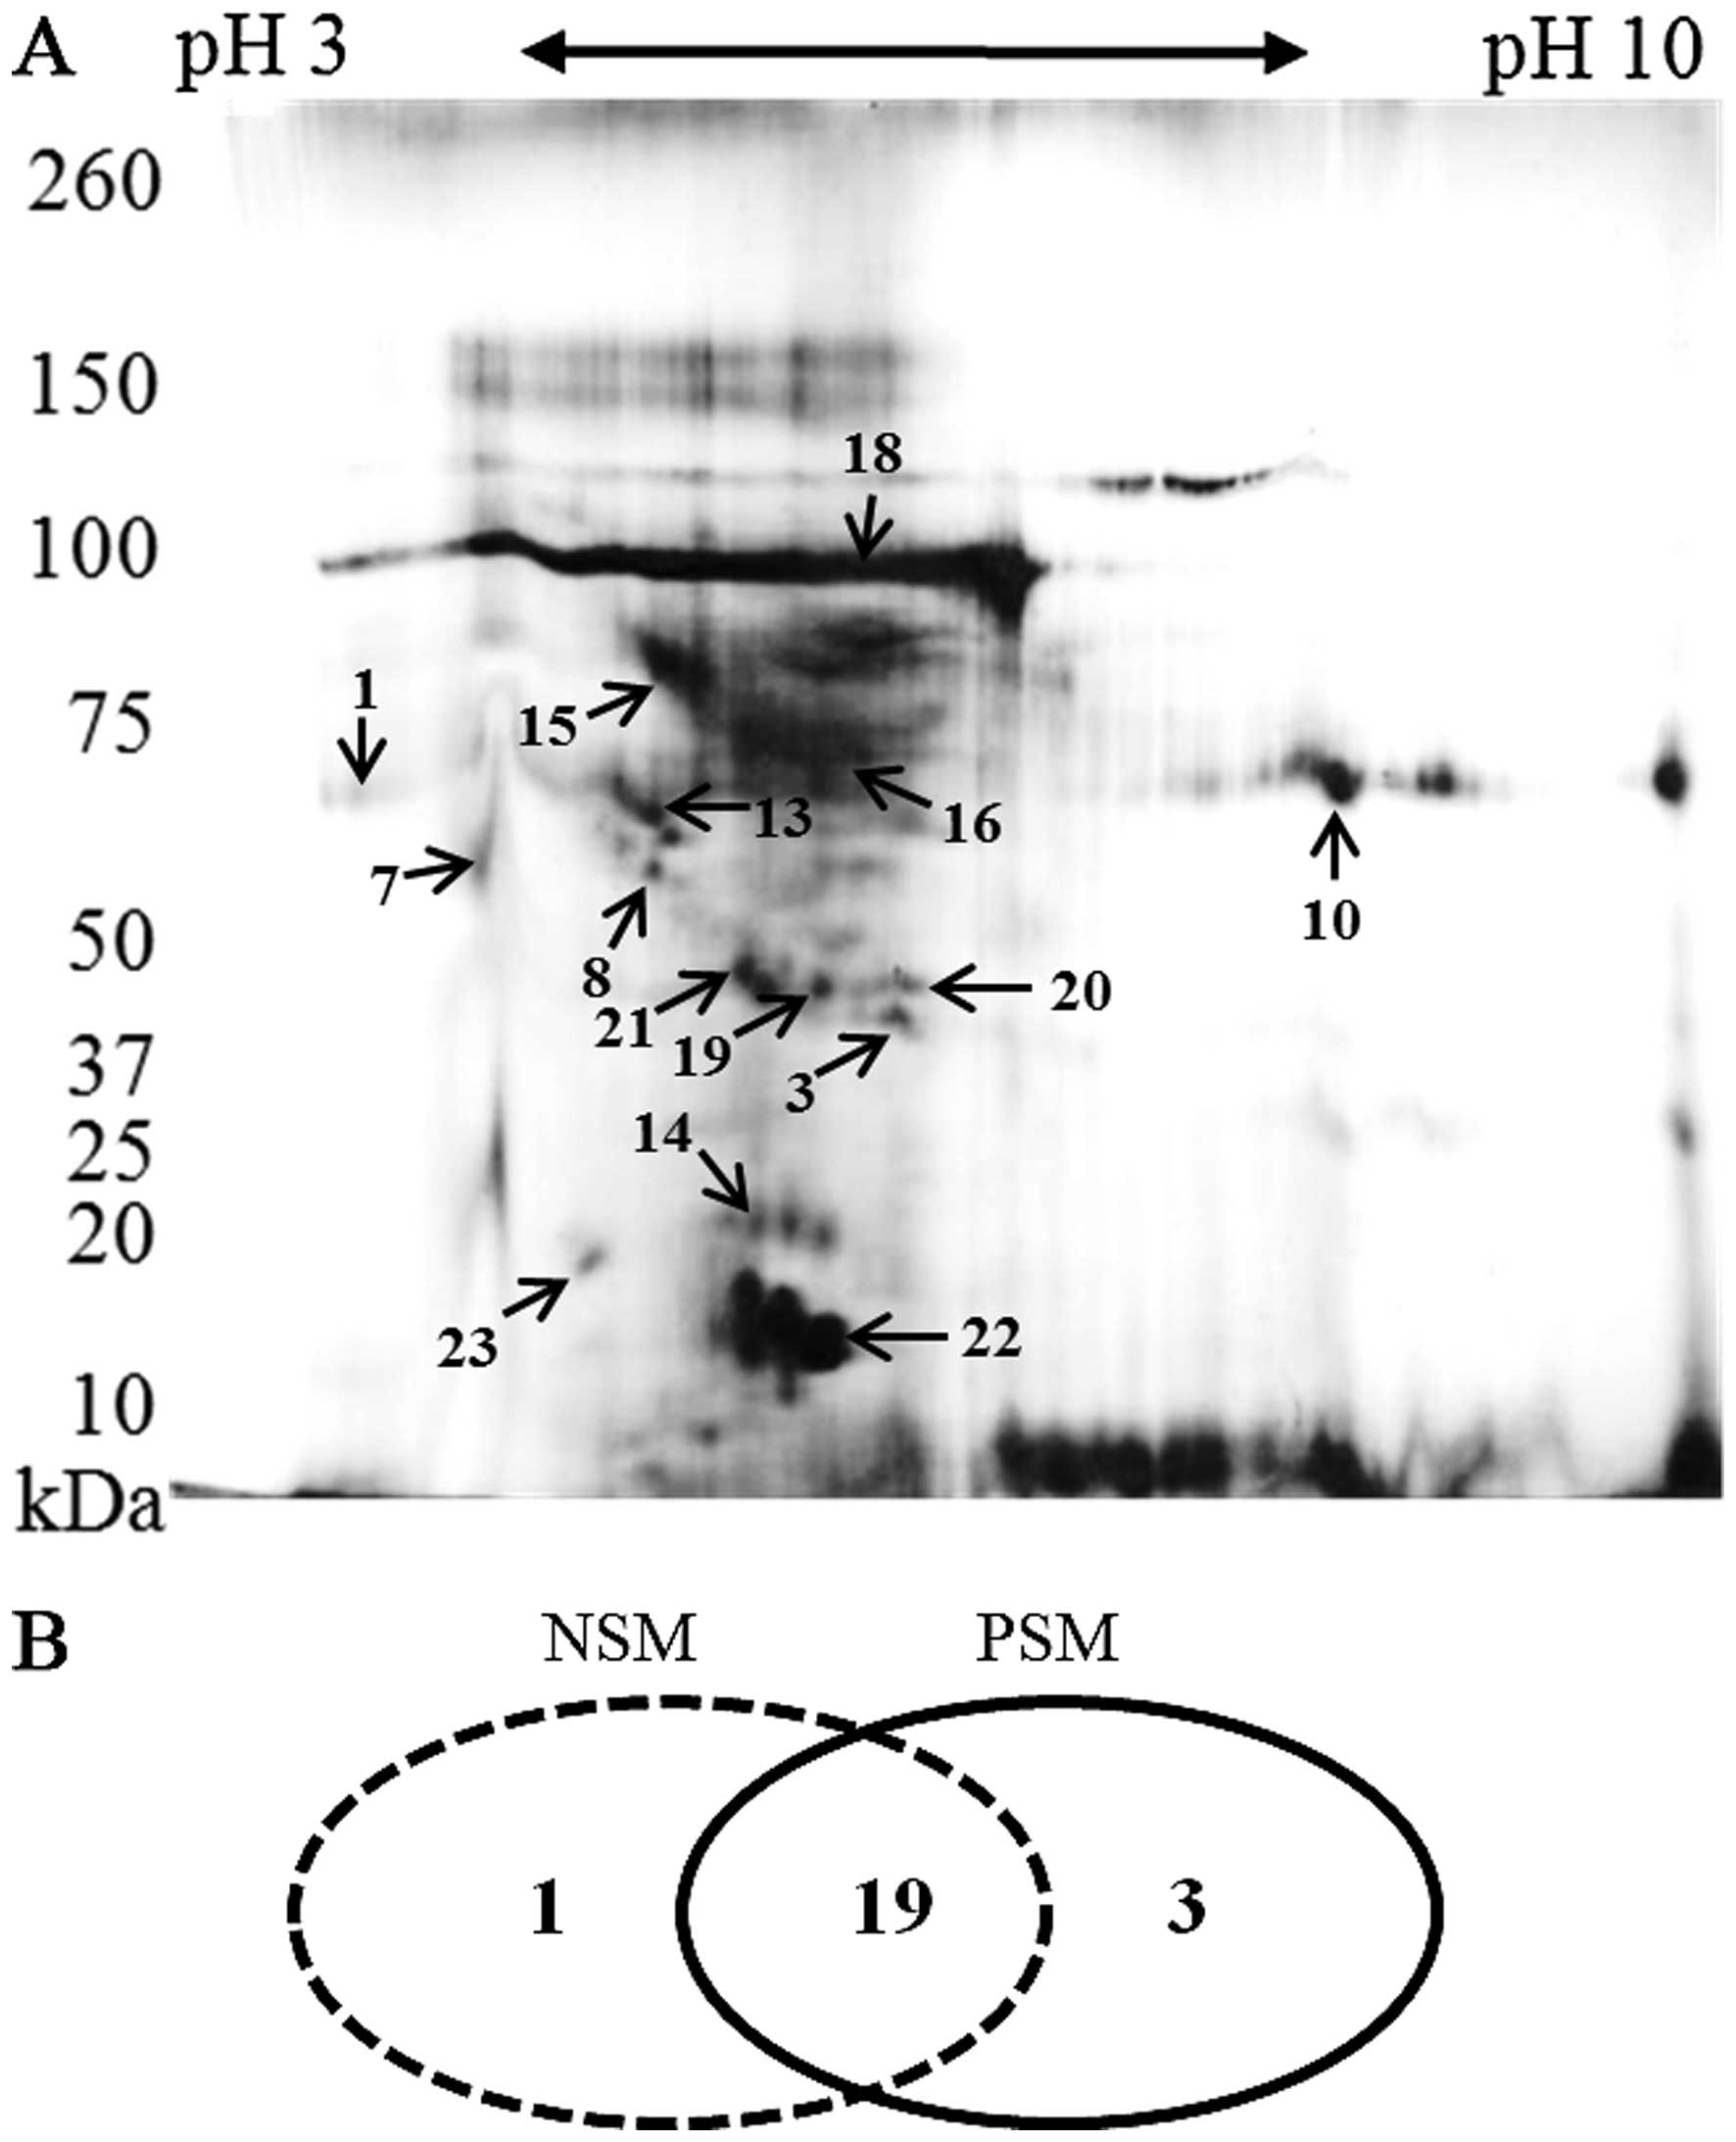
Following 2D-PAGE and staining, the most prominent
spots were picked up for the MS analysis. Their positions in the
2-D map of representative subject belonging to PSM group are shown
in Fig. 3A. Some proteins were
presented as a horizontal row of multiple spots (with small changes
in pI and molecular weight), likely caused by variable
posttranslational modifications (24). The identified proteins and their
characteristics are shown in Table
III. It was revealed that majority of proteins (19 overlaping
proteins) can be identified in both groups. In both, PSM and NSM
groups, unique proteins were found (n=1 in NSM; n=3 in PSM) as
depicted in Fig. 3B.
| Table IIIExpression of basic characteristics
and abundance of proteins (%), identified in both groups (NSM,
n=15, PSM, n=15) after in-gel tryptic digestion and MALDI-TOF
identification. |
Table III
Expression of basic characteristics
and abundance of proteins (%), identified in both groups (NSM,
n=15, PSM, n=15) after in-gel tryptic digestion and MALDI-TOF
identification.
| No. | Protein | UniProt accession
entry | Predicted mass
(Mr) | pI | Approx. MASCOT
score | NSM (%) | PSM (%) |
|---|
| 1 | α-fetoprotein | FETA_HUMAN | 70.1 | 4.57 | 402 | 27 | 53 |
| 2 | AT-rich interactive
domain-containing protein 1A | ARI1A_HUMAN | 242.0 | 6.08 | 367 | 67 | 27 |
| 3 | Cyclin-dependent
kinase 6 | CDK6_HUMAN | 36.9 | 6.02 | 358 | – | 40 |
| 4 | E-cadherin | CADH1_HUMAN | 99.1 | 4.50 | 211 | 87 | 34 |
| 5 | Fascin | FSCN1_HUMAN | 54.5 | 5.50 | 663 | 73 | 53 |
| 6 | Fatty acid-binding
protein, intestinal | FABPI_HUMAN | 15.2 | 5.30 | 258 | 27 | 40 |
| 7 | Galectin-3-binding
protein | LG3BP_HUMAN | 65.3 | 4.90 | 559 | – | 53 |
| 8 | Keratin, type I
cytoskeletal 10 | K1C10_HUMAN | 58.8 | 5.10 | 398 | 67 | 87 |
| 9 | Keratin, type I
cytoskeletal 9 | K1C9_HUMAN | 62.0 | 4.90 | 157 | 94 | 53 |
| 10 | Keratin, type II
cytoskeletal 1 | K2C1_HUMAN | 66.0 | 8.10 | 304 | 73 | 67 |
| 11 | L-lactate
dehydrogenase C chain | LDHC_HUMAN | 36.2 | 7.08 | 456 | – | 27 |
| 12 | Plasminogen | PLMN_HUMAN | 93.2 | 6.20 | 198 | 67 | 40 |
| 13 | Protein
disulfide-isomerase A4 | PDIA4_HUMAN | 72.9 | 5.16 | 264 | 60 | 73 |
| 14 | Retinol-binding
protein 1 | RET4_HUMAN | 20.5 | 5.76 | 441 | 73 | 67 |
| 15 | Transferrin | TRFE_HUMAN | 79.3 | 5.20 | 280 | 87 | 94 |
| 16 | Serum albumin | ALBU_HUMAN | 69.3 | 4.70 | 360 | 100 | 100 |
| 17 | Testis-expressed
sequence 33 protein | TEX33_HUMAN | 30.7 | 5.65 | 256 | 27 | – |
| 18 | Uromodulin | UROM_HUMAN | 95.0 | 5.05 | 762 | 100 | 94 |
| 19 | Acid phosphatase,
prostate | PPAP_HUMAN | 44.5 | 5.89 | 256 | 37 | 73 |
| 20 | Guanine nucleotide
binding protein | GBLP_HUMAN | 40.4 | 5.69 | 401 | 53 | 67 |
| 21 | Serine proteinase
inhibitor, clade A |
A0A024R6N9_HUMAN | 46.6 | 5.42 | 301 | 34 | 53 |
| 22 | CD59
glycoprotein | CD59_HUMAN | 14.2 | 6.02 | 299 | 53 | 87 |
| 23 |
Lithostathine-1-α | REG1A_HUMAN | 18.7 | 5.00 | 178 | 87 | 73 |
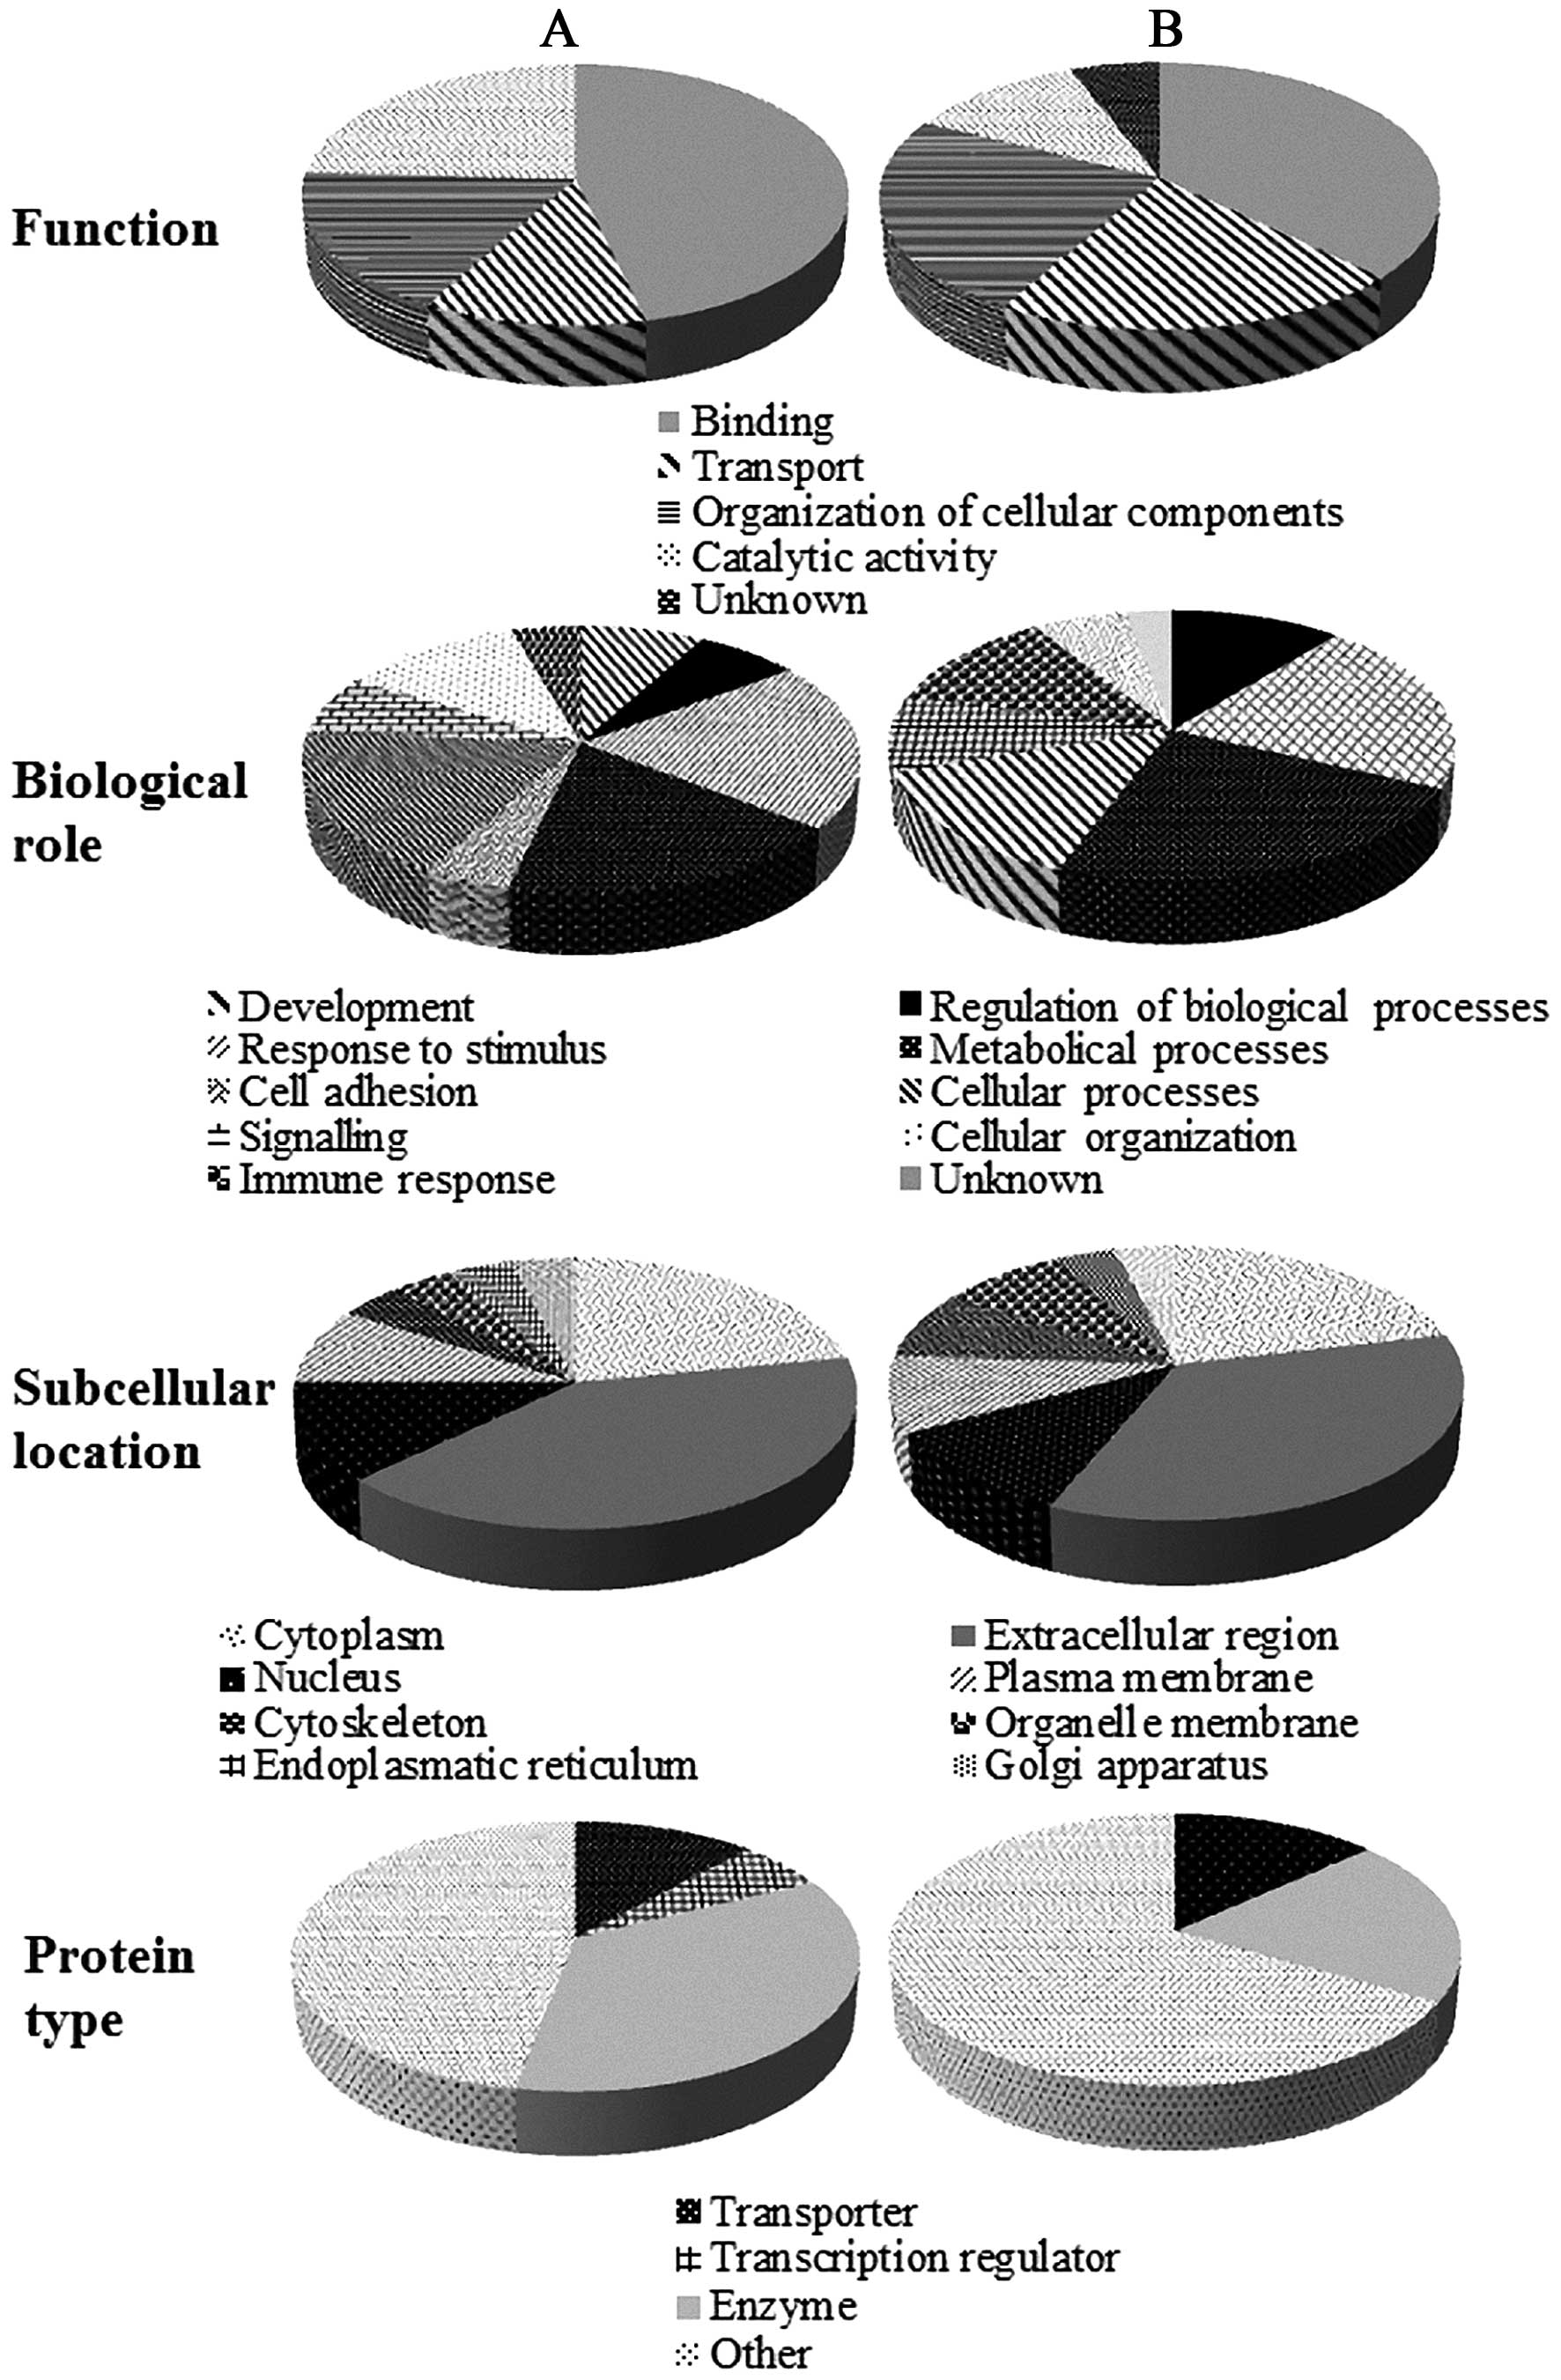
The identified proteins were further classified
using the data from the UniProt knowledgebase. As shown in Fig. 4A, belonging to PSM group, regarding
to molecular functions, most of identified proteins (46%) have
binding function, which was followed by catalytic activity,
transport and organization of cellular components. Proteins (21%)
were involved in response to stimuli, followed by cellular and
metabolical processes (18%). One third of identified proteins are
enzymes (35%) and most of proteins had extracellular region
location (41%). The majority of extracellular proteins is related
to close contact of urine with glands in the male urinary tract and
fact that significant fraction of urinary proteins is derived from
plasma (25). In NSM group
(Fig. 4B), lower portion of binding
proteins (37%) was observed with increase of transport proteins
(21%) and proteins responsible for organi-zation of cellular
components (24%). Further, in NSM group, decreased number of
enzymes was identified and in four subjects, elevated expression of
testis-expressed sequence 33 protein (TEX33_HUMAN), protein with
unknown function and biological role, was determined. In NSM
cohort, higher abundance of E-cadherin, calcium
2+-dependent cell-adhesion protein, maintaining
homeostasis (26), was determined.
Several reports show that E-cadherin is tumor-invasive suppressor
and decreased cadherin expression has been associated with more
advanced tumor stage, grade and poor prognosis in PCa (27–29).
Shimamura and coworkers demonstrated that patients suffering from
pancreatic adenocarcinoma with downregulated E-cadherin had a
tendency to have PSM (30). α
fetoprotein, potential tumor biomarker (31), was identified (27%), in lower
abundance in NSM group, which points at possible higher relapse
potential of PSM subjects. Another interesting finding was the
disparity in urinary prostatic acid phosphatase (Table III). In 1936 Gutman and coworkers
observed that serum activity of this enzyme is significantly higher
in PCa patients, especially suffering from osteoplastic metastases
(32), and it was extensively used
for PCa diagnosis prior to introduction of PSA (33). Our results demonstrate that PSM
cohort comprises more subjects, whose urinary specimens contain
detectable levels (73%) of prostatic acid phosphatase when compared
to NSM group (37%). In NSM cohort, also higher abundance of
plasminogen (angiostatin), potent inhibitor of angiogenesis
(34), was determined.
From all identified proteins, 3 unique proteins have
been determined in PSM group, whose expression in NSM group is
downregulated to undetectable levels. All of them (cyclin-dependent
kinase 6, L-lactate dehydrogenase C chain and retinol-binding
protein) were determined in more than one case (27–67% abundance),
which points to their possible connection with presence of residual
tumor tissue. The list of these proteins with a description of
their biological role is shown in Table IV.
| Table IVCharacterization of functions of the
3 unique proteins found only in the PSM group. |
Table IV
Characterization of functions of the
3 unique proteins found only in the PSM group.
| Protein | Gene | Subcellular
location | Biological
function | Described linkage
to PCa | (Ref.) |
|---|
| Cyclin-dependent
kinase 6 | CDK6 | Nucleus,
cytoplasm | Control of cell
cycle and differentiation, promotes G1/S transition | Yes | (36) |
| Galectin-3-binding
protein |
LGALS3BP | Extracellular
region | Promotes
integrin-mediated cell adhesion, stimulate host defense against
tumor cells | Yes | (37) |
| L-lactate
dehydrogenase C chain | LDHC | Cytoplasm | Possible role in
sperm motility, conversion of L-lactate and NAD to pyruvate and
NADH in anaerobic glycolysis | Yes | (38) |
The identified proteins, unique for PSM cohort were
previously described in certain aspects of prostate cancer
development. Cyclin-dependent kinase 6 (CDK6) binds to and is
activated by cyclin D1 and thereby enhances the transition of cells
through the G1 phase (35). The regulation is performed through
regulation of the phosphorylation state of retinoblastoma protein
(pRb). When hyperphosphorylation of pRb occurs, it leads to release
of transcription factors, which enhance progression of the cell
cycle (36). Since the
dysregulation of the cell cycle is one of the defined hallmarks of
cancer (37), Palbociclib, oral
inhibitor of CDK4/6, was developed to manage ER+ and
HER2 amplified breast tumors (38).
In prostate cancer only slight evidence exists pointing to a role
of CDK6. Lim et al (35)
demonstrated that CDK6 can easily bind to the androgen receptors
(AR), which play a pivotal role in prostate cancer (39), and it was revealed that CDK6/AR
binding stimulates transcriptional activity in presence of
dihydrotestosterone (35).
Moreover, they have shown that androgen-sensitive LNCaP PCa cells,
engineered to stably overexpress CDK6 display increased elevated
PSA expression and enhanced growth attributes. The same group
indicates that CDK6 is overexpressed in 44% of PCa; hence presence
of this protein in urine could be clinically interesting for
evaluation of post-prostatectomy status.
Another uniquely identified protein, connected with
PSM status was galectin-3-binding protein (also named Mac-2BP or
tumor-associated antigen 90K) that is a highly glycosylated
secreted protein, capable of inducing the expression of number of
cytokines (IL-1, IF-2 and IL-6) (40). Previous studies have indicated that
galectin-3-binding protein promotes tumor metastasis and that the
tumor promotion mechanism in metastasis is associated with
galectins (41). Furthermore, it
was revealed that galectin-3-binding proteins enhance tumor cell
adhesion, which may aid tumor cells to avoid apoptosis and is thus
highly expressed in PCa samples (42). Although the potential of serum
galectin-3-binding protein was discussed in several reports
(40,42,43),
to our knowledge, this is the first report, showing its possible
diagnostic utilization in analysis of urinary specimens.
L-lactate dehydrogenase C chain or the cancer/testis
antigen 32 is typically expressed in normal male germ cells but are
silent in normal somatic cells. Nevertheless, they are aberrantly
expressed in several types of cancer, including PCa (44). Several studies shown that the
expression of L-lactate dehydrogenase C chain is frequently
associated with higher grade lesions and advanced disease with a
poorer outcome (45,46), which is consistent with the general
fact that PSM is more often linked with higher Gleason score and
higher pathologic stage (47)
(higher TNM and GS of PSM subjects are shown in Table I).
In conclusion, our examination of urinary proteomes
of human Pca specimens identified differences between groups of
patients with positive and negative surgical margins after radical
prostatectomy. The significance of these findings in the context of
presence of PSM is represented by molecular changes leading to
alterations in biochemical pathways, hopefully related to the
presence of residual tumor after surgical treatment failure.
Further evaluation of proteomes of PSM/NSM patients and observation
of their biochemical and clinical recurrence will be needed to
address a potential significance of urinary proteins in this
phenomenon. Ultimately, development of combination of
genomic-proteomic approaches for monitoring of biological processes
will be fundamental in further endeavors to understand the PCa and
PCa-related statuses in detail.
Acknowledgments
The authors are grateful to CEITEC
CZ.1.05/1.1.00/02.0068 and research grant IGA MZ CR NT13472-4 for
financial support.
References
|
1
|
Arnold M, Karim-Kos HE, Coebergh JW,
Byrnes G, Antilla A, Ferlay J, Renehan AG, Forman D and
Soerjomataram I: recent trends in incidence of five common cancers
in 26 European countries since 1988: Analysis of the European
Cancer Observatory. Eur J Cancer. 51:1164–1187. 2015. View Article : Google Scholar
|
|
2
|
Luengo-Fernandez R, Leal J, Gray A and
Sullivan R: Economic burden of cancer across the European Union: A
population-based cost analysis. Lancet Oncol. 14:1165–1174. 2013.
View Article : Google Scholar : PubMed/NCBI
|
|
3
|
Sakr WA, Haas GP, Cassin BF, Pontes JE and
Crissman JD: The frequency of carcinoma and intraepithelial
neoplasia of the prostate in young male patients. J Urol.
150:379–385. 1993.PubMed/NCBI
|
|
4
|
Siegel R, Naishadham D and Jemal A: Cancer
statistics, 2012. CA Cancer J Clin. 62:10–29. 2012. View Article : Google Scholar : PubMed/NCBI
|
|
5
|
Haas GP, Delongchamps N, Brawley OW, Wang
CY and de la Roza G: The worldwide epidemiology of prostate cancer:
Perspectives from autopsy studies. Can J Urol. 15:3866–3871.
2008.PubMed/NCBI
|
|
6
|
Walsh PC, Partin AW and Epstein JI: Cancer
control and quality of life following anatomical radical retropubic
prostatectomy: Results at 10 years. J Urol. 152:1831–1836.
1994.PubMed/NCBI
|
|
7
|
Watson RB, Civantos F and Soloway MS:
Positive surgical margins with radical prostatectomy: Detailed
pathological analysis and prognosis. Urology. 48:80–90. 1996.
View Article : Google Scholar : PubMed/NCBI
|
|
8
|
Cheng L, Darson MF, Bergstralh EJ, Slezak
J, Myers RP and Bostwick DG: Correlation of margin status and
extraprostatic extension with progression of prostate carcinoma.
Cancer. 86:1775–1782. 1999. View Article : Google Scholar : PubMed/NCBI
|
|
9
|
Vesely S, Jarolim L, Duskova K, Schmidt M,
Dusek P and Babjuk M: The use of early postoperative
prostate-specific antigen to stratify risk in patients with
positive surgical margins after radical prostatectomy. BMC Urol.
14:792014. View Article : Google Scholar : PubMed/NCBI
|
|
10
|
Aebersold R, Anderson L, Caprioli R,
Druker B, Hartwell L and Smith R: Perspective: A program to improve
protein biomarker discovery for cancer. J Proteome Res.
4:1104–1109. 2005. View Article : Google Scholar : PubMed/NCBI
|
|
11
|
Bergman N and Bergquist J: Recent
developments in proteomic methods and disease biomarkers. Analyst
(Lond). 139:3836–3851. 2014. View Article : Google Scholar
|
|
12
|
Heger Z, Kominkova M, Cernei N, Krejcova
L, Kopel P, Zitka O, Adam V and Kizek R: Fluorescence resonance
energy transfer between green fluorescent protein and doxorubicin
enabled by DNA nanotechnology. Electrophoresis. 35:3290–3301. 2014.
View Article : Google Scholar : PubMed/NCBI
|
|
13
|
Vyslouzilova L, Krizkova S, Anyz J, Hynek
D, Hrabeta J, Kruseova J, Eckschlager T, Adam V, Stepankova O and
Kizek R: Use of brightness wavelet transformation for automated
analysis of serum metallothioneins- and zinc-containing proteins by
western blots to subclassify childhood solid tumours.
Electrophoresis. 34:1637–1648. 2013. View Article : Google Scholar : PubMed/NCBI
|
|
14
|
Shevchenko A, Tomas H, Havlis J, Olsen JV
and Mann M: In-gel digestion for mass spectrometric
characterization of proteins and proteomes. Nat Protoc.
1:2856–2860. 2006. View Article : Google Scholar
|
|
15
|
Oh J, Pyo JH, Jo EH, Hwang SI, Kang SC,
Jung JH, Park EK, Kim SY, Choi JY and Lim J: Establishment of a
near-standard two-dimensional human urine proteomic map.
Proteomics. 4:3485–3497. 2004. View Article : Google Scholar : PubMed/NCBI
|
|
16
|
Rehman I, Azzouzi AR, Catto JWF, Allen S,
Cross SS, Feeley K, Meuth M and Hamdy FC: Proteomic analysis of
voided urine after prostatic massage from patients with prostate
cancer: A pilot study. Urology. 64:1238–1243. 2004. View Article : Google Scholar : PubMed/NCBI
|
|
17
|
Ye B, Skates S, Mok SC, Horick NK,
Rosenberg HF, Vitonis A, Edwards D, Sluss P, Han WK, Berkowitz RS,
et al: Proteomic-based discovery and characterization of
glycosylated eosinophil-derived neurotoxin and COOH-terminal
osteopontin fragments for ovarian cancer in urine. Clin Cancer Res.
12:432–441. 2006. View Article : Google Scholar : PubMed/NCBI
|
|
18
|
Botezatu I, Serdyuk O, Potapova G,
Shelepov V, Alechina R, Molyaka Y, Ananév V, Bazin I, Garin A,
Narimanov M, et al: Genetic analysis of DNA excreted in urine: A
new approach for detecting specific genomic DNA sequences from
cells dying in an organism. Clin Chem. 46:1078–1084.
2000.PubMed/NCBI
|
|
19
|
Oh J, Wilson L, Kirk M, Deshane J and Kim
H: Proteomics of normal human and prostate cancer urines. FASEB J.
17:759.7572003.
|
|
20
|
Kshirsagar B and Wiggins RC: A map of
urine proteins based on one-dimensional SDS-polyacrylamide gel
electrophoresis and western blotting using one microliter of
unconcentrated urine. Clin Chim Acta. 158:13–22. 1986. View Article : Google Scholar : PubMed/NCBI
|
|
21
|
Zaragoza C, Barrera R, Centeno F, Tapia JA
and Mañe MC: Canine pyometra: A study of the urinary proteins by
SDS-PAGE and western blot. Theriogenology. 61:1259–1272. 2004.
View Article : Google Scholar : PubMed/NCBI
|
|
22
|
Le Bricon T, Erlich D, Bengoufa D,
Dussaucy M, Garnier JP and Bousquet B: Sodium dodecyl
sulfate-agarose gel electrophoresis of urinary proteins:
Application to multiple myeloma. Clin Chem. 44:1191–1197.
1998.PubMed/NCBI
|
|
23
|
Marshall T and Williams KM: High
resolution two-dimensional electrophoresis of human urinary
proteins. Anal Chim Acta. 372:147–160. 1998. View Article : Google Scholar
|
|
24
|
Thongboonkerd V, McLeish KR, Arthur JM and
Klein JB: Proteomic analysis of normal human urinary proteins
isolated by acetone precipitation or ultracentrifugation. Kidney
Int. 62:1461–1469. 2002. View Article : Google Scholar : PubMed/NCBI
|
|
25
|
Adachi J, Kumar C, Zhang Y, Olsen JV and
Mann M: The human urinary proteome contains more than 1500
proteins, including a large proportion of membrane proteins. Genome
Biol. 7:R802006. View Article : Google Scholar : PubMed/NCBI
|
|
26
|
Day ML, Zhao X, Vallorosi CJ, Putzi M,
Powell CT, Lin C and Day KC: E-cadherin mediates
aggregation-dependent survival of prostate and mammary epithelial
cells through the retinoblastoma cell cycle control pathway. J Biol
Chem. 274:9656–9664. 1999. View Article : Google Scholar : PubMed/NCBI
|
|
27
|
Cheng L, Nagabhushan M, Pretlow TP, Amini
SB and Pretlow TG: Expression of E-cadherin in primary and
metastatic prostate cancer. Am J Pathol. 148:1375–1380.
1996.PubMed/NCBI
|
|
28
|
Umbas R, Isaacs WB, Bringuier PP,
Schaafsma HE, Karthaus HF, Oosterhof GO, Debruyne FM and Schalken
JA: Decreased E-cadherin expression is associated with poor
prognosis in patients with prostate cancer. Cancer Res.
54:3929–3933. 1994.PubMed/NCBI
|
|
29
|
Giroldi LA and Schalken JA: Decreased
expression of the intercellular adhesion molecule E-cadherin in
prostate cancer: Biological significance and clinical implications.
Cancer Metastasis Rev. 12:29–37. 1993. View Article : Google Scholar : PubMed/NCBI
|
|
30
|
Shimamura T, Sakamoto M, Ino Y, Sato Y,
Shimada K, Kosuge T, Sekihara H and Hirohashi S: Dysadherin
overexpression in pancreatic ductal adenocarcinoma reflects tumor
aggressiveness: Relationship to e-cadherin expression. J Clin
Oncol. 21:659–667. 2003. View Article : Google Scholar : PubMed/NCBI
|
|
31
|
Duffy MJ: Tumor markers in clinical
practice: A review focusing on common solid cancers. Med Princ
Pract. 22:4–11. 2013. View Article : Google Scholar
|
|
32
|
Gutman EB, Sproul EE and Gutman AB:
Significance of increased phosphatase activity of bone at the site
of osteoplastic metastases secondary to carcinoma of the prostate
gland. Am J Cancer. 28:485–495. 1936. View Article : Google Scholar
|
|
33
|
Wang MC, Papsidero LD, Kuriyama M,
Valenzuela LA, Murphy GP and Chu TM: Prostate antigen: A new
potential marker for prostatic cancer. Prostate. 2:89–96. 1981.
View Article : Google Scholar : PubMed/NCBI
|
|
34
|
Morikawa W, Yamamoto K, Ishikawa S,
Takemoto S, Ono M, Fukushi J, Naito S, Nozaki C, Iwanaga S and
Kuwano M: Angiostatin generation by cathepsin D secreted by human
prostate carcinoma cells. J Biol Chem. 275:38912–38920. 2000.
View Article : Google Scholar : PubMed/NCBI
|
|
35
|
Lim JTE, Mansukhani M and Weinstein IB:
Cyclin-dependent kinase 6 associates with the androgen receptor and
enhances its transcriptional activity in prostate cancer cells.
Proc Natl Acad Sci USA. 102:5156–5161. 2005. View Article : Google Scholar : PubMed/NCBI
|
|
36
|
Choi YJ and Anders L: Signaling through
cyclin D-dependent kinases. Oncogene. 33:1890–1903. 2014.
View Article : Google Scholar
|
|
37
|
Hanahan D and Weinberg RA: Hallmarks of
cancer: The next generation. Cell. 144:646–674. 2011. View Article : Google Scholar : PubMed/NCBI
|
|
38
|
Finn RS, Dering J, Conklin D, Kalous O,
Cohen DJ, Desai AJ, Ginther C, Atefi M, Chen I, Fowst C, et al: PD
0332991, a selective cyclin D kinase 4/6 inhibitor, preferentially
inhibits proliferation of luminal estrogen receptor-positive human
breast cancer cell lines in vitro. Breast Cancer Res. 11:R772009.
View Article : Google Scholar : PubMed/NCBI
|
|
39
|
Tan MHE, Li J, Xu HE, Melcher K and Yong
EL: Androgen receptor: Structure, role in prostate cancer and drug
discovery. Acta Pharmacol Sin. 36:3–23. 2015. View Article : Google Scholar :
|
|
40
|
Sardana G, Marshall J and Diamandis EP:
Discovery of candidate tumor markers for prostate cancer via
proteomic analysis of cell culture-conditioned medium. Clin Chem.
53:429–437. 2007. View Article : Google Scholar : PubMed/NCBI
|
|
41
|
Inohara H, Akahani S, Koths K and Raz A:
Interactions between galectin-3 and Mac-2-binding protein mediate
cell-cell adhesion. Cancer Res. 56:4530–4534. 1996.PubMed/NCBI
|
|
42
|
Hu J, He J, Kuang Y, Wang Z, Sun Z, Zhu H
and Liu X: Expression and significance of 90k/Mac-2BP in prostate
cancer. Exp Ther Med. 5:181–184. 2013.
|
|
43
|
Srirajaskanthan R, Caplin ME, Waugh MG,
Watkins J, Meyer T, Hsuan JJ and Beaumont NJ: Identification of
Mac-2-binding protein as a putative marker of neuroendocrine tumors
from the analysis of cell line secretomes. Mol Cell Proteomics.
9:656–666. 2010. View Article : Google Scholar :
|
|
44
|
Scanlan MJ, Simpson AJG and Old LJ: The
cancer/testis genes: Review, standardization, and commentary.
Cancer Immun. 4:1–15. 2004.PubMed/NCBI
|
|
45
|
Gure AO, Chua R, Williamson B, Gonen M,
Ferrera CA, Gnjatic S, Ritter G, Simpson AJ, Chen YT, Old LJ, et
al: Cancer-testis genes are coordinately expressed and are markers
of poor outcome in non-small cell lung cancer. Clin Cancer Res.
11:8055–8062. 2005. View Article : Google Scholar : PubMed/NCBI
|
|
46
|
Andrade VCC, Vettore AL, Almeida MSS, et
al: Prognostic impact of cancer testis antigens expression in
advanced stage multiple myeloma patients. Blood. 110:257B.
2007.
|
|
47
|
Marcovich R, Wojno KJ, Wei JT, Rubin MA,
Montie JE and Sanda MG: Bladder neck-sparing modification of
radical prostatectomy adversely affects surgical margins in
pathologic T3a prostate cancer. Urology. 55:904–908. 2000.
View Article : Google Scholar : PubMed/NCBI
|