Introduction
Lung cancer is the second most common cancer with
high mortality in both men and women (1). More than 80% of lung cancer are
non-small cell lung cancer (NSCLC) (2,3). In
China, the incidence of lung cancer in the past few decades has
doubled due to the aging population, smoking and decline in air
quality (4). Although some
treatments have achieved certain therapeutic effect, the overall
5-year survival rates of NSCLC patients is still below 15%
(5). Most NSCLC patients are in
mid-term and advanced stage when diagnosed, which could contribute
its poor prognosis. The progression of NSCLC is related to many
genetic factors, such as abnormal gene expression (6). Gu et al found that NSCLC,
comparing to other cancers, had a significantly higher ratio of
VEGF-A protein/mRNA and a significantly lower level of miR-497,
suggesting the presence of the post-transcriptional control of
VEGF-A in NSCLC which was obviously different from other cancers
(7). It demonstrated that miR-497
played an important role in suppression of VEGF-A-mediated NSCLC by
inhibiting the proliferation and invasion of cancer cells (7). Therefore, it is very important to
identify potential biomarkers of NSCLC for its prevention and
therapy.
With the rapid development of molecular biology and
bioinformatics, we can explore the mechanisms of the development
and progression of cancers at the molecular level. It also provides
some significant references for the diagnosis, prevention and
treatment of cancer (8). However,
the mechanism and development of new target-based therapies related
to lung carcinogens are still unknown. Gene microarray, as an
efficient technology, has been used to detect the expression levels
of some genes in cells and tissues at different stages of cancer.
It is also widely used for the genome-scale detections, which may
help discover the key genes associated with tumorigenesis (9).
In this study, we aimed to explore the key genes in
the early and mid-stages of NSCLC via gene microarray data
analysis. Differentially expressed genes (DEGs), Gene Ontology (GO)
terms and Kyoto Encyclopedia of Genes and Genomes (KEGG) pathways
which were associated with NSCLC were identified. A transcription
factor (TF) network was also constructed. Our study aimed to
provide a new idea and method for a better understanding of NSCLC,
so as to improve the diagnosis and treatment of early stage
NSCLC.
Materials and methods
Affymetrix microarray data
Microarray data set GSE50081, submitted by Der et
al (10), was obtained from the
Gene Expression Omnibus (GEO; http://www.ncbi.nlm.nih.gov/geo/) database. A total of
181 gene chips were available, including 48 samples in IA stage, 79
samples in IB stage, 9 samples in IIA stage and 45 samples in IIB
stage of NSCLC, respectively. Microarray data were analyzed using
GPL570 platform (Affymetrix Human Genome U133 Plus 2.0 Array),
which included 54,675 probes to detect the expression of gene
transcription levels.
Data preprocessing and screening of
DEGs
The raw data were preprocessed. CEL files were
normalized and converted to expression profiles using Affy package
of R (11). If multiple probes
corresponded to one given gene, the mean expression value was
defined as the expression value. Limma package of R was used to
analyze the DEGs of stage IA samples, IB samples, IIA samples and
IIB samples (12). The samples were
divided into three groups: IA vs. IB, IIA vs. IB and IIA vs. IIB.
The gene expression values were normalized followed by the t-test
of the non-paired samples (13).
The multiple testing corrections were performed through
Beniamini-Hochberg. FDR <0.05 and |logFC (fold change)| >2
were used as the threshold for identifying the DEGs.
Functional enrichment analysis
GO and KEGG pathway analysis of DEGs were conducted
via ToppGene Suite (http://toppgene.cchmc.org) (14). ToppGene Suite is a one-stop portal
for gene list functional enrichment, candidate gene prioritization
using either functional annotations or network analysis and
identification and prioritization of novel disease candidate genes
in the interactome (14). Adjusted
P≤0.05 was used as cut-off criterion.
Construction of transcriptional
regulatory network
With the cut-offs of adjusted P<0.05, the TFs and
miRNAs which interacted with target DEGs were identified by the
online database GeneCoDis (http://genecodis.cnb.csic.es/) (15). These pairs were used to construct
transcriptional regulatory network. Visualization of
transcriptional regulatory network was performed by Cytoscape
software (16).
Results
Identification of DEGs
A total of 19,851 genes were obtained after the
processes of background calibration, standardization and the
transformation from probe symbols to the gene symbol, which were
used for the further analysis. The total 56 DEGs, consisted of 25
in IB vs. with IA, 17 in IIA vs. IB and 14 in IIB vs. IIA, as
detailed in Table I. The variation
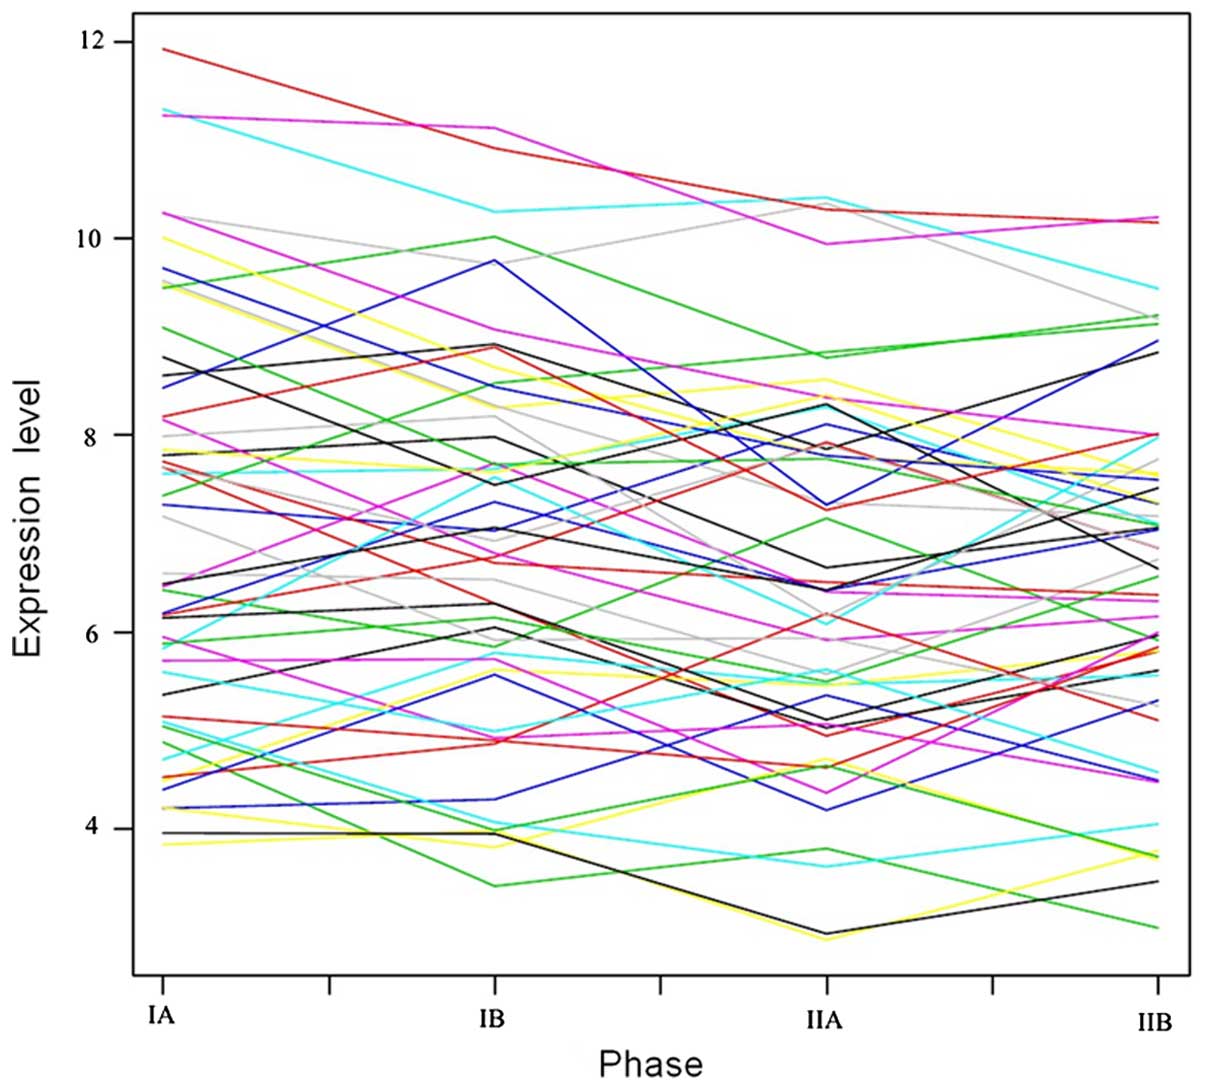
in trends of the DEGs expression values in the three groups are
shown in Fig. 1.
 | Table IThe three groups of differentially
expressed genes. |
Table I
The three groups of differentially
expressed genes.
| IB/IA | logFC | P-value | IIA/IB | logFC | P-value | IIB/IIA | logFC | P-value |
|---|
| CPB2 | −1.46 | 3.83E-05 | CYP1A1 | 1.06 | 0.000686 | NOG | −1.03 | 0.007331 |
| IL8 | 1.13 | 0.000285 | SERPINA3 | −2.03 | 0.000757 | SERPINA3 | 1.59 | 0.010848 |
| LRRK2 | −1.03 | 0.000594 | TSPAN1 | −1.65 | 0.00116 | SPRY2 | −1.09 | 0.012028 |
| AGR3 | −1.38 | 0.000674 | ALOX15B | 1.31 | 0.001853 | RPL39L | 1.07 | 0.012364 |
| PEBP4 | −1.26 | 0.000772 | ID1 | −1.23 | 0.002166 | NLRP2 | 1.63 | 0.012685 |
| CYP4B1 | −1.35 | 0.000864 | MB | −1.18 | 0.005791 | TMEM163 | −1.05 | 0.013372 |
| LY6D | 1.13 | 0.000998 | S100P | −2.49 | 0.006031 | ALOX15B | −1.24 | 0.016598 |
| ZNF385B | −1.06 | 0.001022 | AGR2 | −1.33 | 0.013493 | TRIP13 | 1.04 | 0.023701 |
| CYP24A1 | 1.08 | 0.00145 | MFAP5 | 1.32 | 0.017172 | MALL | −1.18 | 0.026681 |
| HSD17B6 | −1.03 | 0.001823 | PLEKHS1 | −1.02 | 0.017271 | BAMBI | −1.19 | 0.027515 |
| SFTPC | −1.39 | 0.003012 | ANXA1 | 1.08 | 0.023946 | EYA2 | 1.17 | 0.030051 |
| C16orf89 | −1.26 | 0.003714 | NLRP2 | −1.36 | 0.032368 | SLAIN1 | −1.04 | 0.033329 |
| S100P | 1.30 | 0.004488 | DNER | −1.11 | 0.034532 | PRSS21 | 1.23 | 0.035066 |
| MMP10 | 1.17 | 0.005196 | CA9 | −1.02 | 0.036787 | CCL11 | −1.07 | 0.043612 |
| SFTPD | −1.21 | 0.006222 | SLPI | −1.18 | 0.041679 | | | |
| C4BPA | −1.27 | 0.006294 | FXYD3 | −1.07 | 0.044774 | | | |
| SFTA3 | −1.30 | 0.0096 | CCL11 | 1.16 | 0.045338 | | | |
| SCGB2A1 | −1.02 | 0.009966 | | | | | | |
| SFTPB | −1.01 | 0.010427 | | | | | | |
| KRT6A | 1.74 | 0.01062 | | | | | | |
| SCGB3A2 | −1.32 | 0.012366 | | | | | | |
| MMP1 | 1.14 | 0.013572 | | | | | | |
| BPIFA1 | 1.25 | 0.014045 | | | | | | |
| SCGB3A1 | −1.19 | 0.019787 | | | | | | |
| NAPSA | −1.04 | 0.022362 | | | | | | |
Functional enrichment analysis of
DEGs
A total of 110 enriched GO terms and 8 KEGG pathways
for DEGs were identified. The top 10 enriched GO terms are listed
in Table II, and 8 enriched KEGG
pathways are shown in Table III.
The top three pathways were bioactivation via cytochrome P450
(P=1.01E-04), Arachidonic acid metabolism (P=3.19E-04), Cytochrome
P450, arranged by substrate type (P=3.57E-04).
| Table IIThe top 10 enriched GO terms for
DEGs. |
Table II
The top 10 enriched GO terms for
DEGs.
| Category | GO ID | GO name | Gene number | P-value |
|---|
| CC | GO:0005615 | Extracellular
space | 16 | 5.44E-08 |
| CC | GO:0097208 | Alveolar lamellar
body | 3 | 1.29E-06 |
| CC | GO:0042599 | Lamellar body | 3 | 5.52E-06 |
| BP | GO:0050828 | Regulation of
liquid surface tension | 2 | 6.90E-06 |
| BP | GO:0016477 | Cell migration | 12 | 1.72E-05 |
| MF | GO:0070576 | Vitamin D
24-hydroxylase activity | 2 | 1.93E-05 |
| BP | GO:0048870 | Cell motility | 12 | 4.05E-05 |
| BP | GO:0051674 | Localization of
cell | 12 | 4.05E-05 |
| MF | GO:0005506 | Iron ion
binding | 5 | 7.45E-05 |
| CC | GO:0005771 | Multivesicular
body | 3 | 8.75E-05 |
| Table IIIThe enriched KEGG pathways for
DEGs. |
Table III
The enriched KEGG pathways for
DEGs.
| Category | Pathway name | Gene number | P-value |
|---|
| KEGG_PATHWAY | Bioactivation via
cytochrome P450 | 2 | 1.01E-04 |
| KEGG_PATHWAY | Arachidonic acid
metabolism | 3 | 3.19E-04 |
| KEGG_PATHWAY | Cytochrome P450 -
arranged by substrate type | 3 | 3.57E-04 |
| KEGG_PATHWAY | Cytochrome
P450 | 3 | 5.68E-04 |
| KEGG_PATHWAY | Phase 1 -
functionalization of compounds | 3 | 8.44E-04 |
| KEGG_PATHWAY | Plasminogen
activating cascade | 2 | 8.99E-04 |
| KEGG_PATHWAY | TGF-β signaling
pathway | 3 | 1.19E-03 |
| KEGG_PATHWAY | Fatty acid
metabolic | 2 | 1.66E-03 |
Analysis of regulatory network between
TFs and miRNAs
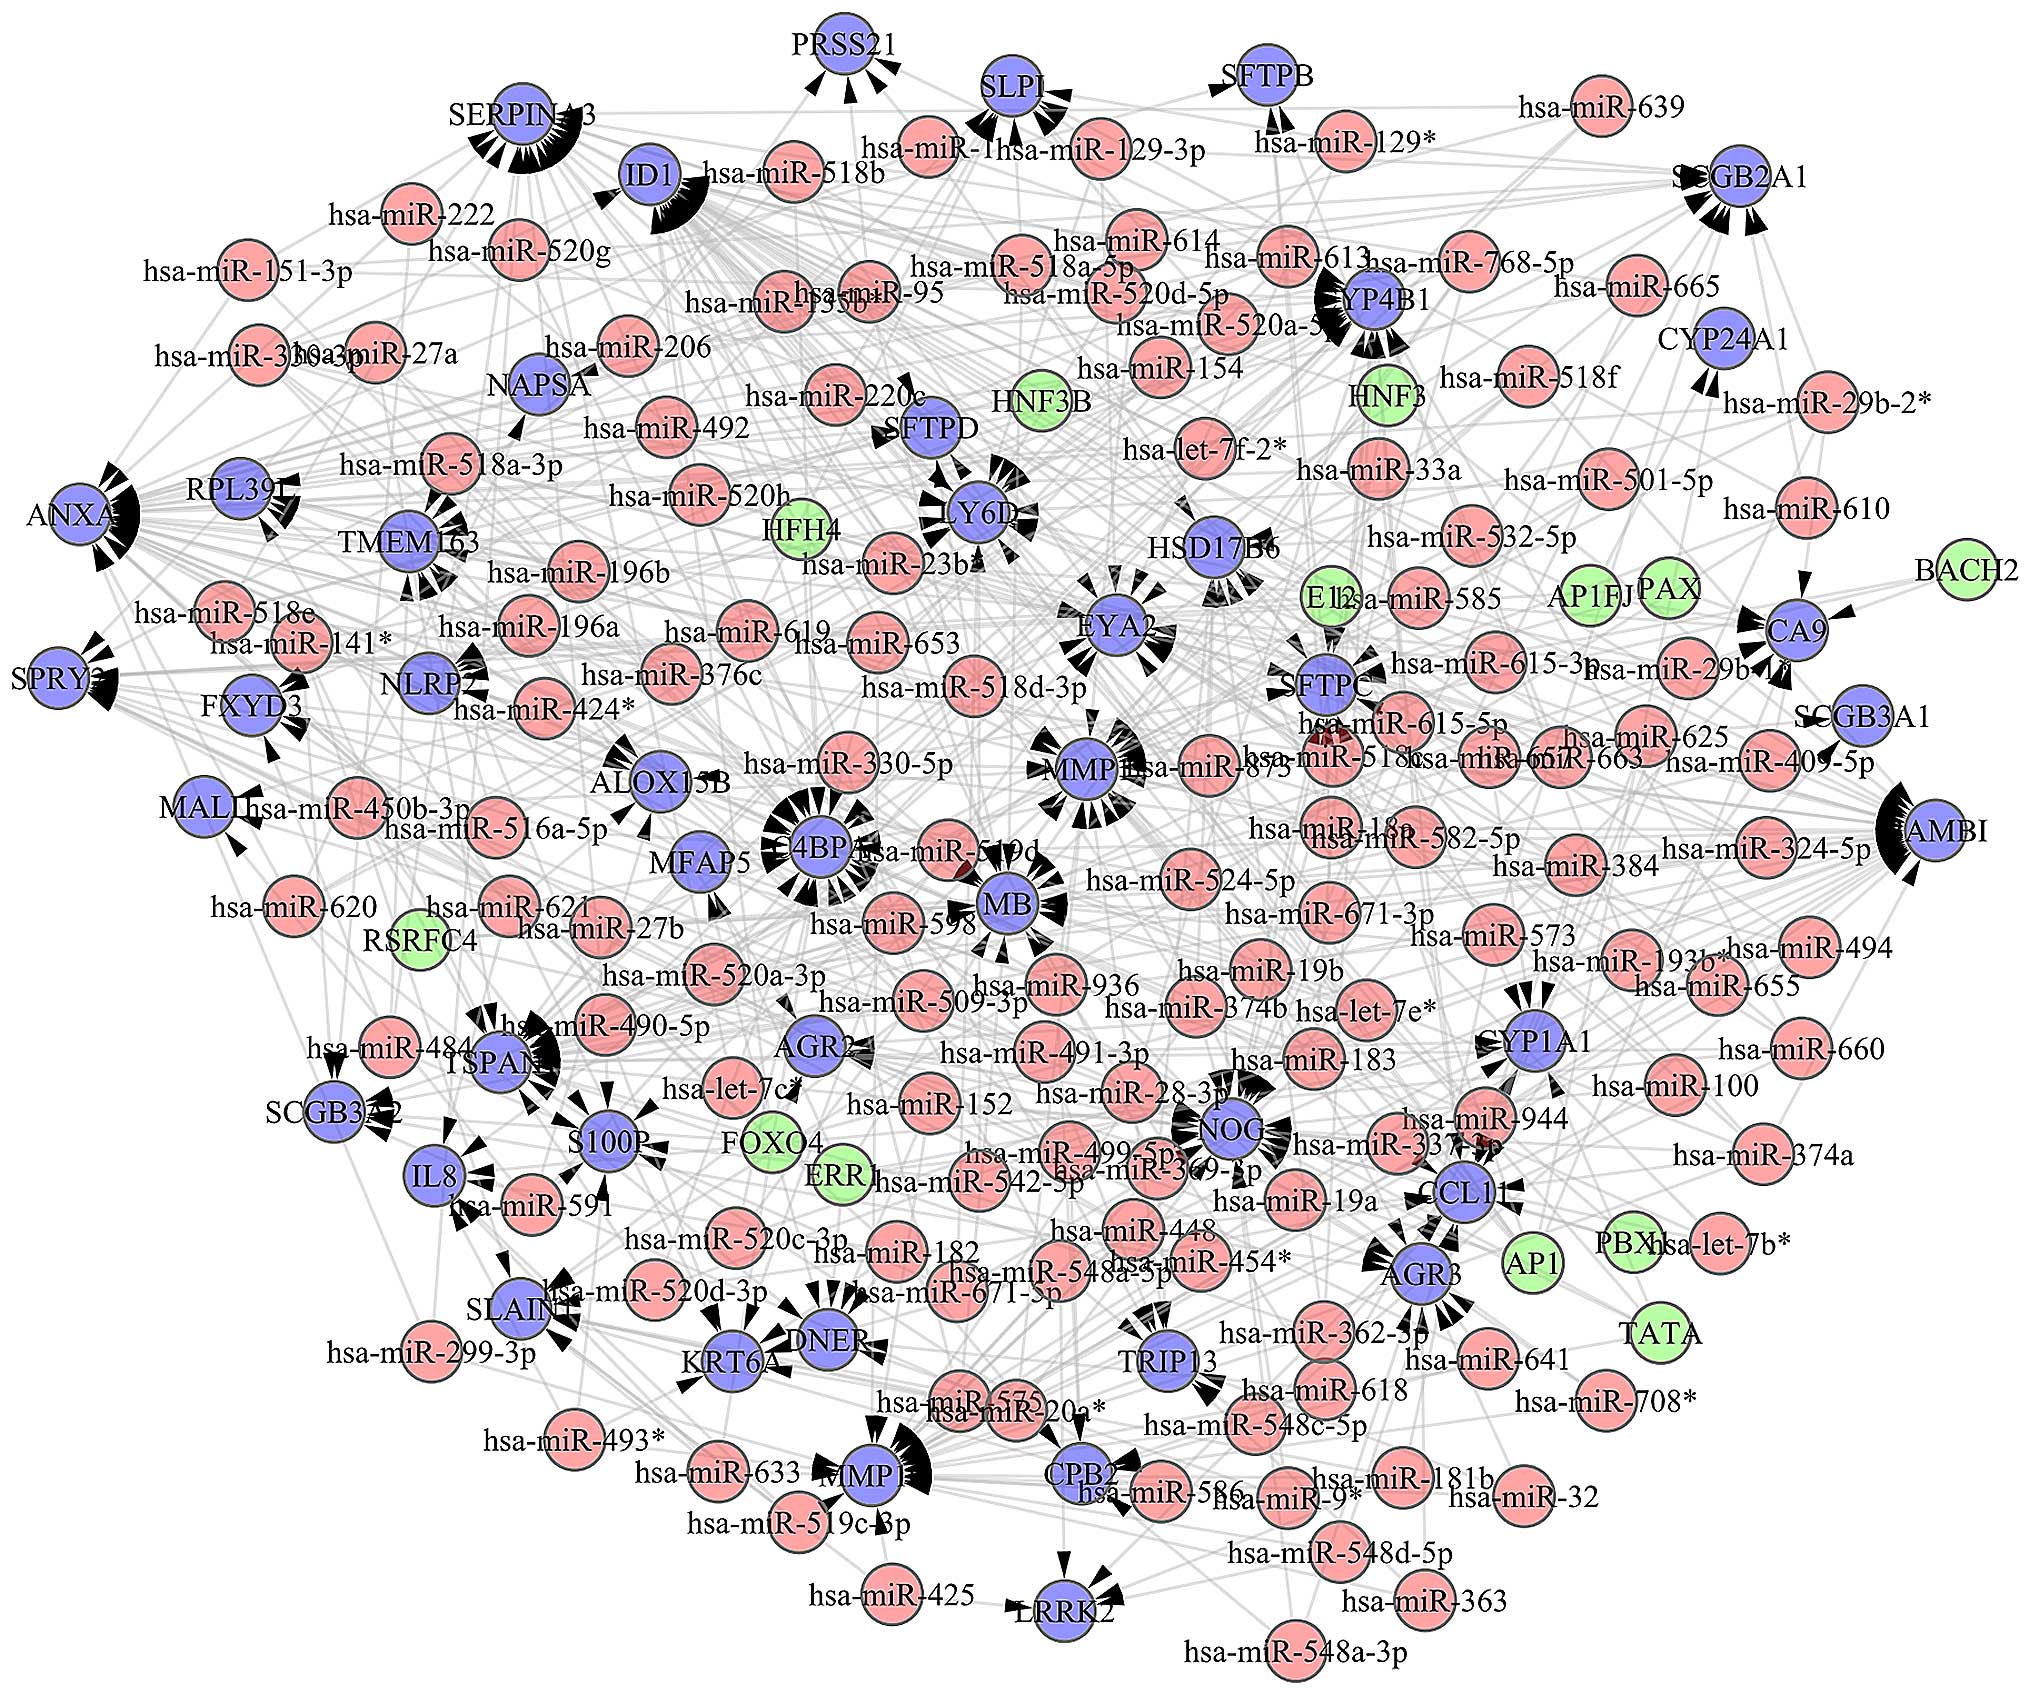
Following the screening of TFs, we constructed a
regulatory network between TFs and miRNAs including 13 TFs, 120
miRNAs and 563 edges (Fig. 2).
Based on this regulatory network, TFs (e.g., hsa-miR-653,
hsa-miR-548a-5p, hsa-miR-491-3p,
hsa-miR-518d-3p, hsa-miR-518c, hsa-miR-330-3p
and hsa-miR-374a) were obtained which closely connected with
others. Each of them interacted with seven genes, respectively.
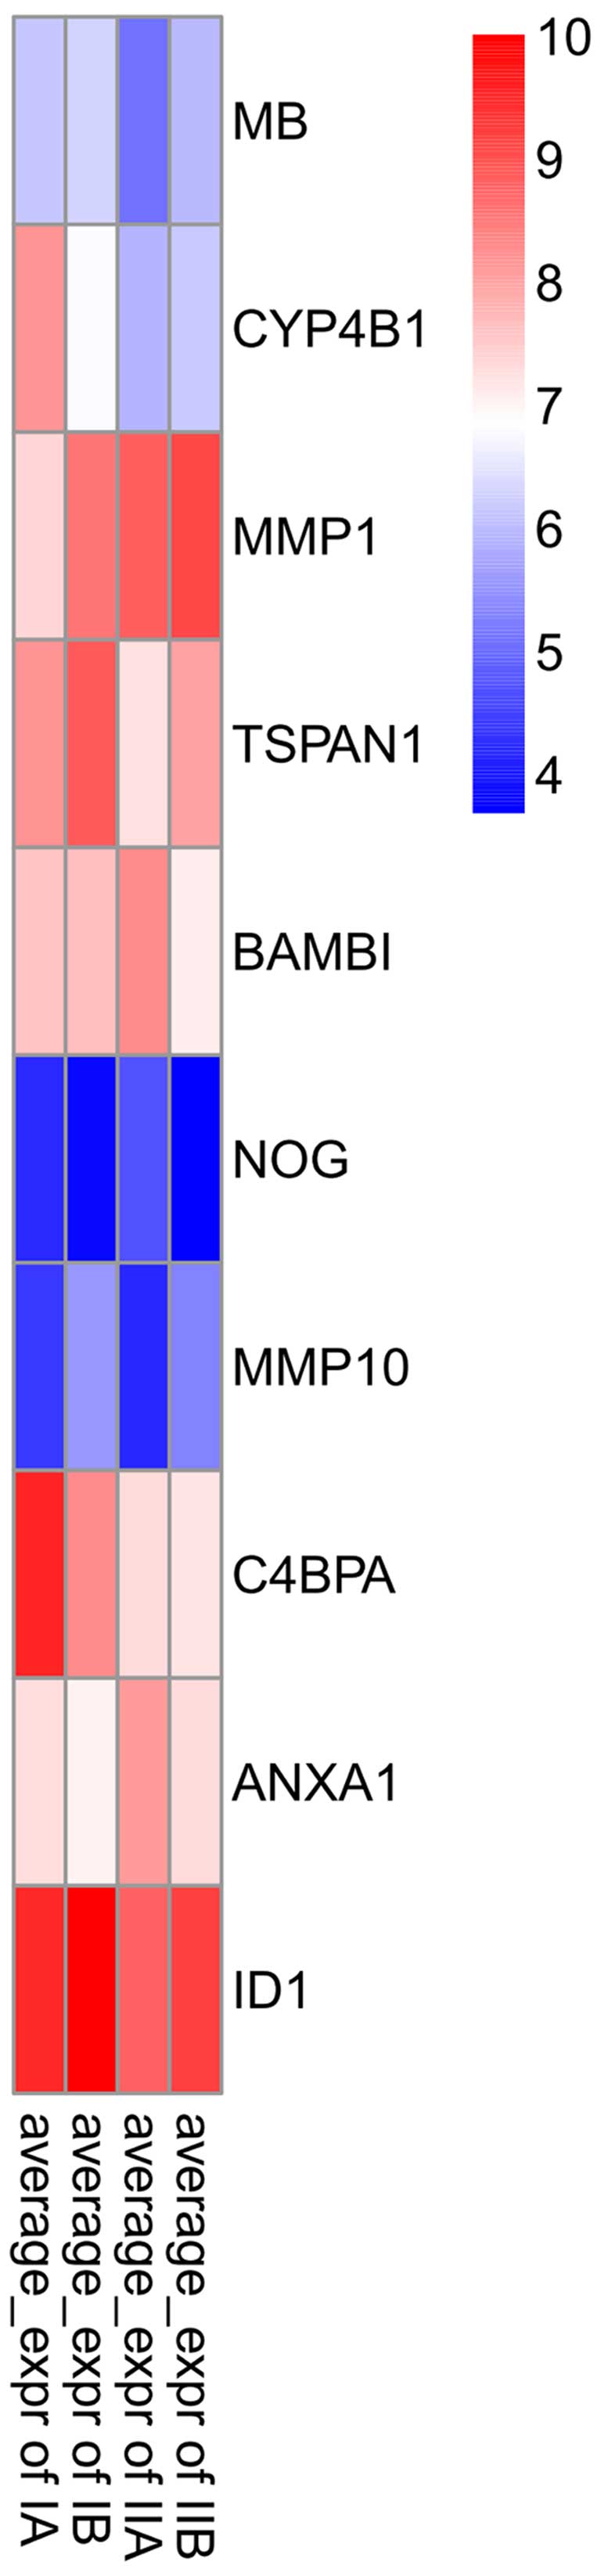
ID1 was regulated by the most number of the genes including
35 TFs and miRNA. The top 10 genes which closely connected with
others in the NSCLC samples of these four stages are shown in
Fig. 3.
Discussion
Substantial research efforts has been made in
exploring the mechanisms of NSCLC, however, the current
understanding of the genetic alterations associated with the
progressing NSCLC has not been elucidated. In our present study, 52
DEGs of NSCLC were identified using gene microarray analysis. These
DEGs may influence the occurrence and development of NSCLC, thus,
they will provide important references for the diagnosis and
treatment of NSCLC.
Gene microarray data in the early and mid-stage
NSCLC were obtained from the GEO database. An important coinciding
gene (S100P) was found differentially expressed in IA vs. IB
and IIA vs. IB, respectively. S100P is a 95-amino acid
member of S100 protein family. It contains 2 EF-hand
calcium-binding motifs (17) and
involves in a series of cellular regulation processes, such as cell
cycle progressions and differentiation (18). S100P was found to be one of
the target genes studied in many cancers including NSCLC (19). The expression of S100P was
associated with drug resistance, metastasis, and poor clinical
outcome. According to our results, S100P was upregulated in
IB vs. IA and downregulated in IIA vs. IB. It could be speculated
that the expression of S100P increased in the processes of
cancer migration and invasion in the early stage of NSCLC, and then
its expression was inhibited by certain factors, such as the immune
system.
Besides, 4 overlapped genes (ALOX15B,
CCL11, NLRP2 and SERPINA3) were identified in
IIA vs. IB and IIA vs. IIB. The knockdown of the human arachidonate
15-lipoxygenase type B (ALOX15B) was reported to reduce the
inflammation and lipid accumulation, suggesting its active
pro-inflammatory and proatherogenic role (20). Pyrin domain-containing protein 2
(NALP2) was characterized by an N-terminal pyrin domain
(PYD). It was involved in the activation of caspase-1 by Toll-like
receptors (21). The expression of
NALP2 was regulated by inflammatory mediators which were
closely related to cancer (22,23).
As a member of the CC chemokine family, eotaxin-1 (CCL11)
was initially regarded as an eosinophil chemoattractant, and
involved in the recruitment of inflammatory cells, such as
eosinophils and neutrophils (24).
Overexpression CCL11 was found in various inflammatory
diseases, such as allergic asthma. CCL11 was also reported
as diagnostic marker for some cancers, such as prostate cancer
(25,26). Collectively, the dysregulation of
the 4 overlapped genes in different paired comparisons (Table I) revealed that the key genes may
play different roles at different stages of NSCLC.
The regulatory network revealed that FoxO4
was closely connected with other nodes. It participated in the
processes of cell cycle, aging, apoptosis, stress response,
tumorigenesis and metabolisms. The expression of FoxO4 was
confirmed in the studies of 8 cases of NSCLC patients. The
immunohistochemistry method was used to characterize the expression
of FoxO4 (27). Many studies
have demonstrated the relationships between FoxO4 and a
variety of cancers. According to Su et al, the transcription
factor FoxO4 was downregulated and inhibited tumor
proliferation and metastasis in gastric cancer (28). The expression of FoxO4 was
significantly decreased in colorectal cancer, indicating that
FoxO4 acted as a tumor suppressor in the development and
progression of colorectal cancer (29).
miRNA is a non-coding RNA of about 20–25 nt in
length, which can affect the phase of post-transcriptional process
to regulate the expression levels of genes (30). The development of cancer is
associated with the reduction of tumor suppressor genes which are
regulated by miRNAs. In this study, hsa-miR-491 was
regulated by the most number of TFs serving as modulators and
biomarkers for the invasion and metastasis of oral squamous cell
carcinoma (31). According to other
reports, hsa-miR-491 was found to be involved in metastasis
of hepatocellular carcinoma by inhibition of matrix
metalloproteinase and epithelial to mesenchymal transition based on
the the methods of miRNA microarray analysis, RT-PCR, western
blotting, Transwell invasion and immunohistochemistry (32), and it may even play a role in
stemness of stem cells and cancer stem cells in lung tumors
(33). Moreover, the roles of other
target genes of hsa-miR-491 have also been reported in many
studies, so they may be the novel biomarkers of NSCLC.
In conclusion, a set of DEGs were screened and
considered to be related to the development of NSCLC. S100P,
ALOX15B, CCL11, NLRP2, SERPINA3,
FoxO4 and hsa-miR-491 may act as candidate diagnostic
markers for NSCLC patients. However, further experiments are still
needed to confirm the results.
Acknowledgments
This study was supported by Central Laboratory of
Cangzhou Central Hospital.
References
|
1
|
Farhat FS and Houhou W: Targeted therapies
in non-small cell lung carcinoma: What have we achieved so far?
Ther Adv Med Oncol. 5:249–270. 2013. View Article : Google Scholar : PubMed/NCBI
|
|
2
|
Tian ZQ, Li ZH, Wen SW, Zhang YF, Li Y,
Cheng JG and Wang GY: Identification of commonly dysregulated genes
in non-small-cell lung cancer by integrated analysis of microarray
data and qRT-PCR validation. Lung. 193:583–592. 2015. View Article : Google Scholar : PubMed/NCBI
|
|
3
|
Liu Q, Yu Z, Xiang Y, Wu N, Wu L, Xu B,
Wang L, Yang P, Li Y and Bai L: Prognostic and predictive
significance of thymidylate synthase protein expression in
non-small cell lung cancer: A systematic review and meta-analysis.
Cancer Biomark. 15:65–78. 2015.
|
|
4
|
Wang Y, Chen J, Wu S, Hu C, Li X, Wang Y,
Yang Y, Rajan N, Chen Y, Chen Y, et al: Clinical effectiveness and
clinical toxicity associated with platinum-based doublets in the
first-line setting for advanced non-squamous non-small cell lung
cancer in Chinese patients: A retrospective cohort study. BMC
Cancer. 14:9402014. View Article : Google Scholar : PubMed/NCBI
|
|
5
|
Tsai MF, Wang CC and Chen JJ: Tumour
suppressor HLJ1: A potential diagnostic, preventive and therapeutic
target in non-small cell lung cancer. World J Clin Oncol.
5:865–873. 2014. View Article : Google Scholar : PubMed/NCBI
|
|
6
|
Isa T, Tomita S, Nakachi A, Miyazato H,
Shimoji H, Kusano T, Muto Y and Furukawa M: Analysis of
microsatellite instability, K-ras gene mutation and p53 protein
overexpression in intrahepatic cholangiocarcinoma.
Hepatogastroenterology. 49:604–608. 2002.PubMed/NCBI
|
|
7
|
Gu A, Lu J, Wang W, Shi C, Han B and Yao
M: Role of miR-497 in VEGF-A-mediated cancer cell growth and
invasion in non-small cell lung cancer. Int J Biochem Cell Biol.
70:118–125. 2015. View Article : Google Scholar : PubMed/NCBI
|
|
8
|
Ma GF, Zhang RF, Ying KJ and Wang D:
Effect evaluation of cisplatin-gemcitabine combination chemotherapy
for advanced non-small cell lung cancer patients using microarray
data. Eur Rev Med Pharmacol Sci. 19:578–585. 2015.PubMed/NCBI
|
|
9
|
Guo W, Xie L, Zhao L and Zhao Y: mRNA and
microRNA expression profiles of radioresistant NCI-H520 non-small
cell lung cancer cells. Mol Med Rep. 12:1857–1867. 2015.PubMed/NCBI
|
|
10
|
Der SD, Sykes J, Pintilie M, Zhu CQ,
Strumpf D, Liu N, Jurisica I, Shepherd FA and Tsao MS: Validation
of a histology-independent prognostic gene signature for
early-stage, non-small-cell lung cancer including stage IA
patients. J Thorac Oncol. 9:59–64. 2014. View Article : Google Scholar
|
|
11
|
Gautier L, Cope L, Bolstad BM and Irizarry
RA: Affy - analysis of Affymetrix GeneChip data at the probe level.
Bioinformatics. 20:307–315. 2004. View Article : Google Scholar : PubMed/NCBI
|
|
12
|
Diboun I, Wernisch L, Orengo CA and
Koltzenburg M: Microarray analysis after RNA amplification can
detect pronounced differences in gene expression using limma. BMC
Genomics. 7:2522006. View Article : Google Scholar : PubMed/NCBI
|
|
13
|
Yan X, Jiang Z, Bi L, Yang Y and Chen W:
Salvianolic acid A attenuates TNF-α- and D-GalN-induced ER
stress-mediated and mitochondrial-dependent apoptosis by modulating
Bax/Bcl-2 ratio and calcium release in hepatocyte LO2 cells. Naunyn
Schmiedebergs Arch Pharmacol. 388:817–830. 2015. View Article : Google Scholar : PubMed/NCBI
|
|
14
|
Chen J, Bardes EE, Aronow BJ and Jegga AG:
ToppGene Suite for gene list enrichment analysis and candidate gene
prioritization. Nucleic Acids Res. 37:W305–W311. 2009. View Article : Google Scholar : PubMed/NCBI
|
|
15
|
Nogales-Cadenas R, Carmona-Saez P, Vazquez
M, Vicente C, Yang X, Tirado F, Carazo JM and Pascual-Montano A:
GeneCodis: Interpreting gene lists through enrichment analysis and
integration of diverse biological information. Nucleic Acids Res.
37:W317–W322. 2009. View Article : Google Scholar : PubMed/NCBI
|
|
16
|
Shannon P, Markiel A, Ozier O, Baliga NS,
Wang JT, Ramage D, Amin N, Schwikowski B and Ideker T: Cytoscape: A
software environment for integrated models of biomolecular
interaction networks. Genome Res. 13:2498–2504. 2003. View Article : Google Scholar : PubMed/NCBI
|
|
17
|
Becker T, Gerke V, Kube E and Weber K:
S100P, a novel Ca(2+)-binding protein from human placenta. cDNA
cloning, recombinant protein expression and Ca2+ binding
properties. Eur J Biochem. 207:541–547. 1992. View Article : Google Scholar : PubMed/NCBI
|
|
18
|
Zhang H, Wang G, Ding Y, Wang Z,
Barraclough R, Rudland PS, Fernig DG and Rao Z: The crystal
structure at 2A resolution of the Ca2+ -binding protein
S100P. J Mol Biol. 325:785–794. 2003. View Article : Google Scholar : PubMed/NCBI
|
|
19
|
Bartling B, Rehbein G, Simm A, Silber RE
and Hofmann HS: Porcupine expression is associated with the
expression of S100P and other cancer-related molecules in non-small
cell lung carcinoma. Int J Oncol. 36:1015–1021. 2010. View Article : Google Scholar : PubMed/NCBI
|
|
20
|
Magnusson LU, Lundqvist A, Karlsson MN,
Skålén K, Levin M, Wiklund O, Borén J and Hultén LM: Arachidonate
15-lipoxygenase type B knockdown leads to reduced lipid
accumulation and inflammation in atherosclerosis. PLoS One.
7:e431422012. View Article : Google Scholar : PubMed/NCBI
|
|
21
|
Tschopp J, Martinon F and Burns K: NALPs:
A novel protein family involved in inflammation. Nat Rev Mol Cell
Biol. 4:95–104. 2003. View
Article : Google Scholar : PubMed/NCBI
|
|
22
|
Chan KS, Sano S, Kiguchi K, Anders J,
Komazawa N, Takeda J and DiGiovanni J: Disruption of Stat3 reveals
a critical role in both the initiation and the promotion stages of
epithelial carcinogenesis. J Clin Invest. 114:720–728. 2004.
View Article : Google Scholar : PubMed/NCBI
|
|
23
|
Moore RJ, Owens DM, Stamp G, Arnott C,
Burke F, East N, Holdsworth H, Turner L, Rollins B, Pasparakis M,
et al: Mice deficient in tumor necrosis factor-α are resistant to
skin carcinogenesis. Nat Med. 5:828–831. 1999. View Article : Google Scholar : PubMed/NCBI
|
|
24
|
Menzies-Gow A, Ying S, Sabroe I, Stubbs
VL, Soler D, Williams TJ and Kay AB: Eotaxin (CCL11) and eotaxin-2
(CCL24) induce recruitment of eosinophils, basophils, neutrophils,
and macrophages as well as features of early- and late-phase
allergic reactions following cutaneous injection in human atopic
and nonatopic volunteers. J Immunol. 169:2712–2718. 2002.
View Article : Google Scholar : PubMed/NCBI
|
|
25
|
Campbell EM, Kunkel SL, Strieter RM and
Lukacs NW: Temporal role of chemokines in a murine model of
cockroach allergen-induced airway hyperreactivity and eosinophilia.
J Immunol. 161:7047–7053. 1998.PubMed/NCBI
|
|
26
|
Yawalkar N, Uguccioni M, Schärer J,
Braunwalder J, Karlen S, Dewald B, Braathen LR and Baggiolini M:
Enhanced expression of eotaxin and CCR3 in atopic dermatitis. J
Invest Dermatol. 113:43–48. 1999. View Article : Google Scholar : PubMed/NCBI
|
|
27
|
Xu MM, Mao GX, Liu J, Li JC, Huang H, Liu
YF and Liu JH: Low expression of the FoxO4 gene may contribute to
the phenomenon of EMT in non-small cell lung cancer. Asian Pac J
Cancer Prev. 15:4013–4018. 2014. View Article : Google Scholar : PubMed/NCBI
|
|
28
|
Su L, Liu X, Chai N, Lv L, Wang R, Li X,
Nie Y, Shi Y and Fan D: The transcription factor FOXO4 is
down-regulated and inhibits tumor proliferation and metastasis in
gastric cancer. BMC Cancer. 14:3782014. View Article : Google Scholar : PubMed/NCBI
|
|
29
|
Liu XQ, Tang SH, Zhang ZY and Jin HF:
Expression and clinical significance of FOX04 in colorectal cancer.
Chinese J Cell Mol Immunol. 27:969–971. 2011.In Chinese.
|
|
30
|
Salic K and De Windt LJ: MicroRNAs as
biomarkers for myocardial infarction. Curr Atheroscler Rep.
14:193–200. 2012. View Article : Google Scholar : PubMed/NCBI
|
|
31
|
Huang WC, Chan SH, Jang TH, Chang JW, Ko
YC, Yen TC, Chiang SL, Chiang WF, Shieh TY, Liao CT, et al:
miRNA-491-5p and GIT1 serve as modulators and biomarkers for oral
squamous cell carcinoma invasion and metastasis. Cancer Res.
74:751–764. 2014. View Article : Google Scholar
|
|
32
|
Zhou Y, Li Y, Ye J, Jiang R, Yan H, Yang
X, Liu Q and Zhang J: MicroRNA-491 is involved in metastasis of
hepatocellular carcinoma by inhibitions of matrix metalloproteinase
and epithelial to mesenchymal transition. Liver Int. 33:1271–1280.
2013. View Article : Google Scholar : PubMed/NCBI
|
|
33
|
Mowla SJ, Naeli P, Mirzadeh AF and
Tavallaei M: Evaluating the expression of miR-491 as a potential
stemness marker in lung tumor and non-tumor tissue. Cell J
(Yakhteh). 15(Suppl 1): 632013.
|