Introduction
4-Nitroquinoline-1-oxide (4-NQO) treatment induces
oral cancer in rats presenting an invasive malignancy in an
appropriate anatomic site, which demonstrates considerable
histologic and molecular similarity to oral cancers commonly seen
in humans (1,2). Therefore, it is a suitable animal
model for in vivo evaluation of the efficacy of
chemopreventive and therapeutic agents and screening for biomarkers
for both tumor progression and treatment. Different strains of rats
have been used in this model (3–5).
Studies performed in our laboratory (6) demonstrate that invasive oral cancers
induced by the administration of 4-NQO develop in 4–6 months after
the first exposure to this carcinogenic chemical, and demonstrate
highly reproducible incidence and latency patterns. To understand
the molecular basis of oral carcinogenesis and identify gene
biomarkers and potential chemopreventive targets for future
studies, we recently characterized the molecular alteration of the
model by performing gene expression microarray using OSCC samples
generated from this model. However, in the process of confirming
the microarray results by RT-PCR, we found that it would be
necessary to identify a reliable reference gene(s) (RG) for
normalization.
Quantitative RT-PCR is a commonly used technique for
gene expression analyses. However, RT-PCR is greatly affected by
multiple factors including RNA integrity, purity, concentration,
the presence of inhibitors for RT or PCR in the samples, primers
and enzyme efficiencies, DNA contamination, pipetting errors, as
well as the choice of RGs for normalization (7). The effects of most of these factors
can be minimized by careful operation or using improved approaches.
For example, RNA quality and quantity can be assessed using an
Agilent bioanalyzer; DNA contamination can be eliminated by
treating RNA samples with DNase I. However, RG(s) should be
selected with caution. An ideal RG should have a stable basal
expression in different tissues, genders, developmental stages, and
experimental conditions and should have similar expression levels
to the target genes of interest (8). To date, there is no such gene whose
expression fulfills these criteria (9). Housekeeping genes have been widely
used as RGs, however, the expression levels of housekeeping genes
can be affected by both experimental conditions and tissue
structure/cellular compositions (10). Thus, the identification of reliable
RGs is crucial and should always precede gene expression analyses
(8), since gene expression analyses
rely on proper normalization to avoid false positive/negative
results, which lead to data misinterpretations and even wrong
conclusions. Some effort has recently been diverted to the
identification of RGs in different tissue types and experimental
conditions and different strategies and statistical approaches have
been developed (8,11–14).
Gene expression comparison between tumors and normal tissues is
frequently made for molecular characterization of specific tumors
and identification of tumor-specific biomarkers. In the present
study, microarray and qRT-PCR approaches were used to screen for
potential RGs between tumors and adjacent phenotypically normal
tissues. Statistical approaches such as NormFinder (11) and GeNorm (12) that were designed to identify
relatively more stable RGs were used to evaluate the stability of
potential RG candidates selected based on microarray and RT-PCR
data. Hsp90ab1 was successfully established and validated as the
best RG in 4-NQO-induced rat OSCC compared to adjacent normal
tissues, paving a way for further molecular characterization of
this carcinogenesis model.
Materials and methods
Induction of OSCC by 4-NQO in F344 rats
and tissue RNA sample preparation
Induction of OSCC by 4-NQO in F344 rats was
previously described in detail (15). Briefly, 6–7 week-old male F344 rats
received 4-NQO (Sigma-Aldrich, St. Louis, MO, USA) at a
concentration of 20 ppm in their drinking water for 10 weeks; after
the 10 weeks, the rats received drinking water without added 4-NQO.
The study was terminated at 26 weeks after the first day of
carcinogen exposure. At necropsy, the tongue from each animal was
carefully excised and all gross oral lesions were charted. The
tongue was then bisected longitudinally; half of each tongue was
fixed in 10% neutral buffered formalin and processed for
histopathologic evaluation. Tumor and adjacent normal tissue were
carefully separated from the remaining half of each tongue and were
snap-frozen in liquid nitrogen and stored at −80°C for use in
molecular studies. Histologically confirmed OSCC and adjacent
phenotypically normal tissue were selected for molecular analyses.
Total RNA was isolated from paired sets of malignant and normal
tissues using the RNeasy Mini kit (Qiagen, Germantown, MD, USA)
with on-column DNase I digestion according to the manufacturer's
instructions.
Microarray analysis
Total RNA isolated from 11 pairs of neoplastic and
adjacent normal tongue tissues were individually subjected to
microarray analysis using Agilent Rat GE 4x44K v3 arrays (Agilent
Technologies, Santa Clara, CA, USA). After RNA isolation, the
quality and quantity of total RNA were determined using an Agilent
bioanalyzer. First and second strand cDNAs were prepared from the
total RNA samples; cRNA target was prepared from the DNA template,
verified using the bioanalyzer, fragmented to uniform size, and
then hybridized to the microarrays. Slides were washed and scanned
using an Agilent G2565 Microarray Scanner. Data were analyzed using
Agilent Feature Extraction and GeneSpring GX v7.3.1 software
packages. Microarray data for the 11 sample pairs have been
deposited in the National Center for Biotechnology Information Gene
Expression Omnibus (GEO), accession GSE51125.
Quantitative RT-PCR
RNA integrity was examined by 1% agarose gel
electrophoresis and RNA purity was assessed by spectrophotometer
using the A260/A280 ratio. RNA samples with
A260/A280<1.8 were eliminated for RT-PCR
analysis. RNA was quantitated using Quant-iT RiboGreen RNA assay
kit (Life Technologies, Grand Island, NY, USA). RT-PCR analysis was
performed as described previously (16) with some modifications. Briefly, 200
ng total RNA was used for RT reaction (in 20 µl reaction
volume) for each sample. RT products (cDNA) were diluted by 4-fold
with DNase/RNase free water. Real-time PCR was performed with 2
µl diluted RT products in a CFX96 Real-Time PCR detection
system using iQ SYBR Green PCR Supermix (both from Bio-Rad,
Hercules, CA, USA). Gene-specific primers were designed using
Primer 3 software (http://frodo.wi.mit.edu/cgi-bin/primer3/primer3_www.cgi).
Primers were designed to span one intron if possible. Primer
sequences are provided in Table I.
Cq values for each sample were determined by the CFX manager 3.0
software. Since PCR efficiencies were high (>90%) and comparable
based on our tests with multiple primer pairs using serial
dilutions of pooled cDNA samples, we used the theoretical value of
100% for gene expression calculation (17). Relative gene expression was
calculated using the formula 2−(ΔCq), where ΔCq is
Cq(sample) − Cq(min). One sample with the
highest Cq value [Cq(min)] served as a common control for relative
gene expression calculations (8).
To ensure the specificity of PCR for each primer pair, melting
curve analysis was performed after PCR reaction.
 | Table ISpecific primers used for RT-PCR
analysis. |
Table I
Specific primers used for RT-PCR
analysis.
| Gene name | Accession no. | Primer sequence | Amplicon size
(bp) |
|---|
| 18S-rRNA | NR_046237.1 | F:
CGAAAGCATTTGCCAAGAAT
R: AGTCGGCATCGTTTATGGTC | 102 |
| Nono | NM_001012356 | F:
TATGGGAAAGCAGGCGAAGT
R: TCCAGCTCCACTTTGGCAAT | 101 |
| Glod4 | NM_001014227 | F:
TTTCAAAGTGGGGAACCGCT
R: ATTACATGCGGCTTTGCAGC | 109 |
| Aamp | NM_001106920 | F:
GCCGGACCCGGATGATCT
R: CCTTCTTGGGGTTCCAGGAC | 108 |
| Dazap2 | NM_001013107 | F:
GAGCCACCATGAACAGCAAA
R: GCAGCCCCTCTGAGTATGC | 147 |
| HPRT1 | NM_012583 | F:
ACCAGTCAACGGGGGACATA
R: TTGGGGCTGTACTGCTTGAC | 145 |
| Hsp90ab1 | NM_001004082 | F:
CACCCTGCTCTGTACTACTACTC
R: GGGCAATTTCTGCCTGAAAGG | 105 |
Data analysis
Microarray data sorting and statistical analysis
were performed with Microsoft Excel. NormFinder (11) and GeNorm (12) were used to analyze the stability of
selected RG candidates in normal and OSCC samples based on our
microarray and RT-PCR datasets. NormFinder is a model-based
variance estimation approach. It not only takes into consideration
the overall intergroup variation (i.e., tumor compared to normal),
but also the intragroup variation. NormFinder can analyze
expression data obtained through any quantitative method, e.g.,
real-time RT-PCR and microarray based expression analysis. It ranks
the set of candidate normalization genes according to their
expression stability in a given sample set and given experimental
design.
GeNorm is an algorithm that selects an optimal pair
of RGs out of a larger set of candidate genes. It calculates and
compares the M-value of all candidate genes, eliminates the gene
with the highest M-value, and repeats the process until there are
only two genes left. An M-value describes the variation of a gene
compared to all other candidate genes. The last pair of candidates
remaining is recommended as the optimum pair of reference genes. It
is assumed that the candidate genes are not co-regulated (12).
RefFinder (18) was
also used to rank RG candidates based on RT-PCR dataset. RefFinder
is a web-based interface developed for evaluating and screening RGs
from extensive experimental datasets. It integrates the currently
available four major computational programs including GeNorm,
Normfinder, BestKeeper, and the ΔCt method to compare and rank the
tested RG genes. Based on the rankings from each program, it
assigns an appropriate weight to an individual gene and calculates
the geometric mean of their weights for the overall final
ranking.
Results
Induction of OSCC in F344 rats by
4-NQO
Two independent oral cancer induction experiments
(28–30 rats per experiment) were performed in F344 rats to generate
tissue samples for molecular studies. In these studies, drinking
water administration of 4-NQO to F344 rats induced a range of
premalignant and invasive malignant lesions in the tongue. The
induction of invasive OSCC by 4-NQO was highly reproducible: 83%
(25 out of 30) and 75% (21 out of 28) of rats in the two
experiments demonstrated invasive oral cancers at six months after
the start of carcinogen administration. After histopathologic
evaluation, 11 pairs of tissue samples from the first experiment
and 16 pairs of tissue samples from the second experiment were
selected for microarray and RT-PCR analyses, respectively.
Microarray analyses to screen for
potential RG candidates in OSCC compared to normal tissue
Microarray analyses were performed on 11 matched
tissue pairs from experiment 1 to compare patterns of gene
expression at the mRNA level in OSCC and adjacent phenotypically
normal oral tissues. Several approaches were used to select RG
candidates from microarray dataset for RT-PCR validation.
Selection of RG candidates based on
descriptive statistics
In the normalized microarray data, gene expression
levels were expressed in intensity with a range of 0.01–500.
Considering that RGs should be easily detectable by RT-PCR, genes
expressing at low levels with intensity <5 (intensity cut-off
value) were not preferred and therefore removed, which eliminated
90% of the genes in the array list for RG candidates. In addition,
genes that were not identified (no name provided or with names such
as LOCxxxx or RGDxxxx) were also removed from the array list for RG
selection. Then, p-values and fold change between OSCC and normal
tissue and CV for the fold change were calculated based on pairwise
comparison. Genes with p<0.5 and CV (fold change) >15% were
further removed. After these steps, 10 RG candidates were selected
and listed in Table II in the
order of p-value from largest to smallest. The fold change of these
10 RG candidates between OSCC and normal tissues is close to 1,
suggesting that these genes were stable in both OSCC and normal
tissues (p>0.5, n=11).
| Table IIExpression of top 10 potential RGs
(selected based on descriptive statistical analysis of microarray
data) in OSCC vs. adjacent normal tissues in F344 rats treated by
4-NQO. |
Table II
Expression of top 10 potential RGs
(selected based on descriptive statistical analysis of microarray
data) in OSCC vs. adjacent normal tissues in F344 rats treated by
4-NQO.
| Gene symbol | Primary
accession | Gene name | Expression (normal)
(mean ± SD) | Expression (OSCC)
(mean ± SD) | Fold change
(OSCC/normal) (mean ± SD) | P-value (n=11) |
|---|
| Clptm1 | NM_001106232 | Cleft lip and
palate-associated transmembrane protein 1 | 6.32±0.53 | 6.32±0.52 | 1.00±0.11 | 0.98 |
| Rbm39 | NM_001013207 | RNA-binding motif
protein 39 | 7.10±0.70 | 7.06±0.68 | 1.00±0.13 | 0.86 |
| Dazap2 | NM_001013107 | DAZ-associated
protein 2 | 11.14±0.89 | 11.26±0.96 | 1.02±0.13 | 0.79 |
| Glod4 | NM_001014227 | Glyoxalase
domain-containing 4 | 5.09±0.54 | 5.16±0.86 | 1.02±0.15 | 0.78 |
| Rpl19 | NM_031103 | Ribosomal protein
L19 | 96.85±7.24 | 98.22±14.37 | 1.02±0.14 | 0.75 |
| Nono | NM_001012356 | Non-POU
domain-containing, octamer-binding | 10.83±0.84 | 10.64±1.32 | 0.99±0.15 | 0.71 |
| Sumo2 | NM_133594 | SMT3 suppressor of
mif two 3 homolog 2 | 16.30±1.24 | 16.01±1.72 | 0.99±0.14 | 0.69 |
| Cct6a | NM_001033684 |
Chaperonin-containing Tcp1, subunit 6A
(zeta 1) | 5.86±0.46 | 5.98±0.88 | 1.02±0.14 | 0.66 |
| Aamp | NM_001106920 | Angio-associated,
migratory cell protein | 6.59±0.44 | 6.47±0.81 | 0.98±0.14 | 0.66 |
| Hnrnpk | NM_057141 | Heterogeneous
nuclear ribonucleoprotein K | 6.15±0.59 | 6.00±0.87 | 0.98±0.15 | 0.61 |
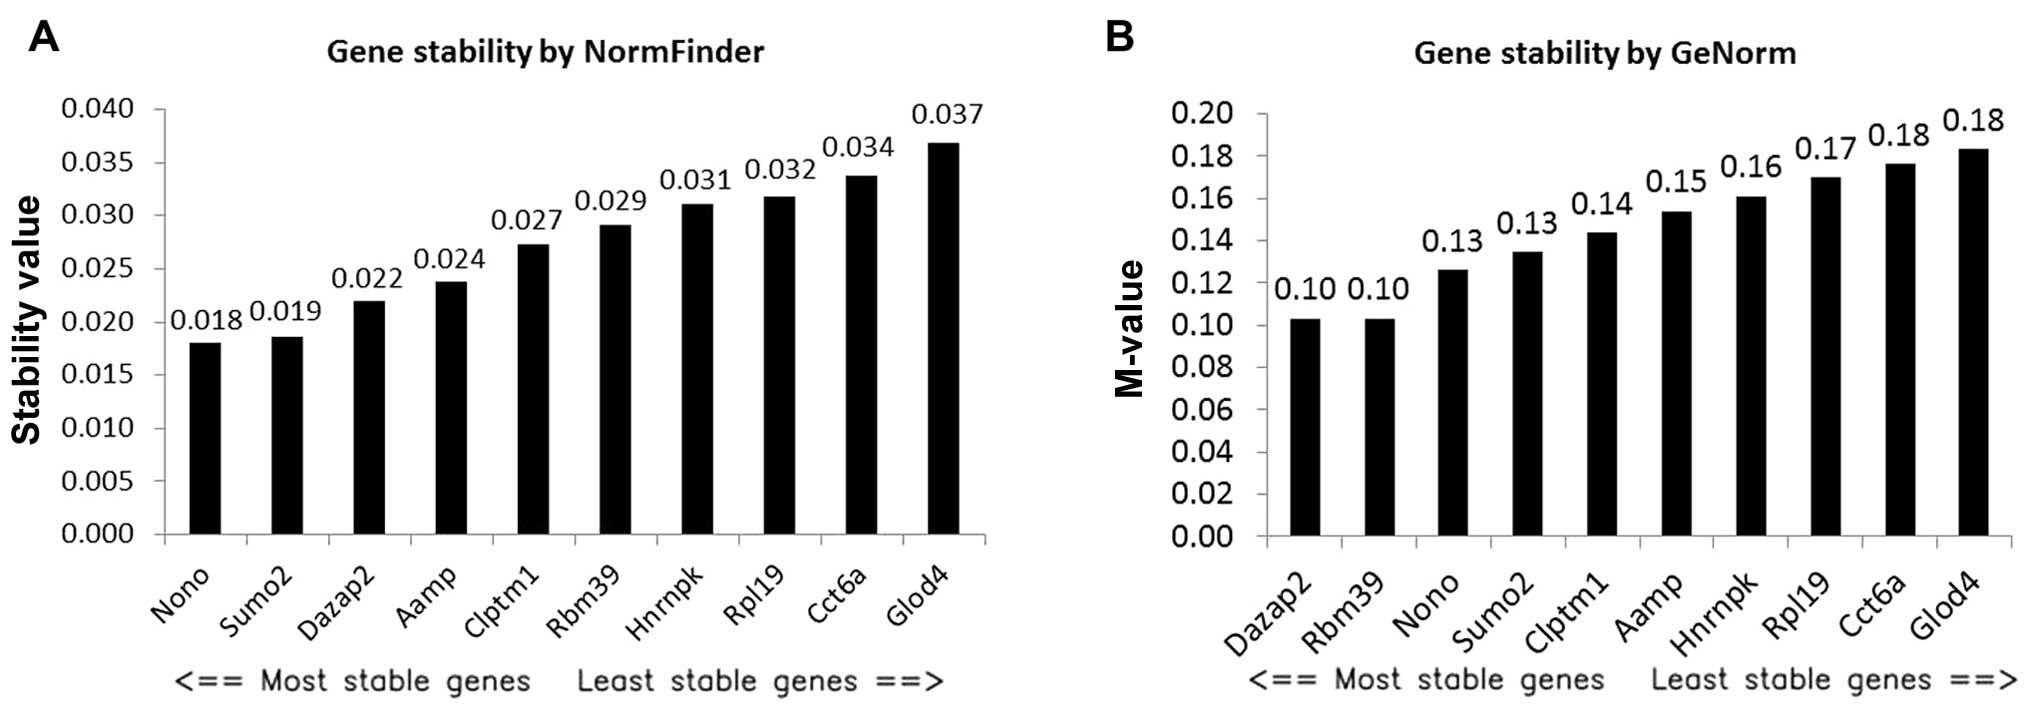
Ranking the selected RGs by NormFinder
and GeNorm
Although the best 10 RG candidates were selected
from our microarray dataset based on gene expression levels and
statistical analysis, it was necessary to rank them based on gene
stability to determine the best RG(s). To do so, these RG
candidates were further analyzed using NormFinder and GeNorm
(Fig. 1) based on microarray data.
NormFinder identified Nono as the best RG with a stability value of
0.018 (Fig. 1A), and Nono and Sumo2
as the best combination of two genes with a stability value of
0.013. Dazap2 and Aamp were ranked as the third and fourth most
stable RG candidates by NormFinder. GeNorm ranked Dazap2 and Rbm39
as the best pair of RGs with a stability value of 0.1 (Fig. 1B). Nono and Sumo2 were ranked as the
third and fourth most stable RG candidates by GeNorm. Apparently,
the top RG(s) selected by these programs have not been reported
previously.
Expression of commonly used RGs in oral
cancer compared to normal tissues
Commonly used RGs such as GAPDH, ACTB are not in the
list of the 10 best RG candidates (Table II). Since microarray-based RG
selection could be biased, in order to expand the pool of top RG
candidates, literature was searched for commonly used RGs in rat
and mouse tissue samples and 27 RG candidates were identified
(8,19–21)
(Table III). Identification of
suitable RG(s) for a specific project from commonly used RGs is
also a frequently used strategy for RG selection. The expression
status of these 27 RG candidates in OSCC compared to normal tissues
was analyzed based on microarray dataset. Fifteen out of 27 RG
candidates were significantly altered in OSCC compared to normal
tissues (p<0.05, n=11) (Table
III), suggesting that these 15 genes cannot serve as RGs for
OSCC compared to normal tissues, although some of them may serve as
RGs for OSCC or normal tongue tissues respectively. Notably, GAPDH
was significantly downregulated in OSCC compared to normal tissues;
ACTB was significantly upregulated in OSCC. The other 12 RGs were
potential RG candidates for OSCC compared to normal tissues.
However, Tbp and Tnks were expressed at very low levels and
therefore were not suitable RGs for OSCC. Thus, 10 RG candidates
were selected for further analysis with NormFinder and GeNorm.
| Table IIIExpression of commonly used RGs in
OSCC vs. adjacent normal tissues in F344 rats treated by 4-NQO. |
Table III
Expression of commonly used RGs in
OSCC vs. adjacent normal tissues in F344 rats treated by 4-NQO.
| Gene symbol | Primary
accession | Gene name | Expression (normal)
(mean ± SD) | Expression (OSCC)
(mean ± SD) | Fold change
(OSCC/normal) (mean ± SD) | P-value (n=11) |
|---|
| Tbp | NM_001004198 | TATA box binding
protein | 0.51±0.05 | 0.51±0.07 | 1.02±0.18 | 0.814 |
| Hsp90ab1 | NM_001004082 | Heat shock protein
90 kDa α | 18.43±1.73 | 18.75±2.47 | 1.03±0.20 | 0.773 |
| Tnks | NM_001106084 | Tankyrase | 0.01±0.004 | 0.01±0.003 | 0.96±0.38 | 0.364 |
| Ywhag | NM_019376 | Monooxygenase
activation protein | 9.64±1.16 | 10.80±3.05 | 1.16±0.47 | 0.357 |
| Eef1a1 | NM_175838 | Eukaryotic
translation elongation factor 1 | 54.86±4.94 | 57.67±8.26 | 1.06±0.17 | 0.338 |
| G6pd | NM_017006 | Glucose-6-phosphate
dehydrogenase | 13.43±2.63 | 16.03±7.96 | 1.23±0.62 | 0.335 |
| Gadd45a | NM_024127 | Growth arrest and
DNA-damage-inducible | 5.48±0.91 | 4.91±1.75 | 0.91±0.35 | 0.321 |
| Tfrc | NM_022712 | Transferrin
receptor | 2.19±0.34 | 2.49±0.81 | 1.14±0.36 | 0.211 |
| Rplp0 | NM_022402 | Ribosomal protein,
large, P0 | 161.07±13.03 | 149.07±23.41 | 0.93±0.15 | 0.147 |
| Pgk1 | NM_053291 | Phosphoglycerate
kinase 1 | 43.95±6.56 | 35.19±17.01 | 0.81±0.38 | 0.131 |
| Hprt1 | NM_012583 | Hypoxanthine
phosphoribosyltransferase 1 | 11.42±1.13 | 10.75±0.89 | 0.95±0.10 | 0.113 |
| Ubc | NM_017314 | Ubiquitin C | 31.27±3.36 | 36.21±7.88 | 1.17±0.26 | 0.642 |
| Ppia | NM_017101 | Peptidylprolyl
isomerase A (cyclophilin A) | 31.76±5.66 | 42.05±11.46 | 1.39±0.48 | 0.049 |
| Rpl8 | NM_001034916 | Ribosomal protein
L8 | 76.4±9.69 | 63.38±7.66 | 0.84±0.15 | 0.008 |
| Rplp2 | NM_001030021 | Ribosomal protein,
large P2 | 167.56±19.63 | 139.28±15.46 | 0.84±0.13 | 0.007 |
| Gusb | NM_017015 | Glucuronidase,
β | 0.93±0.16 | 1.54±0.48 | 1.72±0.64 | 0.005 |
| Mapk6 | NM_031622 | Mitogen-activated
protein kinase 6 | 1.62±0.19 | 2.50±0.77 | 1.56±0.52 | 0.005 |
| Hmbs | NM_013168 | Hydroxymethylbilane
synthase | 2.49±0.13 | 2.14±0.27 | 0.86±0.12 | 0.004 |
| Rpl13a | NM_173340 | Ribosomal protein
L13A | 117.09±12.13 | 100.28±9.93 | 0.86±0.12 | 0.004 |
| Gapdh | NM_017008 |
Glyceraldehyde-3-phosphate
dehydrogenase | 144.47±22.50 | 80.79±48.15 | 0.57±0.36 | 0.003 |
| Sdha | NM_130428 | Succinate
dehydrogenase complex, subunit A | 21.95±4.34 | 11.00±7.99 | 0.51±0.37 | 0.003 |
| B2m | NM_012512 | β-2
microglobulin | 14.09±3.15 | 21.89±5.07 | 1.63±0.52 | 0.002 |
| Rpl32 | NM_013226 | Ribosomal protein
L32 | 46.51±6.05 | 36.60±4.43 | 0.80±0.14 | 0.002 |
| Actb | NM_031144 | Actin, β | 71.22±8.49 | 130.72±47.18 | 1.85±0.70 | 0.002 |
| Sfrs4 | NM_001108685 | Splicing factor,
arginine/serine-rich 4 | 3.52±0.25 | 3.23±0.33 | 0.92±0.06 | 0.002 |
| Ywhaz | NM_013011 | Monooxygenase
activation protein, zeta | 11.34±1.50 | 19.57±5.96 | 1.74±0.55 | 0.001 |
| Rpl13 | NM_031101 | Ribosomal protein
L13 | 70.05±8.94 | 52.19±5.50 | 0.75±0.10 | 0.0001 |
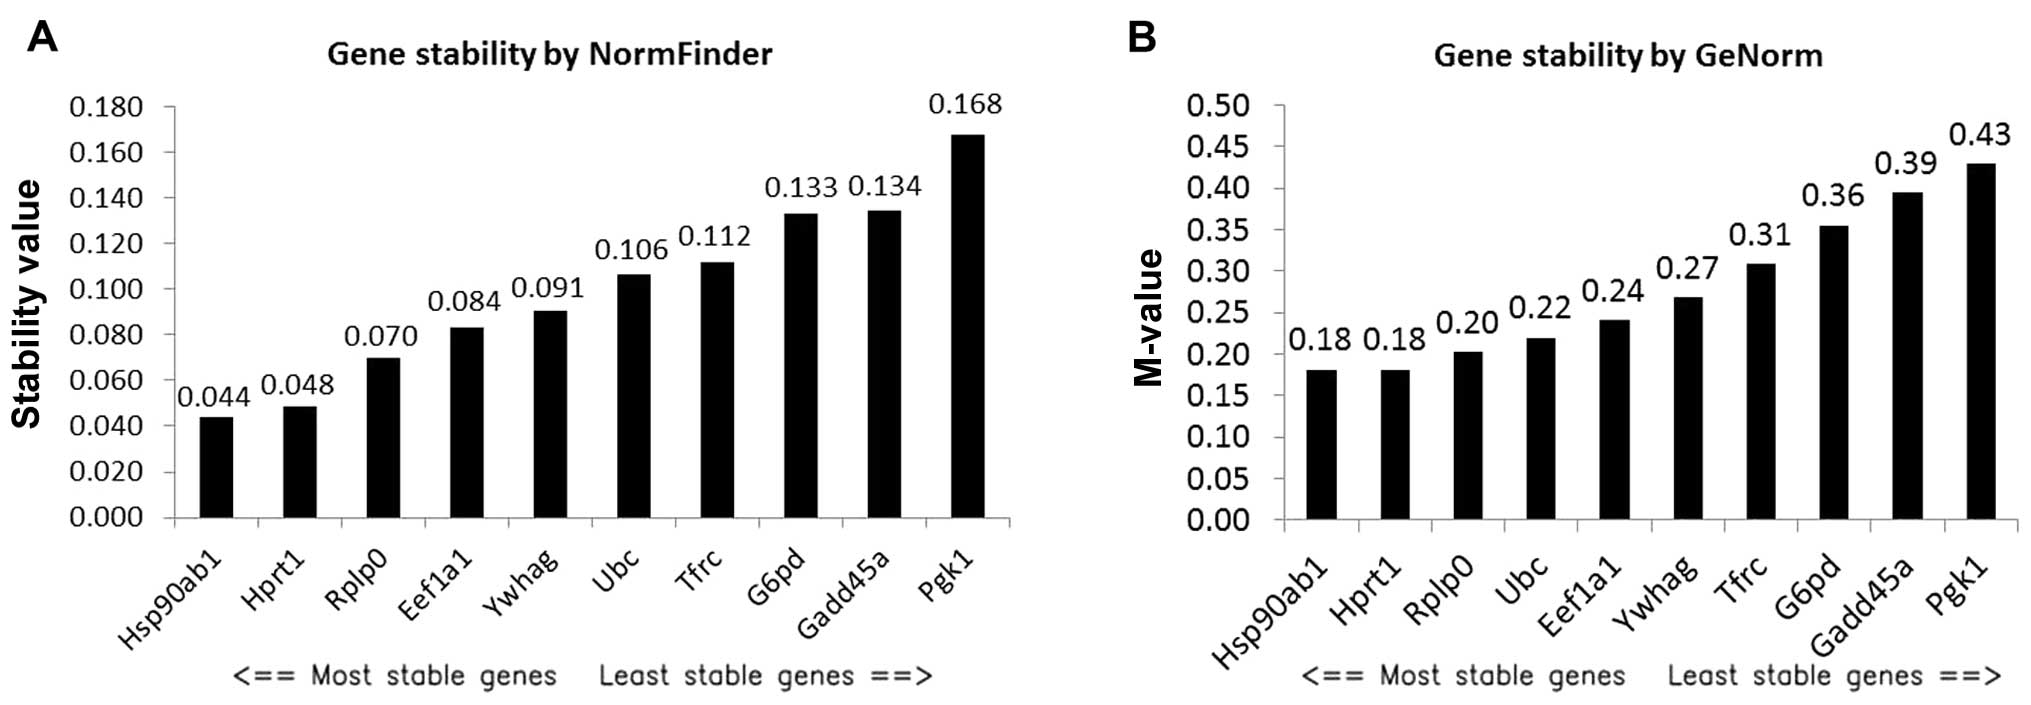
Ranking the commonly used RGs by
NormFinder and GeNorm
The selected commonly used 10 RG candidates were
ranked by NormFinder and GeNorm (Fig.
2). NormFinder identified Hsp90ab1 as the best RG with a
stability value of 0.044 (Fig. 2A),
which is higher than the stability value of Nono. However,
NormFinder identified Hsp90ab1 and HPRT1 as the best combination of
two genes with a stability value of 0.024, which was much lower
than the stability value of Hsp90ab1. Consistently, GeNorm also
identified Hsp90ab1 and HPRT1 as the best pair of RGs with a
stability value (M-value) of 0.18 (Fig.
2B), which is higher than that of the best pair of RGs (Dazap2
and Rbm39) directly selected by GeNorm from the microarray dataset
(Fig. 1B).
Determination of top RG candidates and
expression of oral cancer biomarker NOS2 and PTGS2 in OSCC compared
to normal tissues using top RG candidates for normalization based
on microarray data
We selected the top four RG candidates ranked by
NormFinder (Nono, Sumo2, Dazap2 and Aamp) and GeNorm (Dazap2,
Rbm39, Nono and Sumo2), respectively based on the above microarray
dataset analysis (Fig. 1) and top
two genes (Hsp90ab1 and HPRT1) selected from commonly used RGs
(Fig. 2) for RT-PCR validation. In
addition, Glod4 was also selected for RT-PCR validation, since
Glod4 was ranked as the least stable gene among the 10 RG
candidates by both NormFinder and GeNorm (Fig. 1) and therefore could serve as a
reference for comparison. However, while designing primers, we
found it difficult to generate very specific primers for Sumo2 and
Rbm39 due to the presence of multiple transcript variants/isoforms
and these two genes were therefore eliminated for further
validation.
We first selected two OSCC biomarkers NOS2 and PGTS2
that were reported to be upregulated in OSCC (15,21–23) to
validate the top RG candidates ranked by NormFinder and GeNorm
based on microarray dataset. As shown in Table IV, after normalization to these
selected RG candidates or combination of two RG candidates, both
NOS2 and PTGS2 demonstrated consistent and statistically
significant upregulation in OSCC compared to normal tissues, which
was also comparable to the microarray results. Consistent with
previous analyses (Fig. 1),
although Glod4 appeared to be an acceptable RG candidate, it was
less stable considering the greater CV and p-values in comparison
to other RG candidates (Table IV).
These results suggest that these top RG candidates or combination
of two RG candidates may be suitable RGs for gene normalization in
4-NQO-induced OSCC in F344 rats. It is still difficult to tell
which RG candidate or combination of RG candidates is the best
among the selected top RG candidates at this time-point.
| Table IVExpression of OSCC biomarkers (NOS2
and PTGS2) after normalization to top RGs or combination of RGs
using microarray data set. |
Table IV
Expression of OSCC biomarkers (NOS2
and PTGS2) after normalization to top RGs or combination of RGs
using microarray data set.
| Genes | Reference
gene(s) | Fold change
(OSCC/normal) (mean ± SD) | CV | P-value (n=11) |
|---|
| NOS2 | Microarray | 9.05±11.23 | 1.24 | 0.008 |
| Nono | 8.60±10.86 | 1.26 | 0.006 |
| Dazap2 | 8.69±11.09 | 1.28 | 0.008 |
| Aamp | 8.86±10.99 | 1.24 | 0.007 |
| Glod4 | 8.83±11.75 | 1.33 | 0.009 |
| Hsp90ab1 and
HPRT1 | 9.43±11.43 | 1.21 | 0.005 |
| PTGS2 | Microarray | 35.84±40.49 | 1.13 | 0.012 |
| Nono | 34.02±39.25 | 1.15 | 0.012 |
| Dazap2 | 34.29±39.64 | 1.16 | 0.012 |
| Aamp | 35.71±40.52 | 1.13 | 0.013 |
| Glod4 | 35.95±43.28 | 1.20 | 0.015 |
| Hsp90ab1 and
HPRT1 | 37.06±42.57 | 1.15 | 0.012 |
Validation of RGs by RT-PCR and
determination of the best RG(s)
Ideal RGs should be stably expressed in different
sets of samples and validated with a different method. Since these
RG candidates were selected based on microarray data and would be
used for RT-PCR data normalization, these RG candidates need to be
validated by RT-PCR. We therefore used a second discrete set of
samples (16 pairs) to validate these top RG candidates. Every
effort was made to assure the quality of the RNA samples and
RT-PCR. Since 18S rRNA is also traditionally used as an RG in
tissue samples, it was included for comparison. Table V shows the analysis of the selected
seven RG candidates at the Cq level. Notably, the expression of
Dazap2, Aamp and 18S was significantly altered in OSCC compared to
normal tissues (p<0.05, n=16) by qRT-PCR and these three genes
were excluded for further analysis. Thus, the four remaining RG
candidates (Nono, Hsp90ab1, Glod4 and HPRT1) were ranked by
NormFinder and GeNorm (Table VI).
Hsp90ab1 was the best RG and the best combination of two genes for
normalization was Hsp90ab1 and HPRT1 based on NormFinder analysis
of the qRT-PCR dataset. GeNorm also consistently identified
Hsp90ab1 and HPRT1 as the best pair of RGs. To help further
determine the best RG among the four candidates, we used a third
program RefFinder to rank these RGs and Hsp90ab1 was still ranked
as the best RG (Table VI).
Overall, Hsp90ab1 can be considered to be the best RG stably
expressed in OSCC and normal tongue tissues in F344 rats treated by
4-NQO. The combination of two genes Hsp90ab1 and HPRT1 can be a
better option for normalization with higher stability than that of
the single RG-Hsp90ab1 based on NormFinder analysis.
| Table VExpression of RGs and OSCC biomarkers
in rat OSCC vs. adjacent normal tissues as evaluated by RT-PCR. |
Table V
Expression of RGs and OSCC biomarkers
in rat OSCC vs. adjacent normal tissues as evaluated by RT-PCR.
| Gene category | Genes | Expression (normal)
(mean ± SD) | Expression (OSCC)
(mean ± SD) | Ratio (OSCC/normal)
(paired) | CV | P-value (n=16) |
|---|
| RGs | nono | 24.38±0.85 | 24.2±0.54 | 0.99±0.04 | 0.04 | 0.4446 |
| Hsp90ab1 | 22.66±0.63 | 22.55±0.54 | 1.00±0.02 | 0.02 | 0.4047 |
| Glod4 | 27.46±0.69 | 27.28±0.55 | 0.99±0.03 | 0.03 | 0.3272 |
| HPTR1 | 26.45±0.65 | 26.06±0.67 | 0.99±0.03 | 0.03 | 0.0514 |
| Dazap2 | 32.55±0.77 | 32.05±0.68 | 0.99±0.03 | 0.03 | 0.0337 |
| Aamp | 27.06±0.82 | 26.39±0.60 | 0.98±0.03 | 0.04 | 0.0145 |
| 18S | 10.38±0.99 | 8.72±0.75 | 0.85±0.12 | 0.14 | 0.0001 |
| Table VIRanking of RGs using NormFinder,
GeNorm and RefFinder based on qRT-PCR dataset. |
Table VI
Ranking of RGs using NormFinder,
GeNorm and RefFinder based on qRT-PCR dataset.
| Ranking | NormFinder | GeNorm | RefFinder |
|---|
| 1 | Hsp90ab1 | Hsp90ab1/HPRT1 | Hsp90ab1 |
| 2 | HPRT1 | | HPRT1 |
| 3 | Glod4 | Glod4 | Glod4 |
| 4 | Nono | Nono | Nono |
Discussion
With the extensive use of qRT-PCR technique in gene
expression analysis, RG identification and selection have become
more and more important, since proper normalization of accurate
gene expression is crucial for data interpretation and for
conclusion to be drawn. In the field of cancer, screening for
potential biomarkers by qRT-PCR, is important in determining the
RG(s) in normal tissues and cancer at a specific site. In the
present study, we identified Hsp90ab1 as a stable RG for
normalization of RT-PCR data in 4-NQO-induced OSCC compared to
adjacent normal tissues in F344 rats. Similar studies in other
cancer types have been previously described (11,17,24,25),
however this is the first report of the identification of suitable
RG(s) in the 4-NQO-induced oral carcinogenesis model in F344
rats.
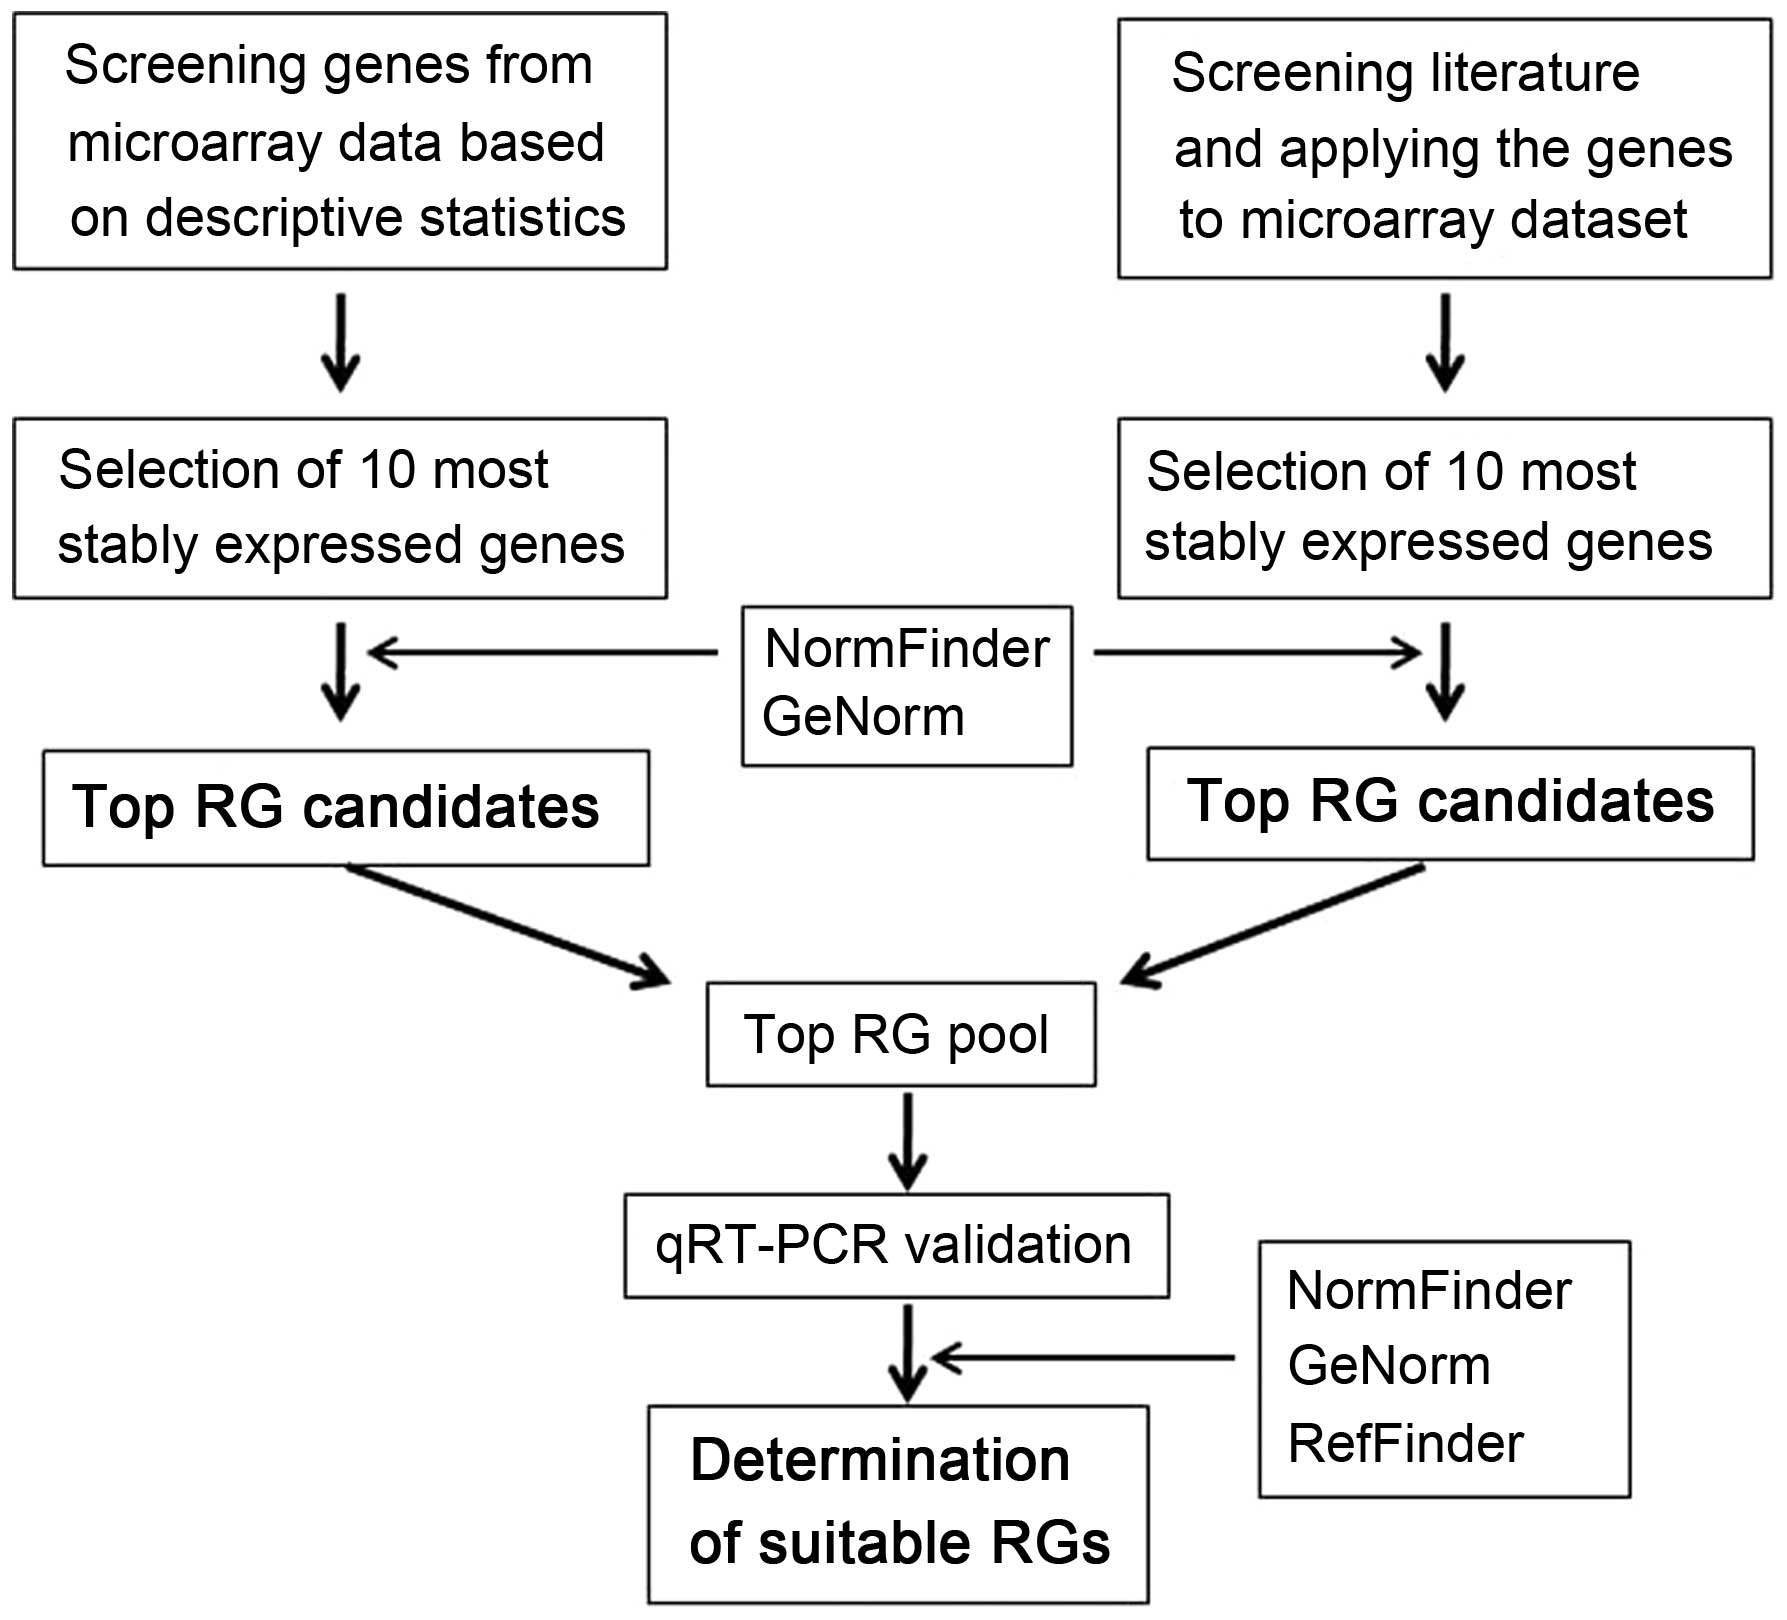
Our strategy for the identification of RG(s) in
paired OSCC and normal tissue samples is summarized in Fig. 3. This strategy both assures the
selection of reliable RG(s) using a combination of two techniques,
two sets of RG candidates, two sets of samples and two analytical
approaches to avoid some systematic bias, and also minimizes the
cost of the study, which is important for research projects, since
identification of RG(s) is generally not the major aim in almost
any research/clinical projects.
We initially expected that the best RG would be from
the RG candidates directly selected from the microarray dataset.
However, the best RG after RT-PCR validation turned out to be
Hsp90ab1, an RG candidate identified from the literature. This fact
suggests that any single approach has limitations, and these
limitations should be overcome by using alternate strategies. In
addition, although microarray is important for RG screening and
selection, RT-PCR validation is indispensable. In fact, some
researchers only use the qRT-PCR technique for screening and
identification of RGs (12,21); however, if micro-array data are
available, this will help to significantly decrease the amount of
RT-PCR performed.
It should be pointed out that the criteria
established for initial screening is critical for making the RG
candidate pool, and further affect the next steps in RG selection.
The criteria rely on experimental conditions. In the present study,
our aim was to identify RG(s) for OSCC compared to adjacent
phenotypically normal tissues; therefore allowing for no
statistical difference in RG expression levels between OSCC and the
adjacent normal tissues. In this case, p-value became an important
parameter for RG selection (p>0.5 was used), which is also used
for RG selection in the literature (26). It is possible that some good RG
candidates were not identified using the initial screening
procedure based on these criteria; however, the RGs selected based
on these criteria are acceptable for gene normalization.
No one statistical approach can cover all variables
associated with gene expression studies. Thus using more than one
statistical approach for RG identification is also an important
strategy. The advantage and limitations of different statistical
approaches were well discussed in the literature (8). In our studies, NormFinder was
preferentially used due to its advantage in considering the
variance between subgroups (OSCC compared to normal), GeNorm and
RefFinder were also used for comprehensive ranking of the RGs.
Hsp90ab1 was selected as the top RG by all these programs in the
RT-PCR dataset. Hsp90ab1 has also been previously demonstrated to
be stably expressed in human normal and malignant ovarian tissues
(27). However, it was regulated by
estrogen treatment in mouse uterus (28). Apparently, this RG can be tissue and
experiment condition-specific.
Combination of two RGs was more stable than single
RGs as identified by NormFinder. We also observed improvement of CV
and p-values when the expression of oral cancer biomarker NOS2 was
evaluated in OSCC compared to adjacent normal tissues after
normalization to the combination of Hsp90ab1 and HPTR1 based on
microarray data, suggesting that the combination of two RGs is a
choice for gene normalization in tissue samples. However, this
improvement was not observed in PTGS2 expression and we believe
this was largely due to the intrinsic variation of PTGS2 expression
in tissue samples instead of normalization.
More than 50% of the commonly used or traditional
RGs were significantly altered in OSCC compared to adjacent normal
tissues, demonstrating that RGs must be established for each model
and experimental conditions. The biological significance of these
alterations is not clear and the structural difference of cell
composition in OSCC compared to adjacent normal tissues may account
for these alterations. Whether a panel of these housekeeping genes
can serve as biomarkers for diagnosis or treatment is of great
interest and merits further investigation. In addition, 18S rRNA
has been widely used as a stable RG for normalization; however, the
RT-PCR data indicate that 18S rRNA expression level was
significantly higher in OSCC compared to the adjacent normal
tissues; if 18S rRNA is used as an RG for gene expression studies,
bias or false results may be generated in this model.
In summary, a simple and relatively economic
strategy has been developed for the identification of reliable RGs
in cancer compared to normal tissues. The present study identified
Hsp90ab1 as the most stable single RG, and Hsp90ab1 plus HPRT1 as
the best combination of two genes for normalization in gene
expression studies in 4-NQO-induced rat oral carcinogenesis
model.
Acknowledgments
This study was supported by Internal Research and
Development funds from the IIT Research Institute.
References
|
1
|
Kanojia D, Sawant SS, Borges AM, Ingle AD
and Vaidya MM: Alterations in keratins and associated proteins
during 4-nitro-quinoline-1-oxide induced rat oral carcinogenesis. J
Carcinog. 11:142012. View Article : Google Scholar
|
|
2
|
Yang Z, Guan B, Men T, Fujimoto J and Xu
X: Comparable molecular alterations in 4-nitroquinoline
1-oxide-induced oral and esophageal cancer in mice and in human
esophageal cancer, associated with poor prognosis of patients. In
Vivo. 27:473–484. 2013.PubMed/NCBI
|
|
3
|
Moon SM, Ahn MY, Kwon SM, Kim SA, Ahn SG
and Yoon JH: Homeobox C5 expression is associated with the
progression of 4-nitroquinoline 1-oxide-induced rat tongue
carcinogenesis. J Oral Pathol Med. 41:470–476. 2012. View Article : Google Scholar : PubMed/NCBI
|
|
4
|
Miranda SR, Noguti J, Carvalho JG, Oshima
CT and Ribeiro DA: Oxidative DNA damage is a preliminary step
during rat tongue carcinogenesis induced by 4-nitroquinoline
1-oxide. J Mol Histol. 42:181–186. 2011. View Article : Google Scholar : PubMed/NCBI
|
|
5
|
Kitano M, Hatano H and Shisa H: Strain
difference of susceptibility to 4-nitroquinoline 1-oxide-induced
tongue carcinoma in rats. Jpn J Cancer Res. 83:843–850. 1992.
View Article : Google Scholar : PubMed/NCBI
|
|
6
|
McCormick DL, Phillips JM, Horn TL,
Johnson WD, Steele VE and Lubet RA: Overexpression of
cyclooxygenase-2 in rat oral cancers and prevention of oral
carcinogenesis in rats by selective and nonselective COX
inhibitors. Cancer Prev Res (Phila). 3:73–81. 2010. View Article : Google Scholar
|
|
7
|
Nolan T, Hands RE and Bustin SA:
Quantification of mRNA using real-time RT-PCR. Nat Protoc.
1:1559–1582. 2006. View Article : Google Scholar
|
|
8
|
Taki FA, Abdel-Rahman AA and Zhang B: A
comprehensive approach to identify reliable reference gene
candidates to investigate the link between alcoholism and
endocrinology in Sprague-Dawley rats. PLoS One. 9:e943112014.
View Article : Google Scholar : PubMed/NCBI
|
|
9
|
Gutierrez L, Mauriat M, Guénin S, Pelloux
J, Lefebvre JF, Louvet R, Rusterucci C, Moritz T, Guerineau F,
Bellini C, et al: The lack of a systematic validation of reference
genes: A serious pitfall undervalued in reverse
transcription-polymerase chain reaction (RT-PCR) analysis in
plants. Plant Biotechnol J. 6:609–618. 2008. View Article : Google Scholar : PubMed/NCBI
|
|
10
|
Thellin O, Zorzi W, Lakaye B, De Borman B,
Coumans B, Hennen G, Grisar T, Igout A and Heinen E: Housekeeping
genes as internal standards: Use and limits. J Biotechnol.
75:291–295. 1999. View Article : Google Scholar
|
|
11
|
Andersen CL, Jensen JL and Ørntoft TF:
Normalization of real-time quantitative reverse transcription-PCR
data: A model-based variance estimation approach to identify genes
suited for normalization, applied to bladder and colon cancer data
sets. Cancer Res. 64:5245–5250. 2004. View Article : Google Scholar : PubMed/NCBI
|
|
12
|
Vandesompele J, De Preter K, Pattyn F,
Poppe B, Van Roy N, De Paepe A and Speleman F: Accurate
normalization of real-time quantitative RT-PCR data by geometric
averaging of multiple internal control genes. Genome Biol.
3:research0034.1. 2002. View Article : Google Scholar : PubMed/NCBI
|
|
13
|
Pfaffl MW, Tichopad A, Prgomet C and
Neuvians TP: Determination of stable housekeeping genes,
differentially regulated target genes and sample integrity:
BestKeeper - Excel-based tool using pair-wise correlations.
Biotechnol Lett. 26:509–515. 2004. View Article : Google Scholar : PubMed/NCBI
|
|
14
|
Czechowski T, Stitt M, Altmann T, Udvardi
MK and Scheible WR: Genome-wide identification and testing of
superior reference genes for transcript normalization in
Arabidopsis. Plant Physiol. 139:5–17. 2005. View Article : Google Scholar : PubMed/NCBI
|
|
15
|
Peng X, Li W, Johnson WD, Torres KE and
McCormick DL: Overexpression of lipocalins and pro-inflammatory
chemokines and altered methylation of PTGS2 and APC2 in oral
squamous cell carcinomas induced in rats by
4-nitroquinoline-1-oxide. PLoS One. 10:e01162852015. View Article : Google Scholar : PubMed/NCBI
|
|
16
|
Peng X, Li W, Yuan L, Mehta RG, Kopelovich
L and McCormick DL: Inhibition of proliferation and induction of
autophagy by atorvastatin in PC3 prostate cancer cells correlate
with downregulation of Bcl2 and upregulation of miR-182 and p21.
PLoS One. 8:e704422013. View Article : Google Scholar : PubMed/NCBI
|
|
17
|
Saviozzi S, Cordero F, Lo Iacono M,
Novello S, Scagliotti GV and Calogero RA: Selection of suitable
reference genes for accurate normalization of gene expression
profile studies in non-small cell lung cancer. BMC Cancer.
6:2002006. View Article : Google Scholar : PubMed/NCBI
|
|
18
|
Xie F, Xiao P, Chen D, Xu L and Zhang B:
miRDeepFinder: A miRNA analysis tool for deep sequencing of plant
small RNAs. Plant Mol Biol. 80:75–84. 2012. View Article : Google Scholar
|
|
19
|
Sun JH, Nan LH, Gao CR and Wang YY:
Validation of reference genes for estimating wound age in contused
rat skeletal muscle by quantitative real-time PCR. Int J Legal Med.
126:113–120. 2012. View Article : Google Scholar
|
|
20
|
Li B, Matter EK, Hoppert HT, Grayson BE,
Seeley RJ and Sandoval DA: Identification of optimal reference
genes for RT-qPCR in the rat hypothalamus and intestine for the
study of obesity. Int J Obes. 38:192–197. 2014. View Article : Google Scholar
|
|
21
|
Sappayatosok K, Maneerat Y, Swasdison S,
Viriyavejakul P, Dhanuthai K, Zwang J and Chaisri U: Expression of
pro-inflammatory protein, iNOS, VEGF and COX-2 in oral squamous
cell carcinoma (OSCC), relationship with angiogenesis and their
clinico-pathological correlation. Med Oral Patol Oral Cir Bucal.
14:E319–E324. 2009.PubMed/NCBI
|
|
22
|
Morelatto R, Itoiz ME, Guiñazú N, Piccini
D, Gea S and López-de Blanc S: Nitric oxide synthase 2 (NOS2)
expression in histologically normal margins of oral squamous cell
carcinoma. Med Oral Patol Oral Cir Bucal. 19:e242–e247. 2014.
View Article : Google Scholar :
|
|
23
|
Brennan PA, Palacios-Callender M, Zaki GA,
Spedding AV and Langdon JD: Does type II nitric oxide synthase
expression correlate with cellular proliferation in oral squamous
cell carcinoma and dysplasia? Head Neck. 23:217–222. 2001.
View Article : Google Scholar : PubMed/NCBI
|
|
24
|
Dupasquier S, Delmarcelle AS, Marbaix E,
Cosyns JP, Courtoy PJ and Pierreux CE: Validation of housekeeping
gene and impact on normalized gene expression in clear cell renal
cell carcinoma: Critical reassessment of YBX3/ZONAB/CSDA
expression. BMC Mol Biol. 15:92014. View Article : Google Scholar : PubMed/NCBI
|
|
25
|
Guo Y, Chen JX, Yang S, Fu XP, Zhang Z,
Chen KH, Huang Y, Li Y, Xie Y and Mao YM: Selection of reliable
reference genes for gene expression study in nasopharyngeal
carcinoma. Acta Pharmacol Sin. 31:1487–1494. 2010. View Article : Google Scholar : PubMed/NCBI
|
|
26
|
Meyer FR, Grausgruber H, Binter C, Mair
GE, Guelly C, Vogl C and Steinborn R: Cross-platform microarray
meta-analysis for the mouse jejunum selects novel reference genes
with highly uniform levels of expression. PLoS One. 8:e631252013.
View Article : Google Scholar : PubMed/NCBI
|
|
27
|
Fu J, Bian L, Zhao L, Dong Z, Gao X, Luan
H, Sun Y and Song H: Identification of genes for normalization of
quantitative real-time PCR data in ovarian tissues. Acta Biochim
Biophys Sin (Shanghai). 42:568–574. 2010. View Article : Google Scholar
|
|
28
|
Schroder AL, Pelch KE and Nagel SC:
Estrogen modulates expression of putative housekeeping genes in the
mouse uterus. Endocrine. 35:211–219. 2009. View Article : Google Scholar : PubMed/NCBI
|