Introduction
Head and neck squamous cell carcinoma (HNSCC)
constitutes approximately 4% of all new cancer diagnoses in the
United States, with approximately 62,000 new cases in 2016
(1). Each year approximately
600,000 patients are affected worldwide (2). Importantly, the 5-year survival rate
of HNSCC patients is only 40–50% (3). The high mortality rate is attributable
to a high rate of late diagnosis, and the survival rate for cases
in late stages is only 34.9% (4).
These outcomes demonstrate the need for prognostic biomarkers to
help predict patient outcome and outline individualized treatment
plans. Age, clinical stage and smoking status are characteristics
emerging as important contributors to clinical outcome that may
also help us improve survival prediction (5–7).
However, the traditional clinical information has limited
prediction ability due to the complex molecular regulation
mechanism in cancer.
Recently, the clinical importance of messenger RNA
(mRNA) expression has been reported in various types of cancer
including HNSCC. They play important roles in a variety of
physiological and pathological processes, such as development,
differentiation, cell proliferation, apoptosis and stress responses
(8). Therefore, characterization of
key genes in different tumors is essential not only for an urgent
requirement of precision medicine (9) but also for preclinical and
pharmaceutical research (10).
Prognostic models in HNSCC have been described using
different biomarkers such as somatic mutations (11), microRNAs (12,13)
and proteins (4) but limited
studies focus on mRNA expression according to Cancer Genetics Web
(14). De Cecco et al
(15) reported a gene expression
survival predictor using HNSCC microarray data based on a
semi-supervised survival method involving principal component
method (16). However, the model
comprised 172 genes and was complicated for further interpretation.
Now that transcriptome sequencing technologies (RNA-Seq) are being
applied widely, there is a more ideal platform for cancer genetic
studies (17). In addition, The
Cancer Genome Atlas (TCGA) and Gene Expression Omnibus (GEO)
repositories provide abundant HNSCC case resources, which may be
useful to explore reliable biomarkers.
In this study, we investigated the prognostic value
of seven gene expression biomarkers (AATF, APP,
GNPDA1, HPRT1, LASP1, P4HA1 and
ILF3) for HNSCC overall survival. The cases mainly included
oropharyngeal, laryngeal and oral squamous cell carcinoma. TCGA
cohort was used as the training set to generate the prognostic
model by a two-stage variable selection. We also used an
independent external testing set to validate the robustness and
reproducibility of the model.
Materials and methods
Study population
Information for the HNSCC training set was obtained
from TCGA on November 13, 2016 (18). Gene expression data were extracted
from IlluminaHiSeq_RNASeqV2 platform and normalized by RSEM method
(19). In addition, we performed
quality control with a total of 20530 genes. Genes with more than
half of values as zero were removed, 17711 genes remained with
quantile normalization. Patients with complete follow-up
information and gene expression values for tumor tissues were
included in the study. Information for the HNSCC testing set was
collected from GSE65858 (20) in
GEO. Gene expression data were extracted from Illumina HumanHT-12
V4.0 expression beadchip and normalized using the robust spline
normalization (RSN) method (21).
Consecutive patients with primary and metachronous secondary HNSCC
of oral cavity, larynx, oro- and hypopharynx were included, while
tumor cell lines and those with low quality assays were excluded.
All gene expression values were log2-transformed and standardized
for comparability between the training and testing sets.
Weighted t-test (WTT) method as the
first step for gene selection
To select differentially expressed genes combined
with clinical information, WTT was used to select genes based on
the method of Hu et al (22). For the ith subject with a
covariate vector Zi, the Cox proportional hazards
model is given by λ(t|Zi) =
λ0(t)exp(βTZi) and
the survival function is S(t|Zi) =
exp{-λ0(t)exp(βTZi)},
where λ0(t) is the basic hazard function, β is
the regression coefficient and λ0(t) is the
cumulative baseline hazard function. Then we constructed a Cox
regression model for each subject based on clinical information
(age, sex, smoking status and clinical stage) only and defined
hi = βTZi. The weights for
n patients totally were calculated accordingly:
wi=hi∑i=1nhi×n
which were assigned for the tumor cases but not the
normal cases.
With the weighted tumor expression
expwi = wi x expi, Students
t-test was conducted for each gene to measure the difference
between tumor and matched normal expression level. We also used
t-test with no weight adjustment and examined the difference
between the t-test statistics after and before weight
adjustment, dk = tadjust -
tunadjust for the kth gene. Afterwards, 1,000
total permutations were performed and dki could
be got for the ith permutation. Then, we calculated the
averaged order statistics, d¯k,
across all 1,000 permutations. A gene was labeled as significant
when |dk-d¯k| was at the top
5%.
Sure independence screening (SIS) as
the second step for gene selection
After the WTT selection, there were still over 800
genes left, which were too many and not robust to build the
prognostic sigature in HNSCC. The traditional univariate or
multivariate Cox regression was not suitable to select the
prognosis-associated genes because it easily led to overfitting and
produced instable results (23).
SIS was used to choose those which were truly associated with
disease from the 5% genes remaining for further modeling (24). This is a two-step screening
approach: it first screened all genomic features and discarded the
irrelevant features whose correlation with overall survival were
weak, and secondly applied LASSO penalized regression to estimate
the sensitivity from the selected genomic instability data. We
could significantly reduce the number of genes in the final model
by the SIS method.
Statistical analysis
Continuous variables are described as mean ± SD, and
categorized variables are summarized by frequency (n) and
proportion (%). Chi-square test was used for rate or proportion
comparison. Associations between the characteristics and the
overall survival were evaluated by Cox proportional hazard models.
Survival curves were drawn with the Kaplan-Meier method and were
compared among subgroups using log-rank tests. To evaluate the
robustness of the results, we used the bootstrap method with
‘bootcov’ function that computed a bootstrap estimate of the
covariance matrix for a set of regression coefficients in
rms package. The bootstrap procedure were carried out with
500 re-samplings for the multivariable Cox regression. We predicted
5-year patient survival using the nearest neighbor method for
receiver operating characteristic (ROC) curves of censored survival
data (25) and estimation of
confidence intervals and P-values of area under the curve (AUC) was
based on bootstrap resampling. In the subgroup analysis, we used
the Fishers exact test to compare the proportions of different HPV
status or tumor sites.
Statistical analyses were performed using R version
3.3.1 (The R Foundation). P-values are two-sided and P<0.05
indicates statistical significance.
Results
Demographic and clinical
characteristics
The analysis included 512 HNSCC cases from TCGA
training set and 270 cases from the GEO testing set (Table I). Cases in the training set had an
average age of 60.8±11.9 years, ranging from 19 to 90 years; 149
(29.1%) individuals were followed until death. Cases in the testing
set had an average age of 60.1±10.3 years, ranging from 35 to 87
years; 88 (32.6%) individuals were followed until death.
 | Table I.Demographic and clinical
characteristics of HNSCC patients. |
Table I.
Demographic and clinical
characteristics of HNSCC patients.
|
Characteristics | Training set
(n=512) | Testing set
(n=270) |
|---|
| Median follow-up
time (years) | 4.35 | 4.95 |
| Censor rate
(%) | 70.8 | 67.4 |
| Age, mean ± SD
(years) | 60.8±11.9 | 60.1±10.3 |
| Sex, n (%) |
|
|
|
Male | 376 (73.4) | 223 (82.6) |
|
Female | 136 (26.6) | 47 (17.4) |
| Smoking status, n
(%) |
|
|
|
Never | 115 (22.5) | 48 (17.8) |
|
Current/former | 385 (75.2) | 222 (82.2) |
|
NAa | 12 (2.3) | 0 (0) |
| Tumor site, n
(%) |
|
|
|
Oropharynxb | 80 (15.6) | 102 (37.8) |
|
Larynx | 114 (22.3) | 48 (17.8) |
| Oral
cavityb | 308 (60.2) | 83 (30.7) |
|
Others | 10 (2) | 37 (13.7) |
| HPV status, n
(%) |
|
|
|
Positive | 35 (6.8) | 73 (27.0) |
|
Negative | 241 (47.1) | 196 (72.6) |
|
NAa | 236 (46.1) | 1 (0.4) |
| T classification, n
(%) |
|
|
| T1 | 48 (9.4) | 35 (13.0) |
| T2 | 130 (25.4) | 80 (29.6) |
| T3 | 99 (19.3) | 58 (21.5) |
| T4 | 172 (33.6) | 97 (35.9) |
| TX or
NAa | 63 (12.3) | 0 (0) |
| N classification, n
(%) |
|
|
| N0 | 174 (34) | 94 (34.8) |
| N1 | 66 (12.9) | 32 (11.9) |
| N2 | 165 (32.2) | 132 (48.9) |
| N3 | 8 (1.6) | 12 (4.4) |
| NX or
NAa | 99 (19.3) | 0 (0) |
| M classification, n
(%) |
|
|
| M0 | 484 (94.5) | 263 (97.4) |
| M1 | 4 (0.8) | 7 (2.6) |
| MX or
NAa | 24 (4.7) | 0 (0) |
| TNM stage, n
(%) |
|
|
| I | 20 (3.9) | 18 (6.7) |
| II | 97 (18.9) | 37 (13.7) |
|
III | 104 (20.3) | 37 (13.7) |
| IV | 278 (54.3) | 178 (65.9) |
|
NAa | 13 (2.5) | 0 (0) |
| Grade, n (%) |
|
|
| 1 | 61 (11.9) | – |
| 2 | 300 (58.6) | – |
| 3 | 122 (23.8) | – |
| 4 | 7 (1.4) | – |
|
NAa | 22 (4.3) | 270 (100) |
| Neoadjuvant
treatment, n (%) |
|
|
| Yes | 10 (1.9) | – |
| No | 502 (98.1) | – |
| NAa | 0 (0) | 270 (100) |
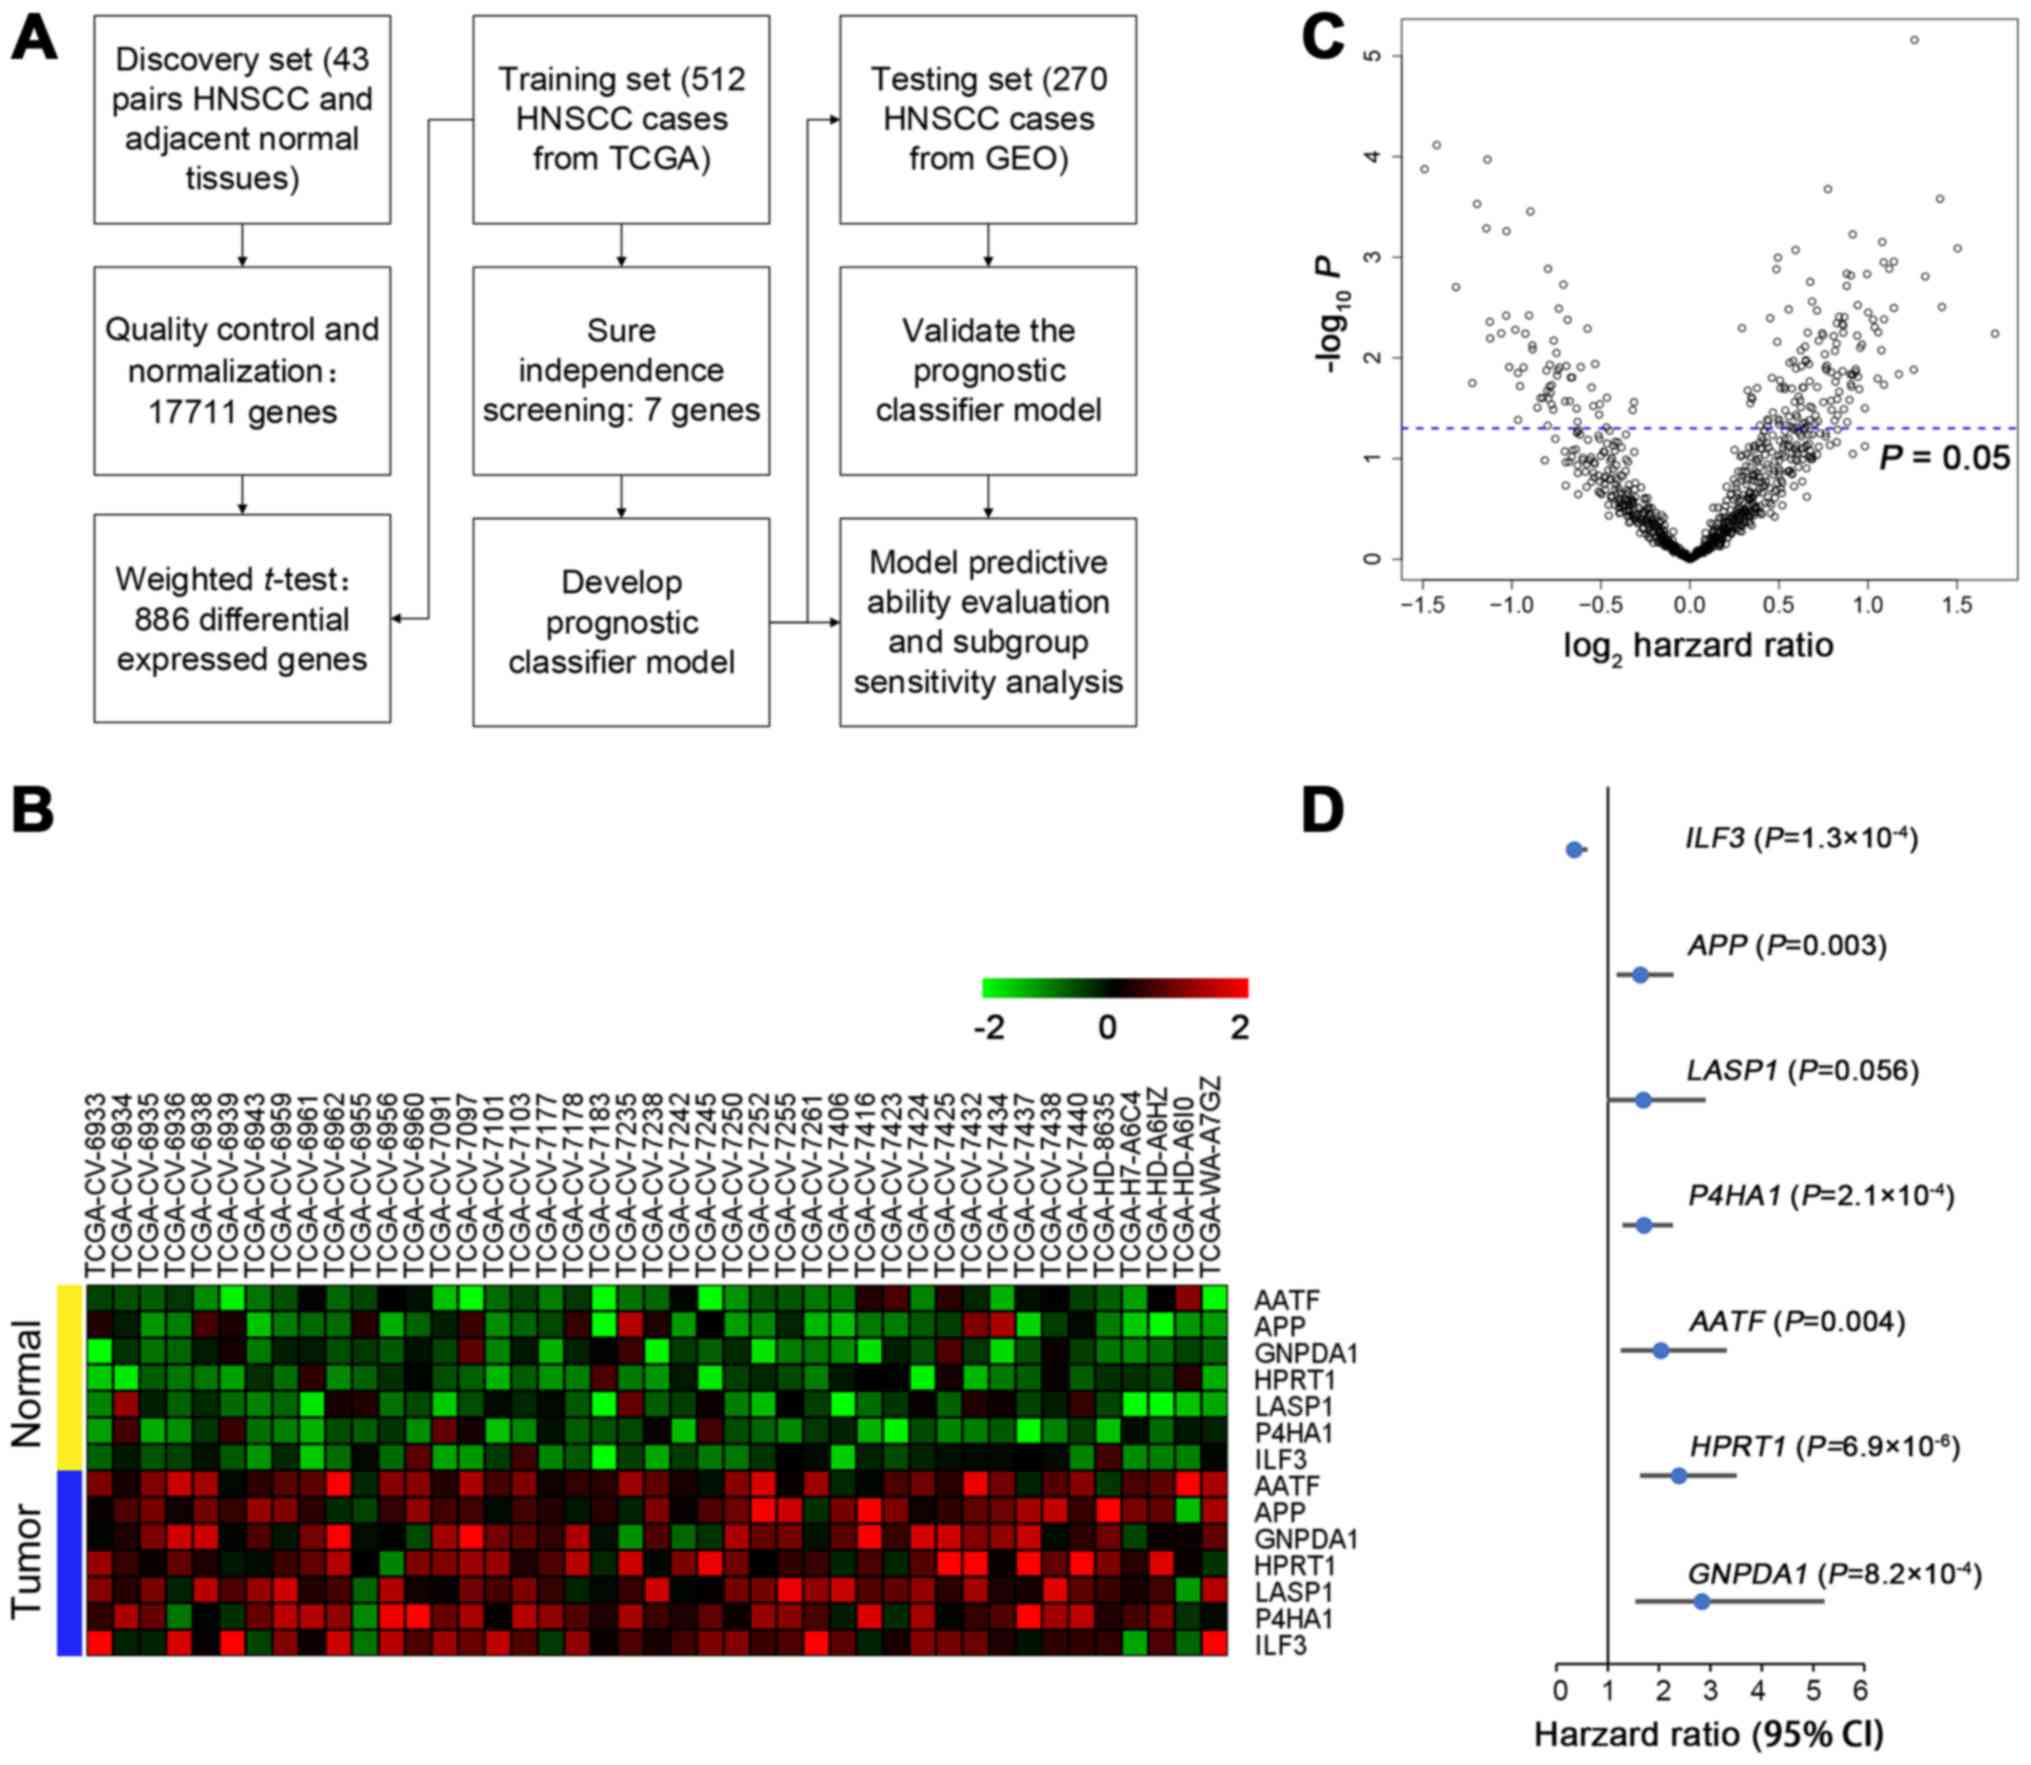
Development of biomarker signature
model
To exclude a large number of genes unrelated to
disease, we assessed the TCGA training set in two steps after
quality control (Fig. 1A). First,
of all 17711 genes with normalization, we used the WTT method to
select the top 5% significant genes (n=886) from 43 pairs of tumor
and matched adjacent normal tissue data. All 886 genes were
significantly differentially expressed (all P≤1.15×10⁻⁵)
and 199 genes were significant in univariate Cox regression
analysis (P<0.05; Fig. 1B).
Second, the SIS method was used for further dimension reduction.
After iterative process for different genes and LASSO penalized
regression with 10-fold cross-validation to select the best
parameter, seven genes remained after selection. All of them were
significantly overexpressed in tumor tissue (Fig. 1C). In addition, they were
significantly associated with overall survival except LASP1
(P=0.056) (Fig. 1D). A Cox
regression model was used to generate model coefficients. The
biomarker signature model was calculated as risk score =
0.198×AATF + 0.244×APP + 0.252×GNPDA1 +
0.314×HPRT1 + 0.136×LASP1 + 0.110×P4HA1 -
0.388×ILF3. We categorized the patients into low-risk and
high-risk groups and defined the cut-off value (score=0.36). This
was selected by the optimum cut point according to the highest
χ2 value defined by Kaplan-Meier survival analysis and
log-rank test in the training test (26).
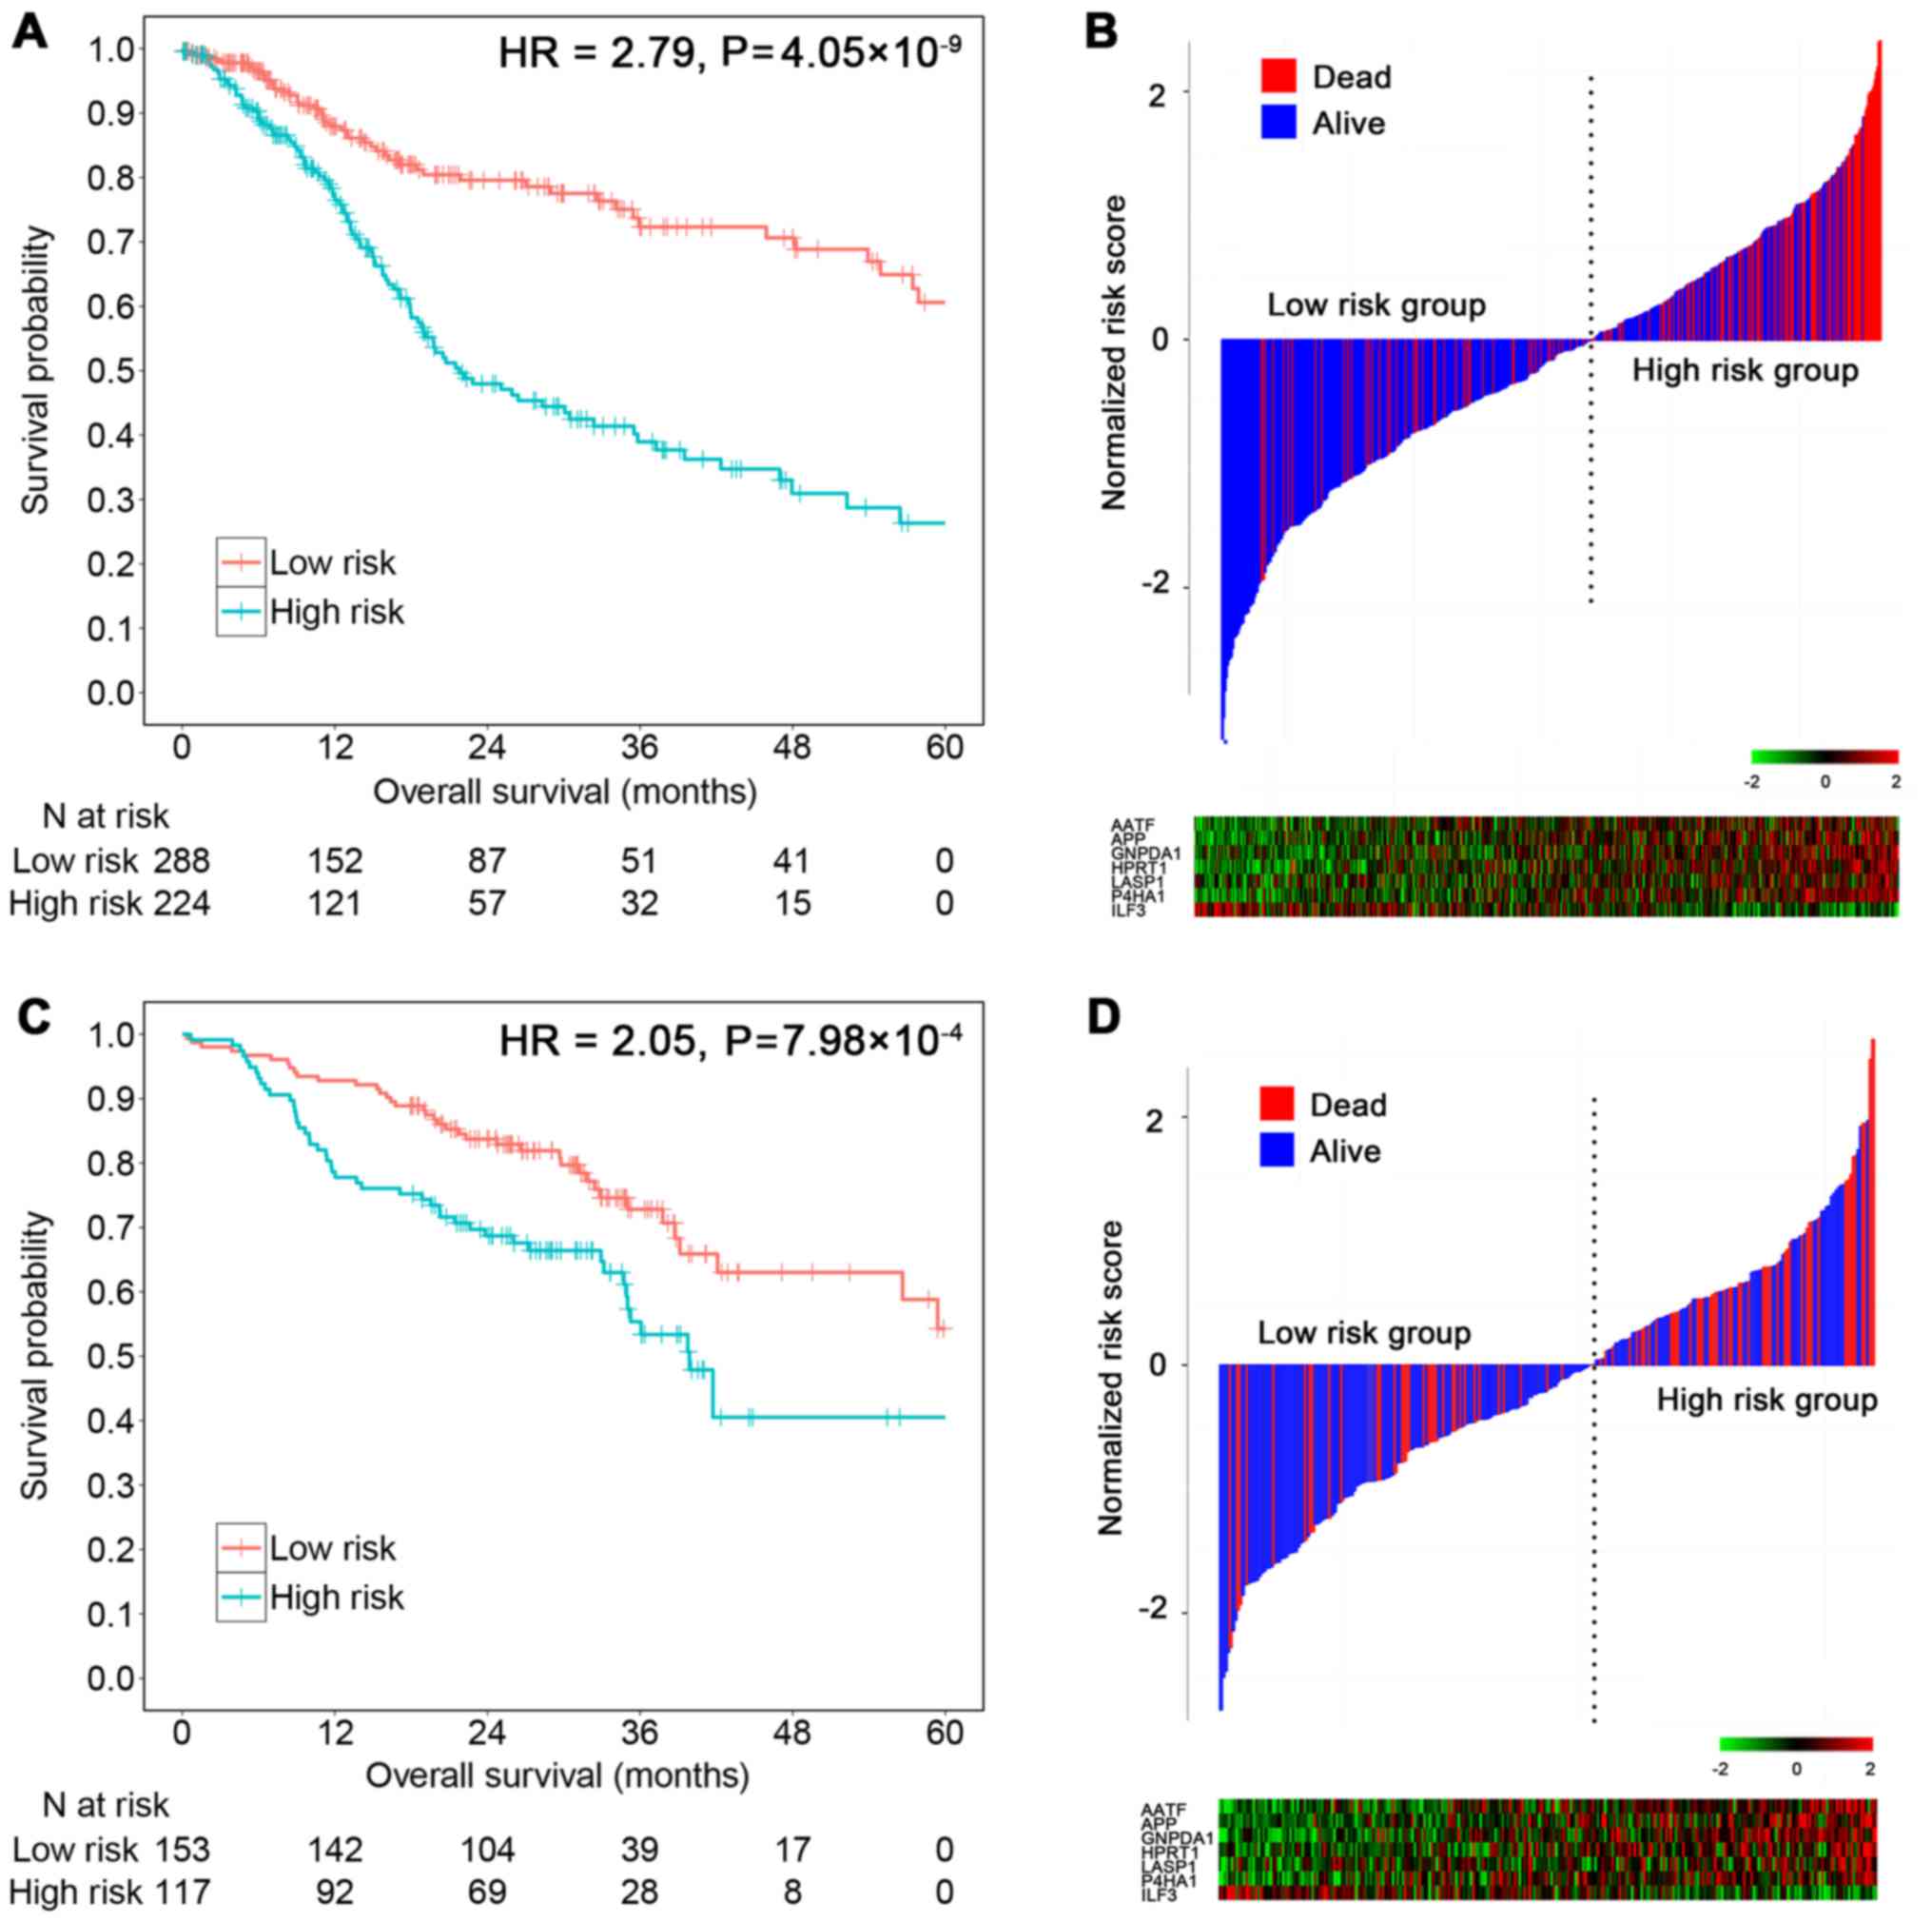
As a linear combination model of seven mRNAs, the
risk score was significantly associated with the TCGA patient
survival (HRunadjust = 2.79; 95% CI, 1.98–3.92;
P=4.05×10⁻⁹) (Fig. 2A).
In total, 16.4% in the low-risk group vs. 41.8% in the high-risk
group were followed until death (χ2=38.78,
P=4.76×10⁻¹⁰) (Fig. 2B).
With the bootstrap adjustment for clinical characteristics, the
results remained significant for all cases (HRadjust = 2.86; 95%
CI, 1.99–4.12; P<0.0001) or cases with available HPV status
(HRadjust = 3.17; 95% CI, 1.90–5.30; P<0.0001) (Table II).
| Table II.Multivariable Cox regression analysis
of clinical characteristics and risk score. |
Table II.
Multivariable Cox regression analysis
of clinical characteristics and risk score.
|
| Training set |
|
|
|---|
|
|
|
|
|
|---|
|
| All cases
(n=512) | Cases with HPV
status (n=276) | Testing set
(n=270) |
|---|
|
|
|
|
|
|---|
|
Characteristics | HR (95% CI) | P-value | HR (95% CI) | P-value | HR (95% CI) | P-value |
|---|
| High risk
score | 2.86
(1.99–4.12) | <0.0001 | 3.17
(1.90–5.30) | <0.0001 | 1.94
(1.27–2.96) | 0.002 |
| Age (per year) | 1.02
(1.00–1.04) | 0.039 | 1.01
(0.99–1.04) | 0.141 | 1.03
(1.00–1.06) | 0.020 |
| Gender
(Female) | 1.11
(0.76–1.62) | 0.578 | 1.07
(0.64–1.79) | 0.797 | 1.02
(0.57–1.79) | 0.952 |
| Smoking status |
|
|
|
|
|
|
|
(Current/former smoker) | 1.26
(0.80–1.98) | 0.324 | 1.56
(0.87–2.79) | 0.133 | 0.92
(0.49–1.75) | 0.815 |
| Clinical stage (per
stage) | 1.09
(0.91–1.31) | 0.331 |
1.02(0.82–1.25) | 0.878 | 1.77
(1.21–2.59) | 0.003 |
| HPV status
(positive) | – | – | 0.65
(0.29–1.47) | 0.301 | 0.43
(0.24–0.79) | 0.006 |
Validation of the prognostic
signature
In the GEO testing set, risk scores were calculated
for each patient. Using the same cut-off value (score=0.36), the
score showed a 2.05 times higher risk of death for the high-risk
group compared to the low-risk group in univariate Cox regression
(HRunadjust = 2.05; 95% CI, 1.35–3.11; P=7.98×10⁻⁴)
(Fig. 2C). In total, 25.1% in the
low-risk group vs. 46.3% in the high-risk group were followed until
death (χ2 = 11.62, P=6.53×10⁻⁴) (Fig. 2D). Results retained statistical
significance with further adjustment for covariates, including age,
sex, smoking status, HPV status and clinical stage (HRadjust =
1.94; 95% CI, 1.27–2.96; P=0.002) (Table II).
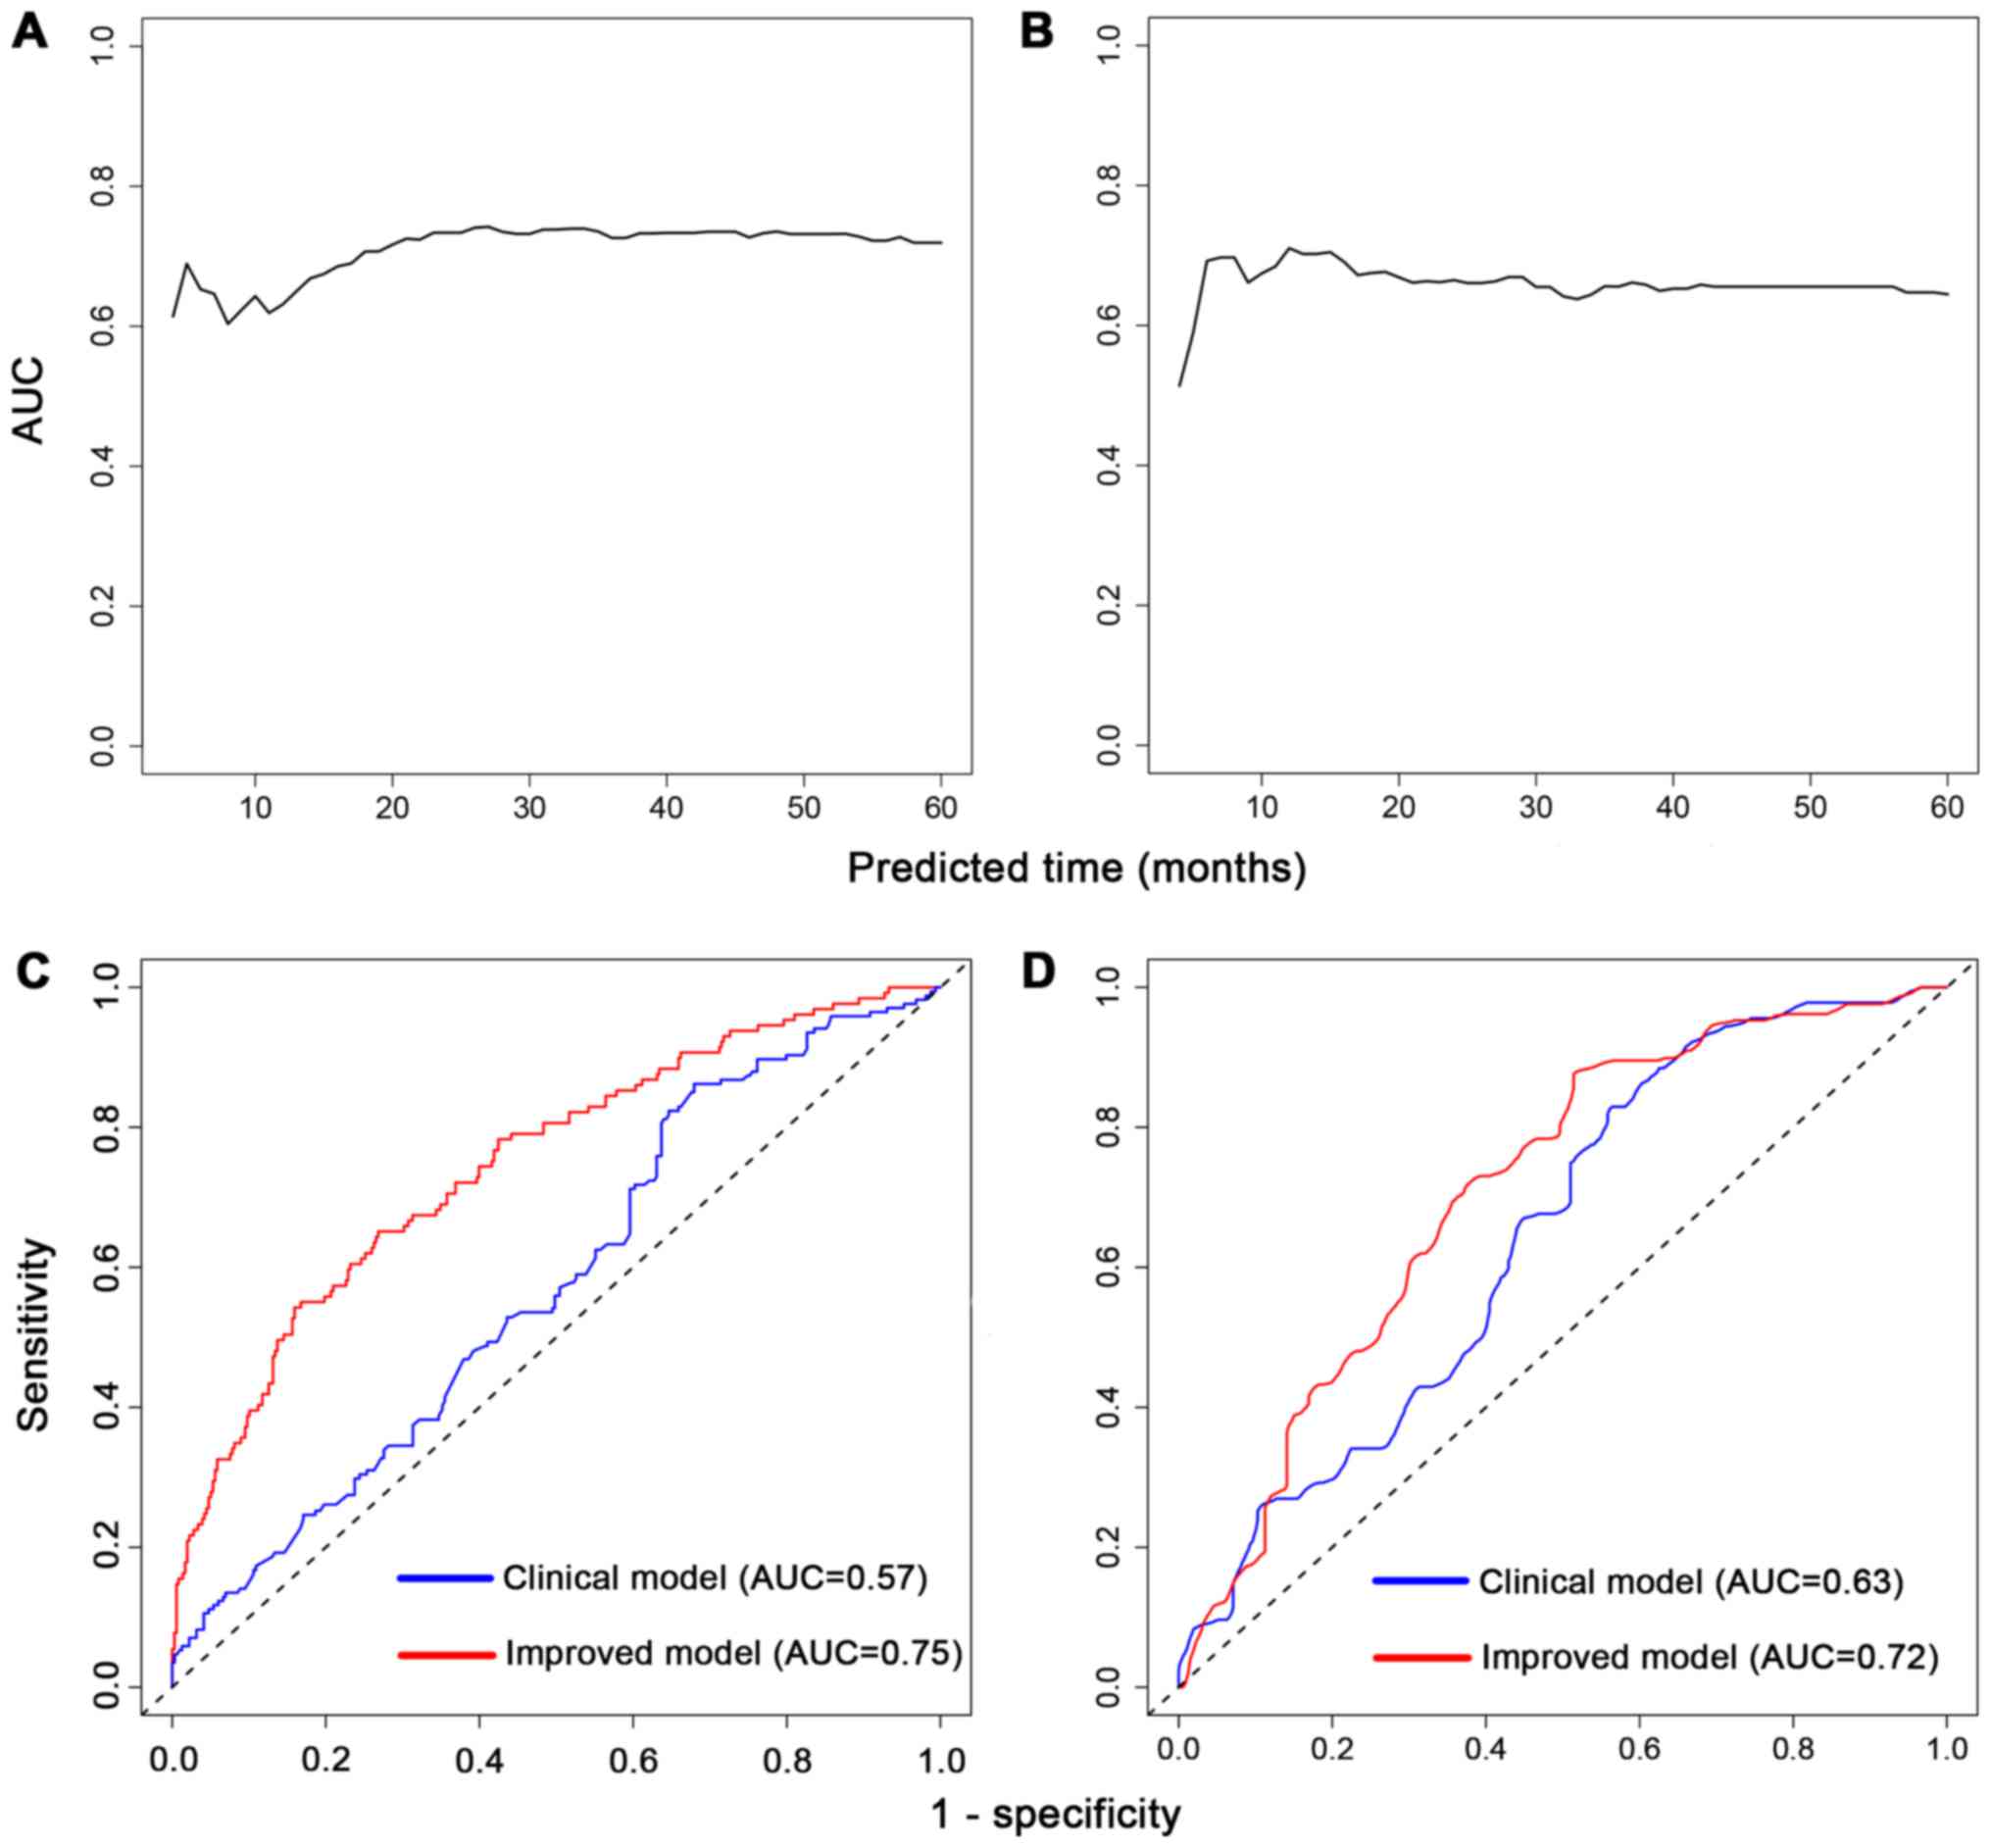
Furthermore, prognostic prediction ability for
5-year survival was evaluated. The time-dependent AUCs of risk
scores for HNSCC cases were 0.73 (95% CI, 0.68–0.78; P<0.001) in
the training set (Fig. 3A) and 0.66
(95% CI, 0.59–0.73; P<0.001) in the testing set (Fig. 3B). Besides, we combined the scores
with clinical characteristics to see whether they could improve the
predictive value. In the training set, prognostic score plus
clinical characteristics had a higher AUC (AUC, 0.75; 95% CI,
0.70–0.80) than the clinical characteristics (age, sex and stage)
alone (AUC, 0.57; 95% CI, 0.51–0.64) (Fig. 3C). The testing set also displayed
improvement in AUC from 0.63 (95% CI, 0.57–0.70) to 0.72 (95% CI,
0.65–0.78) (Fig. 3D). In brief, the
risk score could better distinguish HNSCC prognosis beyond clinical
information alone.
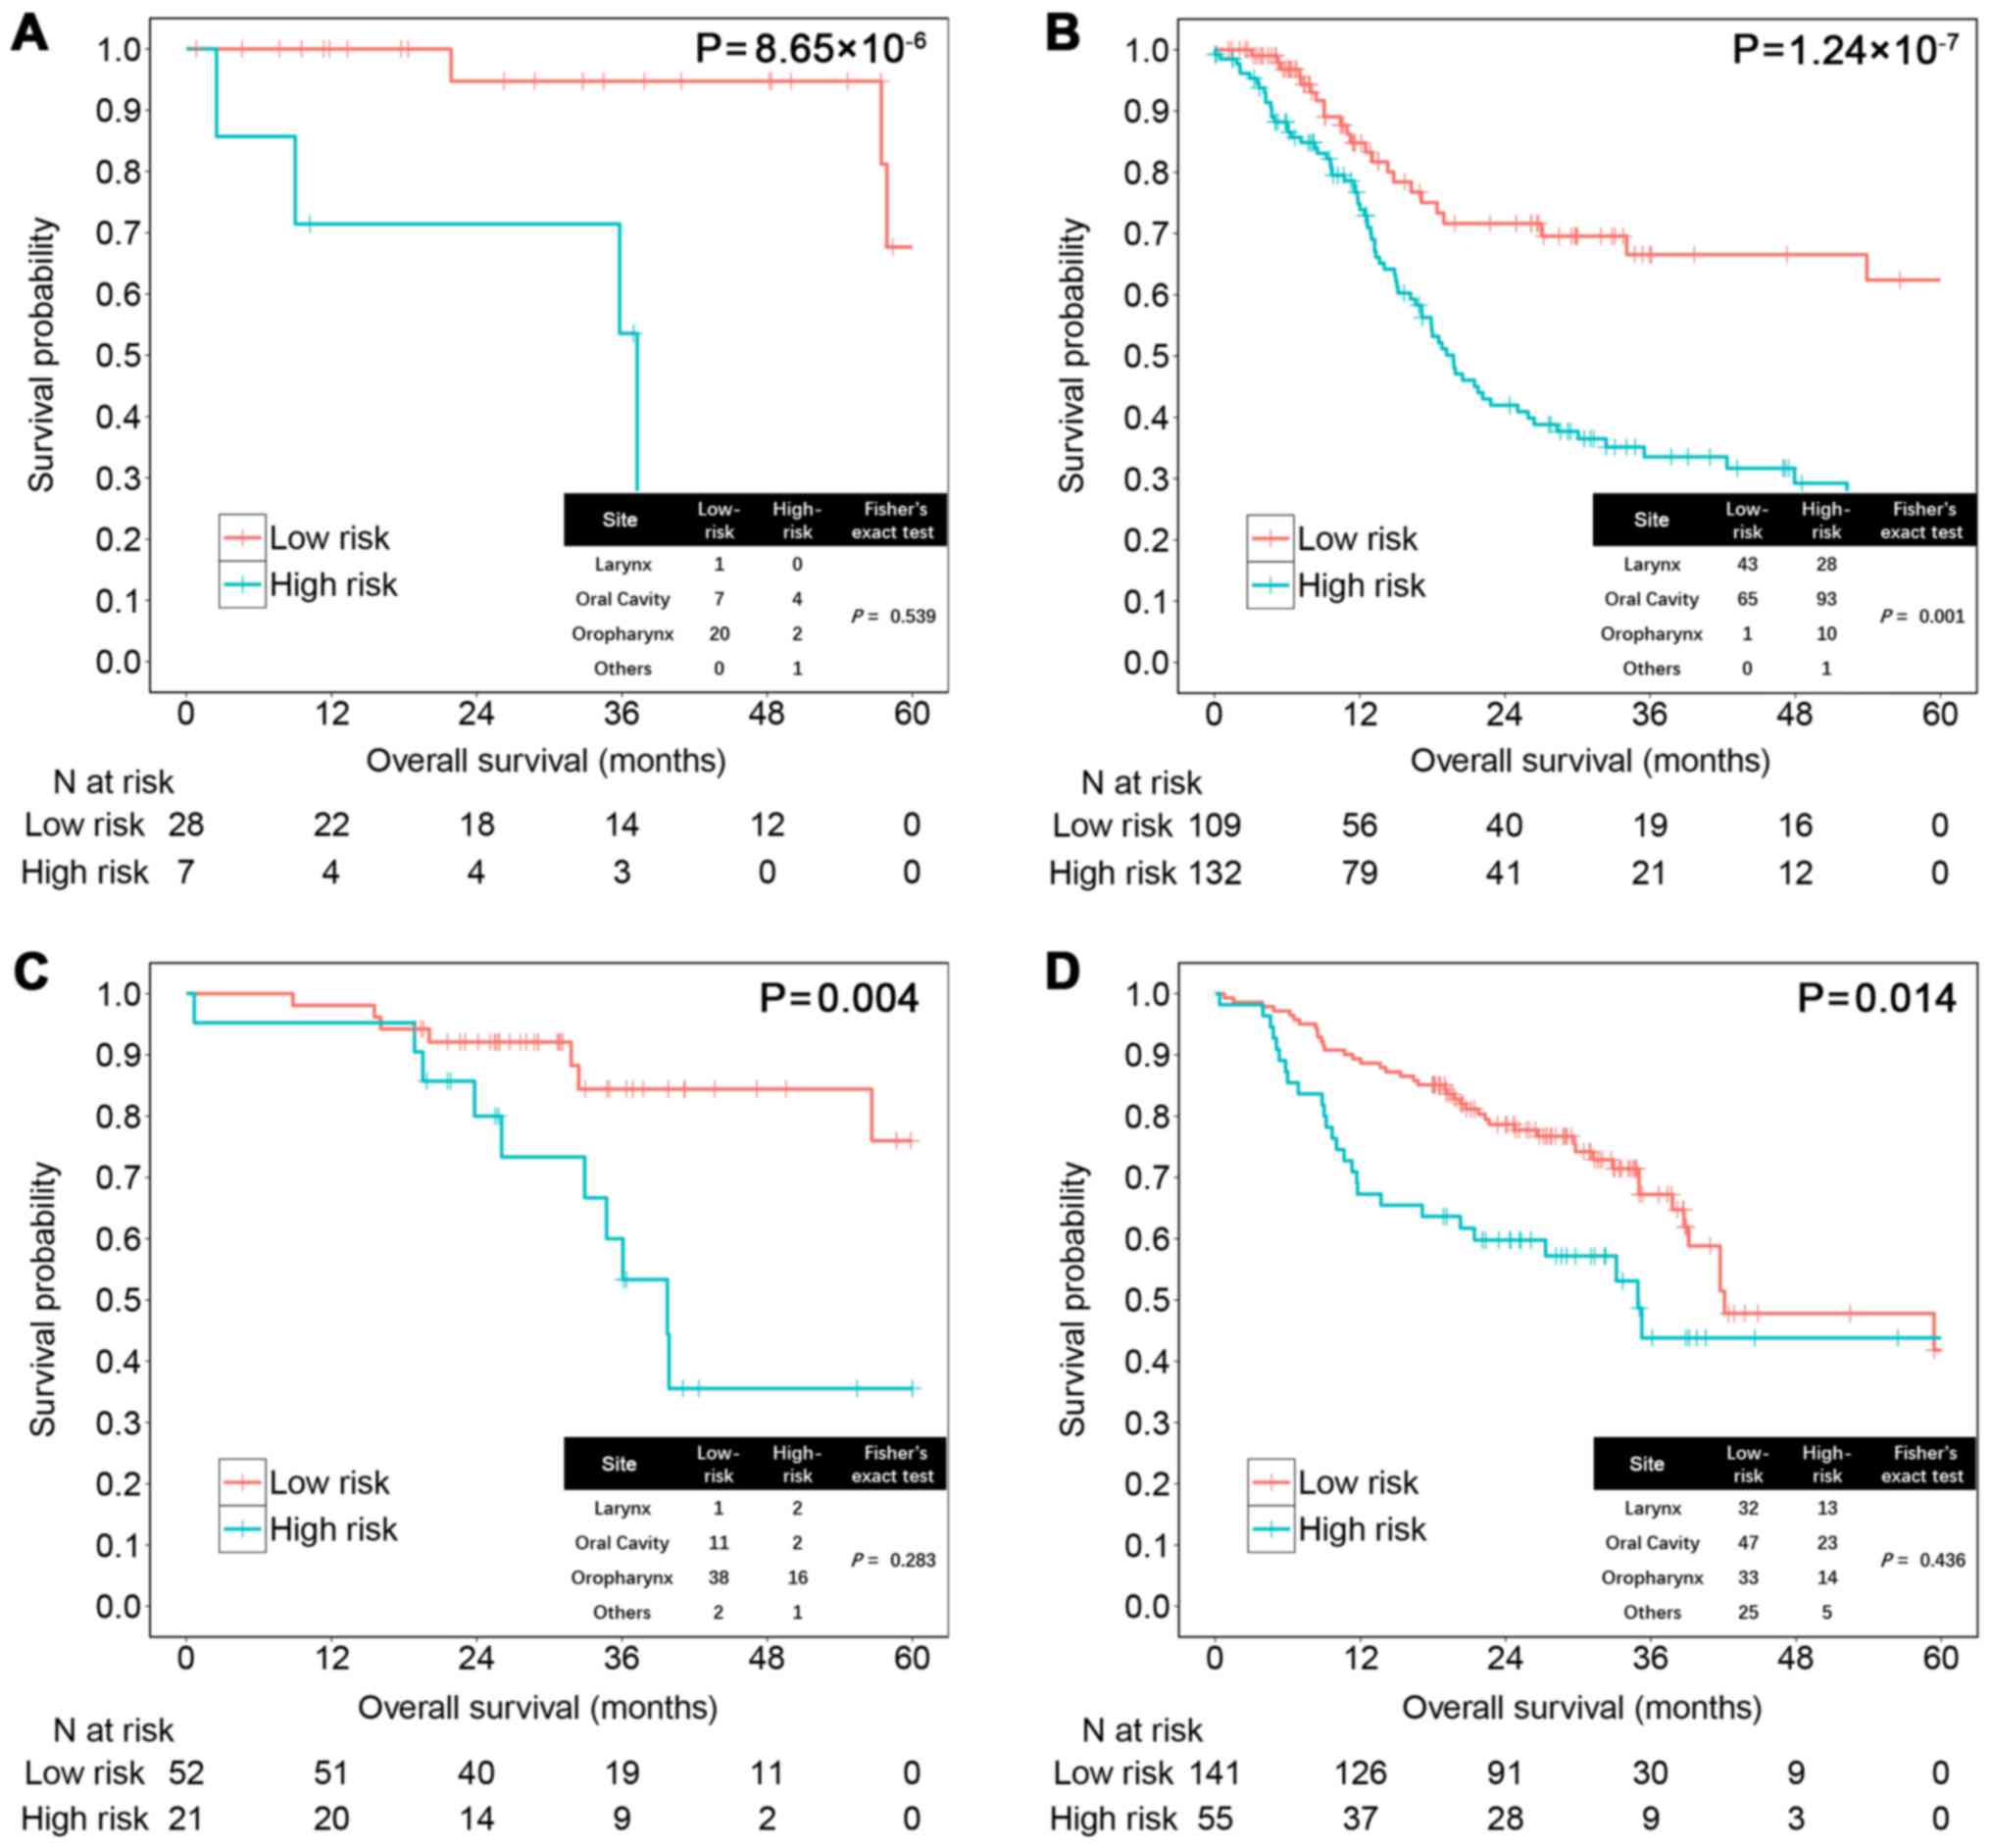
Subgroup sensitivity analysis with HPV
status and tumor site
Next, we examined whether the risk score could help
improve prognostication in the two datasets separately by subgroup
sensitivity analysis. HPV-positive HNSCC has been widely recognized
as associated with better prognosis than HPV-negative HNSCC
(27). The risk score could
significantly distinguish patient prognosis among 274 cases with
available HPV information in the training set (HPV+,
P=8.65×10⁻⁶; HPV−, P=1.24×10⁻⁷;
Fig. 4A and B) and 269 cases in the
testing set regardless of HPV status (HPV+, P=0.004;
HPV−, P=0.014; Fig. 4C and
D).
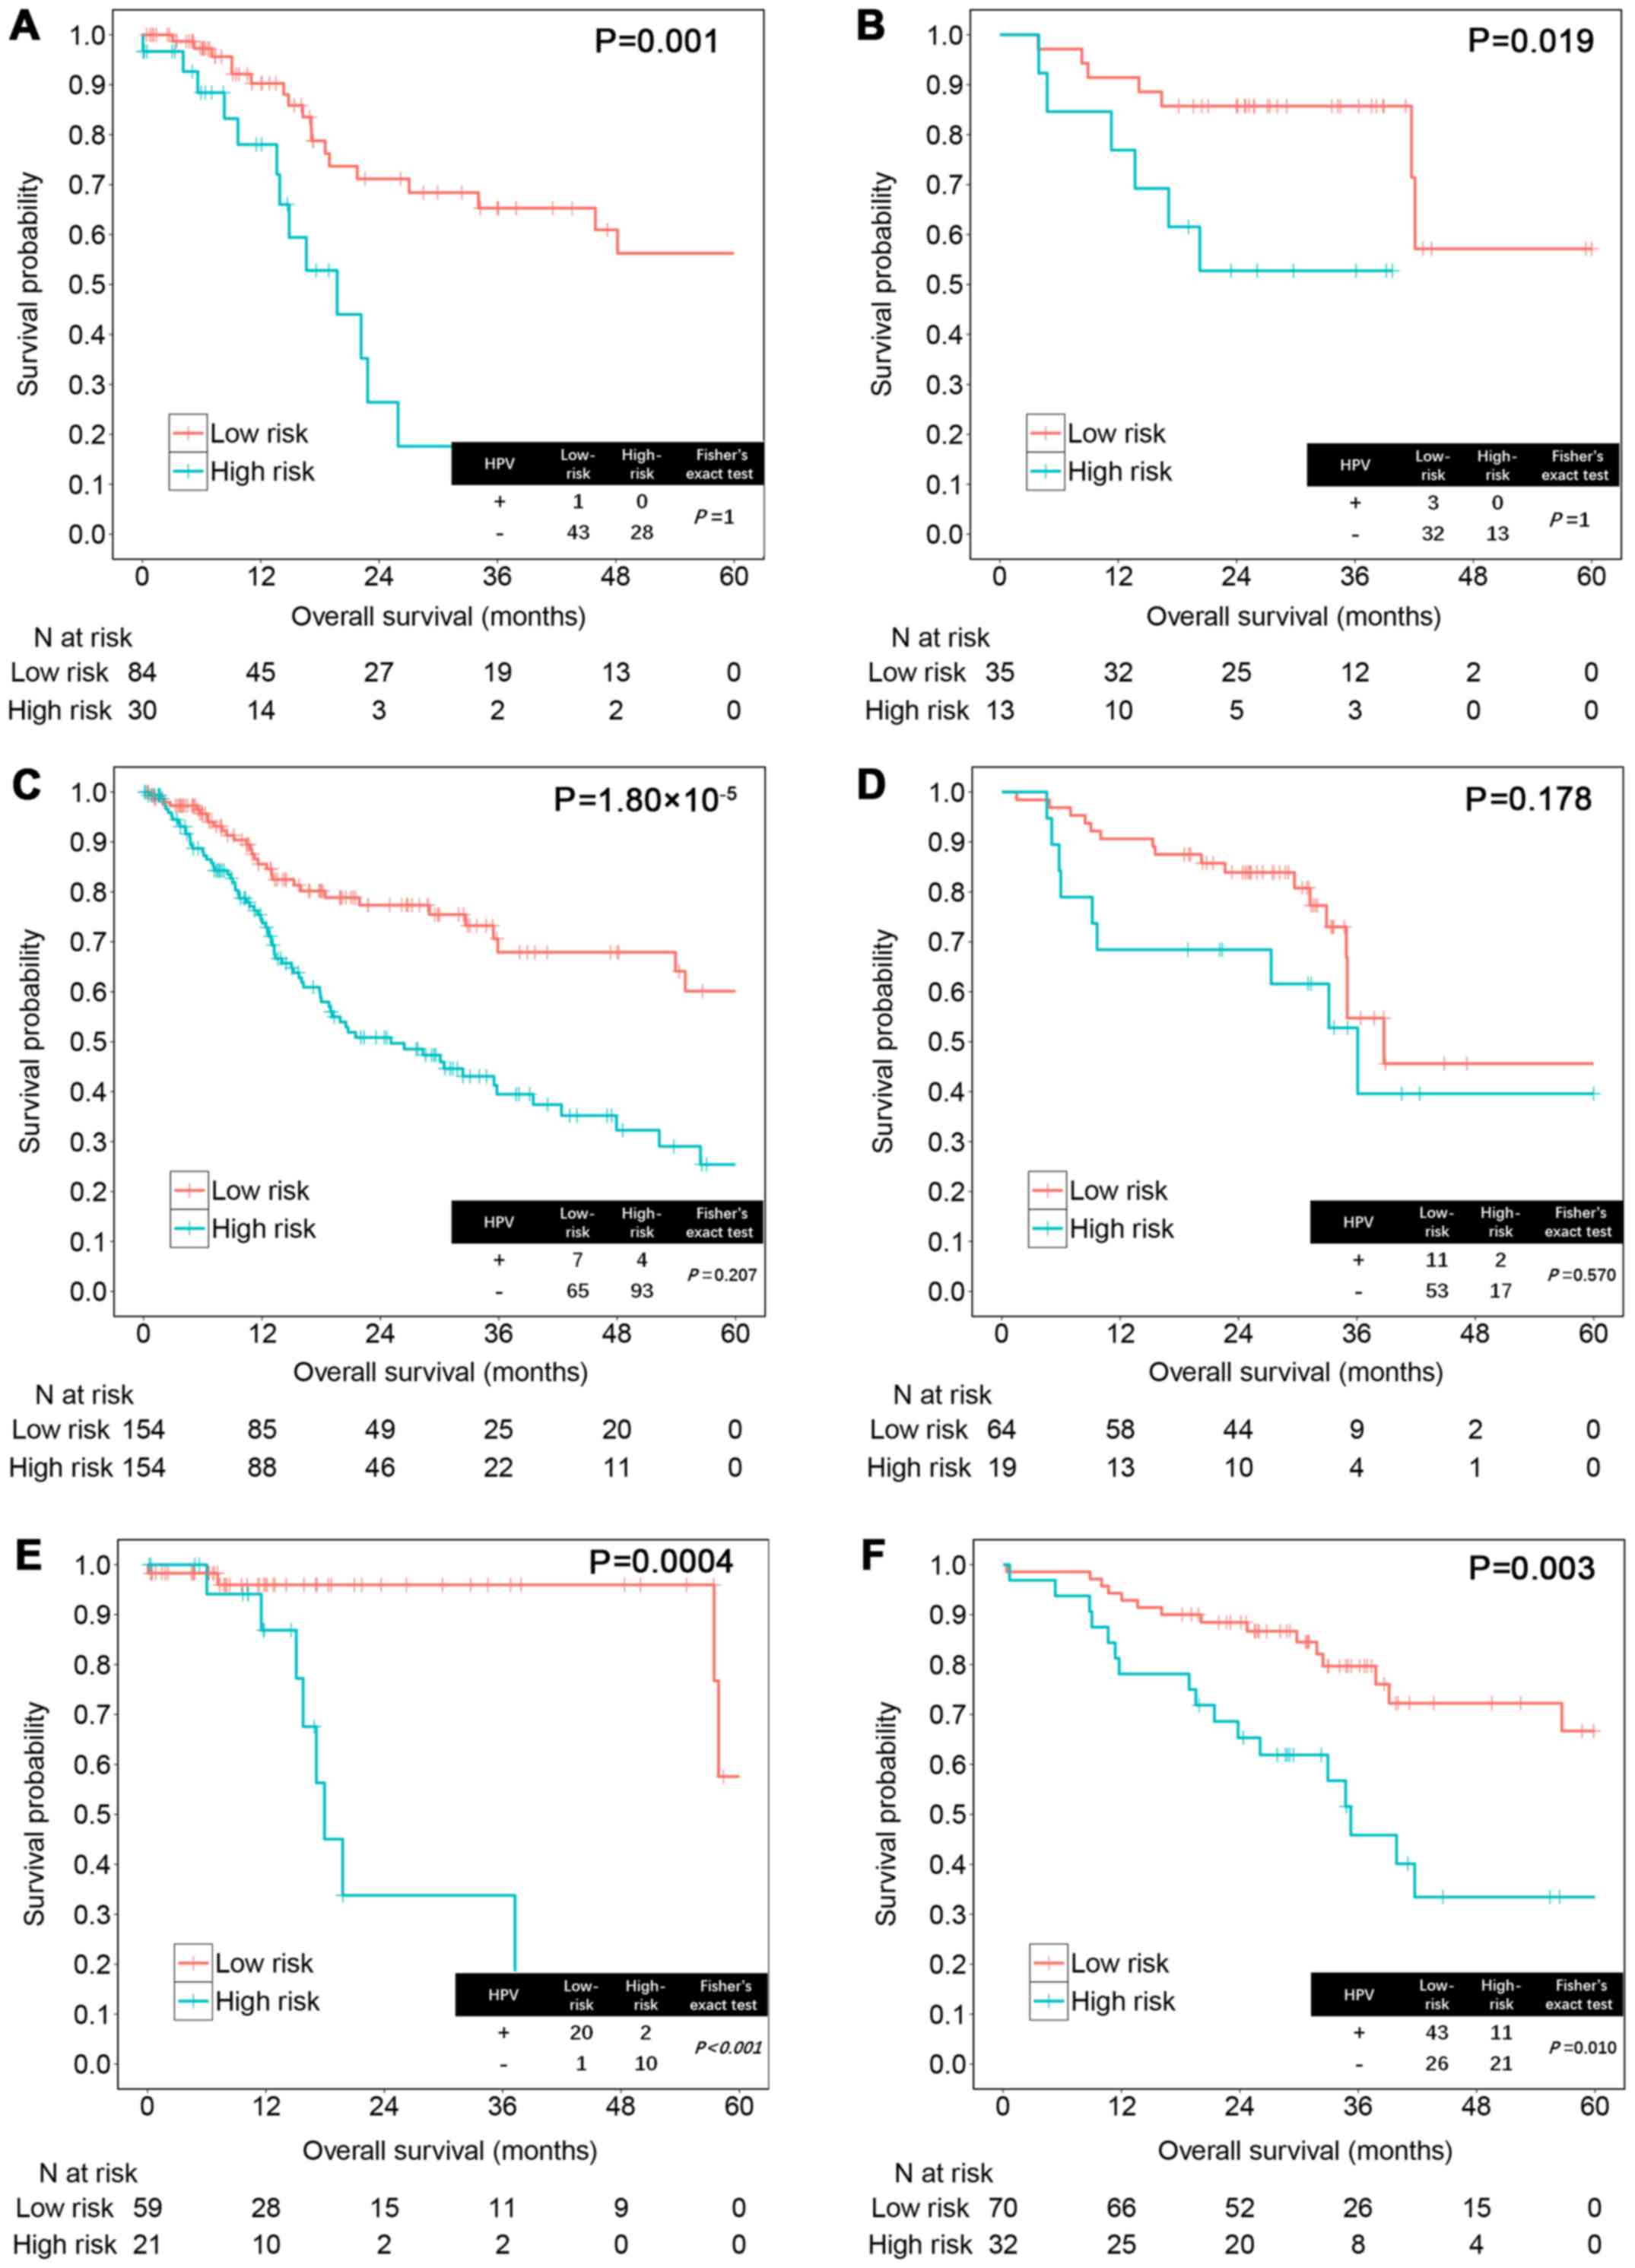
In different tumor sites, high vs. low-risk score
significantly distinguished outcomes in patients with tumor at
larynx (training set, P=0.001; testing set, P=0.019), oropharynx
(training set, P=0.0004; testing set, P=0.003) and oral cavity in
the training set (P=1.80×10⁻⁵) (Fig. 5). However, the result was not
significant in oral cavity of the testing set (P=0.178), possibly
due to the failure to distinguish patients with longer survival. In
addition, we found that HPV-positive status improves survival in
oropharyngeal HNSCC but not in non-oropharyngeal HNSCC (training
set, P<0.001; testing set, P=0.010; Fig. 5E and F), which was consistent with a
previous report (28).
Discussion
In the present study, we developed an HNSCC
prognostic risk model that includes seven mRNAs and validated it
using an independent external data set. Integrating multiple
biomarkers into an aggregated model could improve prognostic value
compared with single biomarker (29). Results showed that the risk score
was significantly associated with patient overall survival. HNSCC
patients with higher risk scores tended to have a poorer clinical
outcome. In addition, this score could improve model performance
combined with clinical characteristics based on 5-year overall
survival.
To screen out the survival-related genes from over
20,000 total genes, we used a two-stage screening method. The WTT
method was used as the first step to identify a subset of genes
that were not only differentially expressed in the tumor and
matched normal tissues but also had an impact on patient survival
by weighting the clinical covariates. Using permutation procedures
that have widely been used in biomedical data analysis (30), error rates can be controlled
(22). The results show that all
the selected genes were differentially expressed and a number
(22.5%) were significantly associated with prognosis. The WTT
method performs better than a traditional t-test, which will
flag a large number of genes unrelated to disease. Afterwards, SIS
was used to reduce the number of genes included in the final model
as the second step. Compared with a traditional penalized
regression like lasso or elastic net models, SIS is ungraded on the
basis of penalized regression to reduce dimensionality from high to
a moderate scale that is below the sample size (24). It has improved both speed and
accuracy, and has a stronger association with disease (31). Of the seven genes in the training
set, all of them are significantly differentially expressed in
tumor and normal tissue. In addition, six of them are significant
in a univariate Cox model and the last one shows suggestive
significance (P=0.056). Our results show that the two-step gene
selection method is amenable to deal with a high dimension
problem.
Among the seven candidate genes, six have positive
coefficients in the prognostic model and are associated with worse
survival. AATF, also called Che-1, is a critical regulator
of apoptosis driven by genes coding for PAR4 and p53 (32), and promotes tumor cell survival by
sustaining mutant p53 transcription and inhibiting DNA damage
response activation (33). It has
activity in transcriptional regulation, cell cycle control, DNA
damage responses, and in the execution of cell death programs
(34). In addition, it interacts
with NRAGE that has been found as a tumor marker in
different cancers. AATF has been reported associated with
multiple cancers, such as colon carcinoma (35), gastric cancer (36), hepatocellular carcinoma (37) and breast cancer (38).
APP was initially found to be associated with
Alzheimers disease, but it also contributes to regulating cell
growth, apoptosis, and motility of cancer cells (39). Several studies have confirmed
APP as an invaluable marker for oral carcinogenesis that
promotes the proliferation and carcinogenesis of oral squamous cell
carcinoma (OSCC) (40–42). Notably, in addition to its effects
on promoting oral carcinogenesis, APP expression could be
negatively regulated by tea in OSCC, which has been demonstrated to
be effective in preventing animal carcinogenesis in different
experimental systems (41).
LASP1, a recognized cancer biomarker
functioning in cell structure, physiological processes, and cell
signaling, contributes to cancer aggressiveness by overexpression
(43). Increased LASP1
levels occur in OSCC and more than ten other tumor types (44). It appears to involved in regulation
of cancer cell metastatic propensity and perturb the architecture
and dynamics of focal adhesion that triggers cell migration and
invasion (45). In OSCC,
LASP1 plays an essential role in tumor cellular growth by
mediating G2/M transition.
This is not the first report for P4HA1 that
was associated with HNSCC prognosis (46). It is involved in hydroxylation of
collagen fibers and upregulated by HIF1 under hypoxic
conditions directly that drive a series of different biological
processes related with malignant progression. P4HA1
modulates target genes in cancer cell growth and tumor progression
(47) and its expression increases
during the invasion and metastasis of breast cancer and hepatoma as
well (48,49).
Furthermore, GNPDA1 is an allosteric enzyme
that catalyses the reversible conversion of
D-glucosamine-6-phosphate into D-fructose-6-phosphate and ammonium
(50). It has been reported
upregulated in colorectal cancer cells with western blotting and
immunofluorescence assay (51). The
protein encoded by HPRT1 is a transferase, which plays a
central role in the generation of purine nucleotides through the
purine salvage pathway. It still needs further experiments to
validate its prognostic value.
In contrast, ILF3 confers an onco-protective
effect. Downregulation of ILF3 can delay cell cycle
progression, inhibit cell proliferation and reduce tumorigenic
capacity in vivo (52).
ILF3 is also involved in HPV-induced oncogenesis and
p53-mediated apoptosis. It is a positive regulator of HPV E6
expression and its depletion leads to the accumulation of active
p53 (53). Since HPV is effective
in HNSCC, targeting on this gene may be useful to control the
cancer.
The present study includes some limitations. First,
in the subgroup analysis, the results may not strongly be robust
due to small sample size of some groups. Second, due to the
different experimental methods (RNASeq versus microarray) used
between the two data sets, some bias may exist. Third, the
differences between the two populations may indicate a need for
further validation in another independent cohort for the current
prognostic signature. Finally, the prognostic value of the seven
genes in HNSCC still warrants further biological functional
experiments.
In conclusion, our results showed that the
seven-gene prognostic score significantly distinguishes HNSCC
patients prognosis and predicts 5-year overall survival in both
training and testing sets. Thus, this score may be a novel
biomarker based on gene expression levels and it warrants further
investigation for establishing its relevance for clinical
application.
Acknowledgements
We thank the patients and investigators who
participated in TCGA and GEO for providing the data. The present
study was supported by the National Natural Science Foundation of
China (grant nos. 81530088 and 81473070 to F.C., 81302512 to J.B.,
81402764 to Y.W. and 81402763 to R.Z.); and the Natural Science
Foundation of Jiangsu, China (no. BK20140907 to Y.W.). It is also
supported by the Nanjing Medical University international exchange
and cooperation project (no. C018 to S.S.)
References
|
1
|
Siegel RL, Miller KD and Jemal A: Cancer
statistics, 2016. CA Cancer J Clin. 66:7–30. 2016. View Article : Google Scholar : PubMed/NCBI
|
|
2
|
Cancer Genome Atlas N: Cancer Genome Atlas
Network: Comprehensive genomic characterization of head and neck
squamous cell carcinomas. Nature. 517:576–582. 2015. View Article : Google Scholar : PubMed/NCBI
|
|
3
|
Leemans CR, Braakhuis BJ and Brakenhoff
RH: The molecular biology of head and neck cancer. Nat Rev Cancer.
11:9–22. 2011. View
Article : Google Scholar : PubMed/NCBI
|
|
4
|
Chauhan SS, Kaur J, Kumar M, Matta A,
Srivastava G, Alyass A, Assi J, Leong I, MacMillan C, Witterick I,
et al: Prediction of recurrence-free survival using a protein
expression-based risk classifier for head and neck cancer.
Oncogenesis. 4:e1472015. View Article : Google Scholar : PubMed/NCBI
|
|
5
|
Patel SG and Shah JP: TNM staging of
cancers of the head and neck: Striving for uniformity among
diversity. CA Cancer J Clin. 55:242–258; quiz 261–262, 264. 2005.
View Article : Google Scholar : PubMed/NCBI
|
|
6
|
Wyss A, Hashibe M, Chuang SC, Lee YC,
Zhang ZF, Yu GP, Winn DM, Wei Q, Talamini R, Szeszenia-Dabrowska N,
et al: Cigarette, cigar, and pipe smoking and the risk of head and
neck cancers: Pooled analysis in the International Head and Neck
Cancer Epidemiology Consortium. Am J Epidemiol. 178:679–690. 2013.
View Article : Google Scholar : PubMed/NCBI
|
|
7
|
Ang KK, Harris J, Wheeler R, Weber R,
Rosenthal DI, Nguyen-Tân PF, Westra WH, Chung CH, Jordan RC, Lu C,
et al: Human papillomavirus and survival of patients with
oropharyngeal cancer. N Engl J Med. 363:24–35. 2010. View Article : Google Scholar : PubMed/NCBI
|
|
8
|
Kosaka N, Iguchi H and Ochiya T:
Circulating microRNA in body fluid: A new potential biomarker for
cancer diagnosis and prognosis. Cancer Sci. 101:2087–2092. 2010.
View Article : Google Scholar : PubMed/NCBI
|
|
9
|
Longo DL: Tumor heterogeneity and
personalized medicine. N Engl J Med. 366:956–957. 2012. View Article : Google Scholar : PubMed/NCBI
|
|
10
|
Zhao B, Hemann MT and Lauffenburger DA:
Intratumor heterogeneity alters most effective drugs in designed
combinations. Proc Natl Acad Sci USA. 111:10773–10778. 2014.
View Article : Google Scholar : PubMed/NCBI
|
|
11
|
Mroz EA and Rocco JW: MATH, a novel
measure of intratumor genetic heterogeneity, is high in
poor-outcome classes of head and neck squamous cell carcinoma. Oral
Oncol. 49:211–215. 2013. View Article : Google Scholar : PubMed/NCBI
|
|
12
|
Wong N, Khwaja SS, Baker CM, Gay HA,
Thorstad WL, Daly MD, Lewis JS Jr and Wang X: Prognostic microRNA
signatures derived from The Cancer Genome Atlas for head and neck
squamous cell carcinomas. Cancer Med. 5:1619–1628. 2016. View Article : Google Scholar : PubMed/NCBI
|
|
13
|
Shi H, Chen J, Li Y, Li G, Zhong R, Du D,
Meng R, Kong W and Lu M: Identification of a six microRNA signature
as a novel potential prognostic biomarker in patients with head and
neck squamous cell carcinoma. Oncotarget. 7:21579–21590.
2016.PubMed/NCBI
|
|
14
|
SJ C: Home Page, Cancer Genetics Web.
http://www.cancer-genetics.org/index.htmFeb
27–2017
|
|
15
|
De Cecco L, Bossi P, Locati L, Canevari S
and Licitra L: Comprehensive gene expression meta-analysis of head
and neck squamous cell carcinoma microarray data defines a robust
survival predictor. Ann Oncol. 25:1628–1635. 2014. View Article : Google Scholar : PubMed/NCBI
|
|
16
|
Bair E and Tibshirani R: Semi-supervised
methods to predict patient survival from gene expression data. PLoS
Biol. 2:E1082004. View Article : Google Scholar : PubMed/NCBI
|
|
17
|
Giefing M, Wierzbicka M, Szyfter K,
Brenner JC, Braakhuis BJ, Brakenhoff RH, Bradford CR, Sorensen JA,
Rinaldo A, Rodrigo JP, et al: Moving towards personalised therapy
in head and neck squamous cell carcinoma through analysis of next
generation sequencing data. Eur J Cancer. 55:147–157. 2016.
View Article : Google Scholar : PubMed/NCBI
|
|
18
|
Network TCGA: Comprehensive genomic
characterization of head and neck squamous cell carcinomas. Nature.
489:519–525. 2012. View Article : Google Scholar : PubMed/NCBI
|
|
19
|
Li B and Dewey CN: RSEM: Accurate
transcript quantification from RNA-Seq data with or without a
reference genome. BMC Bioinformatics. 12:3232011. View Article : Google Scholar : PubMed/NCBI
|
|
20
|
Wichmann G, Rosolowski M, Krohn K, Kreuz
M, Boehm A, Reiche A, Scharrer U, Halama D, Bertolini J, Bauer U,
et al: Leipzig Head and Neck Group (LHNG): The role of HPV RNA
transcription, immune response-related gene expression and
disruptive TP53 mutations in diagnostic and prognostic profiling of
head and neck cancer. Int J Cancer. 137:2846–2857. 2015. View Article : Google Scholar : PubMed/NCBI
|
|
21
|
Shi W, Oshlack A and Smyth GK: Optimizing
the noise versus bias trade-off for Illumina whole genome
expression BeadChips. Nucleic Acids Res. 38:e204. 2010. View Article : Google Scholar : PubMed/NCBI
|
|
22
|
Hu J, Yin G, Morris JS, Zhang L and Wright
FA: Entropy and survival-based weights to combine affymetrix array
types and analyze differential expression and survivalMethods of
Microarray Data Analysis. Shoemaker JS and Lin SM: CAMDA Springer;
Boston, MA: pp. 95–108. 2004
|
|
23
|
van Houwelingen HC, Bruinsma T, Hart AA,
Van't Veer LJ and Wessels LF: Cross-validated Cox regression on
microarray gene expression data. Stat Med. 25:3201–3216. 2006.
View Article : Google Scholar : PubMed/NCBI
|
|
24
|
Fan J and Lv J: Sure independence
screening for ultrahigh dimensional feature space. J R Stat Soc Ser
A Stat Soc. 70:883–911. 2008.
|
|
25
|
Heagerty PJ, Lumley T and Pepe MS:
Time-dependent ROC curves for censored survival data and a
diagnostic marker. Biometrics. 56:337–344. 2000. View Article : Google Scholar : PubMed/NCBI
|
|
26
|
Wei JH, Haddad A, Wu KJ, Zhao HW, Kapur P,
Zhang ZL, Zhao LY, Chen ZH, Zhou YY, Zhou JC, et al: A
CpG-methylation-based assay to predict survival in clear cell renal
cell carcinoma. Nat Commun. 6:86992015. View Article : Google Scholar : PubMed/NCBI
|
|
27
|
Mroz EA, Tward AD, Hammon RJ, Ren Y and
Rocco JW: Intra-tumor genetic heterogeneity and mortality in head
and neck cancer: Analysis of data from the Cancer Genome Atlas.
PLoS Med. 12:e10017862015. View Article : Google Scholar : PubMed/NCBI
|
|
28
|
Worsham MJ, Stephen JK, Chen KM, Mahan M,
Schweitzer V, Havard S and Divine G: Improved survival with HPV
among African Americans with oropharyngeal cancer. Clin Cancer Res.
19:2486–2492. 2013. View Article : Google Scholar : PubMed/NCBI
|
|
29
|
Ng SW, Mitchell A, Kennedy JA, Chen WC,
McLeod J, Ibrahimova N, Arruda A, Popescu A, Gupta V, Schimmer AD,
et al: A 17-gene stemness score for rapid determination of risk in
acute leukaemia. Nature. 540:433–437. 2016. View Article : Google Scholar : PubMed/NCBI
|
|
30
|
Ludbrook J and Dudley H: Why permutation
tests are superior to t and F tests in biomedical research. Am
Stat. 52:127–132. 1998. View Article : Google Scholar
|
|
31
|
Fan J and Lv J: Sure independence
screening for ultra-high dimensional feature space (with
discussion). J R Stat Soc Ser A Stat Soc. 70:849–911. 2008.
View Article : Google Scholar
|
|
32
|
Sharma S, Kaul D, Arora M and Malik D:
Oncogenic nature of a novel mutant AATF and its interactome
existing within human cancer cells. Cell Biol Int. 39:326–333.
2015. View Article : Google Scholar : PubMed/NCBI
|
|
33
|
Bruno T, Desantis A, Bossi G, Di Agostino
S, Sorino C, De Nicola F, Iezzi S, Franchitto A, Benassi B, Galanti
S, et al: Che-1 promotes tumor cell survival by sustaining mutant
p53 transcription and inhibiting DNA damage response activation.
Cancer Cell. 18:122–134. 2010. View Article : Google Scholar : PubMed/NCBI
|
|
34
|
Passananti C and Fanciulli M: The
anti-apoptotic factor Che-1/AATF links transcriptional regulation,
cell cycle control, and DNA damage response. Cell Div. 2:212007.
View Article : Google Scholar : PubMed/NCBI
|
|
35
|
Di Padova M, Bruno T, De Nicola F, Iezzi
S, D'Angelo C, Gallo R, Nicosia D, Corbi N, Biroccio A, Floridi A,
et al: Che-1 arrests human colon carcinoma cell proliferation by
displacing HDAC1 from the p21WAF1/CIP1 promoter. J Biol
Chem. 278:36496–36504. 2003. View Article : Google Scholar : PubMed/NCBI
|
|
36
|
Kanda M, Shimizu D, Fujii T, Tanaka H,
Tanaka Y, Ezaka K, Shibata M, Takami H, Hashimoto R, Sueoka S, et
al: Neurotrophin receptor-interacting melanoma antigen-encoding
gene homolog is associated with malignant phenotype of gastric
cancer. Ann Surg Oncol. 23 Suppl 4:532–539. 2016. View Article : Google Scholar : PubMed/NCBI
|
|
37
|
Shimizu D, Kanda M, Sugimoto H, Sueoka S,
Takami H, Ezaka K, Tanaka Y, Hashimoto R, Okamura Y, Iwata N, et
al: NRAGE promotes the malignant phenotype of hepatocellular
carcinoma. Oncol Lett. 11:1847–1854. 2016. View Article : Google Scholar : PubMed/NCBI
|
|
38
|
Sharma M: Apoptosis-antagonizing
transcription factor (AATF) gene silencing: Role in induction of
apoptosis and down-regulation of estrogen receptor in breast cancer
cells. Biotechnol Lett. 35:1561–1570. 2013. View Article : Google Scholar : PubMed/NCBI
|
|
39
|
Lim S, Yoo BK, Kim HS, Gilmore HL, Lee Y,
Lee HP, Kim SJ, Letterio J and Lee HG: Amyloid-β precursor protein
promotes cell proliferation and motility of advanced breast cancer.
BMC Cancer. 14:9282014.https://doi.org/10.1186/1471-2407-14-928
View Article : Google Scholar : PubMed/NCBI
|
|
40
|
Provenzano MJ, Yu L, Hitchler MJ,
Fitzgerald MP, Robinson RA, Wayne S, Ver Meer M and Domann FE: AP-2
participates in the transcriptional control of the amyloid
precursor protein (APP) gene in oral squamous cell carcinoma. Exp
Mol Pathol. 83:277–282. 2007. View Article : Google Scholar : PubMed/NCBI
|
|
41
|
Ko SY, Chang KW, Lin SC, Hsu HC and Liu
TY: The repressive effect of green tea ingredients on amyloid
precursor protein (APP) expression in oral carcinoma cells in vitro
and in vivo. Cancer Lett. 245:81–89. 2007. View Article : Google Scholar : PubMed/NCBI
|
|
42
|
Ko SY, Lin SC, Chang KW, Wong YK, Liu CJ,
Chi CW and Liu TY: Increased expression of amyloid precursor
protein in oral squamous cell carcinoma. Int J Cancer. 111:727–732.
2004. View Article : Google Scholar : PubMed/NCBI
|
|
43
|
Orth MF, Cazes A, Butt E and Grunewald TG:
An update on the LIM and SH3 domain protein 1 (LASP1): A versatile
structural, signaling, and biomarker protein. Oncotarget. 6:26–42.
2015. View Article : Google Scholar : PubMed/NCBI
|
|
44
|
Shimizu F, Shiiba M, Ogawara K, Kimura R,
Minakawa Y, Baba T, Yokota S, Nakashima D, Higo M, Kasamatsu A, et
al: Overexpression of LIM and SH3 protein 1 leading to accelerated
G2/M phase transition contributes to enhanced tumourigenesis in
oral cancer. PLoS One. 8:e83187. 2013. View Article : Google Scholar : PubMed/NCBI
|
|
45
|
Ruggieri V, Agriesti F, Tataranni T,
Perris R and Mangieri D: Paving the path for invasion: The
polyedric role of LASP1 in cancer. Tumour Biol.
39:10104283177057572017. View Article : Google Scholar : PubMed/NCBI
|
|
46
|
Tawk B, Schwager C, Deffaa O, Dyckhoff G,
Warta R, Linge A, Krause M, Weichert W, Baumann M, Herold-Mende C,
et al: Comparative analysis of transcriptomics based hypoxia
signatures in head- and neck squamous cell carcinoma. Radiother
Oncol. 118:350–358. 2016. View Article : Google Scholar : PubMed/NCBI
|
|
47
|
Chakravarthi BVSK, Pathi SS, Goswami MT,
Cieślik M, Zheng H, Nallasivam S, Arekapudi SR, Jing X, Siddiqui J,
Athanikar J, et al: The miR-124-prolyl hydroxylase P4HA1-MMP1 axis
plays a critical role in prostate cancer progression. Oncotarget.
5:6654–6669. 2014. View Article : Google Scholar : PubMed/NCBI
|
|
48
|
Feng G, Shi H, Li J, Yang Z, Fang R, Ye L,
Zhang W and Zhang X: MiR-30e suppresses proliferation of hepatoma
cells via targeting prolyl 4-hydroxylase subunit alpha-1 (P4HA1)
mRNA. Biochem Biophys Res Commun. 472:516–522. 2016. View Article : Google Scholar : PubMed/NCBI
|
|
49
|
Gilkes DM, Chaturvedi P, Bajpai S, Wong
CC, Wei H, Pitcairn S, Hubbi ME, Wirtz D and Semenza GL: Collagen
prolyl hydroxylases are essential for breast cancer metastasis.
Cancer Res. 73:3285–3296. 2013. View Article : Google Scholar : PubMed/NCBI
|
|
50
|
Arreola R, Valderrama B, Morante ML and
Horjales E: Two mammalian glucosamine-6-phosphate deaminases: A
structural and genetic study. FEBS Lett. 551:63–70. 2003.
View Article : Google Scholar : PubMed/NCBI
|
|
51
|
He YJ, Li WL, Liu BH, Dong H, Mou ZR and
Wu YZ: Identification of differential proteins in colorectal cancer
cells treated with caffeic acid phenethyl ester. World J
Gastroenterol. 20:11840–11849. 2014. View Article : Google Scholar : PubMed/NCBI
|
|
52
|
Jiang W, Huang H, Ding L, Zhu P, Saiyin H,
Ji G, Zuo J, Han D, Pan Y, Ding D, et al: Regulation of cell cycle
of hepatocellular carcinoma by NF90 through modulation of cyclin E1
mRNA stability. Oncogene. 34:4460–4470. 2015. View Article : Google Scholar : PubMed/NCBI
|
|
53
|
Shamanna RA, Hoque M, Pe'ery T and Mathews
MB: Induction of p53, p21 and apoptosis by silencing the NF90/NF45
complex in human papilloma virus-transformed cervical carcinoma
cells. Oncogene. 32:5176–5185. 2013. View Article : Google Scholar : PubMed/NCBI
|