Introduction
Colorectal cancer (CRC) is one of the most commonly
diagnosed malignant tumors and the primary cause of cancer-related
deaths worldwide. In 2017, >135,000 individuals with newly
diagnosed CRC and over 50,000 deaths from the disease were reported
in the United States. In spite of 58% new cases of patients over 65
year of age, the number of patients under the age of 65 diagnosed
with CRC is exponentially increasing (1,2). CRC
is caused by many factors, such as genetics, lifestyle and
environment (3). In addition, there
is solid evidence that tumorigenesis of CRC is a multi-gene and
multi-pathway driven process (4–6). More
than 70% of colorectal adenoma occur in the APC gene mutation site
at an early stage and further promotes adenocarcinoma by activating
mutations of the KRAS gene and inactivating TP53 gene. The
mutations in these representative genes are often accompanied by
changes in the number and structure of chromosomes. More than 15%
of sporadic CRCs occur by other ways, including the CpG island
methylator phenotype, activation of BRAF oncogene mutations and
MLH1 gene promoter methylation (7).
Several signaling pathways such as Wnt-associated signaling
pathway, Hippo pathway and PI3K pathway have been associated with
CRC (8–10). Many reports have indicated the
abnormal expression of certain miRNAs, which also induce CRC cell
proliferation and migration (11).
To date, the fundamental pathophysiology of the disease has not
been fully elucidated, and remains a major obstacle for clinical
diagnosis and treatment.
In the last decade, microarray technology has been
broadly used to filter out CRC-specific differentially expressed
genes (DEGs). Iwaya et al identified DEGs between CRC
patients and normal colon epithelium (12). Yan et al also identified
potential biomarkers for the prognosis and prevention of CRC
(13). Bioinformatic methods owing
to their efficiency in dealing with high-throughput data are
currently now in use, but the most representative DEGs or pathways
still need to be identified. In addition, bioinformatic study
combining mRNA and miRNAs to investigate the pathophysiological
mechanisms of CRC has seldom been put forward. Thus, our research
aimed to associate mRNA with microRNAs (miRNAs) to promote the
discovery of potential diagnostic and therapeutic targets.
In the present study, we utilized the expression
profiling data submitted by Marisa et al (14) to identify the DEGs between colon
cancer samples and normal mucosa in Gene Expression Omnibus (GEO)
2R (https://www.ncbi.nlm.nih.gov/geo/geo2r/). Combining
with the data of The Cancer Genome Atlas (TCGA) (https://portal.gdc.cancer.gov/), Oncomine
(https://www.oncomine.org/), the tools of
Database for Annotation, Visualization and Integrated Discovery
(DAVID), Search Tool for the Retrieval of Interacting Genes
(STRING) (https://string-db.org/), Cytoscape
(http://www.cytoscape.org/), quantitative
polymerase chain reaction (qPCR) and western blotting, the hub
genes and its regulatory microRNAs (miRNAs) were screened and
explored further.
Materials and methods
Identification of DEGs
Gene expression profiling of GSE39582 (14), a dataset based on Agilent GPL570
platform (Affymetrix Human Genome U133 Plus 2.0 Array), was
downloaded from the GEO (https://www.ncbi.nlm.nih.gov/geo/) database. It
contained 585 samples, and was divided into 2 groups: the tumor
group consisted of 566 colon cancers, while the normal group
consisted of 19 non-tumoral colorectal mucosa in GEO2R, an R-based
web application (15). The genes
that met the conditions of log2 fold change (logFC) of ≥2 and
P-value <0.05 were considered as DEGs. Then we applied
hierarchical clustering analysis to classify the data in Morpheus
(https://software.broadinstitute.org/morpheus/).
Enrichment analysis of DEGs
Gene Ontology (GO) database (http://www.geneontology.org/) described the facilities
of genes and their products from three distinct biologic aspects:
Biological process (BP), cellular component (CC) and molecular
function (MF) (16). Kyoto
Encyclopedia of Genes and Genomes pathway (KEGG) (http://www.kegg.jp), a comprehensive knowledge
database, plays an important role in both functional interpretation
and practical application of genomic information (17). The DEG list was uploaded to DAVID (v
6.8) to obtain enriched GO terms and significant pathway analysis
with P<0.05.
Assessment of PPI network
STRING database is an online database of known and
predicted protein-protein interactions (PPIs). STRING (version
10.0) includes 9,643,763 proteins from 2,031 living organisms. To
assess the interactions among DEGs, we mapped them to STRING
database and the coactions with a combined score of >0.4 were
considered. Then, the PPI networks were visualized using Cytoscape
software and the modules of DEGs were established by the Molecular
Complex Detection (MCODE) with the concrete selection standards,
which were as follows: MCODE scores >2 and number of nodes
>9. In addition, hub genes were exported. Moreover, the KEGG
pathway enrichment analysis was performed for genes within these
modules separately.
Analysis of expression level of hub
gene in TCGA and Oncomine
To obtain a picture of the hub genes' quality for
further research, we compared the corresponding expression
information using TCGA and Oncomine database. The gene expression
quantification data of colorectal adenocarcinoma were downloaded
from the TCGA database and it consisted of 521 individual data
files, metadata and cart. Then, we obtained the list of DEGs
between 480 colorectal adenocarcinoma and 41 normal samples using
edgeR package (http://www.bioconductor.org/packages/release/bioc/html/edgeR.html)
in R software with the following criteria: logFC ≥1 and P<0.05.
Moreover, we searched the expression profile of the hub genes in
Oncomine database, respectively with the following conditions:
Gene, Cancer vs. Normal Analysis and Colorectal cancer type.
Survival analysis of hub genes
On the basis of the survival prognosis information
of colon cancer patients in GSE39582, we calculated the survival
curves of hub genes using GraphPad Prism version 6.0 (GraphPad
Software, Inc., La Jolla, CA, USA) and P<0.05 was thought to be
significant.
Patients and tissue samples
In terms of the conditions, where high expression of
TRPM6 was linked with a better overall survival (OS), 20
non-selected CRC samples were applied to perform qPCR to validate
the expression difference of TRPM6 in colon cancer and normal colon
mucosa (10 cm away from visible tumor edges). These experimental
samples were collected at the Sir Run Run Shaw Hospital of Zhejiang
University between January 2004 and December 2006. There were 16
males and 4 females (average age, 66.4 years; range, 49–88 years).
The pathological stage was defined according to UICC/AJCC and TNM
classification system (https://www.uicc.org/resources/tnm). The details are
shown in Table I. Each experimental
sample was divided into two parts, one was used for
histopathological evaluation and one for total RNA extraction.
Research was authorized by the Ethics Committee of Sir Run Run Shaw
Hospital and informed consent was obtained from all participating
patients. The reference number was 20180226-88.
 | Table I.Histopathological characteristics of
the CRC patients. |
Table I.
Histopathological characteristics of
the CRC patients.
| Patient | Sex | Age (years) | Location of
tumor | Differentiation
grade | TNM staging | UICC staging |
|---|
| 1 | Male | 88 | Rectum | Well-moderate | T3N2M1 | IV |
| 2 | Female | 64 | Rectum | Well | T3N1M0 | IIIB |
| 3 | Female | 63 | Sigmoid colon | Well-moderate | T3N2M0 | IIIC |
| 4 | Male | 87 | Ileocecal
junction | Moderate | T3N1M0 | IIIB |
| 5 | Female | 56 | Rectum | Moderate | T3N0M0 | IIA |
| 6 | Male | 49 | Rectum | Moderate | T3N2M0 | IIIC |
| 7 | Male | 79 | Rectum | Moderate | T2N0M0 | I |
| 8 | Male | 62 | Rectum | Well | T1N0M0 | I |
| 9 | Female | 54 | Sigmoid colon | Well | T3N0M0 | IIA |
| 10 | Male | 79 | Sigmoid colon | Moderate | T3N1M0 | IIIB |
| 11 | Male | 61 | Sigmoid colon | Well | T3N0M0 | IIA |
| 12 | Male | 50 | Sigmoid colon | Poor | T4N2M0 | IIIC |
| 13 | Male | 64 | Sigmoid colon | Well-moderate | T4N0M0 | IIB |
| 14 | Male | 71 | Sigmoid colon | Moderate | T3N0M0 | IIA |
| 15 | Male | 61 | Ascending
colon | Moderate-poor | T3N1M0 | IIIB |
| 16 | Male | 84 | Ascending
colon | Well-moderate | T3N0M0 | IIA |
| 17 | Male | 59 | Hepatic flexure of
colon | Well-moderate | T3N1M1 | IV |
| 18 | Male | 59 | Ascending
colon | Well-moderate | T3N1M1 | IV |
| 19 | Male | 80 | Ascending
colon | Well | T3N0M0 | IIA |
| 20 | Male | 57 | Ascending
colon | Moderate | T3N0M1 | IV |
qPCR validation of TRPM6
The RNA of tissue samples was extracted using Trizol
reagent (Invitrogen; Thermo Fisher Scientific, Inc., Waltham, MA,
USA) following the manufacturer's instructions. RNA was quantified
by applying a NanoDrop 2000c spectrophotometer (Thermo Fisher
Scientific, Inc., Waltham, MA, USA). cDNA was synthesized using an
RNeasy Mini Kit (Takara, Kyoto, Japan). qPCR analysis was performed
with SYBR Green Master Mix (Takara). qPCR was performed at 95°C for
5 min, 45 cycles of 95°C for 5 sec and 60°C for 30 sec; 1 cycle of
95°C for 5 sec, 60°C for 1 min and 95°C for 15 sec and finally,
50°C for 30 sec. Relative expression was analyzed using the
2−ΔΔCq method (18).
Expression of mRNA was normalized according to β-actin. The primers
used were as follows: β-actin_forward, ACTCTT CCAGCCTTCCTTCC and
β-actin_reverse, CGTCATACTC CTGCTTGCTG; TRPM6_forward, TCCTGTCTGAT
GATGGGACC and TRPM6_reverse, TCTTGAGCGGCAG TGTATTTTC. We designed
the primers on online tools (https://www.genscript.com/tools/real-time-pcr-tagman-primer-design-tool)
and these were synthesized by Shanghai Generay Biotech Co. Ltd.
(Shanghai, China). We validated the specificity of primers with
colon tissue by PCR and then running agarose gel (data not
shown).
Western blotting of TRPM6
Tissue samples were directly extracted with
radioimmunoprecipitation assay (RIPA) lysis buffer combined with
protease inhibitor cocktail to quantify protein expression levels
of TRPM6 and GAPDH. The extracted proteins were prepared and
resolved by 10% SDS-PAGE and then transferred onto PVDF membranes
(Millipore, Billerica, MA, USA). Membranes were blocked by using 5%
dry milk dissolved in TBST. The membranes were then incubated
overnight at 4°C with antibodies against TRPM6 (BBI Life Sciences
Corp., Shanghai, China; 1:1,000 dilution; cat. no. D162419) and
GAPDH (Cell Signaling Technology, Inc., Danvers, MA, USA; 1:1,000
dilution; cat. no. 5174). After washing in Tris-buffered saline
with Tween (TBST), the membranes were incubated for 2 h in
HRP-conjugated secondary antibodies (BBI Life Sciences Corp.;
1:1,0000 dilution; cat. no. D110058-0100,) at room temperature.
Excess secondary antibodies (BBI Life Sciences Corp.; 1:1,0000
dilution; cat. no. D110058-0100) were washed and rinsed off from
the membranes with TBST. Signals were visualized with an enhanced
chemiluminescence kit (Biological Industries, Kibbutz Beth HaEmek,
Israel). GAPDH was used as a loading control.
Identification of differentially
expressed miRNAs (DEMs)
Similar to the extraction of DEGs from TCGA
database, the miRNA expression quantification data of colorectal
adenocarcinoma was downloaded and it consisted of 465 individual
data files, metadata and cart. Then, we obtained some results of
DEMs between 457 colorectal adenocarcinoma and 8 normal samples
using edgeR package with the qualification of logFC ≥1 and P-value
<0.05.
Prediction of regulatory miRNAs of
TRPM6
To locate the regulatory miRNAs of TRPM6 in CRC, we
downloaded the files of Human Good mirSVR score, Conserved miRNA
and Good mirSVR score, Non-conserved miRNAs from miRanda database
(http://www.microrna.org/) to forecast the
relationship between TRPM6 and miRNAs. The results of the TCGA-DEMs
demonstrated intersection elements via the VennDiagram package
(https://cran.r-project.org/web/packages/VennDiagram/index.html)
in R software eventually.
Statistical analysis
qPCR results are presented by the use of Graph Pad
Prism (version 6.0; GraphPad Software, Inc., La Jolla, CA, USA).
Data are presented as the mean ± standard error of the mean.
Independent samples t-test was performed for data comparison.
P<0.05 was considered to indicate a statistically significant
difference.
Results
An overview of the expression levels
of the DEGs
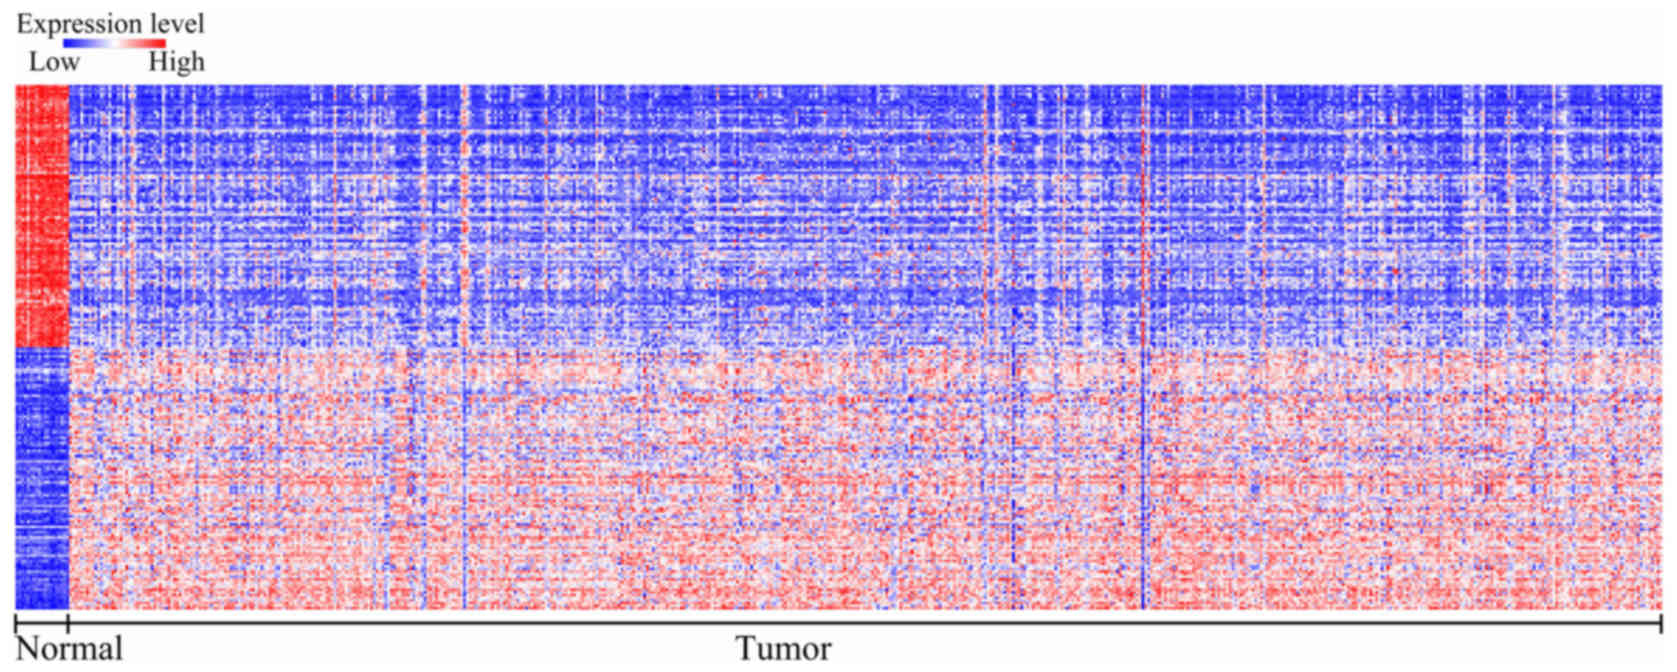
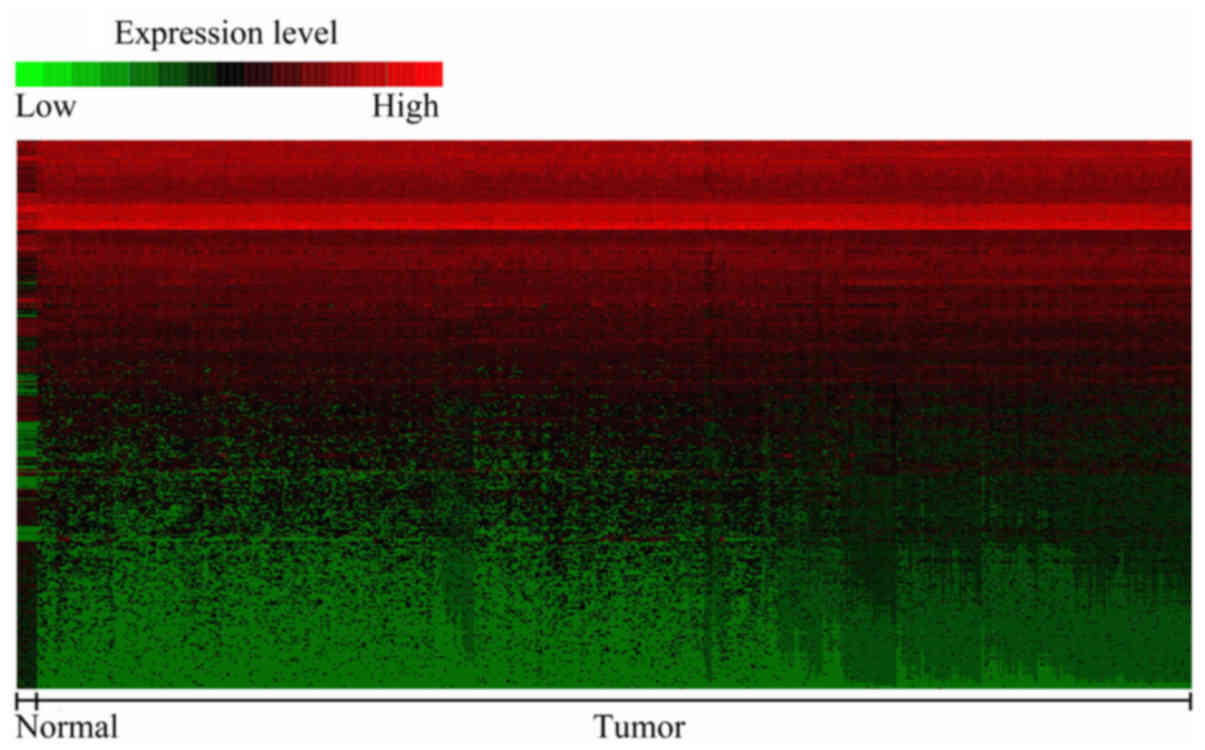
To identify the gene signatures during the
development of CRC, we compared the expression profiling of the
array between colon cancer and non-tumoral mucosae using GEO2R. A
total of 439 DEGs were found to play a role in carcinogenesis with
P<0.05 and logFC ≥2.0 criteria, and top 50 genes were
upregulated and downregulated, which was shown in heat map format
performed in Morpheus (https://software.broadinstitute.org/morpheus/)
(Fig. 1). These results indicated
that colon cancer carcinogenesis is a complex multi-factorial
process, which involves several genes.
DEGs are involved in CRC-associated
molecular processes
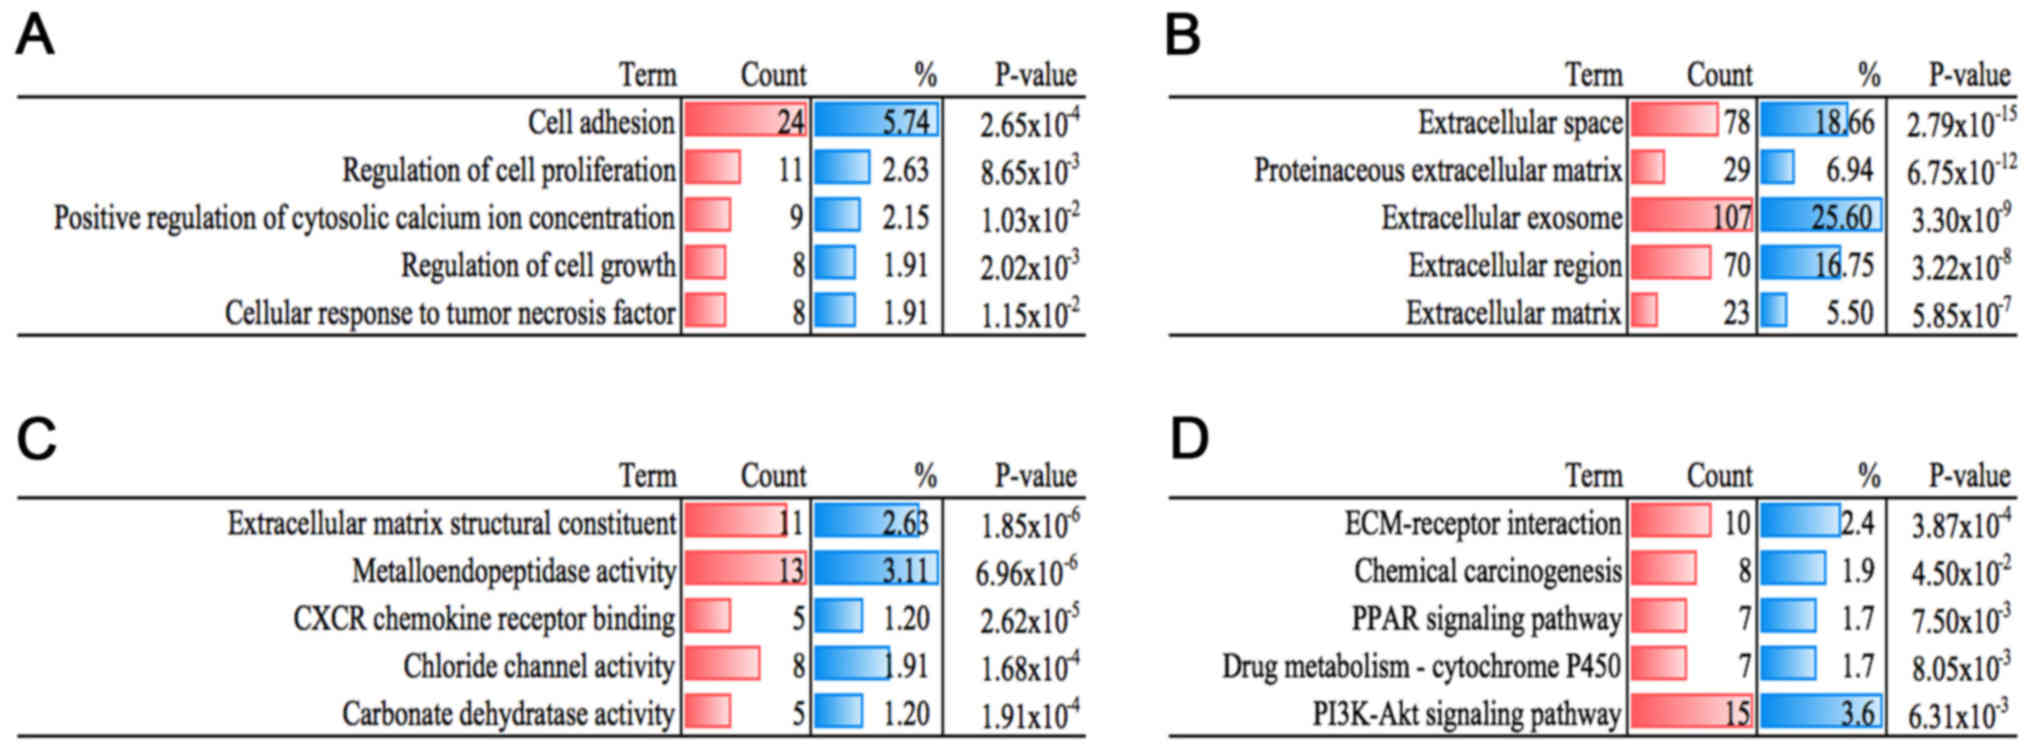
To further investigate the potential mechanisms, we
uploaded all the DEGs to DAVID, and then GO functional annotation
and KEGG pathway enrichment analyses were conducted separately. As
shown in Fig. 2A, many biological
processes, such as cellular response to tumor necrosis factor
(TNF), regulation of cell proliferation, positive regulation of
cytosolic calcium ion concentration, cell adhesion and regulation
of cell growth were identified. Additionally, the results of CC and
MF are displayed in Fig. 2B and C.
As for the KEGG results, DEGs were found to be involved in pathways
including chemical carcinogenesis, ECM-receptor interaction,
phosphatidylinositol 3-kinase (PI3K)-Akt signaling pathway,
chemical carcinogenesis, peroxisome proliferator-activated receptor
(PPAR) signaling pathway and drug metabolism-cytochrome P450
(Fig. 2D). These results showed
that the DEGs were closely related to cancer and warranted
identification.
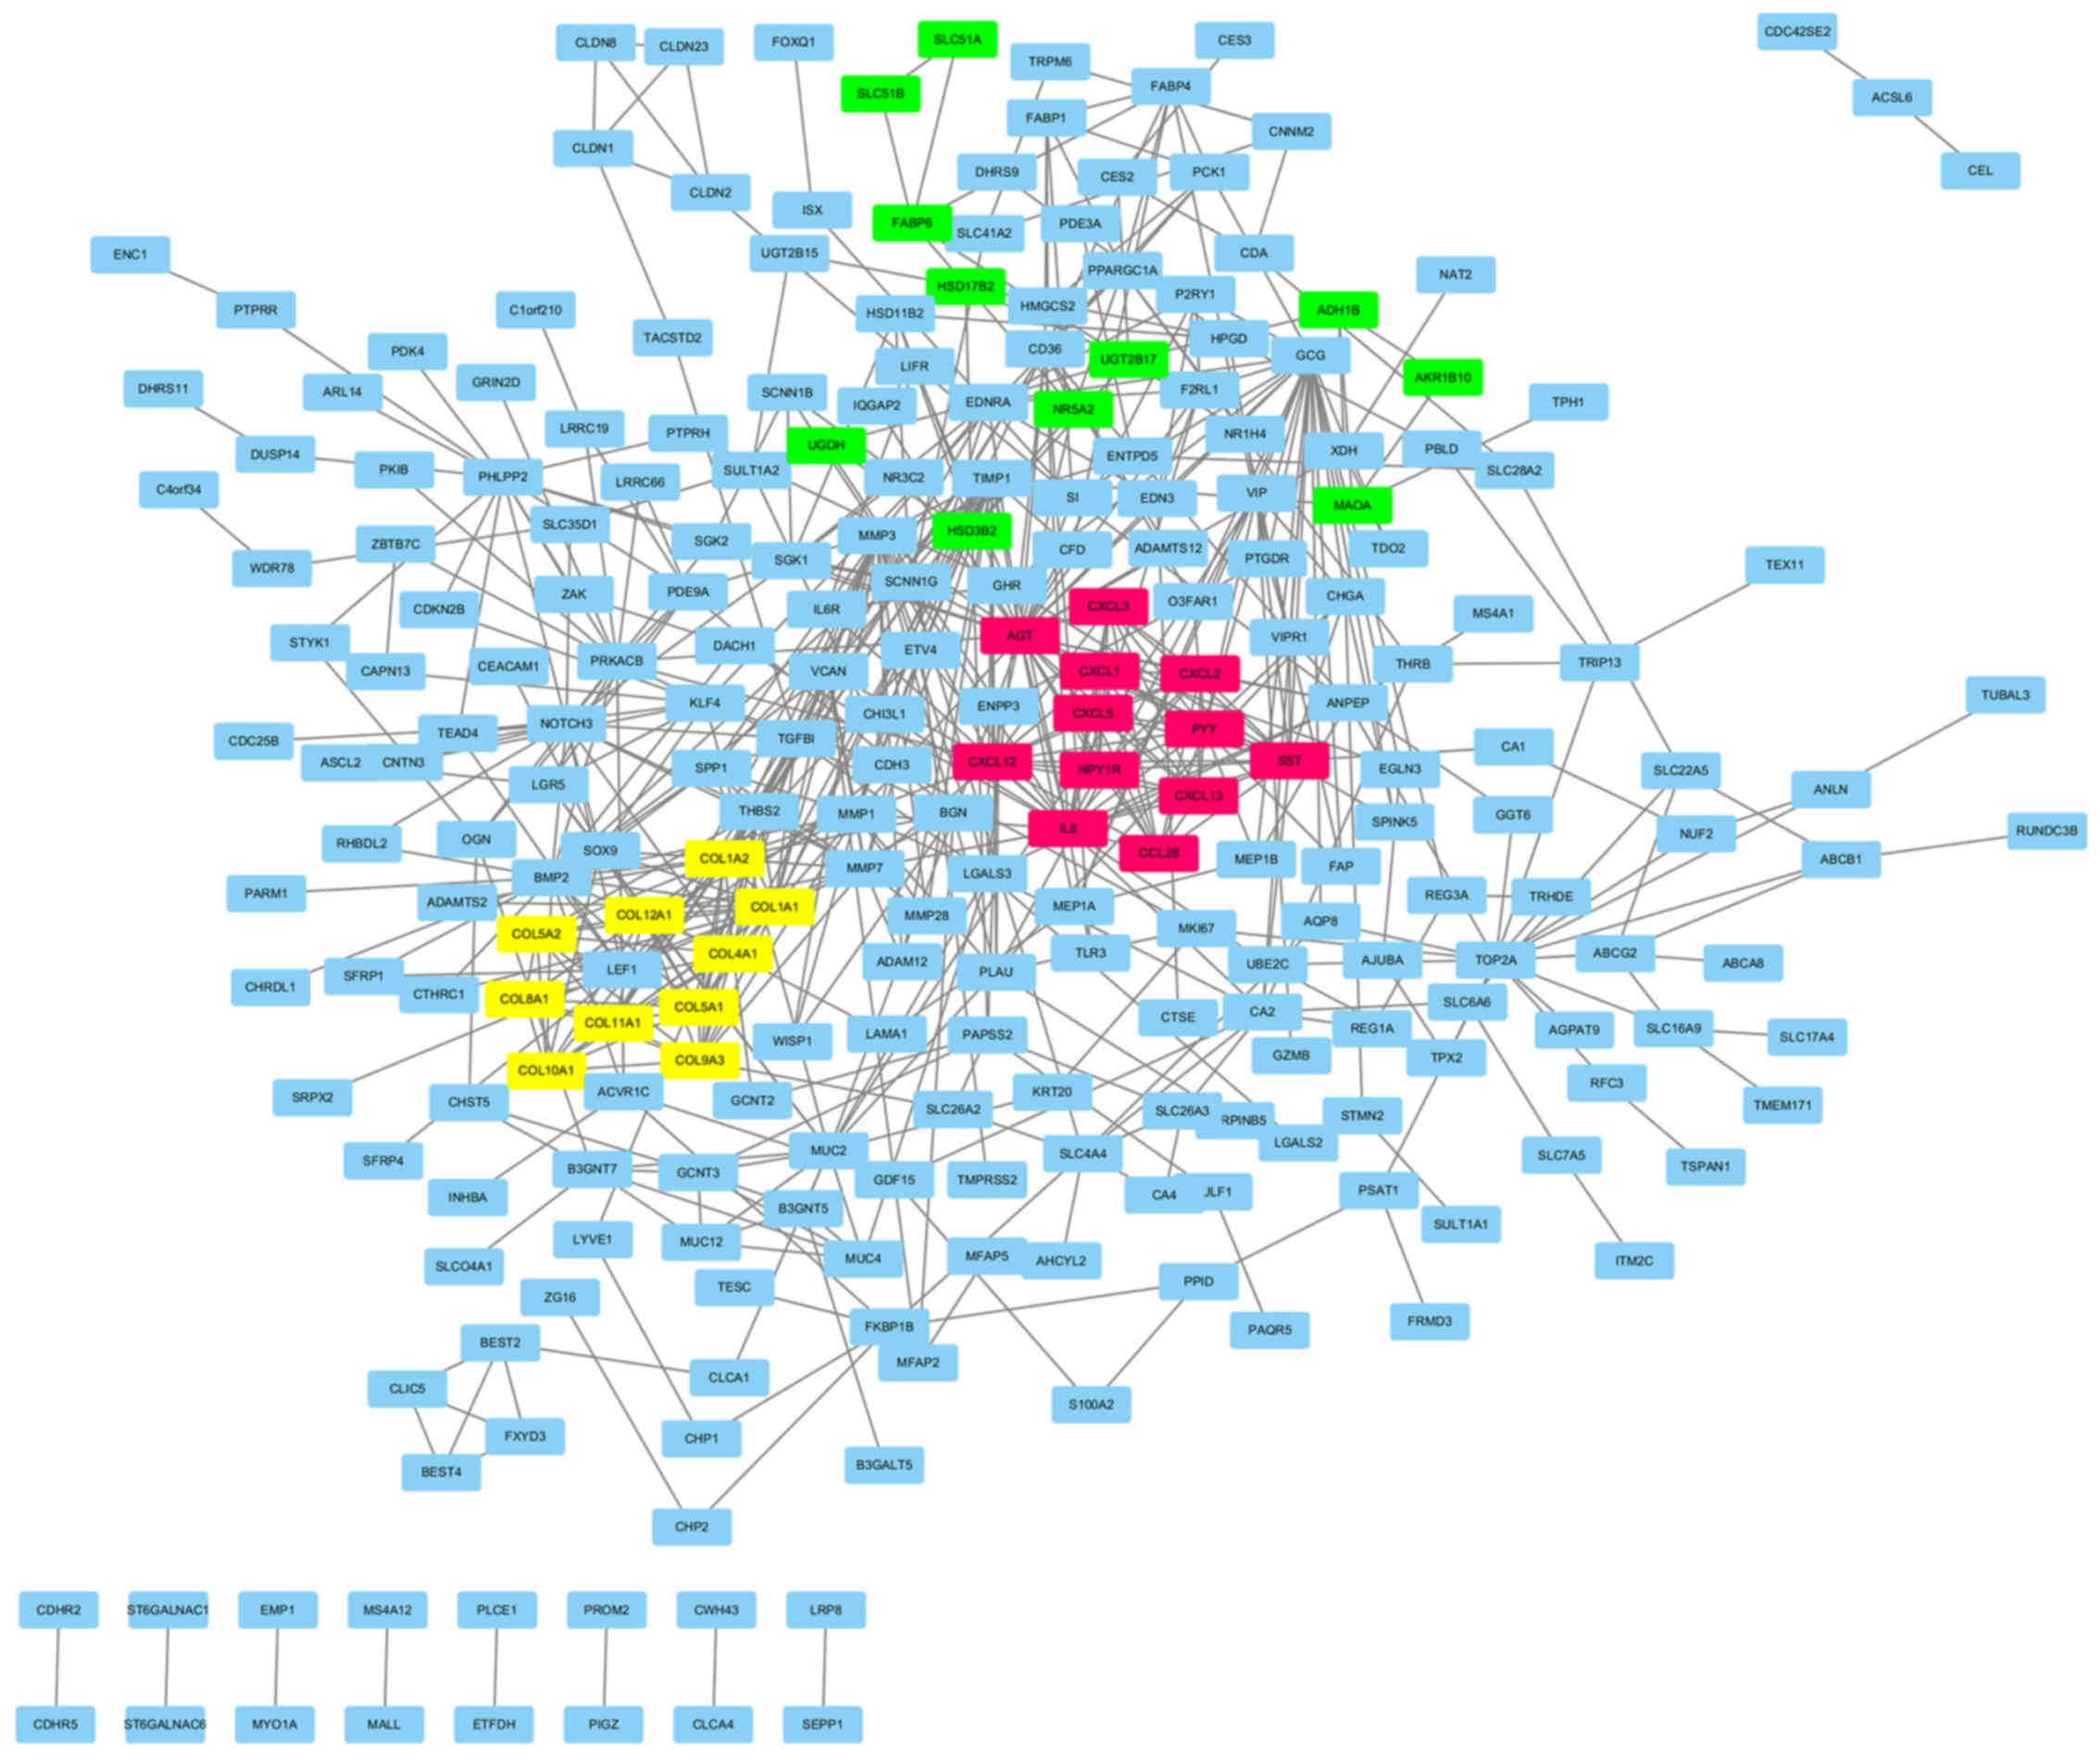
Key modules and genes were screened
out from the PPI network
The PPI network was constructed by the Search Tool
for the Retrieval of Interacting Genes (STRING, version 10.0). The
network consisted of 624 edges and 401 nodes (Fig. 3). To facilitate our understanding of
DEGs, we visualized the network in the Cytoscape software and
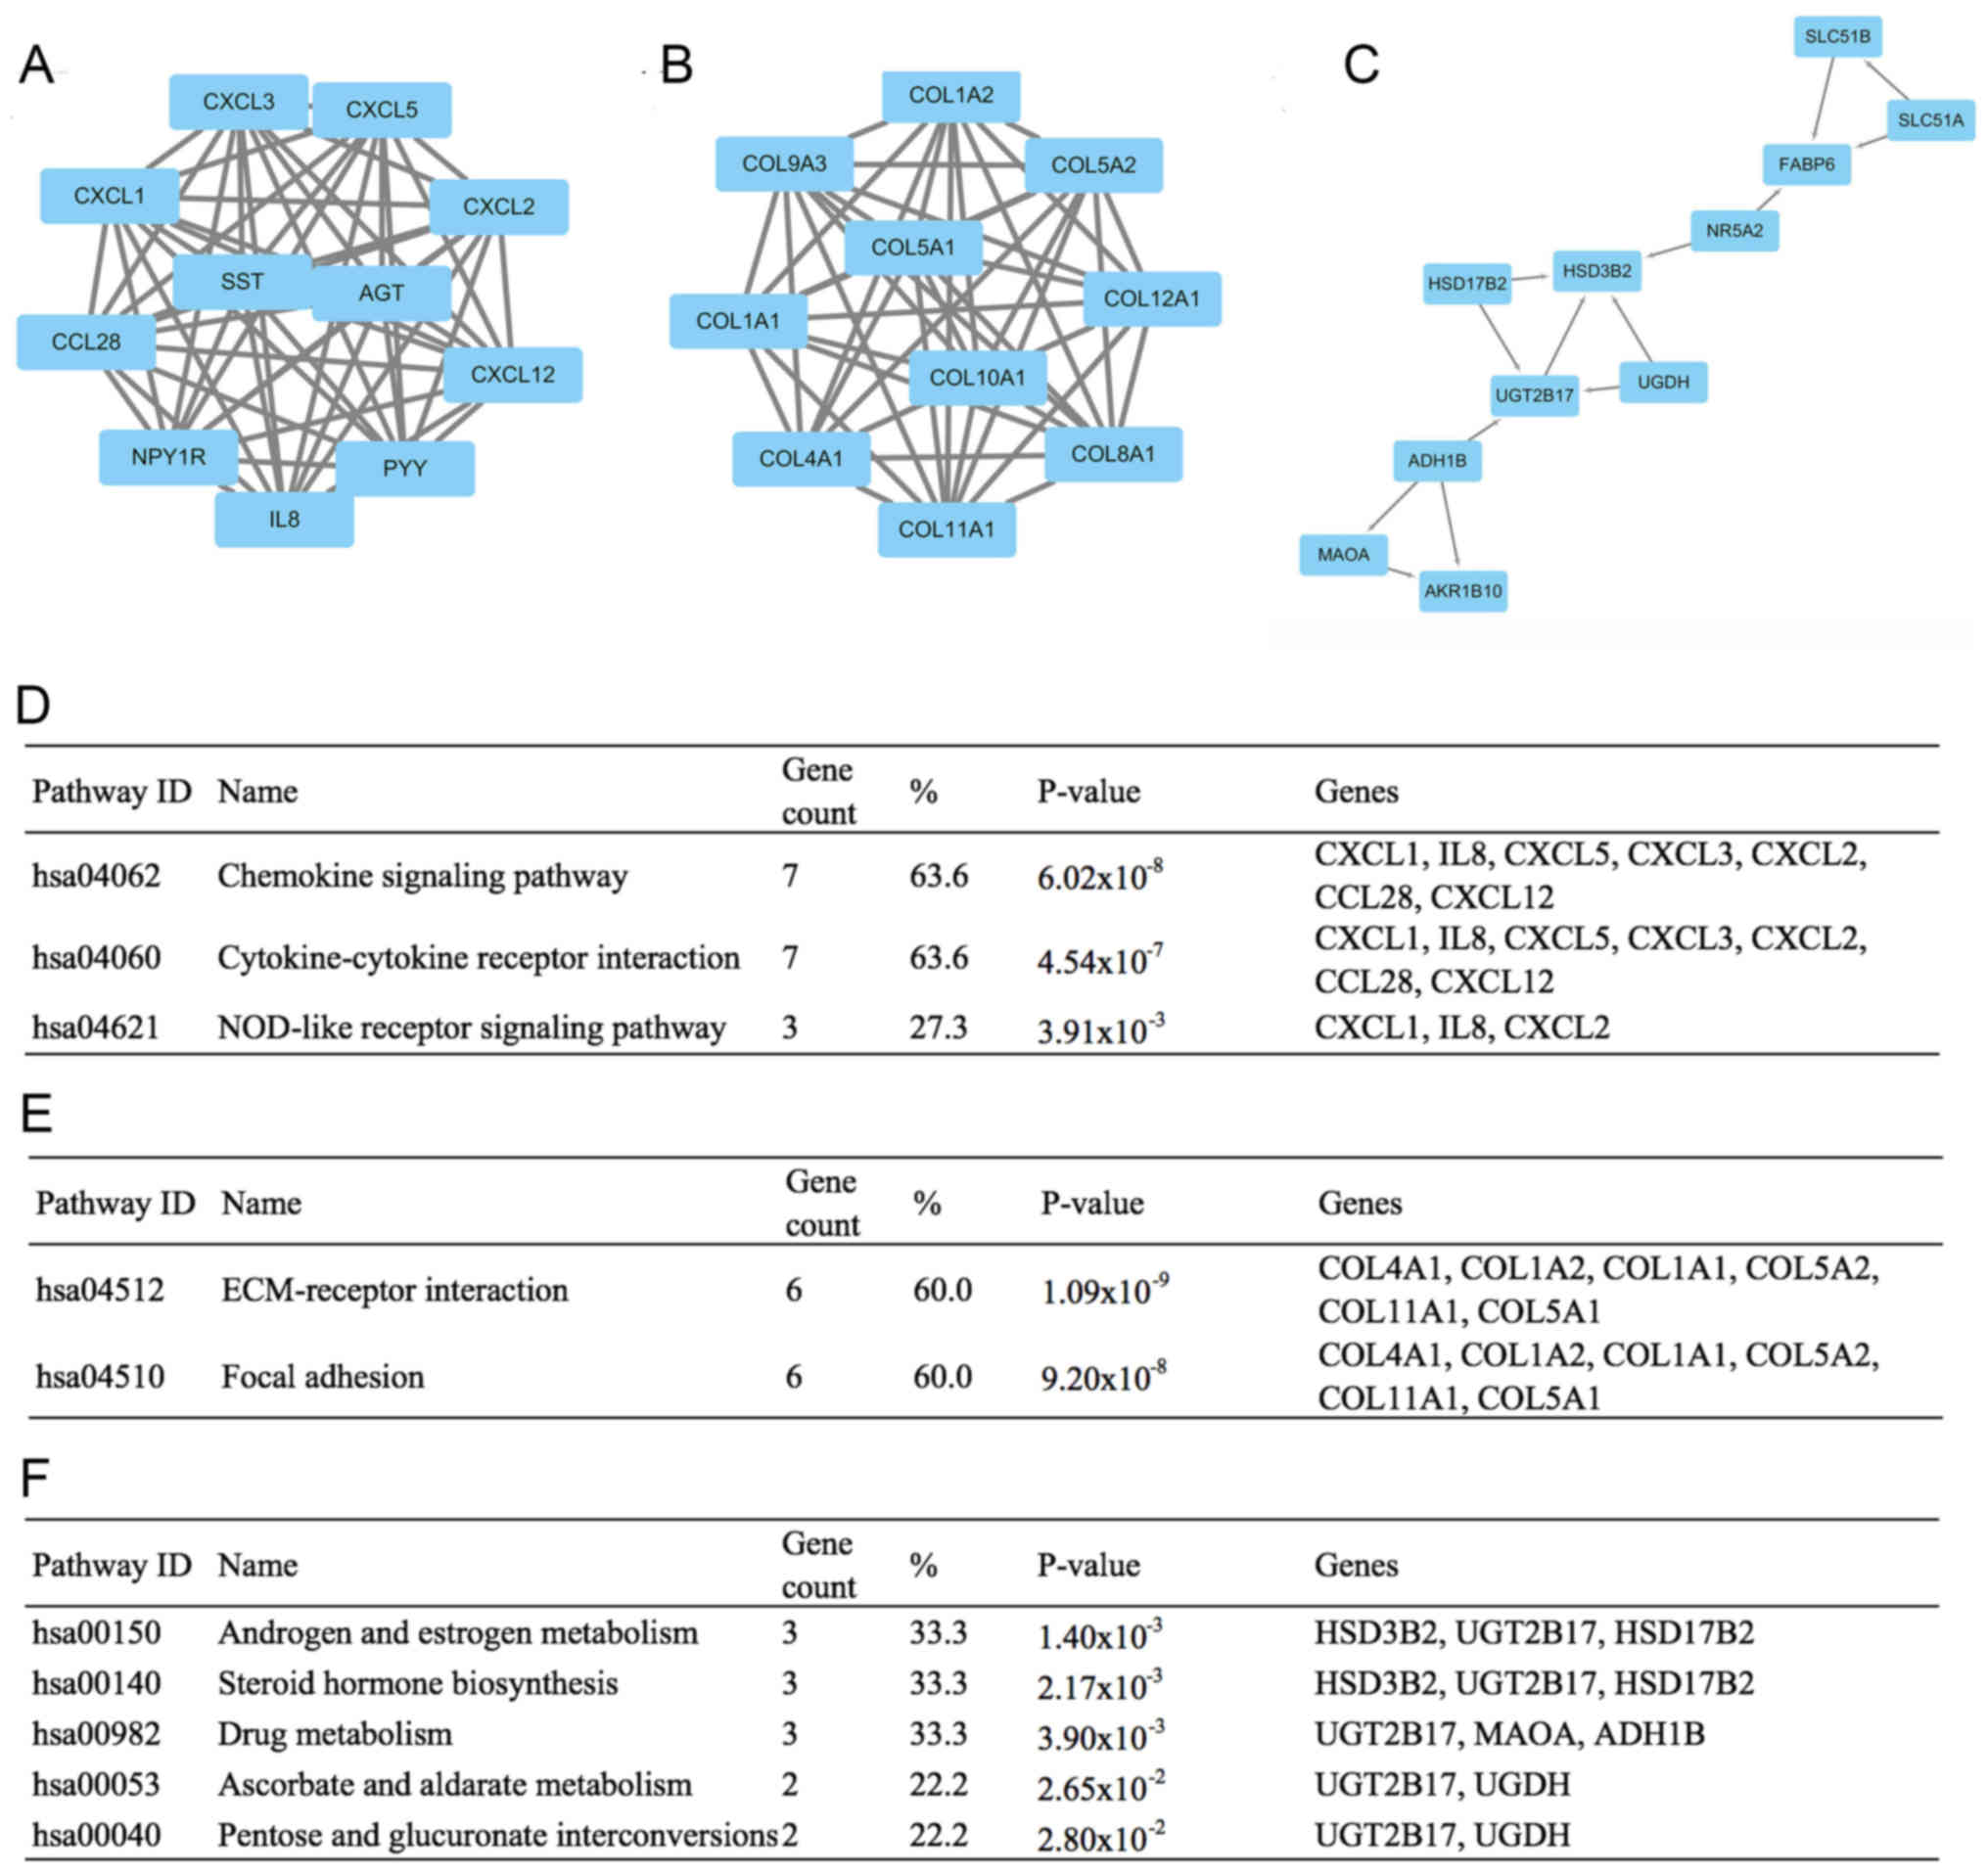
modularized it using plug-in MCODE. The results showed that these
modules were mainly correlated with the chemokine signaling
pathway, ECM-receptor interaction and androgen and estrogen
metabolism (Fig. 4).
Moreover, the top 10 hub nodes with higher degrees
were screened out, which included the upregulated genes that
secreted protein acidic and rich in cysteine (SPARC), C-X-C motif
chemokine ligand 3 (CXCL3), collagen, type IX, α3 (COL9A3), fatty
acid binding protein 1 (FABP1), claudin-2 (CLDN2), and
downregulated genes carbonic anhydrase IV (CA4), chromogranin A
(CHGA), aldo-keto reductase family 1, member B10 (AKR1B10),
transient receptor potential cation channel, subfamily M, member 6
(TRPM6) and FXYD domain containing ion transport regulator 3
(FXYD3) (Table II).
| Table II.Key differentially expressed genes
(DEGs) obtained from the GSE39582 dataset. |
Table II.
Key differentially expressed genes
(DEGs) obtained from the GSE39582 dataset.
| Gene symbol | LogFC | P-value |
|---|
| SPARC | 2.00 | 9.76
×10−19 |
| CA4 | −5.45 | 2.81
×10−40 |
| CXCL3 | 2.36 | 3.51
×10−13 |
| COL9A3 | 2.06 | 1.54
×10−11 |
| FABP1 | 2.21 | 7.88
×10−12 |
| CHGA | −2.34 | 7.96
×10−29 |
| CLDN2 | 2.29 | 9.07
×10−10 |
| AKR1B10 | −4.44 | 3.29
×10−24 |
| TRPM6 | −1.50 | 3.02
×10−10 |
| FXYD3 | −2.21 | 6.78
×10−22 |
Comparison of expression data of the
hub genes
To guarantee that the selected hub genes were
credible, we analyzed their expression levels between colon cancer
and normal tissues in TCGA and Oncomine. Expression levels of all
the genes but FABP1 were consistent in these 3 different databases
(Fig. 5 and Table III).
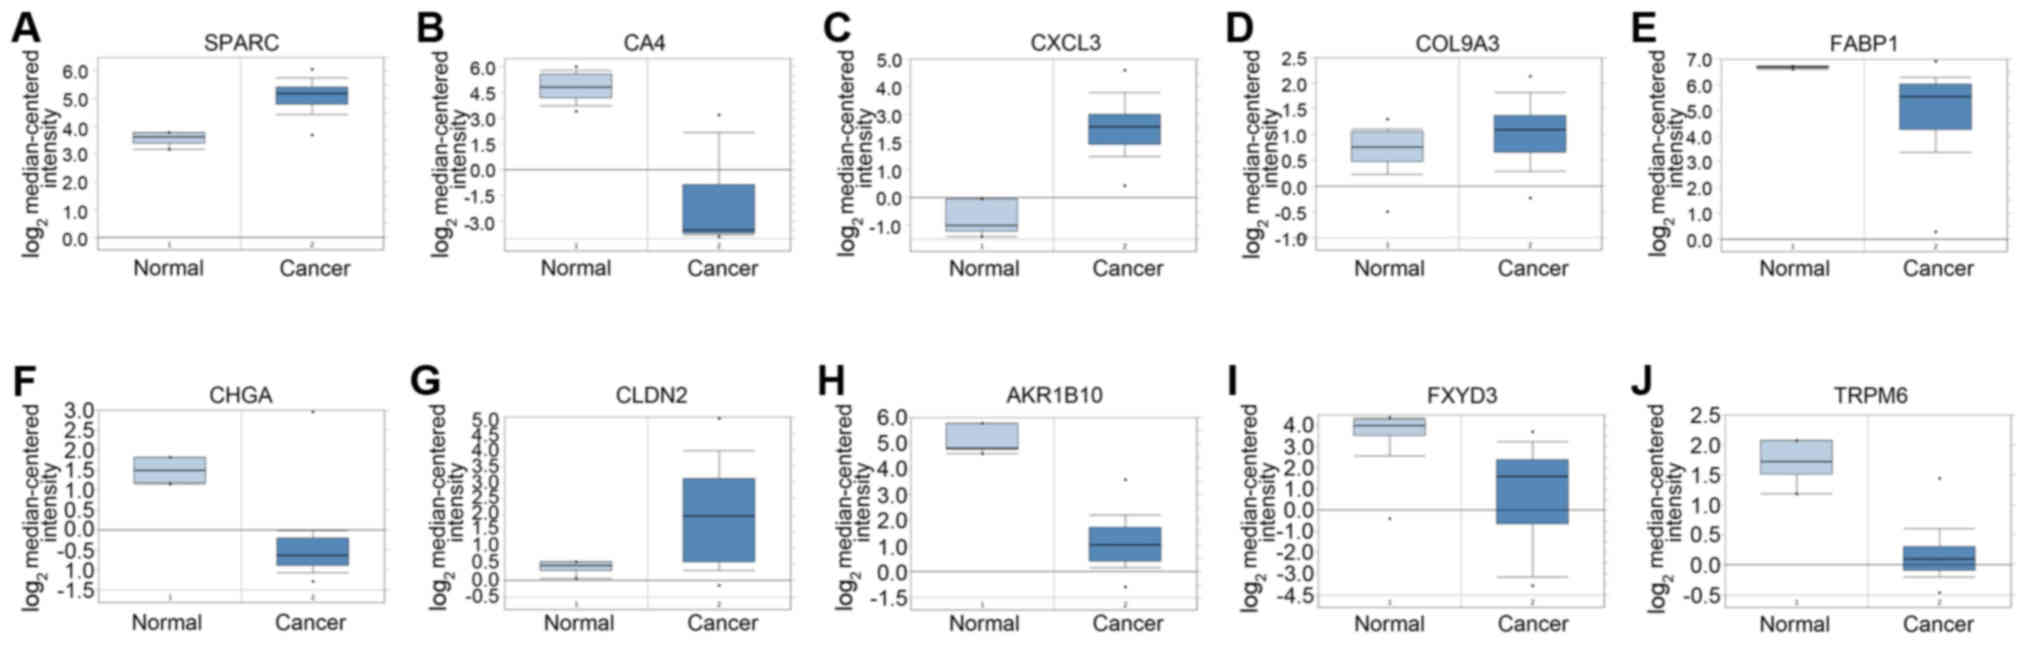 | Figure 5.The expression of 10 hub genes in
Oncomine database between colorectal adenocarcinoma and normal
colon tissue. In order to verify the reliability of hub genes, such
as (A) secreted protein acidic and rich in cysteine (SPARC),
(B) carbonic anhydrase IV (CA4), (C) C-X-C motif chemokine
ligand 3 (CXCL3), (D) collagen, type IX, α3 (COL9A3),
(E) fatty acid binding protein 1 (FABP1), (F) chromogranin A
(CHGA), (G) claudin-2 (CLDN2), (H) aldo-keto
reductase family 1, member B10 (AKR1B10), (I) transient
receptor potential cation channel, subfamily M, member 6
(TRPM6) and (J) FXYD domain containing ion transport
regulator 3 (FXYD3), the expression of these genes was
searched in Oncomine with the filter of Gene, Cancer vs. Normal
Analysis and Colorectal cancer type. The results showed that all
genes, except FABP1, had the same expression difference in the two
groups with P<0.05. |
| Table III.Expression of hub genes in DEGs from
the TCGA database. |
Table III.
Expression of hub genes in DEGs from
the TCGA database.
| Gene symbol | LogFC | P-value |
|---|
| SPARC | 1.47 | 6.24
×10−14 |
| CA4 | −5.12 | 1.39
×10−80 |
| CXCL3 | 3.01 | 5.42
×10−28 |
| COL9A3 | 3.18 | 2.57
×10−15 |
| FABP1 | −2.78 | 1.73
×10−33 |
| CHGA | −4.54 |
2.44×10−60 |
| CLDN2 | 5.49 | 2.50
×10−30 |
| AKR1B10 | −3.04 | 9.81
×10−44 |
| TRPM6 | −4.26 | 2.00
×10−122 |
| FXYD3 | −1.45 | 1.33
×10−22 |
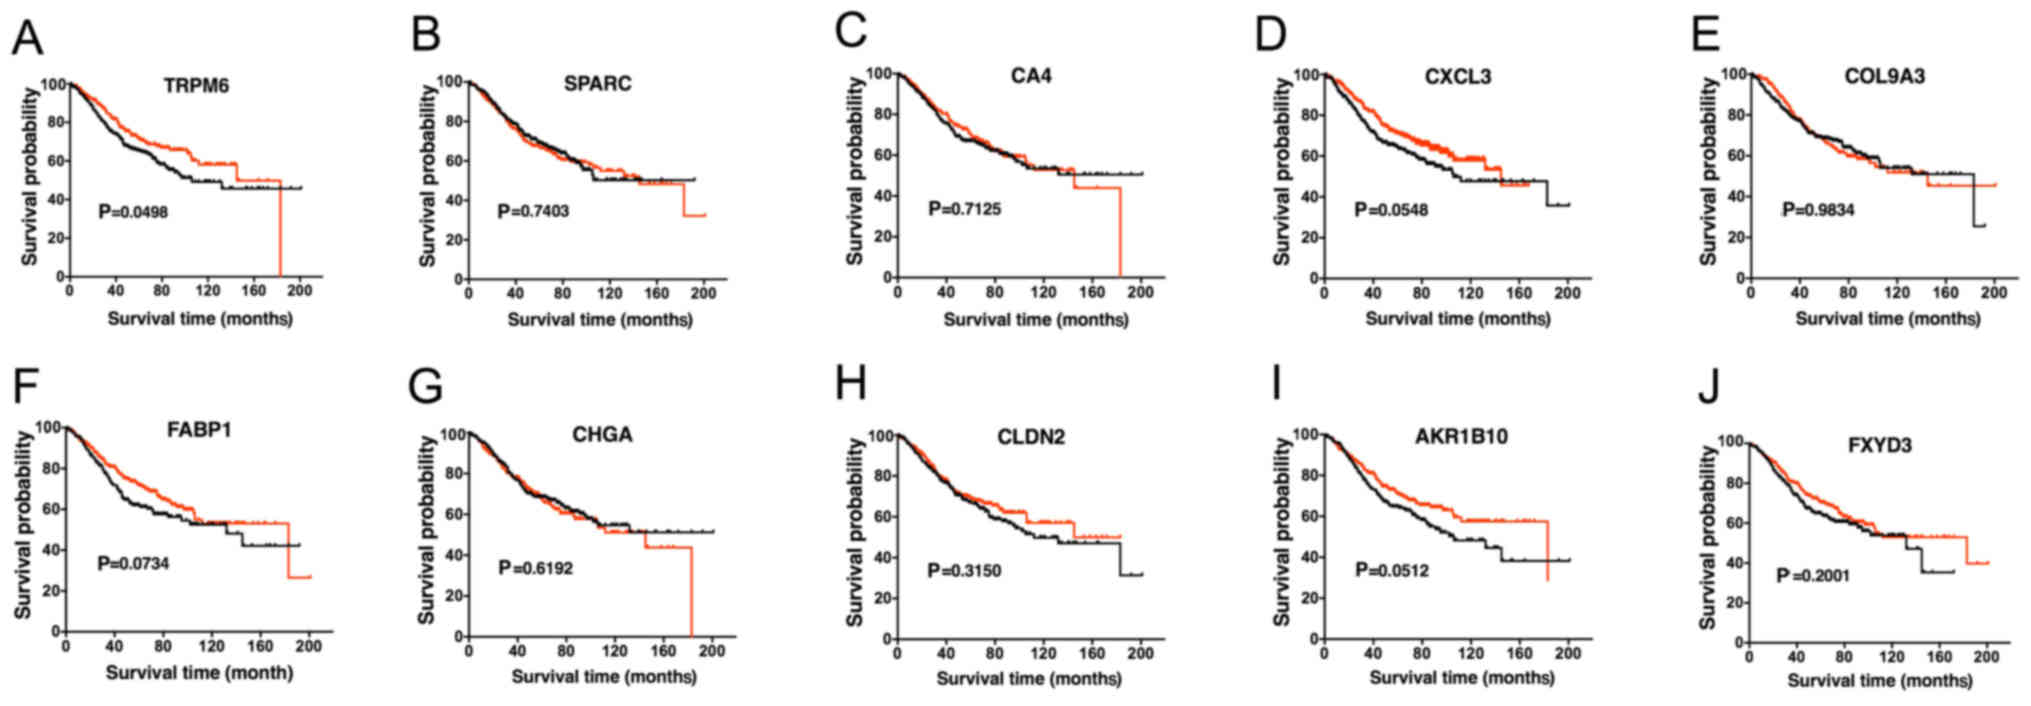
Analysis of the hub genes
Next, we further investigated the prognostic value
of these genes. Survival curve was calculated according to the
prognostic data of the patients. High expression of TRPM6
demonstrated a higher overall survival (OS) rate (Fig. 6A). In addition, the remaining hub
genes were independent of OS (Fig.
6B-K). In this way, we exclusively focused on the abnormality
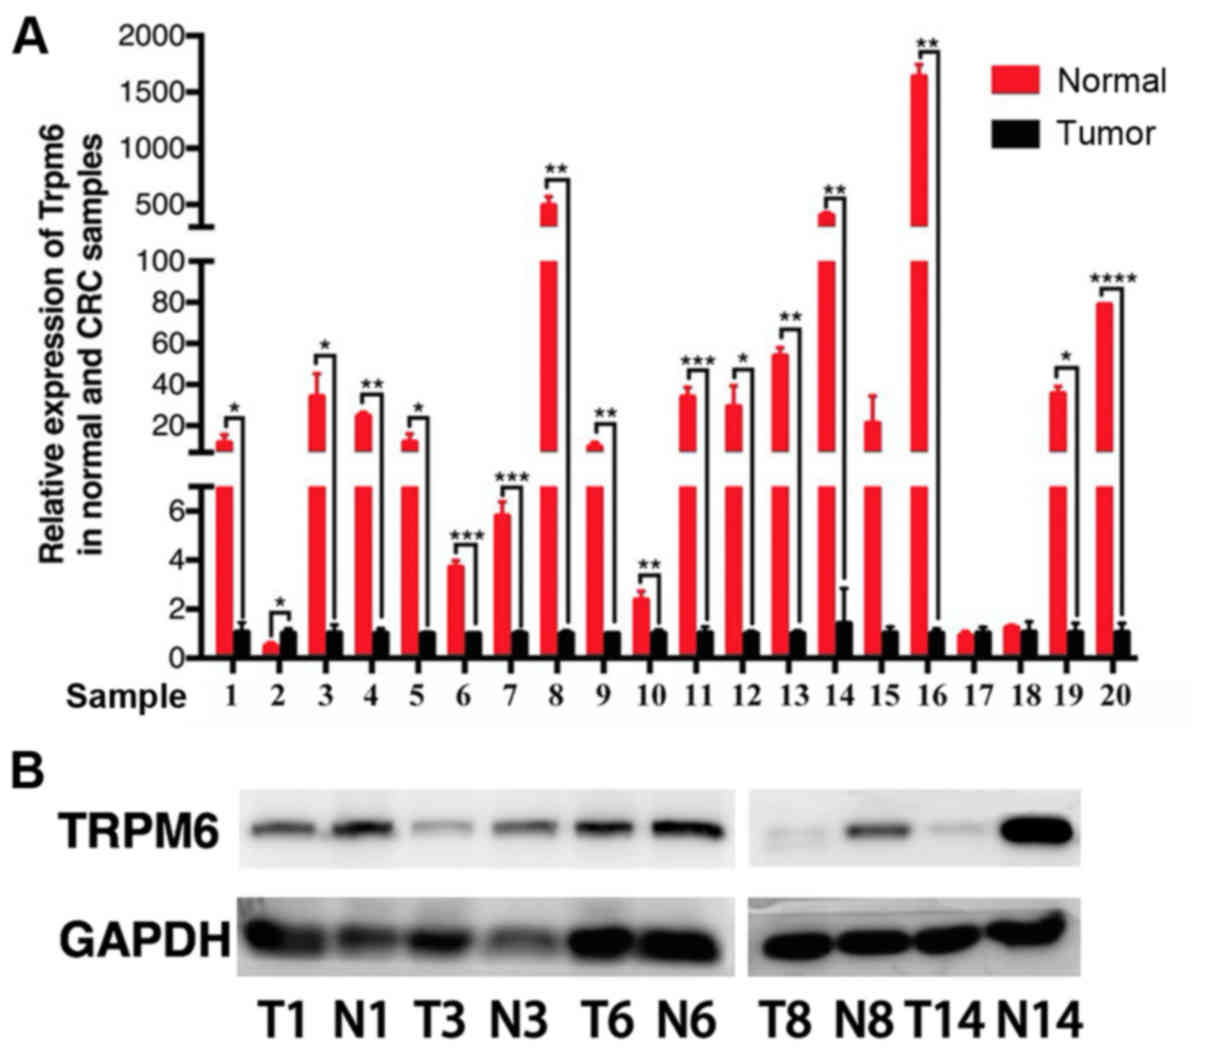
of TRPM6, which was slightly reported previously in CRC. We
verified its expression level in clinical specimens by conducting
qPCR and western blotting experiments (Fig. 7).
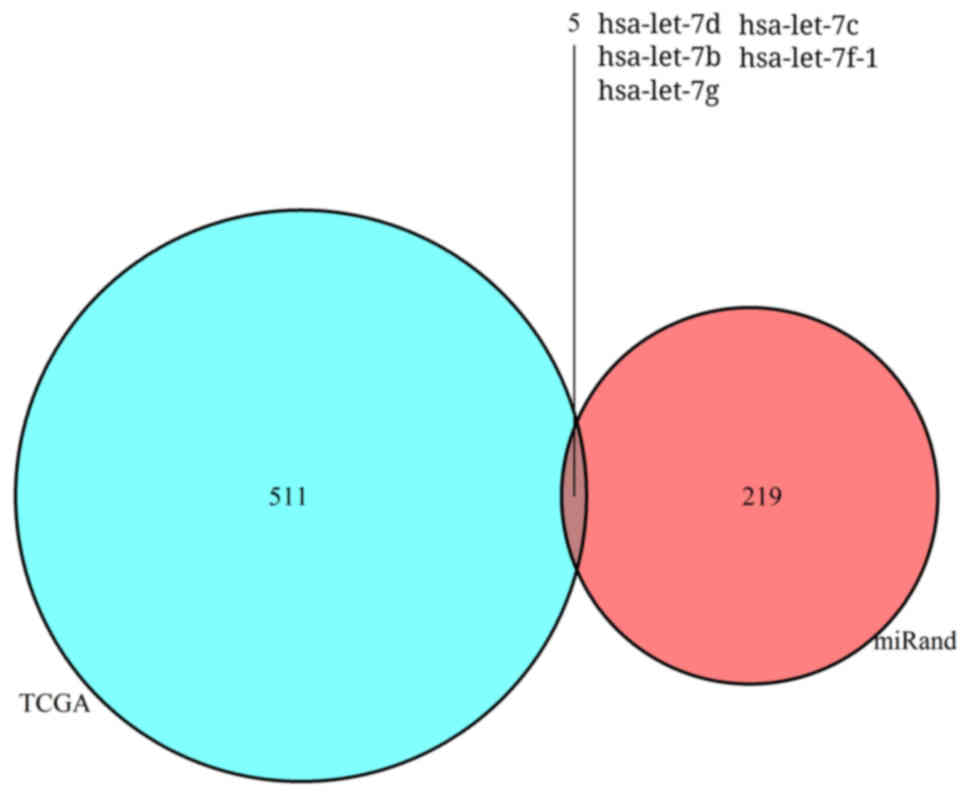
Hub gene TRPM6 may be targeted by hsa-let-7g and
hsa-let-7f-1. Owing to the significance of miRNAs in various
diseases and their function in suppressing the translation of
mRNAs, we analyzed DEMs between colon cancer and normal colon
mucosa in TCGA. Compared with normal colon mucosa, 516 DEMs were
identified in the colon adenocarcinoma group (Fig. 8). In addition, miRanda database was
used to predict the regulatory miRNAs of TRPM6. The results showed
that a total of 5 miRNAs were related with TRPM6 through the
intersection of the results of TCGA and miRanda (Fig. 9 and Table IV). TRPM6 was downregulated in
colon cancer, and hsa-let-7g and hsa-let-7f-1, which were
upregulated in colon cancer, were predicted to be the key
regulatory miRNAs of TRPM6.
| Table IV.Regulatory microRNAs (miRNAs) of
TRPM6 in colon cancer. |
Table IV.
Regulatory microRNAs (miRNAs) of
TRPM6 in colon cancer.
| miRNA | LogFC | P-value |
|---|
| hsa-let-7d | −2.81 | 1.70
×10−5 |
| hsa-let-7b | −2.66 | 3.90
×10−58 |
| hsa-let-7g | 2.07 | 1.41
×10−17 |
| hsa-let-7f-1 | 4.45 | 1.31
×10−10 |
| hsa-let-7c | −1.40 | 1.08 ×
10−3 |
Discussion
In the present study, we explored the vital genes
and their miRNAs in the development of CRC, which could enhance our
insight of potential molecular mechanisms and benefit diagnosis,
treatment and prognosis of the disease. In order to search the
tumorigenesis-associated DEGs, we analyzed the gene expression
profiling of GSE39582 with GEO2R and further identified 10 hub
genes in 439 DEGs by Cytoscape software, which was tested by TCGA
and Oncomine database. In terms of the prognostic value of TRPM6,
qPCR was conducted in 20 paired colon mucosae samples to validate
its role in diagnosis and prognosis of the disease. Moreover, the
regulatory miRNAs of TRPM6 were predicted by TCGA and miRanda
database. Combined with GO, KEGG and module analysis, our results
showed that TRPM6 and other hub genes may play a critical role in
the development of CRC. In order to further understand CRC, we
innovatively and exclusively focused on the 10 hub genes and two
miRNAs, hsa-let-7g and hsa-let-7f-1.
SPARC, CA4, CXCL3, FABP1, CLDN2, AKR1B10 and
FXYD3 have previously been reported as genes that are
tightly involved in the development of CRC (19–26).
COL9A3, CHGA, and TRPM6 have been rarely studied and reported, but
which may provide novel insight into the research of CRC. COL9A3
expression was intensely correlated with the expression of SOX10, a
sensitive diagnostic marker for both salivary adenoid cystic
carcinoma and basal-like breast carcinoma (27). CHGA, a biomarker in neuroendocrine
tumors (NETs) (28), was
downregulated in colon cancer tissues in this study. The accurate
roles of these two genes, COL9A3 and CHGA, remain
unclear in CRC.
TRPM6, a gene that belongs to the Transient
receptor potential melastatin (TRPM) subfamily, is involved in the
physiology of Mg2+ handling, which we exclusively
focused on in our study. It was reported that TRPM6 mutations are
associated with hypomagnesemia and downregulation of TRPM6 could
result in hypomagnesemia (29).
Magnesium plays a role in modulating cellular biochemical
reactions, such as differentiation, proliferation, apoptosis and
migration (30). Many studies have
confirmed that hypomagnesemia could promote tumor metastasis
(31,32). To date, few reports have discussed
the role of TRPM6 in tumors. We found that the upregulation of
TRPM6 was associated with prolonged OS in patients, although the
survival analysis (P=0.0498) was marginally significant.
Considering the limited sample sizes and that only TRPM6 was
statistically significant under the same grouping condition, we
hypothesized that the level of TRPM6 expression was related to the
survival and prognosis of colon cancer patients. Then we tested the
mRNA expression level of TRPM6 in patient samples using qPCR. The
results revealed that 80% samples showed decreased expression of
TRPM6 in colon cancer samples compared with their paired normal
tissues. Therefore, we considered TRPM6 as a promising biomarker of
tumorigenesis and a treatment target in CRC patients, although the
mechanisms of TRPM6 in CRC are still not completely clear. We did
not examine expression of all hub genes in the colon cancer samples
by qPCR and western blotting and this was a limitation of the
study. We assumed that the expression trends of the other hub genes
should be in accordance with the results (Tables II and III) based on previous analysis and
reports from other investigators (19–26),
which need to be experimentally verified in further research.
Hsa-let-7g, a member of the let-7 family playing a
vital role in tumorigenesis, was demonstrated to dramatically
inhibit the proliferation of hepatocellular carcinoma by
downregulating the expression of the oncogene, c-Myc, and
upregulating the expression of anti-oncogene, p16(INK4A) (33). Moreover, hsa-let-7g was found to
participate in the process of the regulation of autophagy and
apoptosis by modulating LOX-1 in vascular smooth muscle cells
(34), and an apoptosis-promoting
function was also observed in gastric cancer. The relationship
between hsa-let-7g and TRPM6 was not validated, but its
high-expression trend in colon cancer increased the possibility of
the prediction. Similarly, hsa-let-7f-1 is also a member of let-7
family, but research concerning hsa-let-7f-is limited. According to
a previous study (35),
hsa-let-7f-1 is involved in the Notch signaling pathway, which is
closely associated with the development of CRC (36,37).
The role of hsa-let-7f-1 and the evidence of the regulatory
relationship between hsa-let-7f-1 and TRPM6 should be further
elucidated.
In summary, we identified 439 DEGs and 516 DEMs
using GEO and the TCGA database between colon cancer and normal
colon mucosa. Many of these DEGs, such as SPARC, CA4, CXCL3, FABP1,
CLDN2, AKR1B10, FXYD3, COL9A3, CHGA, TRPM6, hsa-let-7g and
hsa-let-7f-1, were predicted to be vital molecules related to CRC
tumorigenesis. We also analyzed the GSE39582 dataset and found the
DEGs of right vs. left colon cancer were not relevant with our hub
genes in this study (data not shown). There are also some
limitations to our study. For instance, 20 pairs of samples were
still not enough and we still have to further verify the expression
level of TRPM6 using more samples. We also did not detect the
mutations of TRPM6 and confirm the relationship between the
mutations and the decreased expression of TRPM6 in colon cancer. In
general, our research provides a series of promising targets for
diagnosis, treatment and prognosis and provides insight for further
investigation into the potential underlying mechanisms.
Acknowledgements
The study represents partial fulfillment of the
requirements for a Doctor degree for Dr Binbin Xie.
Funding
The present study was supported by the National
Natural Science Foundation of China (grant nos. 81572592, 81772543,
81572361), the Zhejiang Natural Sciences Foundation Grant
(LY15H160025, LQ16H160003), the Zhejiang Province Preeminence Youth
Fund (LR16H160001), the Zhejiang Medical Innovative Discipline
Construction Project-2016, and the Hangzhou Health and Family
Planning Commission Fund (2014A61).
Availability of data and materials
The datasets analyzed during the current study are
available from the corresponding author on reasonable request.
Authors' contributions
BX, RZ and BB designed the study and drafted the
manuscript. BX, YW, YX and SL carried out the experiments. XZ, ZW
and YF participated in the statistical analysis of the data. EPM,
WH and HP are responsible for the revision of the manuscript and
were also involved in the conception of the study. All authors read
and approved the manuscript and agree to be accountable for all
aspects of the research in ensuring that the accuracy or integrity
of any part of the work are appropriately investigated and
resolved.
Ethics approval and consent to
participate
Research was authorized by the Ethics Committee of
Sir Run Run Shaw Hospital and informed consent was obtained from
all participating patients. The reference no. was 20180226-88.
Patient consent for publication
Not applicable.
Competing interests
The authors declare that they have no competing
interests.
References
|
1
|
Arnold M, Sierra MS, Laversanne M,
Soerjomataram I, Jemal A and Bray F: Global patterns and trends in
colorectal cancer incidence and mortality. Gut. 66:683–691. 2017.
View Article : Google Scholar : PubMed/NCBI
|
|
2
|
Siegel RL, Miller KD, Fedewa SA, Ahnen DJ,
Meester RGS, Barzi A and Jemal A: Colorectal cancer statistics,
2017. CA Cancer J Clin. 67:177–193. 2017. View Article : Google Scholar : PubMed/NCBI
|
|
3
|
Aran V, Victorino AP, Thuler LC and
Ferreira CG: Colorectal cancer: Epidemiology, disease mechanisms
and interventions to reduce onset and mortality. Clin Colorectal
Cancer. 15:195–203. 2016. View Article : Google Scholar : PubMed/NCBI
|
|
4
|
Hollstein M, Sidransky D, Vogelstein B and
Harris CC: p53 mutations in human cancers. Science. 253:49–53.
1991. View Article : Google Scholar : PubMed/NCBI
|
|
5
|
Herman JG, Umar A, Polyak K, Graff JR,
Ahuja N, Issa JP, Markowitz S, Willson JK, Hamilton SR, Kinzler KW,
et al: Incidence and functional consequences of hMLH1 promoter
hypermethylation in colorectal carcinoma. Proc Natl Acad Sci USA.
95:6870–6875. 1998. View Article : Google Scholar : PubMed/NCBI
|
|
6
|
Reya T and Clevers H: Wnt signalling in
stem cells and cancer. Nature. 434:843–850. 2005. View Article : Google Scholar : PubMed/NCBI
|
|
7
|
Brenner H, Kloor M and Pox CP: Colorectal
cancer. Lancet. 383:1490–1502. 2014. View Article : Google Scholar : PubMed/NCBI
|
|
8
|
Wierzbicki PM and Rybarczyk A: The Hippo
pathway in colorectal cancer. Folia Histochem Cytobiol. 53:105–119.
2015. View Article : Google Scholar : PubMed/NCBI
|
|
9
|
Papadatos-Pastos D, Rabbie R, Ross P and
Sarker D: The role of the PI3K pathway in colorectal cancer. Crit
Rev Oncol Hematol. 94:18–30. 2015. View Article : Google Scholar : PubMed/NCBI
|
|
10
|
Anastas JN and Moon RT: WNT signalling
pathways as therapeutic targets in cancer. Nat Rev Cancer.
13:11–26. 2013. View
Article : Google Scholar : PubMed/NCBI
|
|
11
|
Asangani IA, Rasheed SA, Nikolova DA,
Leupold JH, Colburn NH, Post S and Allgayer H: MicroRNA-21 (miR-21)
post-transcriptionally downregulates tumor suppressor Pdcd4 and
stimulates invasion, intravasation and metastasis in colorectal
cancer. Oncogene. 27:2128–2136. 2008. View Article : Google Scholar : PubMed/NCBI
|
|
12
|
Iwaya T, Yokobori T, Nishida N, Kogo R,
Sudo T, Tanaka F, Shibata K, Sawada G, Takahashi Y, Ishibashi M, et
al: Downregulation of miR-144 is associated with colorectal cancer
progression via activation of mTOR signaling pathway.
Carcinogenesis. 33:2391–2397. 2012. View Article : Google Scholar : PubMed/NCBI
|
|
13
|
Yan M, Song M, Bai R, Cheng S and Yan W:
Identification of potential therapeutic targets for colorectal
cancer by bioinformatics analysis. Oncol Lett. 12:5092–5098. 2016.
View Article : Google Scholar : PubMed/NCBI
|
|
14
|
Marisa L, de Reyniès A, Duval A, Selves J,
Gaub MP, Vescovo L, Etienne-Grimaldi MC, Schiappa R, Guenot D,
Ayadi M, et al: Gene expression classification of colon cancer into
molecular subtypes: Characterization, validation, and prognostic
value. PLoS Med. 10:e10014532013. View Article : Google Scholar : PubMed/NCBI
|
|
15
|
Barrett T, Wilhite SE, Ledoux P,
Evangelista C, Kim IF, Tomashevsky M, Marshall KA, Phillippy KH,
Sherman PM, Holko M, et al: NCBI GEO: Archive for functional
genomics data sets-update. Nucleic Acids Res. 41:D991–D995. 2013.
View Article : Google Scholar : PubMed/NCBI
|
|
16
|
Gaudet P, Škunca N, Hu JC and Dessimoz C:
Primer on the gene ontology. Methods Mol Biol. 1446:25–37. 2017.
View Article : Google Scholar : PubMed/NCBI
|
|
17
|
Kanehisa M, Furumichi M, Tanabe M, Sato Y
and Morishima K: KEGG: New perspectives on genomes, pathways,
diseases and drugs. Nucleic Acids Res. 45:D353–D361. 2017.
View Article : Google Scholar : PubMed/NCBI
|
|
18
|
Livak KJ and Schmittgen TD: Analysis of
relative gene expression data using real-time quantitative PCR and
the 2−ΔΔCT Method. Methods. 25:402–408. 2001. View Article : Google Scholar : PubMed/NCBI
|
|
19
|
Takemasa I, Higuchi H, Yamamoto H,
Sekimoto M, Tomita N, Nakamori S, Matoba R, Monden M and Matsubara
K: Construction of preferential cDNA microarray specialized for
human colorectal carcinoma: Molecular sketch of colorectal cancer.
Biochem Biophys Res Commun. 285:1244–1249. 2001. View Article : Google Scholar : PubMed/NCBI
|
|
20
|
Zhang J, Tsoi H, Li X, Wang H, Gao J, Wang
K, Go MY, Ng SC, Chan FK, Sung JJ, et al: Carbonic anhydrase IV
inhibits colon cancer development by inhibiting the Wnt signalling
pathway through targeting the WTAP-WT1-TBL1 axis. Gut.
65:1482–1493. 2016. View Article : Google Scholar : PubMed/NCBI
|
|
21
|
Farquharson AJ, Steele RJ, Carey FA and
Drew JE: Novel multiplex method to assess insulin, leptin and
adiponectin regulation of inflammatory cytokines associated with
colon cancer. Mol Biol Rep. 39:5727–5736. 2012. View Article : Google Scholar : PubMed/NCBI
|
|
22
|
Wood SM, Gill AJ, Brodsky AS, Lu S,
Friedman K, Karashchuk G, Lombardo K, Yang D and Resnick MB: Fatty
acid-binding protein 1 is preferentially lost in microsatellite
instable colorectal carcinomas and is immune modulated via the
interferon γ pathway. Mod Pathol. 30:123–133. 2017. View Article : Google Scholar : PubMed/NCBI
|
|
23
|
Gaspar C and Fodde R: APC dosage effects
in tumorigenesis and stem cell differentiation. Int J Dev Biol.
48:377–386. 2004. View Article : Google Scholar : PubMed/NCBI
|
|
24
|
Wu P, Wu D, Ni C, Ye J, Chen W, Hu G, Wang
Z, Wang C, Zhang Z, Xia W, et al: γδT17 cells promote the
accumulation and expansion of myeloid-derived suppressor cells in
human colorectal cancer. Immunity. 40:785–800. 2014. View Article : Google Scholar : PubMed/NCBI
|
|
25
|
Zu X, Yan R, Pan J, Zhong L, Cao Y, Ma J,
Cai C, Huang D, Liu J, Chung FL, et al: Aldo-keto reductase 1B10
protects human colon cells from DNA damage induced by electrophilic
carbonyl compounds. Mol Carcinog. 56:118–129. 2017. View Article : Google Scholar : PubMed/NCBI
|
|
26
|
Widegren E, Onnesjö S, Arbman G, Kayed H,
Zentgraf H, Kleeff J, Zhang H and Sun XF: Expression of FXYD3
protein in relation to biological and clinicopathological variables
in colorectal cancers. Chemotherapy. 55:407–413. 2009. View Article : Google Scholar : PubMed/NCBI
|
|
27
|
Ivanov SV, Panaccione A, Nonaka D, Prasad
ML, Boyd KL, Brown B, Guo Y, Sewell A and Yarbrough WG: Diagnostic
SOX10 gene signatures in salivary adenoid cystic and breast
basal-like carcinomas. Br J Cancer. 109:444–451. 2013. View Article : Google Scholar : PubMed/NCBI
|
|
28
|
Krampitz GW, George BM, Willingham SB,
Volkmer JP, Weiskopf K, Jahchan N, Newman AM, Sahoo D, Zemek AJ,
Yanovsky RL, et al: Identification of tumorigenic cells and
therapeutic targets in pancreatic neuroendocrine tumors. Proc Natl
Acad Sci USA. 113:4464–4469. 2016. View Article : Google Scholar : PubMed/NCBI
|
|
29
|
Vincenzi B, Santini D and Tonini G:
Biological interaction between anti-epidermal growth factor
receptor agent cetuximab and magnesium. Expert Opin Pharmacother.
9:1267–1269. 2008. View Article : Google Scholar : PubMed/NCBI
|
|
30
|
Wolf FI and Trapani V: Cell
(patho)physiology of magnesium. Clin Sci. 114:27–35. 2008.
View Article : Google Scholar : PubMed/NCBI
|
|
31
|
Nasulewicz A, Wietrzyk J, Wolf FI, Dzimira
S, Madej J, Maier JA, Rayssiguier Y, Mazur A and Opolski A:
Magnesium deficiency inhibits primary tumor growth but favors
metastasis in mice. Biochim Biophys Acta. 1739:26–32. 2004.
View Article : Google Scholar : PubMed/NCBI
|
|
32
|
Solinas G, Marchesi F, Garlanda C,
Mantovani A and Allavena P: Inflammation-mediated promotion of
invasion and metastasis. Cancer Metastasis Rev. 29:243–248. 2010.
View Article : Google Scholar : PubMed/NCBI
|
|
33
|
Lan FF, Wang H, Chen YC, Chan CY, Ng SS,
Li K, Xie D, He ML, Lin MC and Kung HF: Hsa-let-7g inhibits
proliferation of hepatocellular carcinoma cells by downregulation
of c-Myc and upregulation of p16INK4A. Int J Cancer.
128:319–331. 2011. View Article : Google Scholar : PubMed/NCBI
|
|
34
|
Ding Z, Wang X, Schnackenberg L, Khaidakov
M, Liu S, Singla S, Dai Y and Mehta JL: Regulation of autophagy and
apoptosis in response to ox-LDL in vascular smooth muscle cells,
and the modulatory effects of the microRNA hsa-let-7 g. Int J
Cardiol. 168:1378–1385. 2013. View Article : Google Scholar : PubMed/NCBI
|
|
35
|
Huang S, Feng C, Zhai YZ, Zhou X, Li B,
Wang LL, Chen W, Lv FQ and Li TS: Identification of miRNA
biomarkers of pneumonia using RNA-sequencing and bioinformatics
analysis. Exp Ther Med. 13:1235–1244. 2017. View Article : Google Scholar : PubMed/NCBI
|
|
36
|
Wang Y, Huang D, Chen KY, Cui M, Wang W,
Huang X, Awadellah A, Li Q, Friedman A, Xin WW, et al: Fucosylation
deficiency in mice leads to colitis and adenocarcinoma.
Gastroenterology. 152:193–205.e10. 2017. View Article : Google Scholar : PubMed/NCBI
|
|
37
|
Srinivasan T, Walters J, Bu P, Than EB,
Tung KL, Chen KY, Panarelli N, Milsom J, Augenlicht L, Lipkin SM,
et al: NOTCH signaling regulates asymmetric cell fate of fast- and
slow-cycling colon cancer initiating cells. Cancer Res.
76:3411–3421. 2016. View Article : Google Scholar : PubMed/NCBI
|