Introduction
Cancer cachexia is a multifactorial disease
characterized by ongoing loss of skeletal muscle mass (with or
without adipose mass) that leads to functional impairment (1) and contributes to 20% of all
cancer-related deaths (2). Since
much of the research in cancer cachexia has historically focused on
muscle loss, the role of adipose in this disease is less
understood. The loss of adipose mass often precedes the loss of
lean (i.e., muscle) mass in cancer cachexia and can predict for
mortality in cancer patients (3–7).
Similar to other wasting diseases like end-stage chronic kidney
disease and chronic heart failure (8), an ‘obesity paradox’ may exist in
patients with cancer cachexia, where obese individuals develop
cachexia at a slower rate than lean patients (9). Possible explanations for this obesity
paradox may relate to adipose tissue's potential protective
effects, including: i) acting as a large energy reservoir in a
state of negative energy balance and ii) secreting important
adipokines for regulating whole-body metabolism and
inflammation.
Several clinical studies have reported that male
cancer patients lose weight at a faster rate than females (10–13),
although explanations for this finding are lacking. In the general
population, females tend to have ~10% more adiposity than men at
the same BMI (14), which may fit
the obesity paradox idea in patients with cancer cachexia. The role
of menopause, a condition associated with an increase in adipose
mass (15), is also unclear in
cancer cachexia.
Understanding the interactions between adiposity and
sex as contributors to the pathogenesis of cancer cachexia could
aid in developing more effective therapies for patients. However,
findings from clinical studies are often complex and difficult to
interpret due to the heterogeneity of cancer types and potential
pre-disposing factors in patients. To circumvent these issues,
studies aiming to understand the development and progression of
cancer cachexia often utilize rodent models. The colon-26 (C-26)
adenocarcinoma model is a well-characterized model of cancer
cachexia due to its ability to mimic many of the human
pathophysiology and underlying molecular mechanisms driving the
disease (16). Like humans, C-26
tumor-bearing mice exhibit reduced body mass (e.g., muscle and
adipose loss), systemic inflammation and activation of ubiquitin
ligases in skeletal muscle which leads to protein degradation
(17,18). The functional impairments of muscle
(e.g., muscle strength and force, respiratory failure, heart
failure) observed in patients with cancer cachexia are also
reproduced in C-26 tumor-bearing mice (19,20).
Anorexia, another important factor that contributes to body wasting
in people (21), has been reported
in C-26 tumor-bearing mice (22).
The phenotypes of the C-26 tumor mouse model are highly
reproducible and provide researchers a standardized model that can
be used to elucidate mechanisms that contribute to cachexia and
develop pre-clinical therapies that may potentially slow or reverse
the disease.
The aim of this study was to evaluate the changes of
adipose tissue mass, sex status and tumor mass on outcomes of mice
with C-26 adenocarcinoma-induced cachexia. Our study revealed that
female and ovariectomized (OVX) mice developed cachexia sooner than
male mice and that independent of sex, this finding was related to
higher tumor mass and lower adipose mass predicting for the onset
and severity of weight loss.
Materials and methods
Colon-26 adenocarcinoma cell
culture
C-26 adenocarcinoma cells were cultured with Roswell
Park Memorial Institute media (RPMI 1640) + L-glutamine
(Sigma-Aldrich; Merck KGaA, Darmstadt, Germany) supplemented with
5% fetal bovine serum and 1% penicillin-streptomycin at 37°C and 5%
CO2.
Experimental animals and study
design
CD2F1 mice (n=20 five-week old males, n=20 nine-week
old intact females, n=20 nine-week old OVX females) of similar
weight (~20 g) were purchased from Charles River (Wilmington, MA,
USA). Mice were housed in a vivarium equipped with room temperature
of 22±0.5°C, a 12-h light/dark cycle, and free access to food and
water. Upon arrival, mice were housed in groups of 5 mice per cage
and allowed 1 week to acclimate to environmental conditions. On the
day of tumor cell inoculation (day 0), half of the mice in each
group (male, female, OVX) were subcutaneously injected into the
right flank with 1×10⁶ C-26 cells suspended in 100 µl
phosphate buffered saline (PBS). An equal volume of PBS was
injected into the right flank of mice serving as controls for each
of the 3 groups. The weight of all mice in the study ranged from
18.9–21.5 g at day 0. Bodyweight and food intake of mice were
measured daily. Mice were euthanized in a fed state (~1300 h), by
heart puncture under anesthesia with cervical dislocation at 19
days post-inoculation. Tissues and blood were immediately collected
and prepared for analyses as described below. Experiments involving
mice were approved by The Ohio State University Institutional
Animal Care and Use Committee.
EchoMRI
To assess time-course changes in body composition in
live mice, EchoMRI™ (Houston, TX, USA) was used at 3 time-points:
24 h prior to tumor cell inoculation, day 8 post-inoculation and
days 17–19 post-inoculation (day of necropsy).
Grip strength
Mice were acclimated to forelimb and hindlimb grip
strength testing for 1 week and grip strength was measured
beginning on day 7 post-inoculation, followed by days 14 and 19
post-inoculation (day of necropsy) with the Columbus Instruments
Grip Strength Meter (Columbus, OH, USA). Forelimb and hindlimb grip
strength of each mouse were tested 3 times consecutively with 1 min
rest between replicates; the replicate average was used for
analysis.
Muscle fiber cross-sectional area
To determine muscle fiber size via cross-sectional
area (CSA), freshly isolated gastrocnemius samples were mounted
with Optimal Cutting Temperature (OCT) compound, and snap-frozen
with liquid nitrogen-cooled isopentane. Mounted samples were
sectioned using a cryostat (Leica; Wetzlar, Hesse, Germany). Three
serial sections (10 µm) spanning the length of each gastrocnemius
muscle were prepared and stained with hematoxylin and eosin
(H&E). Images were acquired using an Olympus IX71 microscope
and cellSens Standard software (Center Valley, PA, USA). Muscle
fiber CSA was quantified by fiber diameter (ImageJ; National
Institutes of Health, Bethesda, MD, USA). An evaluator manually
outlined and quantified individual fibers for a separate blinded
evaluator, who then grouped results accordingly for data analysis.
Results from each of the 3 sections per muscle were averaged prior
to statistical analysis.
ELISA
Plasma IL-6 (Invitrogen; Thermo Fisher Scientific,
Inc., Waltham, MA, USA) and adiponectin (EMD Millipore, Billerica,
MA, USA) were measured by ELISA according to the manufacturers'
protocol.
Real-time quantitative PCR
Muscle RNA was extracted with TRIzol (Invitrogen;
Thermo Fisher Scientific, Inc.) according to the manufacturer's
protocol. RNA concentration was determined (NanoDrop 1000; Thermo
Fisher Scientific, Inc.) and RNA quality was confirmed by 1%
agarose gel. RNA was reverse transcribed to cDNA (High Capacity
cDNA Archive Kit, Applied Biosystems; Thermo Fisher Scientific,
Inc.). The cDNA was amplified by real-time quantitative PCR with
TaqMan Gene Expression Assays using pre-designed and validated
primers under universal cycling conditions defined by Applied
Biosystems (Thermo Fisher Scientific, Inc.) The primers used were
MuRF-1 (product ID code: Mm01185221_m1), Atrogin-1 (product ID
code: Mm00499523_m1) and Bax (product ID code: Mm00432051_m1)
obtained from Thermo Fisher Scientific, Inc. The thermocycling
conditions were: 95°C for 10 min, followed by 40 cycles at 95°C for
15 sec and 60°C for 1 min. Target gene expression was normalized to
the endogenous control GAPDH (product no. 4352339E; Thermo Fisher
Scientific, Inc.) amplified in the same reaction and expressed as
2−DDCq relative to the control group (23).
Statistical analysis
Data are presented as the mean ± standard error of
the mean (SEM). Plasma IL-6 and adiponectin data were
log-transformed to reduce skewedness of distribution. Differences
between male, female, and OVX tumor groups were analyzed by one-way
analysis of variance (ANOVA) followed by post-hoc Tukey's test.
Differences between control and tumor groups were analyzed by
Student's t-test with Bonferroni correction for multiple hypothesis
testing (α=0.05/3). A one-sample t-test with Bonferroni correction
was used to test for differences between beginning and final
measurements within a single group. Pearson's correlation and
multiple linear regression analyses were used to determine
interactions of variables and outcomes in the experimental model.
All statistical tests were performed using the software GraphPad
Prism 7 (GraphPad Software, Inc., La Jolla, CA, USA) with the
exception of multiple linear regression analysis, which was
performed with R (Vienna, Austria). All tests were performed at the
5% significance level, adjusting for multiplicity where noted.
Results
Characterization of C-26 cachexia
between male, female and OVX mice
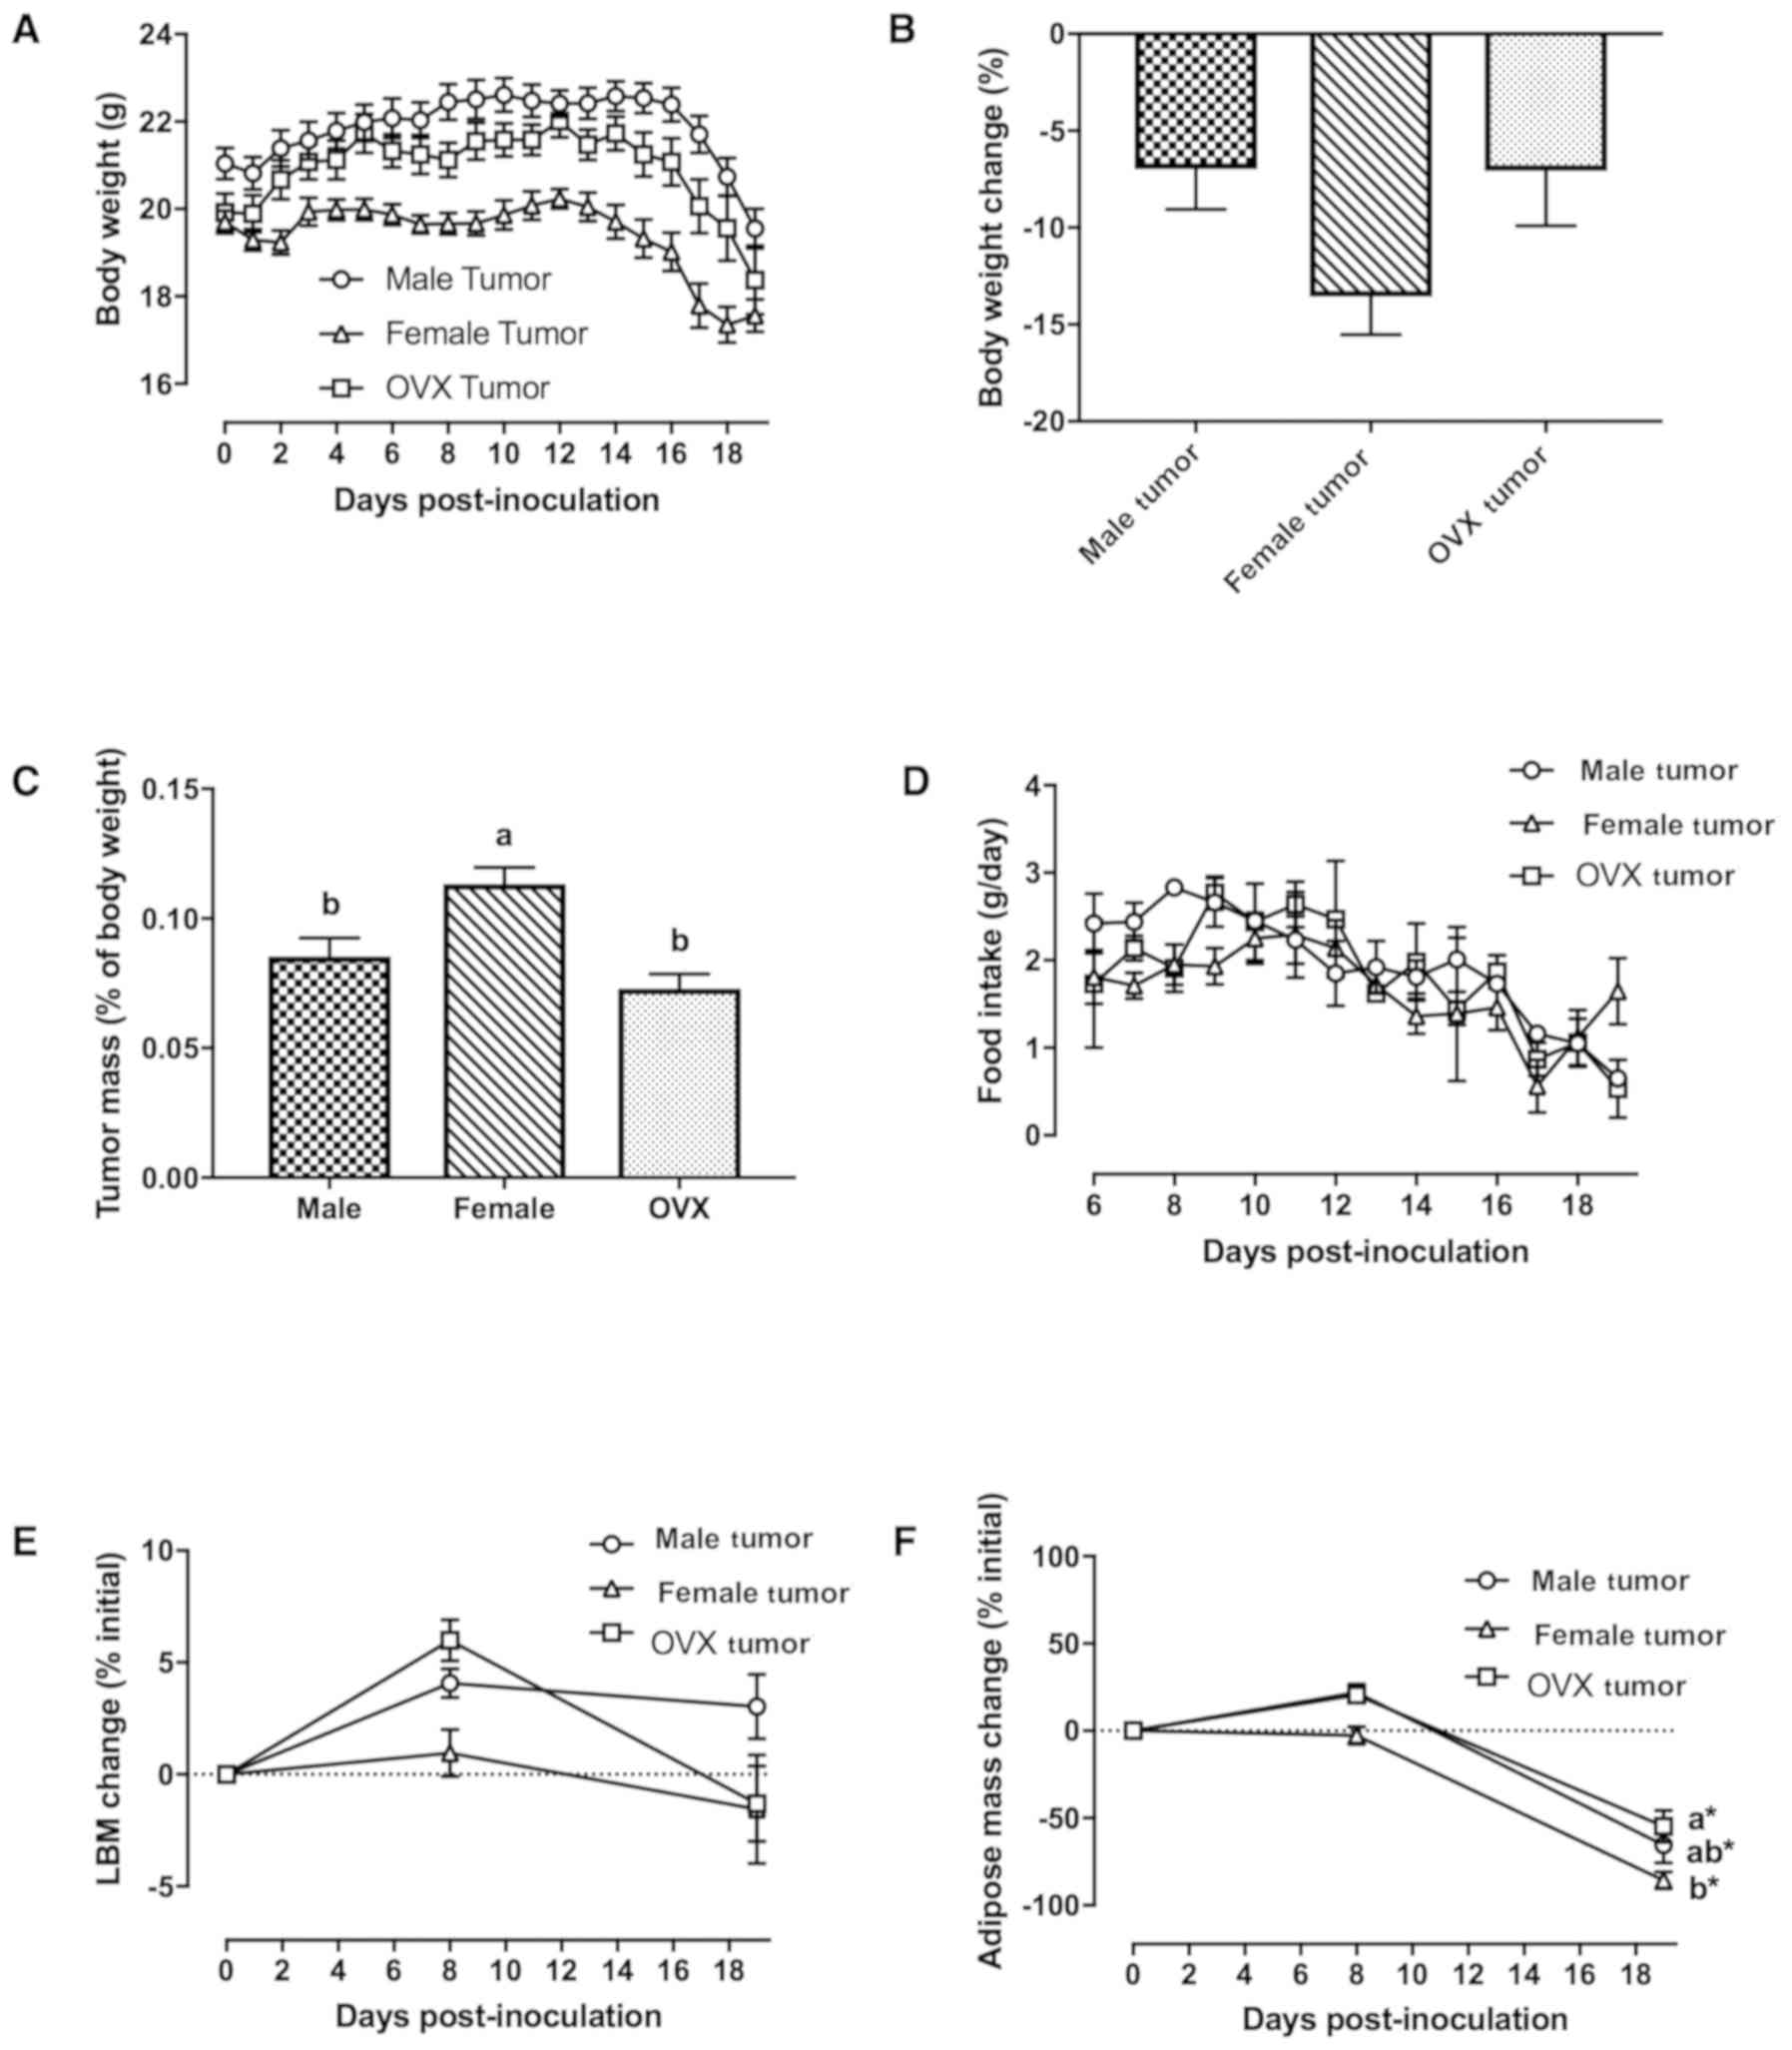
By 19 days post-inoculation, all tumor-bearing mice
in the male, female and OVX groups developed cachexia as defined by
≥5% weight loss (Fig. 1A and B);
tumor-free necropsy body weight was significantly smaller in all
tumor-bearing groups compared to their respective control groups at
the end of the study (Table I,
P<0.016). Three female tumor mice and two OVX tumor mice were
euthanized prior to day 19 post-inoculation (i.e., days 17 and 18),
due to early body weight loss >20% of peak body weight and signs
of moribundity (e.g., diminished movement, anorexia). When tumor
mass was normalized to tumor-free bodyweight at necropsy, female
tumor mice had significantly higher tumor mass per gram of
bodyweight compared to male and OVX tumor mice (Fig. 1C, P=0.012 and P<0.001 vs. male
and OVX tumor mice, respectively). Anorexia (e.g., decreased food
intake) was evident in all tumor-bearing groups (Fig. 1D), and cumulative food intake was
lower compared to their respective control groups (Table I). To assess changes in body
composition over time, EchoMRI analysis was performed on mice
before tumor inoculation, at midpoint (day 8 post-inoculation) and
the day of necropsy (days 17–19 post-inoculation). There were no
changes in lean body mass (Fig.
1E), while adipose mass was reduced at the end of the study in
all 3 tumor groups (Fig. 1F,
P<0.016). Female tumor mice lost significantly more adipose mass
(expressed as the percentage change of initial) than OVX tumor mice
at the end of the study (Fig. 1F,
P=0.036).
 | Table I.Characteristics of male, female, and
OVX tumor mice. |
Table I.
Characteristics of male, female, and
OVX tumor mice.
|
| Male | Female | OVX |
|---|
|
|
|
|
|
|---|
|
| Control | Tumor | Control | Tumor | Control | Tumor |
|---|
| Tumor-free necropsy
body weight (g) | 22.5±0.5 |
18.0±0.5a | 20.4±0.2 |
15.3±0.4a | 22.8±0.6 |
17.3±0.7a |
| Cumulative food
intake (g/mouse) | 33.2±0.2 | 27.2±1.5 | 27.6±1.0 | 23.3±1.2 | 30.5±1.4 | 25.5±2.0 |
| Quadriceps muscle
(mg) | 168±2 | 133±4a | 155±2 | 117±5a | 167±4 | 130±5a |
| Gastrocnemius
muscle (mg) | 137±3 | 113±4a | 123±3 | 101±4a | 129±3 | 115±5 |
| Soleus muscle
(mg) | 6.5±0.3 |
4.8±0.3a | 6.1±0.3 | 5.3±0.4 | 6.3±0.4 |
4.5±0.5a |
| Muscle fiber CSA
(µm2) | 1850±102 | 1542±119 | 2187±72 |
1283±118a | 2104±215 | 1492±60 |
| Inguinal adipose
(mg) | 563±61 | 209±68a | 437±38 | 67±19a | 710±52 | 191±44a |
| Epididymal adipose
(mg) | 451±30 | 125±42a | 292±20 | 60±10a | 418±35 | 110±22a |
| Heart (mg) | 125±5 | 130±7 | 107±3 | 105±4 | 113±3 | 111±7 |
| Liver (mg) | 765±16 | 899±28a | 730±24 | 809±50 | 825±10 | 871±26 |
| Spleen (mg) | 59±2 | 206±11a | 80±4 | 160±15a | 75±2 | 190±13a |
| LOG plasma IL-6
(pg/ml) | 1.2±0.2 |
2.5±0.2a | 1.5±0.1 |
2.5±0.1a | 1.1±0.2 |
2.4±0.1a |
| LOG plasma
adiponectin (µg/ml) | 1.0±0.0 |
0.5±0.1a | 1.1±0.0 |
0.5±0.1a | 1.0±0.0 |
0.7±0.0a |
Effect of C-26 cachexia on skeletal
muscle tissue
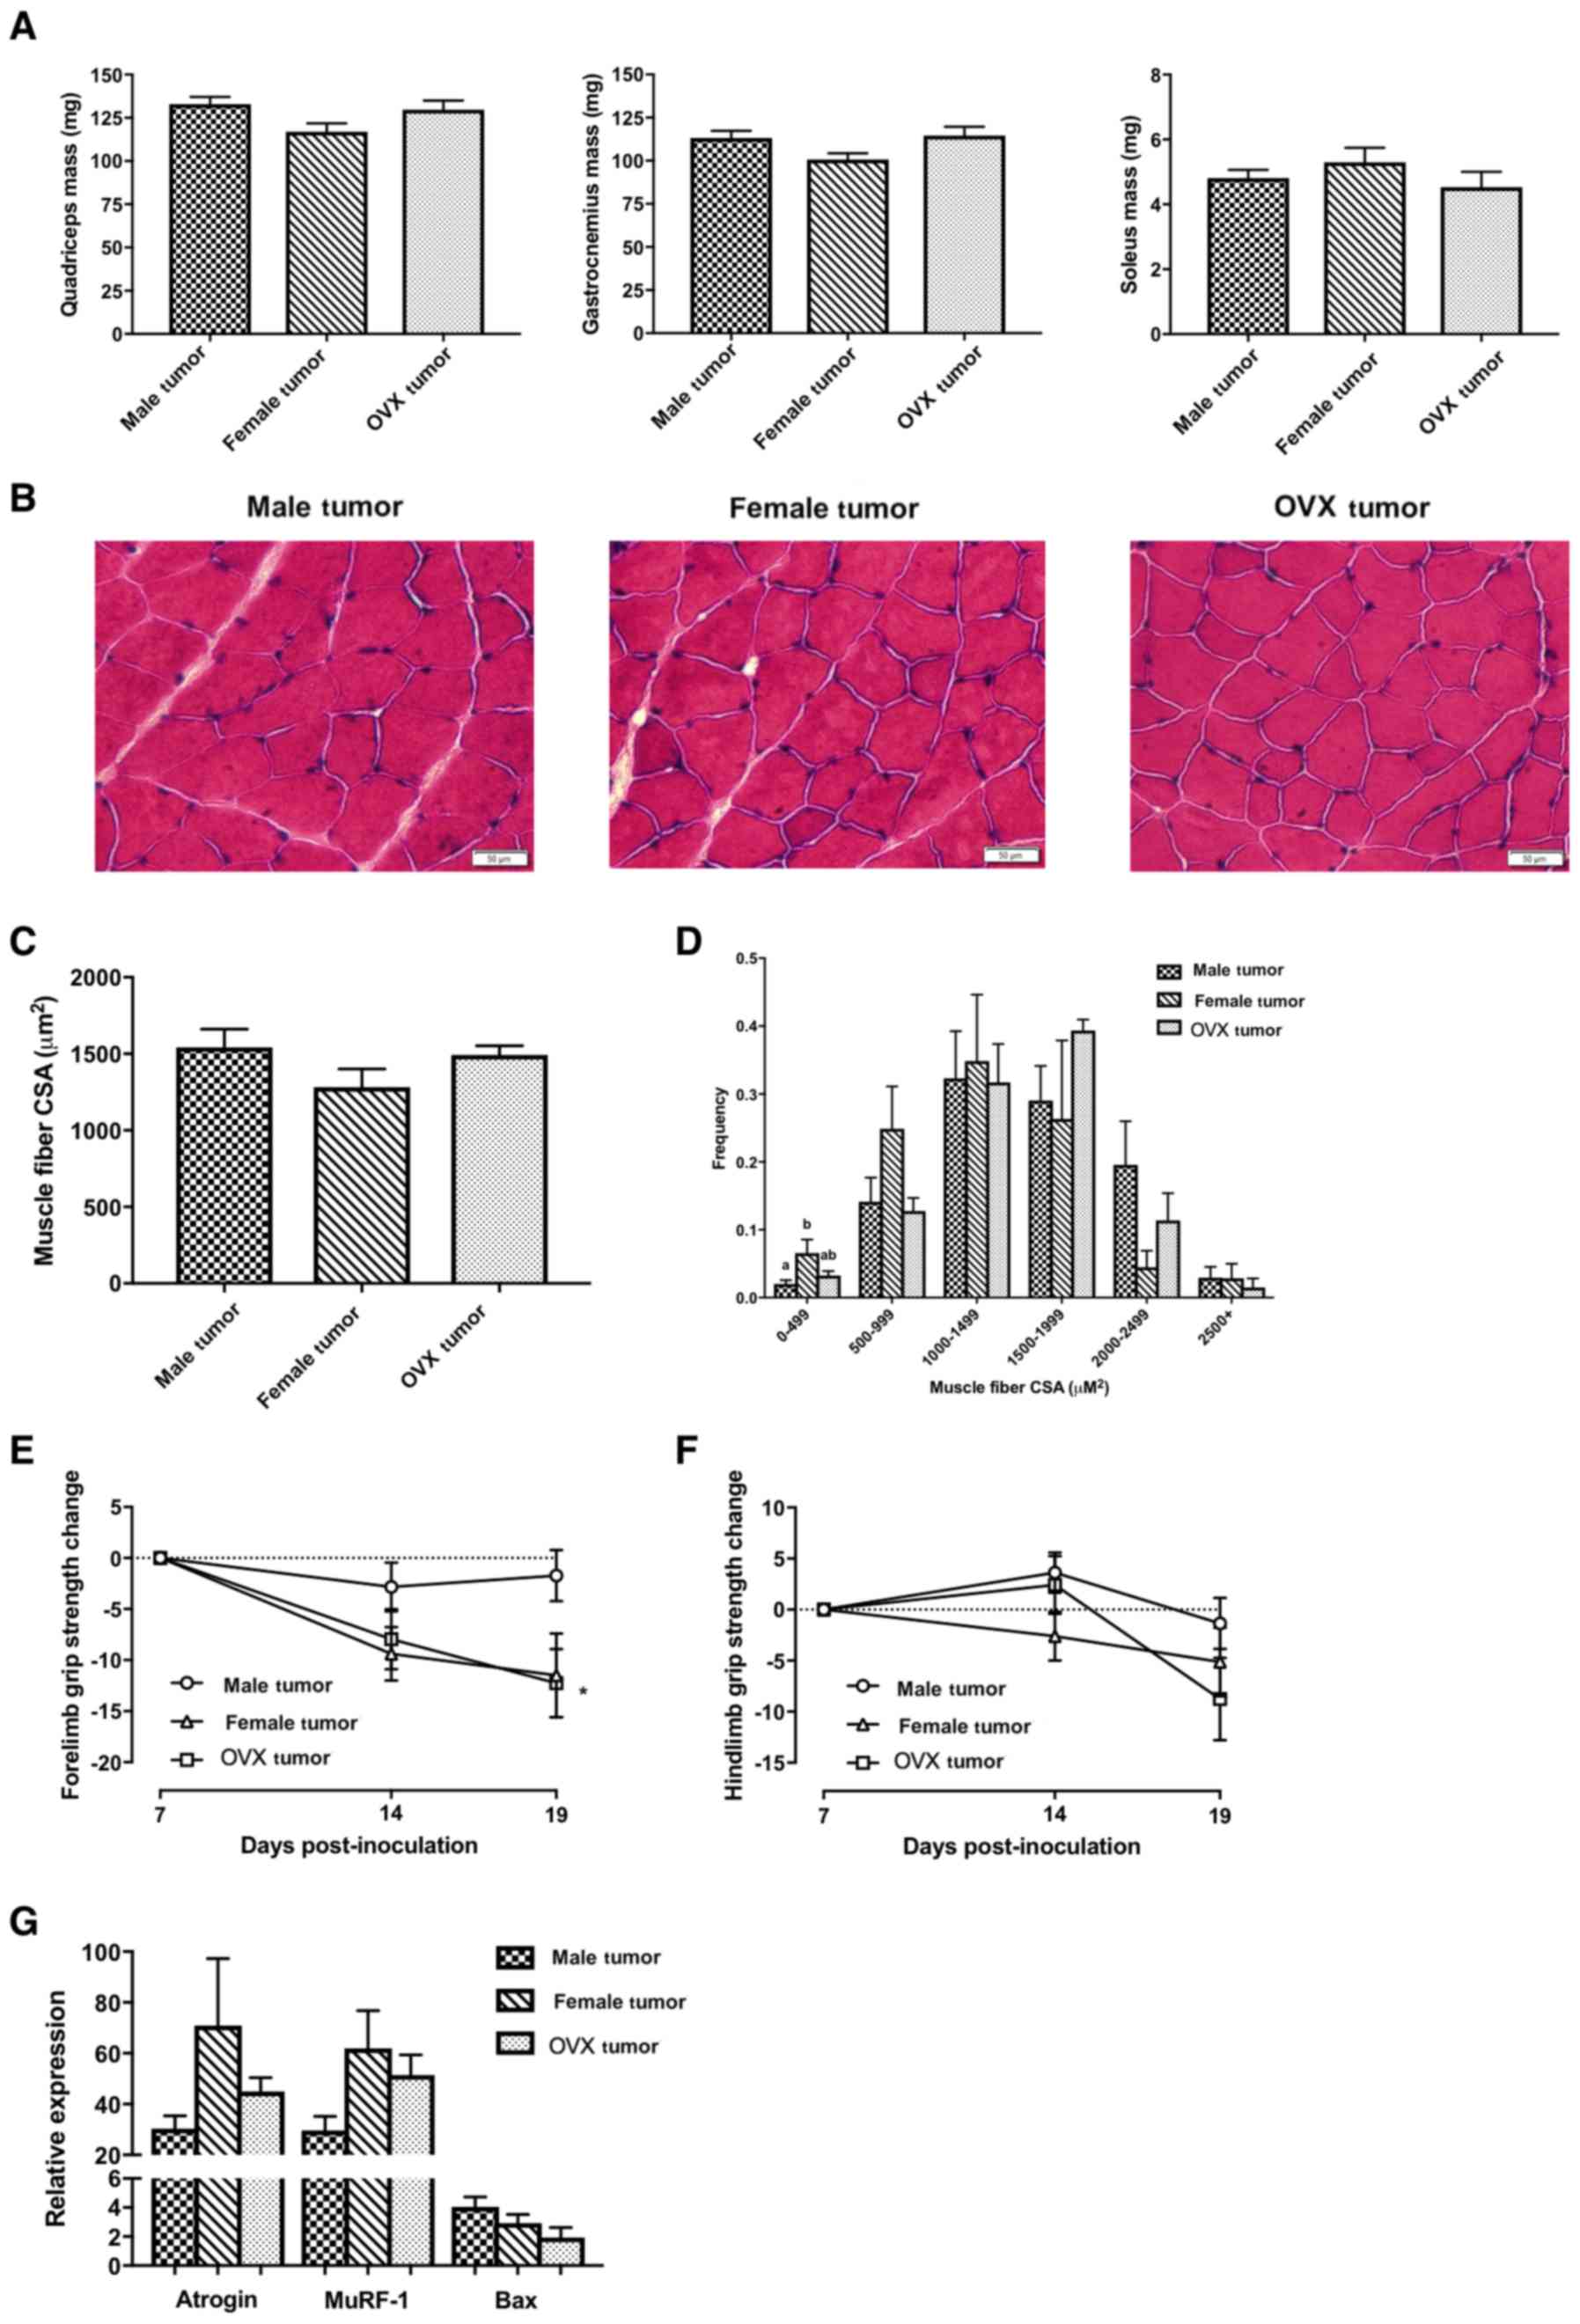
Despite no significant changes in lean body mass as
measured by EchoMRI (Fig. 1E), all
tumor groups experienced decreases in skeletal muscle masses
compared to their respective control groups (Table I, P<0.016). There were no
significant differences in skeletal muscle masses among the 3 tumor
groups (Fig. 2A). Similarly, there
were no significant differences in average muscle fiber
cross-sectional area (Fig. 2B and
C), although female tumor mice had a significantly higher % of
small fibers (range 0–499 µm2) than male tumor mice
(Fig. 2D, P=0.03). As a measurement
of muscle function, grip strength was measured at days 7, 14 and 19
post-inoculation. Data were normalized to day 7 post-inoculation
(before onset of cachexia), when peak forelimb grip strength was
observed in all 3 tumor groups. OVX tumor mice had significantly
decreased forelimb grip strength at the end of the study (Fig. 2E, P<0.016), while female tumor
mice exhibited a similar trend (P=0.026). The change in forelimb
grip strength was not significantly different between groups at the
end of the study (P=0.104 and P=0.075 for female and OVX tumor mice
vs. male tumor mice, respectively). There were no significant
differences in hindlimb grip strength between the 3 tumor groups
(Fig. 2F). The C-26 model of cancer
cachexia is known for its aggressive ability to induce muscle
wasting. The primary mechanism responsible for C-26-induced muscle
wasting is through the ubiquitin proteasome system (UPS) (24). Consistent with other studies using
the C-26 model of cancer cachexia (25–27),
male, female and OVX tumor groups exhibited significant increases
in mRNA levels of E3 ubiquitin ligases Atrogin-1 and MuRF-1 in
quadriceps muscle in comparison to their respective controls (data
not shown); however, these genes were not significantly different
between the 3 tumor groups (Fig.
2G). Another mechanism involved in cancer-induced muscle
wasting is through Bcl-2-like protein 4 (Bax)-regulated apoptosis
(18). While Bax mRNA levels were
significantly higher in the 3 tumor groups in comparison to their
respective controls (data not shown), they were not significantly
different between the 3 tumor groups (Fig. 2G).
Effect of C-26 cachexia on
non-skeletal muscle tissues and plasma biomarkers
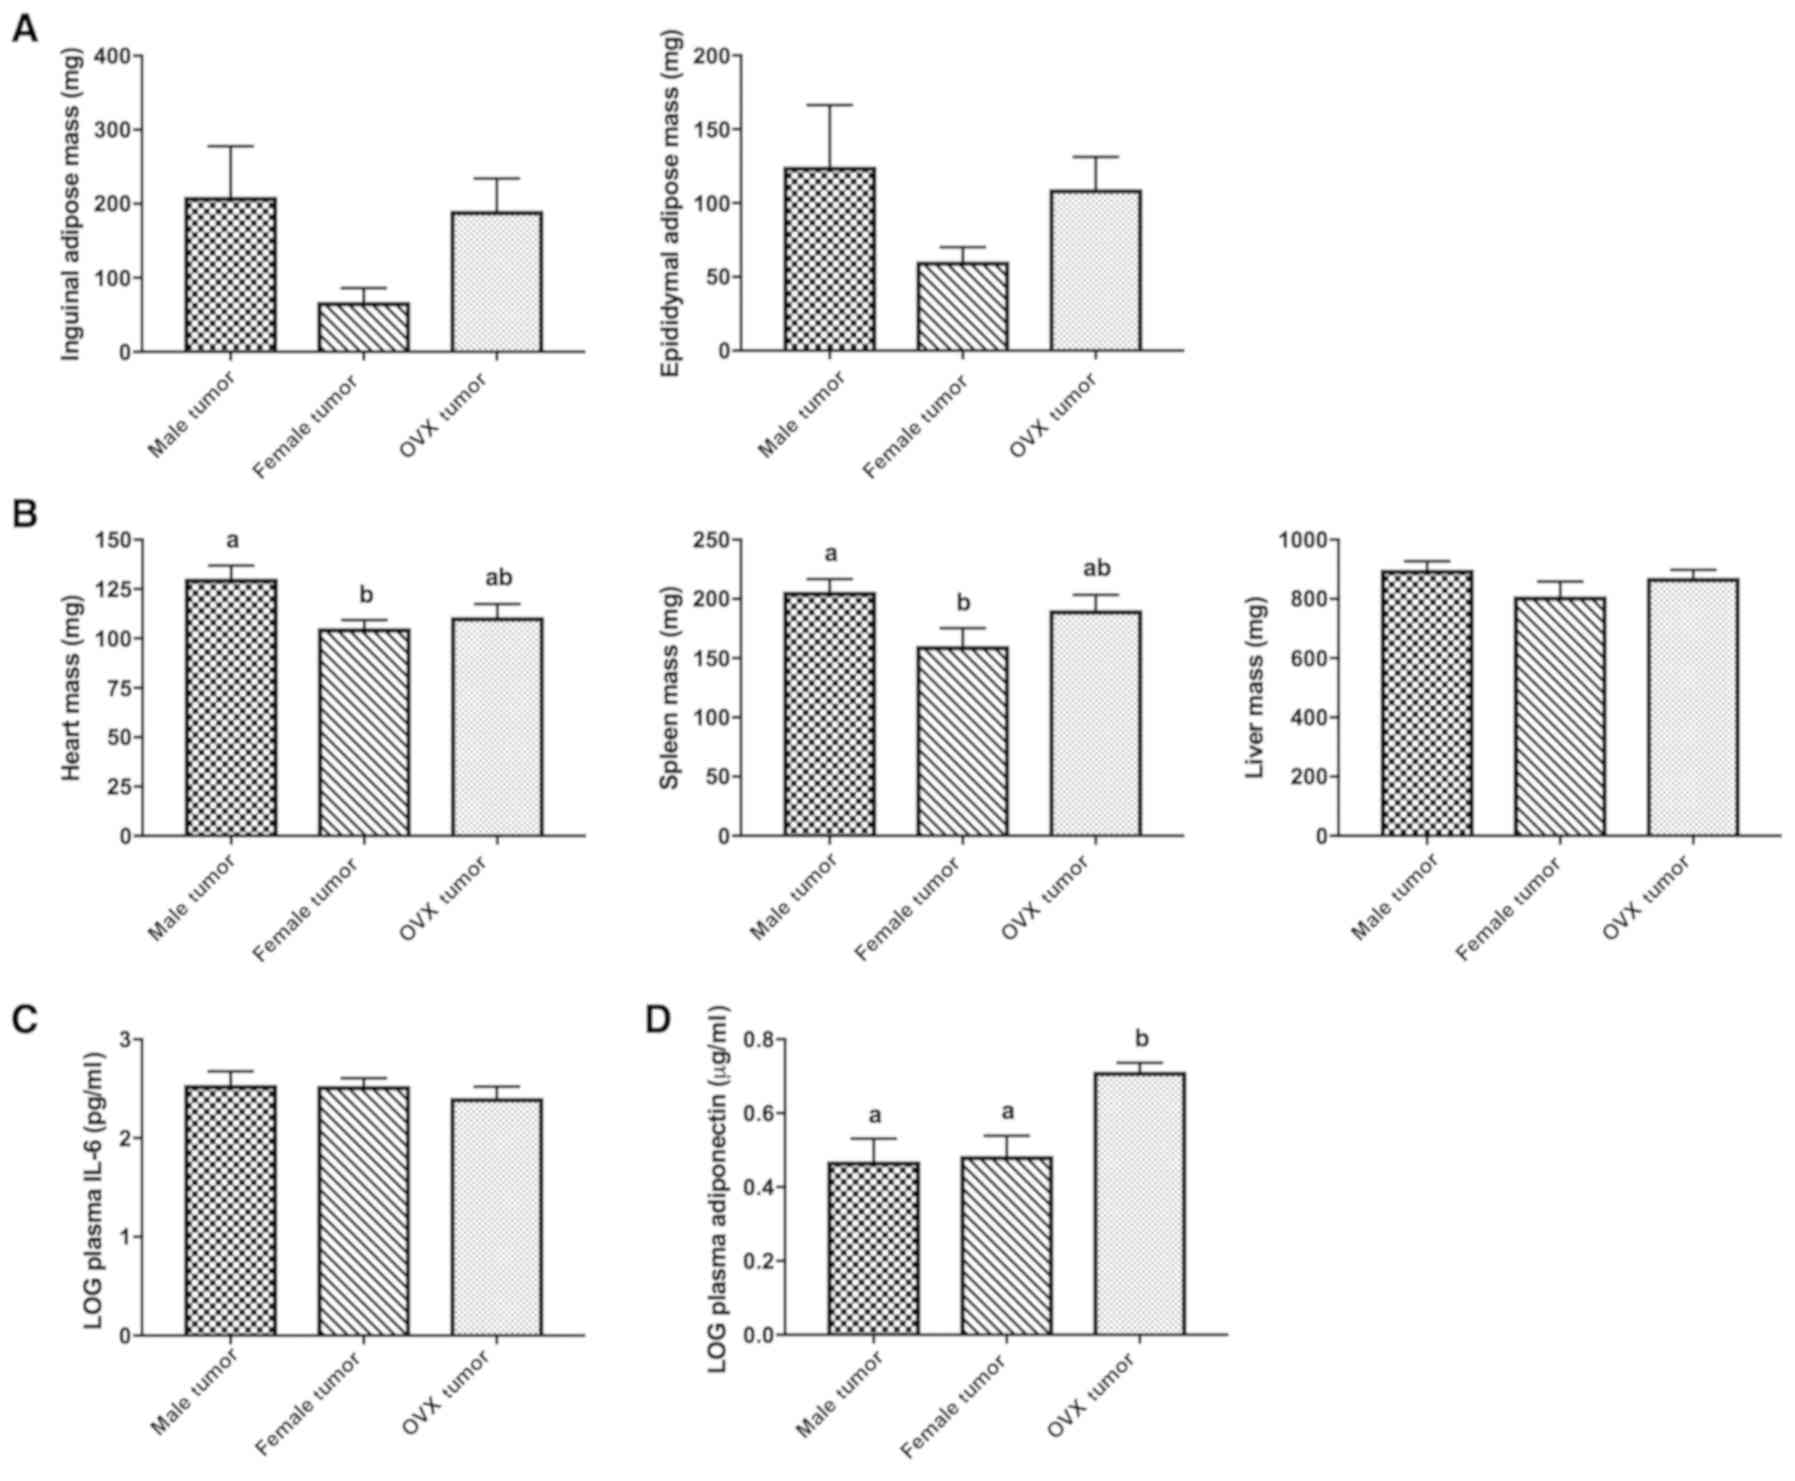
Male, female and OVX tumor groups exhibited
significant decreases in both inguinal (subcutaneous) and
epididymal (visceral) adipose depots compared to their respective
controls (Table I, P<0.016), but
there were no significant differences between the 3 tumor groups
(Fig. 3A). Heart and spleen masses
were significantly lower in female tumor mice compared to male
tumor mice (Fig. 3B, P=0.014 and
P=0.048, respectively), but this was not observed in OVX tumor
mice. Liver mass was similar between the 3 tumor groups. IL-6 is
the primary cytokine responsible for inducing cachexia in the C-26
models (17). Male, female, and OVX
tumor groups had significantly higher levels of plasma IL-6
compared to their respective controls (Table I, P<0.016), but these values were
not significantly different between the 3 tumor groups (Fig. 3C). Adiponectin, a hormone with
whole-body anti-inflammatory and insulin-sensitizing roles
(28) was significantly decreased
in all tumor groups compared to their respective controls (Table I, P<0.016); plasma adiponectin
was significantly higher in OVX tumor mice compared to male tumor
and female tumor mice (Fig. 3D,
P=0.004 and 0.005 vs. male and female tumor mice,
respectively).
Relationship of tumor and adipose mass
to the progression of C-26 cachexia
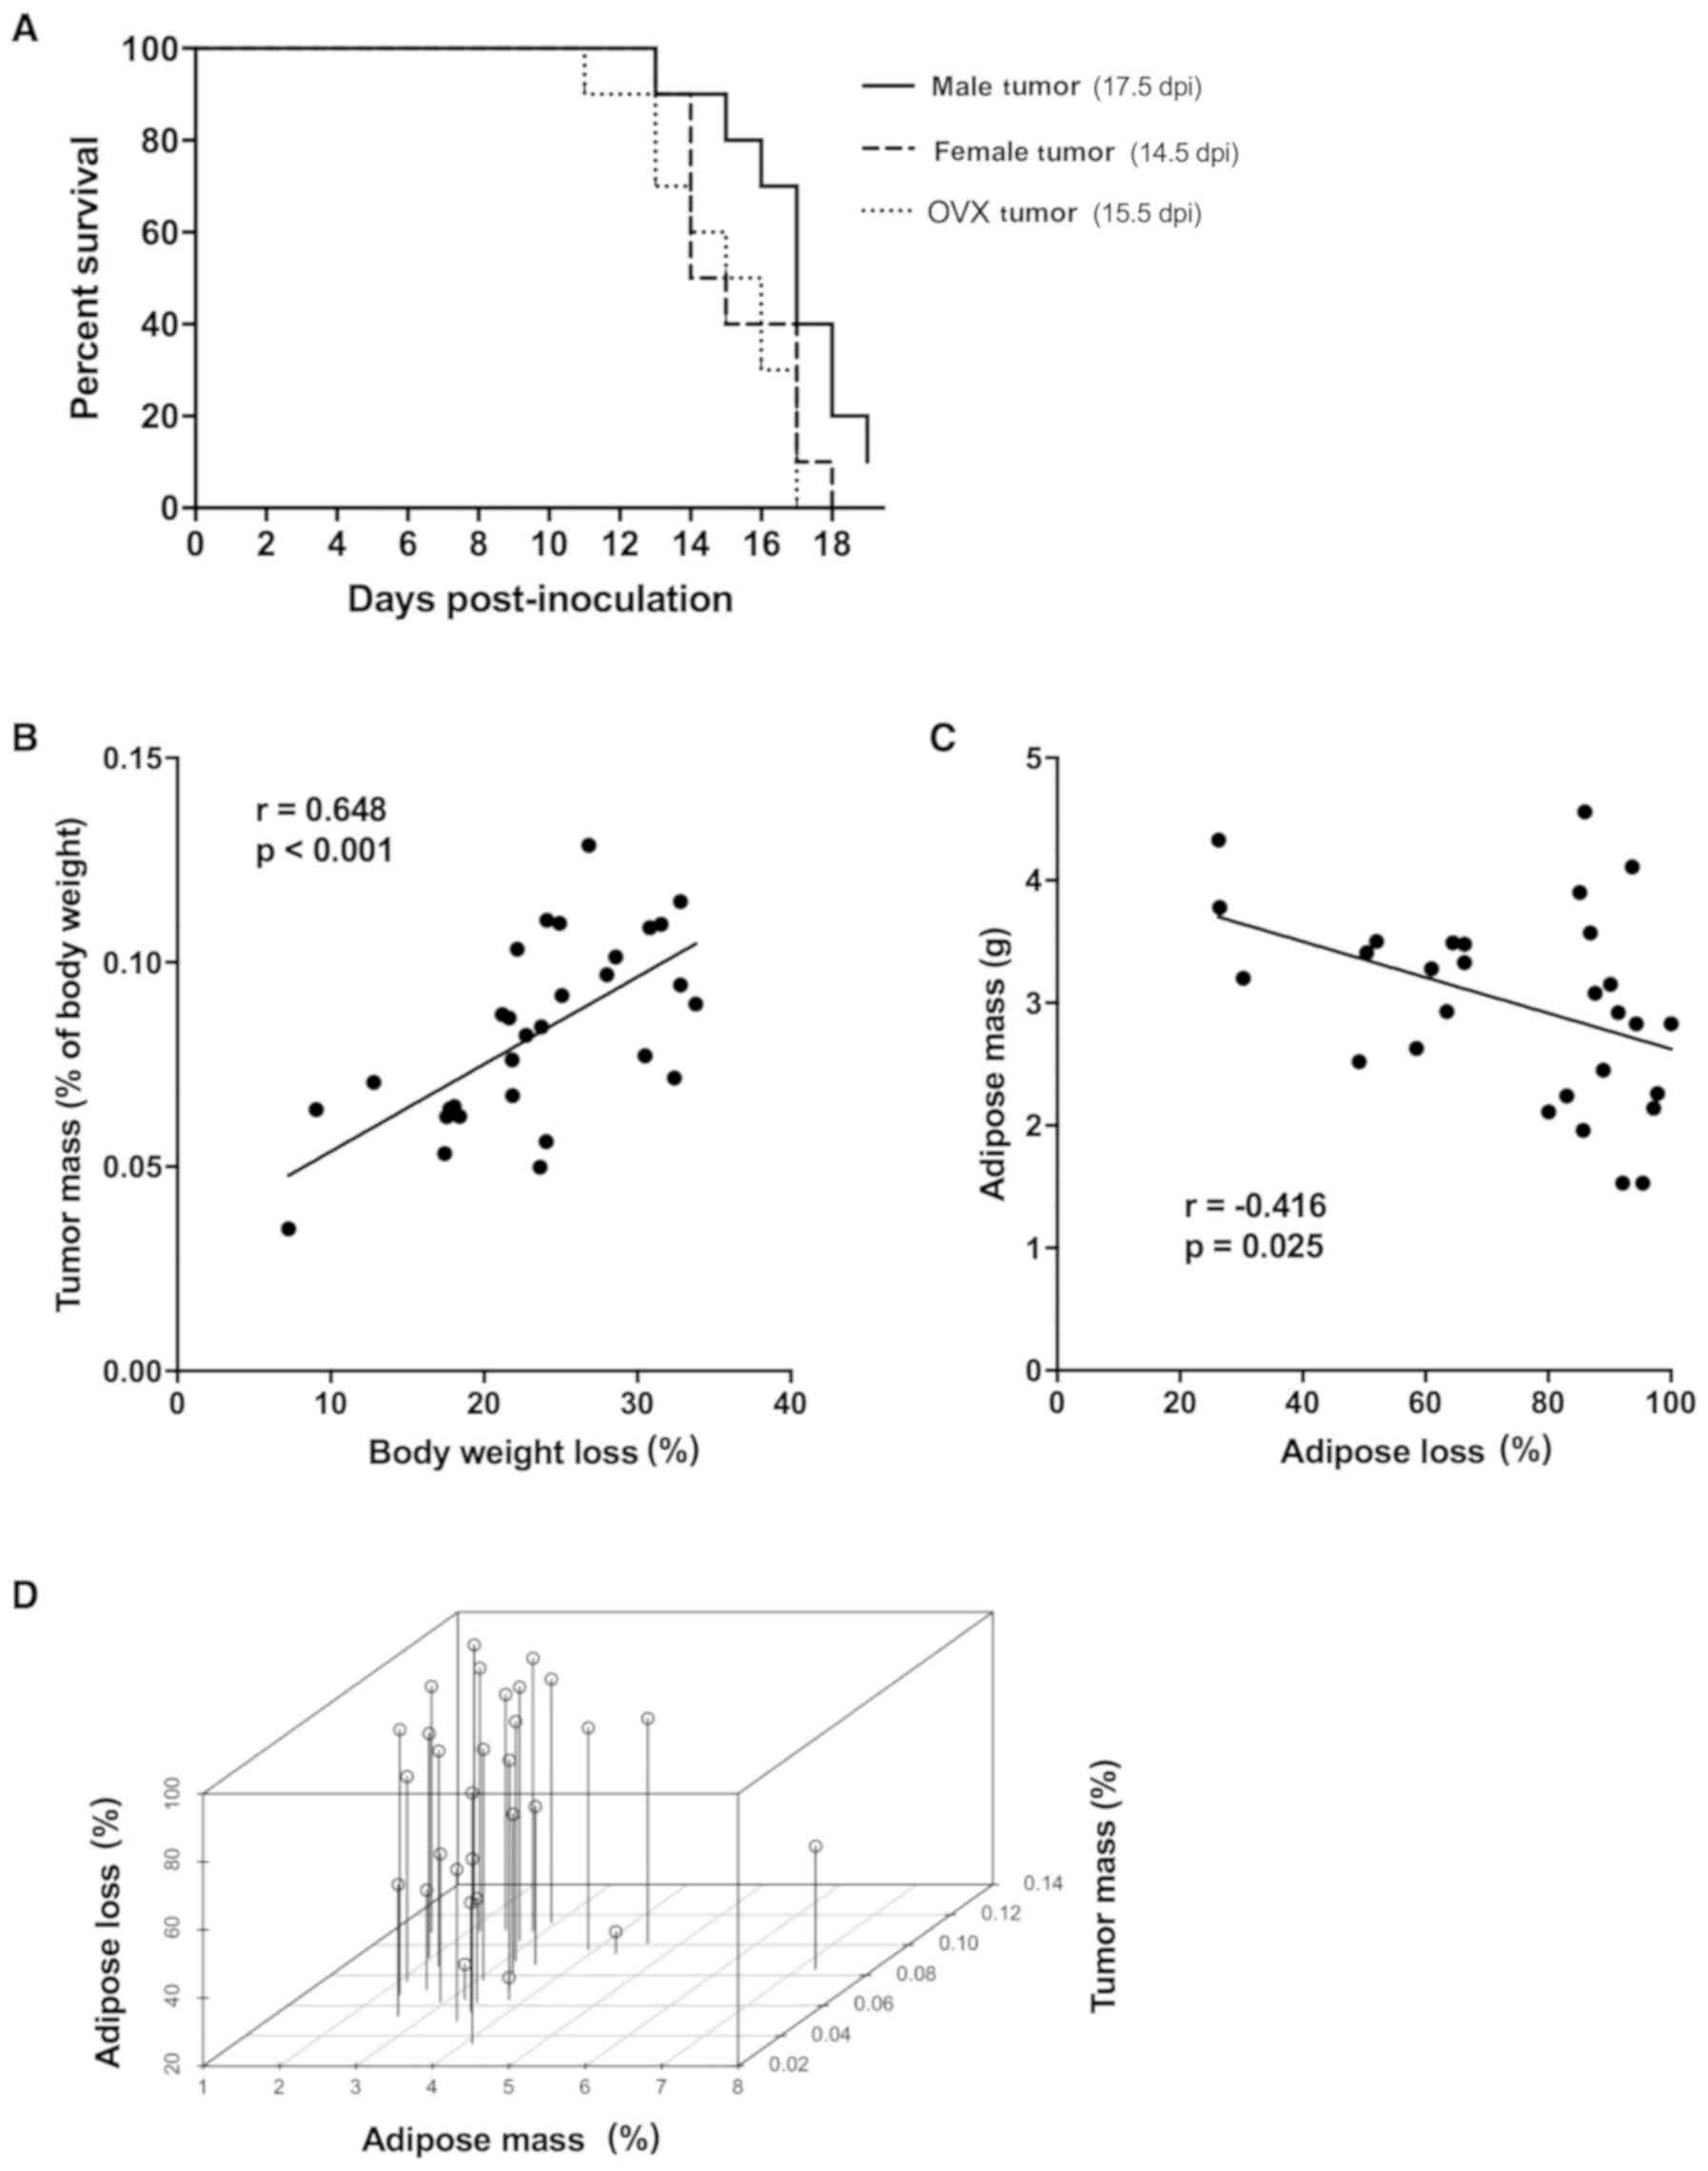
Although the 3 tumor groups developed cachexia (≥5%
BW loss) by the end of the study, the rate of developing cachexia
differed among groups (Fig. 4A,
P=0.04). Female and OVX tumor mice (50% incidence at days 14.5 and
15.5 post-inoculation, respectively) appeared to develop cachexia
earlier than male tumor mice (day 17.5 post-inoculation). To
discern the possible reason(s) for differences in susceptibility to
developing cachexia, we performed correlational analyses of
potential factors that could contribute to body weight loss. Tumor
mass (expressed as tumor mass normalized to tumor-free body mass)
was correlated with percentage of peak body weight loss (Fig. 4B, P<0.001), regardless of sex or
ovariectomy. Initial mouse body weight and lean body mass (as
measured by EchoMRI) did not predict for overall body weight loss
or adipose loss (data not shown). EchoMRI adipose mass at midpoint
(day 8 post-inoculation, before mice developed cachexia) predicted
for overall percentage of adipose loss at the end of the study
(Fig. 4C, P=0.025). Since adipose
loss in tumor mice may be impacted by tumor mass, multiple linear
regression analysis was performed using percentage of tumor mass
and EchoMRI adipose mass (g) as co-variates for overall percentage
of adipose loss (Fig. 4D). There
was a significant effect of the percentage of tumor mass on the
percentage of adipose loss (P=0.022), when controlling for EchoMRI
adipose mass (g) (Table II). A 1
unit increase in the percentage of tumor mass was associated with a
4.0 percentage point loss of adipose mass. There was not a
significant effect of EchoMRI adipose mass (g) on the percentage of
adipose loss, when controlling for the percentage of tumor mass
(Table II, P=0.09). The estimated
effect of a 1-g increase in EchoMRI adipose mass was a 5.9
percentage point decrease in adipose loss. When this multiple
linear regression model was stratified by sex/ovariectomy, we found
a significant association between tumor mass and adipose loss in
female tumor mice (Table III,
P=0.003) and weaker evidence of association in OVX tumor mice
(Table III, P=0.113).
| Table II.Multiple linear regression analysis
with adipose mass and percentage of tumor/BW as predictors of
percentage of adipose loss in C-26 tumor-bearing mice. |
Table II.
Multiple linear regression analysis
with adipose mass and percentage of tumor/BW as predictors of
percentage of adipose loss in C-26 tumor-bearing mice.
| Variable | Estimate (β) | Standard error | P-value |
|---|
| Intercept | 59.5 | 19.4 | 0.005a |
| Adipose mass
(g) | −5.9 | 3.4 | 0.090 |
| Percentage of
tumor/BW | 4.0 | 1.6 | 0.022a |
| Table III.Multiple linear regression analysis
with adipose mass and percentage of the tumor/BW as predictors of
percentage of adipose loss in C-26 tumor-bearing mice stratified by
sex/ovariectomy. |
Table III.
Multiple linear regression analysis
with adipose mass and percentage of the tumor/BW as predictors of
percentage of adipose loss in C-26 tumor-bearing mice stratified by
sex/ovariectomy.
| A, Male |
|---|
|
|---|
| Variable | Estimate (β) | Standard error | P-value |
|---|
| Intercept | 108.8 | 33.3 | 0.014a |
| Percentage of
tumor/BW | −155.2 | 353.3 | 0.674 |
| Adipose mass
(g) | −6.3 | 5.0 | 0.250 |
|
| B,
Female |
|
|
Variable | Estimate
(β) | Standard
error | P-value |
|
|---|
| Intercept | −3.4 | 24.3 | 0.892 |
| Percentage of
tumor/BW | 821.5 | 176.1 | 0.003a |
| Adipose mass
(g) | 1.9 | 4.1 | 0.666 |
|
| C, OVX |
|
|
Variable | Estimate
(β) | Standard
error | P-value |
|
| Intercept | 29.2 | 65.8 | 0.671 |
| Percentage of
tumor/BW | 1029.3 | 567.8 | 0.113 |
| Adipose mass
(g) | −10.9 | 14.1 | 0.464 |
Discussion
Tumor and adipose mass as predictors
for severity of cancer cachexia
With the understanding that adiposity may predict
for survival in cachexia (5), the
primary aim of our study was to evaluate the role of adipose tissue
changes on outcomes of mice with C-26 adenocarcinoma-induced
cachexia. A Kaplan-Meier survival curve analysis was performed to
determine the time to incidence of cachexia (≥5% body weight loss).
We found that both female and OVX tumor mice developed cachexia
sooner than male tumor mice (Fig.
4A). One likely explanation for this finding may be related to
tumor mass, which was significantly correlated to the percentage of
body weight loss in mice, regardless of sex or ovariectomy
(Fig. 4B). Another possible
explanation for the earlier incidence of cachexia in female and OVX
tumor mice could be explained by low adipose mass as a predictor of
C-26-induced weight loss. We found that tumor mice having less
adipose mass (calculated through EchoMRI at day 8 post-inoculation,
before onset of cachexia) was associated with higher percentage of
adipose loss (Fig. 4C), but not the
percentage of body weight loss (data not shown), at the end of the
study. The discrepancy of findings between the percentage of
adipose loss and the percentage of body weight loss could be
explained by relatively minute changes in lean body mass masking
the pronounced adipose wasting observed (Fig. 1E and F). Corroborating the idea that
having more adipose mass may be protective in cancer cachexia, OVX
mice in the ApcMin/+ model were also
protected from body weight loss during cachexia due to their
transient weight gain after ovariectomy (29). The earlier onset of cachexia in
female and OVX tumor mice in our study may have had an impact on
their muscle function, as suggested by the trend of decreased
forelimb grip strength at the end of the study in comparison to
male tumor mice (Fig. 2E). It
should be noted that for 2 female and 2 OVX tumor mice euthanized
early due to signs of moribundity, final grip strength measurements
were not obtained.
To distinguish between the effects of tumor mass and
adipose mass on cachexia independently, we performed multiple
linear regression correlating these variables to the percentage of
adipose loss in mice (Table II and
Fig. 4D). We found a significant
effect of tumor mass on the percentage of adipose loss (P=0.022)
when adjusting for EchoMRI day 8 adipose mass (g). However, there
was weaker evidence (P=0.09) for the effect of EchoMRI day 8
adipose mass (g) on the percentage of adipose loss, when accounting
for tumor mass. A stratified analysis by sex/ovariectomy suggests
that it is the association in the female tumor group (and to a
lesser extent the OVX tumor group) that is driving the association
between tumor mass and adipose loss (Table III). However, ANOVA did not detect
a statistically significant interaction between sex/ovariectomy and
tumor mass in predicting adipose loss (P=0.064). To the best of our
knowledge, the impact of initial adipose mass predicting for weight
loss at the onset of cachexia studies in mice has not been
addressed. This is a fundamental question of the ‘obesity paradox’,
which postulates that excess adiposity may counterintuitively
confer survival in specific populations of individuals with chronic
diseases and cancer (8,9). To directly address whether having
excess adipose could improve outcomes of cancer cachexia, a future
study should evaluate mouse models of obesity in the C-26
adenocarcinoma and other models of cancer cachexia.
Effect of sex status in cancer
cachexia
The secondary aim of our study was to evaluate the
role of sex status on outcomes of mice with C-26
adenocarcinoma-induced cachexia. Many, but not all clinical studies
report a higher incidence of cancer cachexia in men than women
(10–13). Additionally, male cancer patients
lose weight at a faster rate than female patients, which
contributes to impaired quality of life and shorter survival time
after initial diagnosis (12,30–32).
These findings indicate that sex may play a role in cancer cachexia
development and progression. However, pre-clinical studies
elucidating sex differences in cancer cachexia are scarce (29,33,34). A
study using the C-26 model found that estrogen receptor signaling
in female mice was responsible for reducing the severity of cancer
cachexia in comparison to male mice (33). In the genetic
ApcMin/+ model of cancer cachexia,
lower circulating IL-6 was partially responsible for the reduced
severity of cancer cachexia in female mice, although the study did
not evaluate if estrogen was differentially regulating IL-6
function (34). Notably, the
initiation of acyclicity (e.g., loss of estrogen cycling) brought
on by cachexia, but not ovariectomy was a predictor of cachexia
severity in this mouse model (29).
In the present study, female and OVX tumor mice
experienced body weight loss (Fig.
1B) and muscle loss (Fig. 2A)
similar to male tumor mice, which is in contrast to other studies
showing less muscle wasting in female mice (29,33,34).
These previous studies did not observe a difference in tumor burden
between male and female mice, whereas we found that female tumor
mice had larger tumors when expressed as a percentage of their
necropsy body weight (Fig. 1C). One
possible explanation for this could be the tumor growth-promoting
effects of estrogen (35), although
to our knowledge, the sensitivity of C-26 cells to estrogen has not
been tested. Female and OVX tumor mice exhibited adipose loss
similar to male tumor mice; however, female tumor mice lost
significantly more adipose than OVX tumor mice (Fig. 1F). This observation could be
predicted by at least 2 factors associated with cachexia, e.g.,
higher tumor mass and lower adipose mass. Female tumor mice had
significantly smaller heart and spleen masses than male tumor mice
(Fig. 3B) at the end of the study;
this difference could possibly be attributed to initial body weight
differences and lower lean masses (measured through EchoMRI) in
female tumor mice at day 0 compared to male tumor mice (data not
shown). Quadriceps mRNA markers of proteolysis and apoptosis were
also similar between the 3 tumor groups. While Hetzler et al
observed lower plasma IL-6 in female mice of the
ApcMin/+ model of cancer cachexia
(34), we did not find differences
in plasma IL-6 between sexes of C-26 tumor-bearing mice (Fig. 3C). Moreover, we did not observe an
association between plasma IL-6 with body weight loss or tumor mass
in any of the tumor groups (data not shown). Plasma adiponectin was
significantly decreased in all 3 tumor groups in comparison to
their respective controls (Table
I); however, OVX tumor mice had significantly higher, while
male tumor mice and female tumor mice had significantly lower
adiponectin. However, we did not find any relationship between
plasma adiponectin with plasma IL-6 or body weight loss in the 3
tumor groups (data not shown). Overall, our results indicated that
female and OVX tumor mice respond to C-26-induced cachexia
similarly to their male counterparts.
Strengths and limitations
A major strength of this study is the extensive
characterization of male, female and OVX mouse response to C-26
cachexia by measuring key physiological outcomes beyond body weight
loss and tumor mass. These include measurements of body composition
and food intake over time, plasma markers, muscle fiber
cross-sectional area, and muscle grip strength. In addition, this
study utilized Kaplan-Meier survival curve analysis to elucidate
differences in progression of cachexia, as well as multiple linear
regression modeling to find key predictors (i.e., tumor mass and
adipose mass) of body wasting independent of sex and ovariectomy. A
limitation of the current study is that initial body weights of
female and OVX mice were not equal to that of males at the
beginning of the study, thus introducing body weight and adiposity
as a variable that may have influenced outcomes such as tumor mass.
Additionally, estrogen and testosterone levels were not measured in
this study, thus we could not extensively explore their influences
on skeletal muscle metabolism. As with other rodent models of
cancer cachexia, the C-26 model has its limitations. Foremost is
that the C-26 model is a xenograft model whereby tumor cells are
transplanted into mice, while human cancers arise from spontaneous
genetic mutations (36). Another
key difference is the timing and progression of cachexia, since
C-26 mice often develop cachexia rapidly within 3 weeks of
inoculation to achieve a final tumor mass up to 10% of body weight.
In contrast, humans generally develop cachexia over the span of
months, and have much smaller ratio of tumor to body weight burden.
Despite these limitations, the C-26 model currently remains a
useful and efficient model to study the pathogenesis of cancer
cachexia.
Overall, this study revealed that higher tumor mass
and lower adipose mass are key predictors of cancer cachexia in the
C-26 adenocarcinoma model. The role of sex status may be subtle as
female and OVX mice develop symptoms of C-26 adenocarcinoma-induced
cancer cachexia similarly to male mice. To directly address the
potential protective role of adipose mass in cancer cachexia, a
future study should assess outcomes of cancer cachexia in obese vs.
lean mice.
Acknowledgements
The authors acknowledge Brad Cotten for assistance
throughout the animal study and thank Erin Talbert for technical
support and scholarly discussions about the data.
Funding
This research was supported by NIHR21CA185140 and
support of TB on pre-doctoral fellowship NINDS T32NS077984-05.
Availability of data and materials
The data sets used during the current study are
available from the corresponding author on reasonable request.
Authors' contributions
TB and MAB contributed to the conception and design
of the study. TB, DS, RMC, and AA contributed to the collection of
data and generation of results. TB and PMS contributed to the
statistical analyses of the results. All authors contributed to the
interpretation of data and results. TB contributed to the majority
of manuscript writing and all authors critically revised it for
important intellectual content. All authors approved the final
manuscript to be published and agree to be accountable for all
aspects of the manuscript.
Ethics approval and consent to
participate
Experiments involving mice were approved by The Ohio
State University Institutional Animal Care and Use Committee.
Patient consent for publication
Not applicable.
Competing interests
The authors declare that they have no competing
interests.
Glossary
Abbreviations
Abbreviations:
|
C-26
|
colon-26
|
|
OVX
|
ovariectomized
|
|
RPMI
|
Roswell Park Memorial Institute
|
|
PBS
|
phosphate-buffered saline
|
|
CSA
|
cross-sectional area
|
|
OCT
|
optimal cutting temperature
|
|
H&E
|
hematoxylin and eosin
|
|
SEM
|
standard error of the mean
|
|
ANOVA
|
analysis of variance
|
|
UPS
|
ubiquitin proteasome system
|
References
|
1
|
Fearon K, Strasser F, Anker SD, Bosaeus I,
Bruera E, Fainsinger RL, Jatoi A, Loprinzi C, MacDonald N,
Mantovani G, et al: Definition and classification of cancer
cachexia: An international consensus. Lancet Oncol. 12:489–495.
2011. View Article : Google Scholar : PubMed/NCBI
|
|
2
|
Tisdale MJ: Cachexia in cancer patients.
Nat Rev Cancer. 2:862–871. 2002. View
Article : Google Scholar : PubMed/NCBI
|
|
3
|
Fouladiun M, Korner U, Bosaeus I, Danaeryd
P, Hyltander A and Lundholm KG: Body composition and time course
changes in regional distribution of fat and lean tissue in
unselected cancer patients on palliative care - correlations with
food intake, metabolism, exercise capacity, and hormones. Cancer.
103:2189–2198. 2005. View Article : Google Scholar : PubMed/NCBI
|
|
4
|
Dahlman I, Mejhert N, Linder K, Agustsson
T, Mutch DM, Kulyte A, Isaksson B, Permert J, Petrovic N,
Nedergaard J, et al: Adipose tissue pathways involved in weight
loss of cancer cachexia. Br J Cancer. 102:1541–1548. 2010.
View Article : Google Scholar : PubMed/NCBI
|
|
5
|
Di Sebastiano KM, Yang L, Zbuk K, Wong RK,
Chow T, Koff D, Moran GR and Mourtzakis M: Accelerated muscle and
adipose tissue loss may predict survival in pancreatic cancer
patients: The relationship with diabetes and anaemia. Br J Nutr.
109:302–312. 2013. View Article : Google Scholar : PubMed/NCBI
|
|
6
|
Ebadi M and Mazurak VC: Evidence and
mechanisms of fat depletion in cancer. Nutrients. 6:5280–5297.
2014. View Article : Google Scholar : PubMed/NCBI
|
|
7
|
Agustsson T, Ryden M, Hoffstedt J, van
Harmelen V, Dicker A, Laurencikiene J, Isaksson B, Permert J and
Arner P: Mechanism of increased lipolysis in cancer cachexia.
Cancer Res. 67:5531–5537. 2007. View Article : Google Scholar : PubMed/NCBI
|
|
8
|
Kalantar-Zadeh K, Horwich TB, Oreopoulous
A, Kovesdy CP, Younessi H, Anker SD and Morley JE: Risk factor
paradox in wasting diseases. Curr Opin Clin Nutr Metab Care.
10:433–442. 2007. View Article : Google Scholar : PubMed/NCBI
|
|
9
|
Martin L, Birdsell L, Macdonald N, Reiman
T, Clandinin MT, McCargar LJ, Murphy R, Ghosh S, Sawyer MB and
Baracos VE: Cancer cachexia in the age of obesity: Skeletal muscle
depletion is a powerful prognostic factor, independent of body mass
index. J Clin Oncol. 31:1539–1547. 2013. View Article : Google Scholar : PubMed/NCBI
|
|
10
|
Nakamura N, Hara T, Shibata Y, Matsumoto
T, Nakamura H, Ninomiya S, Kito Y, Kitagawa J, Kanemura N and Goto
N: Sarcopenia is an independent prognostic factor in male patients
with diffuse large B-cell lymphoma. Ann Hematol. 94:2043–2053.
2015. View Article : Google Scholar : PubMed/NCBI
|
|
11
|
Kim EY, Kim YS, Park I, Ahn HK, Cho EK and
Jeong YM: Prognostic significance of CT-determined sarcopenia in
patients with small-cell lung cancer. J Thorac Oncol. 10:1795–1799.
2015. View Article : Google Scholar : PubMed/NCBI
|
|
12
|
Wallengren O, Iresjo BM, Lundholm K and
Bosaeus I: Loss of muscle mass in the end of life in patients with
advanced cancer. Support Care Cancer. 23:79–86. 2015. View Article : Google Scholar : PubMed/NCBI
|
|
13
|
Masel EK, Berghoff AS, Fureder LM,
Heicappell P, Schlieter F, Widhalm G, Gatterbauer B, Dieckmann U,
Birner P, Bartsch R, et al: Decreased body mass index is associated
with impaired survival in lung cancer patients with brain
metastases: A retrospective analysis of 624 patients. Eur J Cancer
Care (Engl). 26:62017. View Article : Google Scholar
|
|
14
|
Karastergiou K, Smith SR, Greenberg AS and
Fried SK: Sex differences in human adipose tissues - the biology of
pear shape. Biol Sex Differ. 3:132012. View Article : Google Scholar : PubMed/NCBI
|
|
15
|
Carr MC: The emergence of the metabolic
syndrome with menopause. J Clin Endocrinol Metab. 88:2404–2411.
2003. View Article : Google Scholar : PubMed/NCBI
|
|
16
|
Aulino P, Perardi E, Cardillo VM, Rizzuto
E, Perniconi B, Ramina C, Padula F, Spugnini EP, Baldi A, Faiola F,
et al: Molecular, cellular and physiological characterization of
the cancer cachexia-inducing C26 colon carcinoma in mouse. BMC
Cancer. 10:3632010. View Article : Google Scholar : PubMed/NCBI
|
|
17
|
Strassmann G, Fong M, Kenney JS and Jacob
CO: Evidence for the involvement of interleukin 6 in experimental
cancer cachexia. J Clin Invest. 89:1681–1684. 1992. View Article : Google Scholar : PubMed/NCBI
|
|
18
|
Tisdale MJ: Mechanisms of cancer cachexia.
Physiol Rev. 89:381–410. 2009. View Article : Google Scholar : PubMed/NCBI
|
|
19
|
Murphy KT, Chee A, Trieu J, Naim T and
Lynch GS: Importance of functional and metabolic impairments in the
characterization of the C-26 murine model of cancer cachexia. Dis
Model Mech. 5:533–545. 2012. View Article : Google Scholar : PubMed/NCBI
|
|
20
|
Tian M, Asp ML, Nishijima Y and Belury MA:
Evidence for cardiac atrophic remodeling in cancer-induced cachexia
in mice. Int J Oncol. 39:1321–1326. 2011.PubMed/NCBI
|
|
21
|
Johns N, Stephens NA and Fearon KC: Muscle
wasting in cancer. Int J Biochem Cell Biol. 45:2215–2229. 2013.
View Article : Google Scholar : PubMed/NCBI
|
|
22
|
Kliewer KL, Ke JY, Tian M, Cole RM,
Andridge RR and Belury MA: Adipose tissue lipolysis and energy
metabolism in early cancer cachexia in mice. Cancer Biol Ther.
16:886–897. 2015. View Article : Google Scholar : PubMed/NCBI
|
|
23
|
Livak KJ and Schmittgen TD: Analysis of
relative gene expression data using real-time quantitative PCR and
the 2(-Delta Delta C(T)) method. Methods. 25:402–408. 2001.
View Article : Google Scholar : PubMed/NCBI
|
|
24
|
Silva KA, Dong J, Dong Y, Dong Y, Schor N,
Tweardy DJ, Zhang L and Mitch WE: Inhibition of Stat3 activation
suppresses caspase-3 and the ubiquitin-proteasome system, leading
to preservation of muscle mass in cancer cachexia. J Biol Chem.
290:11177–11187. 2015. View Article : Google Scholar : PubMed/NCBI
|
|
25
|
Zhou X, Wang JL, Lu J, Song Y, Kwak KS,
Jiao Q, Rosenfeld R, Chen Q, Boone T, Simonet WS, et al: Reversal
of cancer cachexia and muscle wasting by ActRIIB antagonism leads
to prolonged survival. Cell. 142:531–543. 2010. View Article : Google Scholar : PubMed/NCBI
|
|
26
|
Asp ML, Tian M, Kliewer KL and Belury MA:
Rosiglitazone delayed weight loss and anorexia while attenuating
adipose depletion in mice with cancer cachexia. Cancer Biol Ther.
12:957–965. 2011. View Article : Google Scholar : PubMed/NCBI
|
|
27
|
Talbert EE, Metzger GA, He WA and
Guttridge DC: Modeling human cancer cachexia in colon 26
tumor-bearing adult mice. J Cachexia Sarcopenia Muscle. 5:321–328.
2014. View Article : Google Scholar : PubMed/NCBI
|
|
28
|
Brochu-Gaudreau K, Rehfeldt C, Blouin R,
Bordignon V, Murphy BD and Palin MF: Adiponectin action from head
to toe. Endocrine. 37:11–32. 2010. View Article : Google Scholar : PubMed/NCBI
|
|
29
|
Hetzler KL, Hardee JP, LaVoie HA, Murphy
EA and Carson JA: Ovarian function's role during cancer cachexia
progression in the female mouse. Am J Physiol Endocrinol Metab.
312:E447–E459. 2017. View Article : Google Scholar : PubMed/NCBI
|
|
30
|
Palomares MR, Sayre JW, Shekar KC,
Lillington LM and Chelebowski RT: Gender influence on weight-loss
pattern and survival of nonsmall cell lung carcinoma patients.
Cancer. 78:2119–2126. 1996. View Article : Google Scholar : PubMed/NCBI
|
|
31
|
Kimura M, Naito T, Kenmotsu H, Taira T,
Wakuda K, Oyakawa T, Hisamatsu Y, Tokito T, Imai H, Akamatsu H, et
al: Prognostic impact of cancer cachexia in patients with advanced
non-small cell lung cancer. Support Care Cancer. 23:1699–1708.
2015. View Article : Google Scholar : PubMed/NCBI
|
|
32
|
Stephens NA, Gray C, MacDonald AJ, Tan BH,
Gallagher IJ, Skipworth RJ, Ross JA, Fearon KC and Greig CA: Sexual
dimorphism modulates the impact of cancer cachexia on lower limb
muscle mass and function. Clin Nutr. 31:499–505. 2012. View Article : Google Scholar : PubMed/NCBI
|
|
33
|
Cosper PF and Leinwand LA: Cancer causes
cardiac atrophy and autophagy in a sexually dimorphic manner.
Cancer Res. 71:1710–1720. 2011. View Article : Google Scholar : PubMed/NCBI
|
|
34
|
Hetzler KL, Hardee JP, Puppa MJ, Narsale
AA, Sato S, Davis JM and Carson JA: Sex differences in the
relationship of IL-6 signaling to cancer cachexia progression.
Biochim Biophys Acta. 1852:816–825. 2015. View Article : Google Scholar : PubMed/NCBI
|
|
35
|
McGuire WL, Horwitz KB, Chamness GC and
Zava DT: A physiological role for estrogen and progesterone in
breast cancer. J Steroid Biochem. 7:875–882. 1976. View Article : Google Scholar : PubMed/NCBI
|
|
36
|
Richmond A and Su Y: Mouse xenograft
models vs GEM models for human cancer therapeutics. Dis Model Mech.
1:78–82. 2008. View Article : Google Scholar : PubMed/NCBI
|