Introduction
Hepatocellular carcinoma (HCC) is a common and
serious malignant tumor of the liver (1,2). At
present, surgical resection and standardized treatments are unable
to reduce the high recurrence and metastasis rates of HCC (3). Thus, predicting the clinical outcomes of
patients with HCC is challenging (1,4). Numerous
studies have verified the role of various histological parameters
in predicting HCC prognosis (5–7);
therefore, a novel cancer classification system which uses
molecular markers to evaluate the prognosis of patients with HCC
should be developed.
Long noncoding RNAs (lncRNAs) can significantly
affect tumors via epigenetic regulation, transcription, mRNA
expression and other aspects involved in tumor biological activity
(8). They can interact with mRNAs or
microRNAs (miRNAs/miRs) in human cancers, thereby affecting their
expression. For example, lncRNA OIP5-antisense RNA (AS)1 interacts
with miR-186a to inhibit zinc finger E-box binding homeobox 1
expression in HCC, adversely affecting the tumor cell metastasis
(9). Additionally, lncRNA HOXA-AS2
regulates the NF-κB signaling activity to hinder endothelium
inflammation (10). LncRNA ROR1-AS1
can regulate certain diseases and biological activities; for
example, it can regulate the tumor development and cell
proliferation of mantle cell lymphoma (MCL) (11). Recent studies have identified ROR1-AS1
as capable of indicating the novel progression stage of colorectal
cancer as a biomarker (12,13); however, whether it can indicate the
progression of liver cancer as a specific marker requires further
investigation.
The present study aimed to determine the prognostic
significance of ROR1-AS1 in HCC. In this study, to assess the
potential prognostic role of ROR1-AS1 in patients with HCC and
evaluate the independent prognostic implication of its expression
for the overall survival (OS) of patients, retrospective analysis
was performed using tissue chip data and data from The Cancer
Genome Atlas Liver Hepatocellular Carcinoma (TCGA-LIHC) cohort.
Then, gene set enrichment analysis (GSEA) was conducted to acquire
insight into the ROR1-AS1 regulatory system-associated biological
functions and proteins. A total of 50 genes co-expressed with
ROR1-AS1 were predicted using Multi Experiment Matrix (MEM). Using
KO-Based Annotation System (KOBAS) and the Database for Annotation,
Visualization and Integrated Discovery (DAVID), cytological
pathways and behaviors with the closest association with HCC were
determined. Subsequently, genes identified using the aforementioned
three databases were integrated to screen for miRNAs, mRNAs and
lncRNAs co-expressed with ROR1-AS1. Cytoscape, the Search Tool for
the Retrieval of Interacting Genes/Proteins (STRING) and Molecular
Evolutionary Genetics Analysis (Mega) were used to build potential
regulatory networks, and evaluate the evolutionary development and
genetic distance between the ROR1-AS1-associated genes in this
network. Genes with the closest relationship with ROR1-AS1 were
identified, and their association was described using a Circos
plot. It was revealed that large (45 genes) and small (15 genes)
regulatory networks associated with lncRNA ROR1-AS1 were identified
in HCC, as well as a special regulatory network containing 12
genes.
Materials and methods
Data acquisition and collection
The data of patients with HCC mined from TCGA and
RNA sequencing (RNA-seq) expression results were downloaded using
the RTCGA Toolbox (version 3.5) package in R (version 3.5.3)
(14,15). Additionally, lncRNA ROR1-AS1 tumor
expression data were obtained from TCGA for other digestive tumors,
including bile duct, colon, esophagus, liver, pancreas and stomach.
The gene microarray dataset GSE54236 (16,17) was
downloaded from the GEO database (https://www.ncbi.nlm.nih.gov/geo/) (18). The data used in this article were
downloaded from the above databases in April 2019.
Statistical analyses
SPSS 23.0 software (IBM Corp.) was used for
statistical analysis of data. Boxplots were used for discrete
variables to measure differences in expression, and effects of
clinicopathological characteristics on lncRNA ROR1-AS1 expression
were analyzed using ANOVA; alterations in expression between each
group were demonstrated using scatter plots (19). χ2 tests were used to
examine the association between ROR1-AS1 expression and clinical
data. GraphPad Prism 7.0 software (GraphPad Software, Inc.) was
used to analyze the differential expression of ROR1-AS1 in
different tumor tissues. Scatter plots and histograms were used for
discrete variables to measure differences in expression between
different tissues, and effects of tumor tissue of origin on lncRNA
ROR1-AS1 expression were analyzed using the mean ± SD (20). Correlation coefficient analyses were
performed using R software (version 3.1.0) (21); a correlation coefficient R>0.5 was
considered to indicate a strong correlation. Receiver-operating
characteristic curves (ROC) were drawn using the p-ROC package
(version 1.0.3) to evaluate diagnostic ability (22); patients were divided into high and low
ROR1-AS1 expression groups by using the median value of ROR1-AS1
expression as the optimal cutoff. Kaplan-Meier curves were used to
compare differences in OS and relapse-free survival by using the
survival package in R (23).
Univariate proportional hazards model (Cox) analysis was used to
select the related variables. Then, multivariate Cox analysis was
applied to evaluate the influence of ROR1-AS1 expression on the OS
and relapse-free survival of patients (24).
GSEA
GSEA is a computational method that determines
whether an a priori defined set of genes shows statistically
significant, concordant differences between two biological states.
In this study, GSEA was performed by using the GSEA software 3.0
from the Broad Institute (25,26). The
gene expression data were RNA-seq data from TCGA-LIHC and GEO
databases. The gene set of ‘c2. cp.biocarta.v6.2.symbols.gmt’,
‘c3.cp.biocarta.v6.2.symbols.gmt’, ‘c5.cp.biocarta.v6.2.symbols.
gmt’ and ‘h.all.v6.2.symbols.gmt’, which summarizes and represents
specific, well-defined biological states or processes, was
downloaded from the Molecular Signatures Database (http://software.broadinstitute.org/gsea/msigdb/index.jsp)
(27). The normalized enrichment
score was acquired by analyzing with permutations for 1,000 times.
A gene set is considered to be significantly enriched with normal
P<0.05 and false discovery rate (FDR) <0.25.
Gene enrichment and functional
annotation evaluation
DAVID (http://david.abcc.ncifcrf.gov/), STRING (https://string-db.org/) and KOBAS (http://kobas.cbi.pku.edu.cn/) were used to conduct
relevant pathway analysis (28),
including Gene Ontology (GO) term enrichment (29,30), and
Kyoto Encyclopedia of Genes and Genomes (KEGG) pathway analysis
(31–33), which were performed for the functional
annotation of the co-expressed genes (34). Three GO terms (‘biological process’,
‘cellular component’ and ‘molecular function’) were utilized to
identify the enrichment of target genes. GO terms and KEGG pathways
with P<0.05 were considered statistically significant. The
enrichment map of annotation analysis was drawn using Cytoscape
version 3.3.1 (http://www.cytoscape.org/cy3.html) (35).
Prediction of related genes
MEM (https://biit.cs.ut.ee/mem/) contains a large
collection of microarray datasets. Using simultaneous statistical
significance estimation, MEM applies rank aggregation to merge
information from different data sets into a single global ordering
(36). In MEM, the output option for
each probe was set to 1,694, which were comprised 100 data sets,
and the resulting similar genes were then exported. Genes that were
present in at least two probe groups were selected. cBioPortal
(http://www.cbioportal.org/index.do)
incorporates data from 126 tumor genome research projects,
including TCGA, International Cancer Genome Consortium and other
large tumor research projects (35).
The co-expression analysis module of MEM was used to extract genes
that are co-expressed with lncRNA ROR1-AS1; co-expressed genes are
defined as genes associated with ROR1-AS1 expression. The
associated genes that were identified by MEM and data from GEO were
subjected to gain Circos plots. Circos plots were generated based
on the remappings of two tables from these two tools. Circos plots
were generated using the Circos visualization tool in R (version
3.5.3) (15,37,38).
Weighted gene co-expression network
analysis (WGCNA)
WGCNA (version 1.67) (34,39)
(conducted using the WGCNA package in R) elucidates the
higher-order relationships between genes based on their
co-expression relationships, delineating modules of biologically
related genes and permitting a robust view of transcriptome
organization (40). For WGCNA, the R
package DCGL (version 2.1.2) (41)
was used to filter genes; genes with FPKM values >0.85 were
selected for further analysis. The adjacency matrix between
different genes was constructed with 3 as the parameter of soft
thresholding power to reduce noise and false correlation. A network
was created from these data, first by calculating weighted Pearson
correlation matrices corresponding to gene expression, then by
following the standard procedure of WGCNA to create the holistic
network. Briefly, weighted correlation matrices were transformed
into matrices of connection strengths using a power function
(34). These connection strengths
were then used to calculate topological overlap, a robust and
biologically meaningful measurement that encapsulates the three
different genes' co-expression relationships in the network
(42).
Mega
Phylogenetic Tree and Sequence Analysis Ago protein
sequences were downloaded from the GenBank database of NONCODE
(http://www.noncode.org/) and NCBI (https://www.ncbi.nlm.nih.gov/) (43). A multiple-sequence alignment was
performed based on the PIWI domain using ClustalW software (version
2.1) (44). The phylogenetic tree was
constructed using MEGA X (https://www.megasoftware.net/) based on the
neighbor-joining method with a bootstrap value of 1,000 replicates
(45).
Genome map
After integrating the gene expression data of
patients with HCC from the three databases, the correlation
coefficient between different genes and ROR1-AS1 was calculated (as
described in the Statistical analyses section), and a Venn diagram
was constructed in GraphPad Prism 7 using the calculated results
(46) to validate the reliability of
the results obtained via co-expression analysis. Alignments of gene
co-expression maps to GRCh38.95 (reference genome version of Homo
sapiens) (47) (ftp://ftp.ncbi.nlm.nih.gov/genomes/all/GCA_000001405.15_GRCh38.95)
identified reference genomic regions contributing to the
composition of 12 genome sets (the location of the genes of
interest in the human reference genome). In order to find the most
represented reference fragments, all GRCh38.95 loci present in the
gene co-expression maps were deduced and merged, resulting in 12
reference donor fragments, which settled in the outermost track.
The number of gene-regulated maps containing each of these fragment
labels were then marked in the second track, excluding duplicate
counts. In the inner sector, pairs of gene sets that exhibited
regulation relationships were linked. The sum of the genome map
alignments across the whole genome was used to link the 12 gene
regulatory maps in the Circos plot.
Results
Patients' characteristics
Both gene expression and clinical data of patients
with liver cancer were downloaded from TCGA database. The total
number of patients was 427. After the initial screening, 13 normal
samples and 77 tumor samples without a specific lncRNA record or
too much unclear information were removed, and the remaining 300
tumor samples and 37 normal samples were included. The detailed
clinical characteristics are presented in Table I, including age, gender, TNM stage,
survival status, pathological status and ethnic compositions.
 | Table I.Demographic and clinical
characteristics of TCGA-LIHC cohort (n=300). |
Table I.
Demographic and clinical
characteristics of TCGA-LIHC cohort (n=300).
|
Characteristics | Number | Percentage (%) |
|---|
| Age (years) |
|
|
|
≤55 | 105 | 35.00 |
|
>55 | 195 | 65.00 |
| Gender |
|
|
|
Female | 90 | 30.00 |
|
Male | 210 | 70.00 |
| T stage |
|
|
| T1 | 151 | 50.34 |
| T2 | 75 | 25.00 |
| T3 | 63 | 21.00 |
| T4 | 10 | 3.33 |
|
Unknown | 1 | 0.33 |
| M stage |
|
|
| M0 | 227 | 75.67 |
| M1 | 2 | 0.66 |
| Mx | 71 | 23.67 |
| N stage |
|
|
| N0 | 217 | 72.33 |
| N1 | 3 | 0.99 |
| Nx | 80 | 26.67 |
| Stage |
|
|
| I | 151 | 50.34 |
| II | 73 | 24.33 |
|
III | 72 | 24.00 |
| IV | 4 | 1.33 |
| Histologic
grade |
|
|
| G1 | 42 | 14.00 |
| G2 | 145 | 48.33 |
| G3 | 101 | 33.67 |
| G4 | 12 | 4.00 |
| Vital status |
|
|
|
Survival | 217 | 72.33 |
|
Death | 83 | 27.67 |
| Race |
|
|
|
Asian | 148 | 49.33 |
| Of
African descent | 8 | 2.67 |
|
Caucasian | 138 | 46.00 |
|
Unknown | 6 | 2.00 |
| ROR1-AS1
expression |
|
|
| High
expression | 219 | 73.00 |
| Low
expression | 81 | 27.00 |
| Total | 300 | 100.0 |
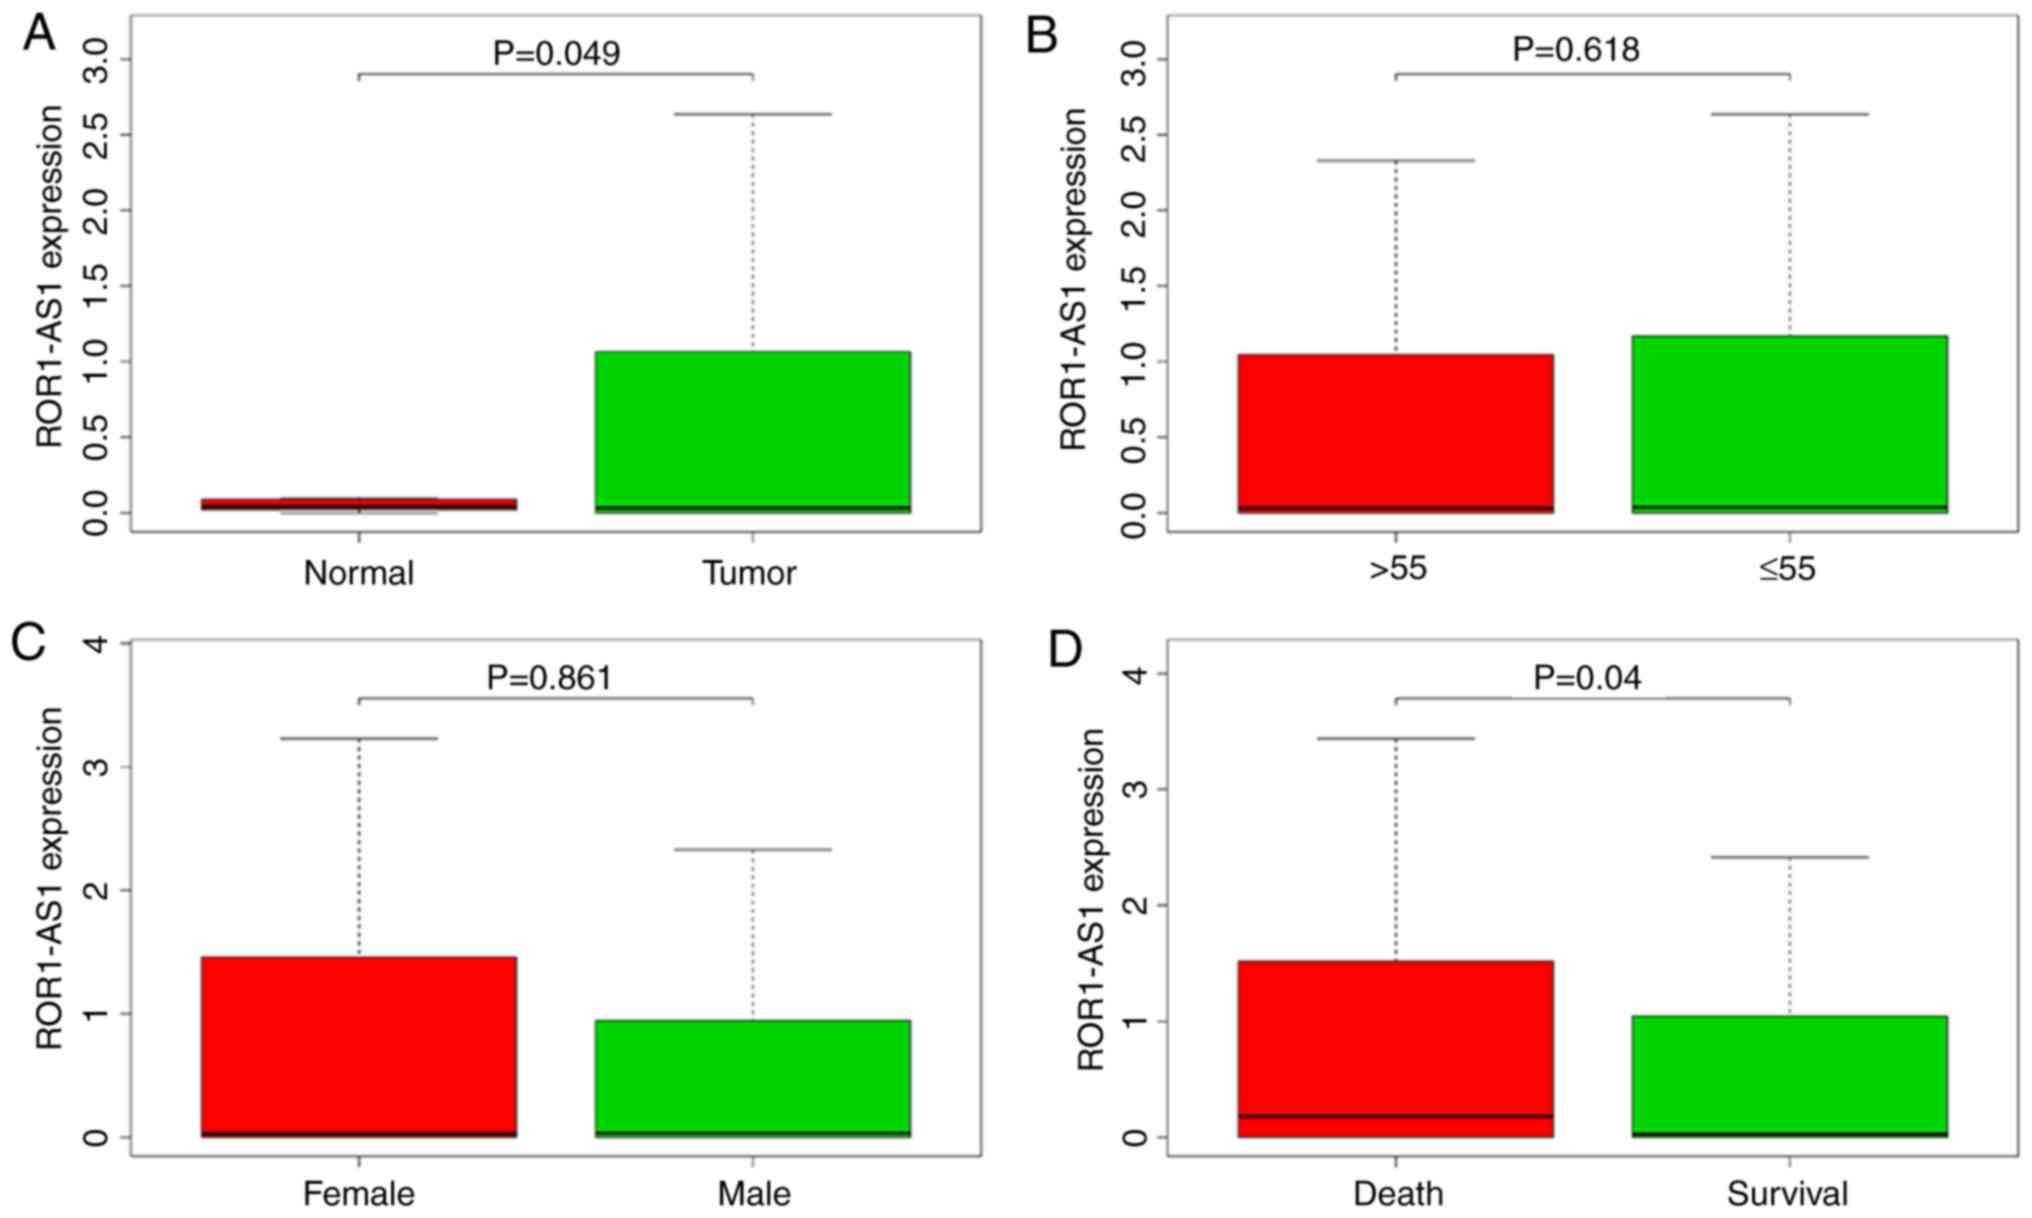
High ROR1-AS1 expression in HCC
Using boxplots, the differences in ROR1-AS1
expression in patients with liver cancer and healthy individuals
were ascertained. As presented in Fig.
1, the overall expression trend of ROR1-AS1 in liver cancer was
evaluated, and it was found that ROR1-AS1 expression was
significantly higher in primary HCC tissues compared with in normal
liver tissues (P=0.049; Fig. 1A).
Moreover, there were also differences in ROR1-AS1 expression based
on vital status (P=0.040; Fig. 1D),
clinical stage (P=0.007; Fig. 1E) and
T stage (P=0.001; Fig. 1F). No
significant differences in ROR1-AS1 expression were observed based
on patient age and the N&M stage, gender, race and
clinicopathological parameters (Fig.
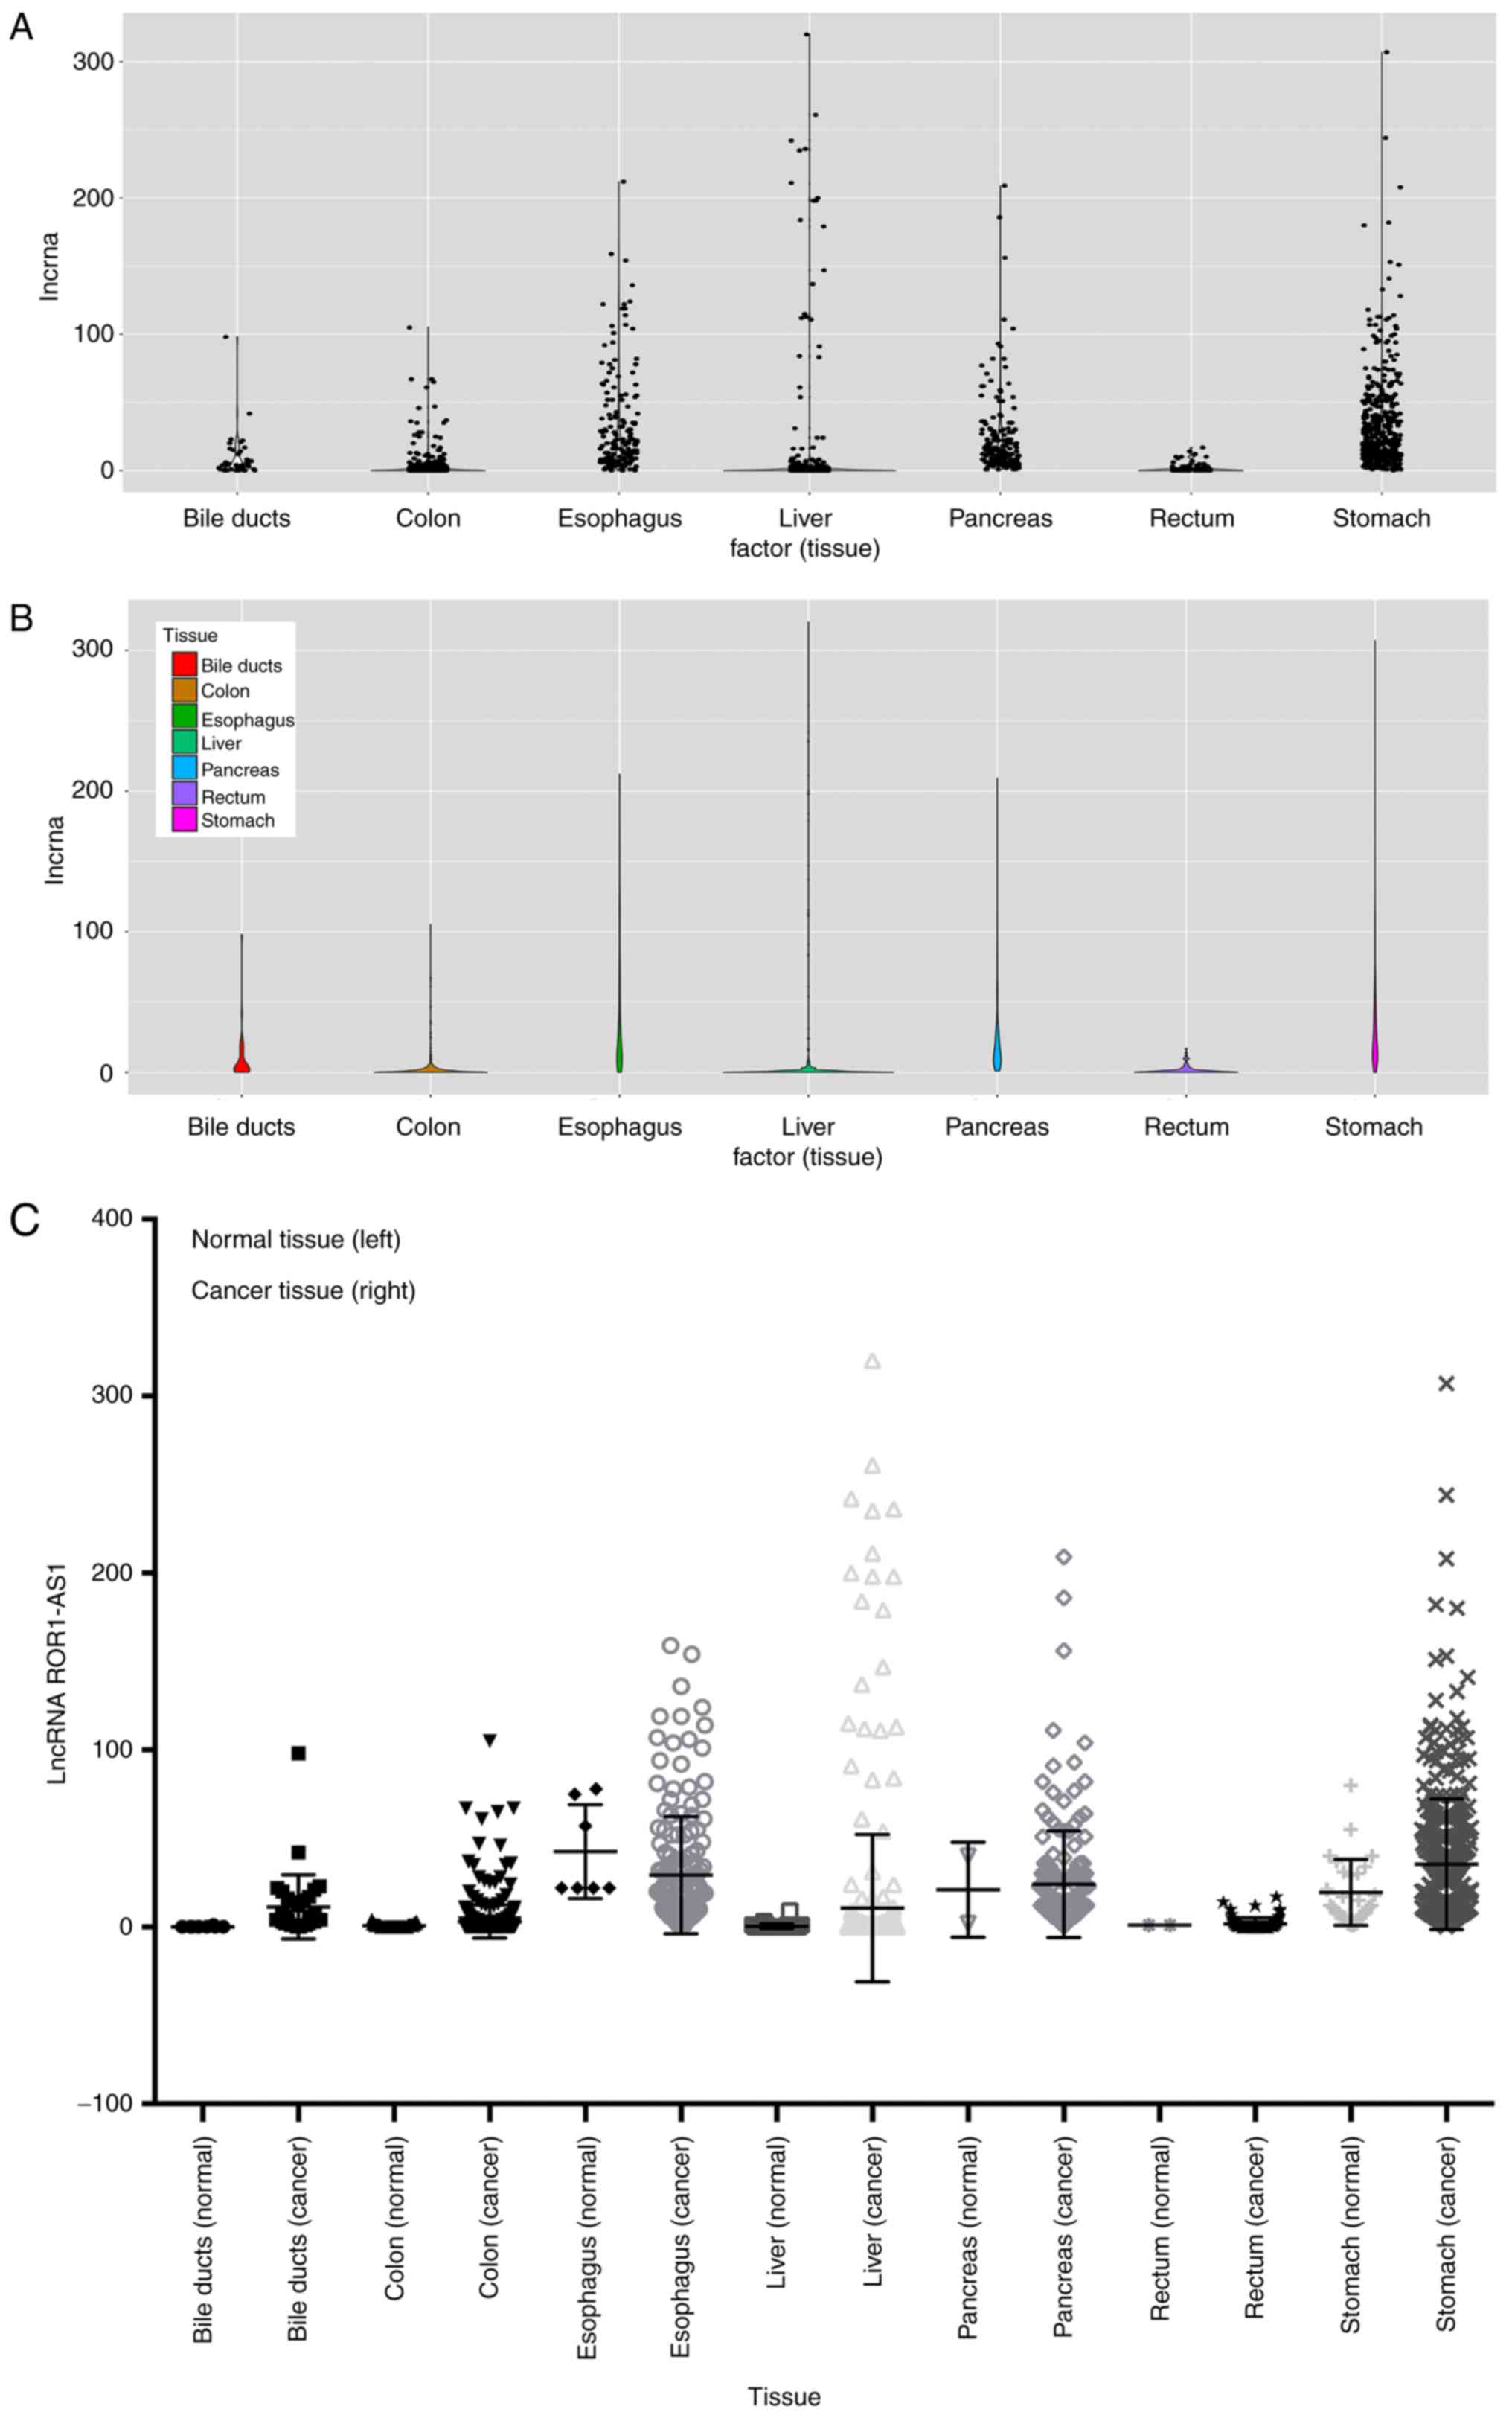
1). Data on ROR1-AS1 expression in several common digestive
tumors were also collected based on TCGA database (Fig. 2A and B). After horizontal comparison,
it was found that except for esophageal cancer, ROR1-AS1 expression
was upregulated in most digestive system tumors (Fig. 2C). This was clearer for liver,
pancreatic and stomach cancer.
Relationship between ROR1-AS1
expression and clinical features in HCC
Using χ2 tests, associations between
clinicopathological features and ROR1-AS1 expression were
evaluated, as presented in Table II.
ROR1-AS1 expression was significantly associated with clinical
stage (χ2=9.763, P=0.002), T stage
(χ2=13.198, P<0.001) and N stage
(χ2=3.887, P=0.049).
| Table II.Associations between lncRNA ROR1-AS1
expression in hepatocellular carcinoma tissue and clinicopathologic
variables. |
Table II.
Associations between lncRNA ROR1-AS1
expression in hepatocellular carcinoma tissue and clinicopathologic
variables.
|
|
|
| LncRNA ROR1-AS1
expression |
|
|
|---|
|
|
|
|
|
|
|
|---|
| Clinical
characteristics | Variables | Number of
patients | High | Low | χ2 | P-value |
|---|
| Age (years) | ≤55 | 105 | 45 | 60 | 3.297 | 0.069 |
|
| >55 | 195 | 105 | 90 |
|
|
| Gender | Female | 90 | 45 | 45 | 0.000 | >0.999 |
|
| Male | 210 | 105 | 105 |
|
|
| Grade | G1/2 | 187 | 92 | 95 | 0.128 | 0.721 |
|
| G3/4 | 113 | 58 | 55 |
|
|
| Stage | Stage I/II | 262 | 122 | 140 | 9.763 | 0.002a |
|
| Stage III/IV | 38 | 28 | 10 |
|
|
| T stage | T1/2 | 227 | 100 | 127 | 13.198 |
<0.001a |
|
| T3/4 | 73 | 50 | 23 |
|
|
| M stage | M0 | 227 | 113 | 114 | 0.001 | 0.995 |
|
| M1 | 2 | 1 | 1 |
|
|
|
| Mx (Not
included) | 71 | 36 | 35 |
|
|
| N stage | N0 | 217 | 103 | 114 | 3.887 | 0.049a |
|
| N1 | 3 | 2 | 1 |
|
|
|
| Nx (Not
included) | 80 | 47 | 35 |
|
|
| Vital status | Survival | 217 | 103 | 114 | 2.015 | 0.156 |
|
| Death | 83 | 47 | 36 |
|
|
| Race | Asian | 148 | 72 | 76 | 4.144 | 0.126 |
|
| Of African
descent | 8 | 5 | 3 |
|
|
|
| Caucasian | 138 | 71 | 67 |
|
|
|
| Unknown (not
included) | 6 | N/A | N/A |
|
|
High ROR1-AS1 expression as an
independent prognostic factor for poor survival
Kaplan-Meier curves of OS were plotted, and log-rank
tests revealed that high ROR1-AS1 expression was associated with
poor OS (P=0.046; Fig. 3A). Further
subgroup analysis showed that ROR1-AS1 high expression was
associated with poor OS in male patients (P=0.036; Fig. 3D), and patients at advanced T stage
(T3/4; P=0.040; Fig. 3G), N0 stage
(P=0.0097; Fig. 3I), age ≤55
(P=0.044; Fig. 3J) and early
pathological stage (G1/2; P=0.044; Fig.
3L), and of Other race (Of African Descent and Caucasian)
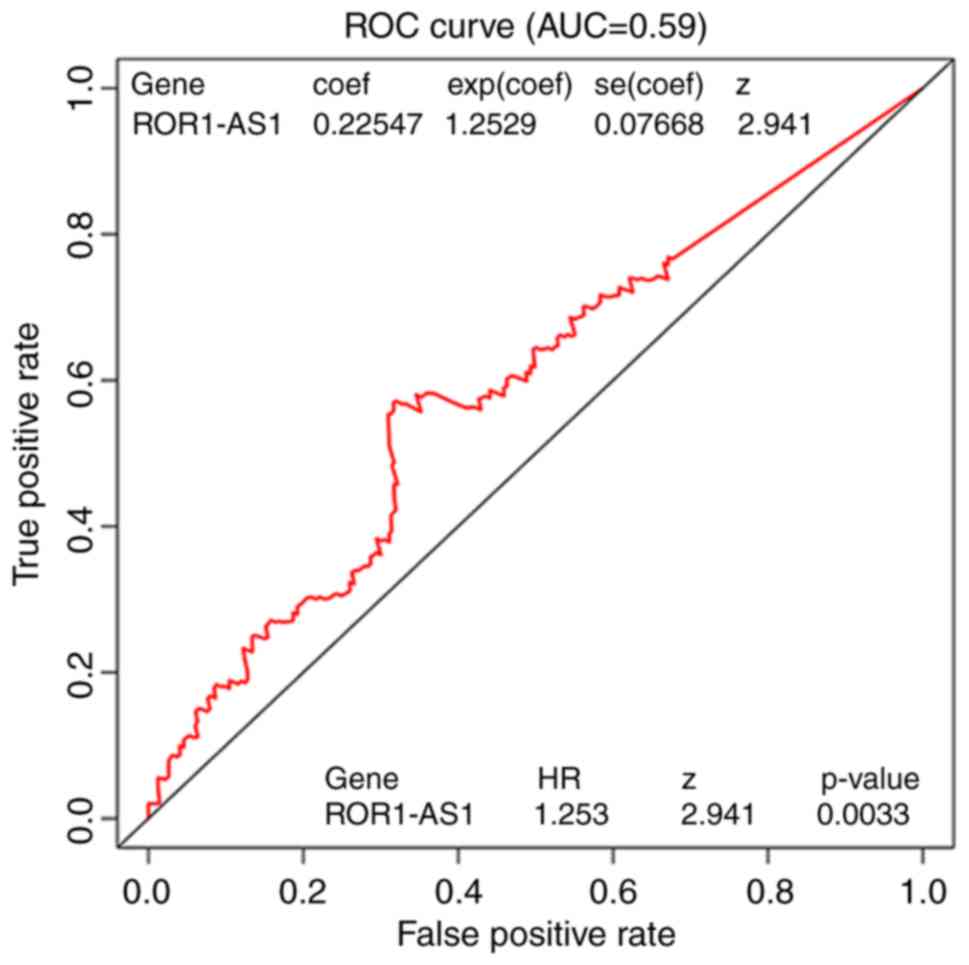
(P=0.049; Fig. 3O). As presented in
Fig. 4, ROC analysis of ROR1-AS1 was
performed, and the area under the curve value was 0.59, indicating
moderate diagnostic ability. In patients with high ROR1-AS1
expression, critical variables (age, gender, clinical stage,
pathological grade and TMN classification) were selected by
univariate analysis. Multivariate analysis with the Cox
proportional hazards model indicated that T classification
(HR=2.258, P=0.039), M classification (HR=2.450, P=0.011) and N
classification (HR=1.724, P<0.001) were independent prognostic
factors for patients with HCC (Table
III).
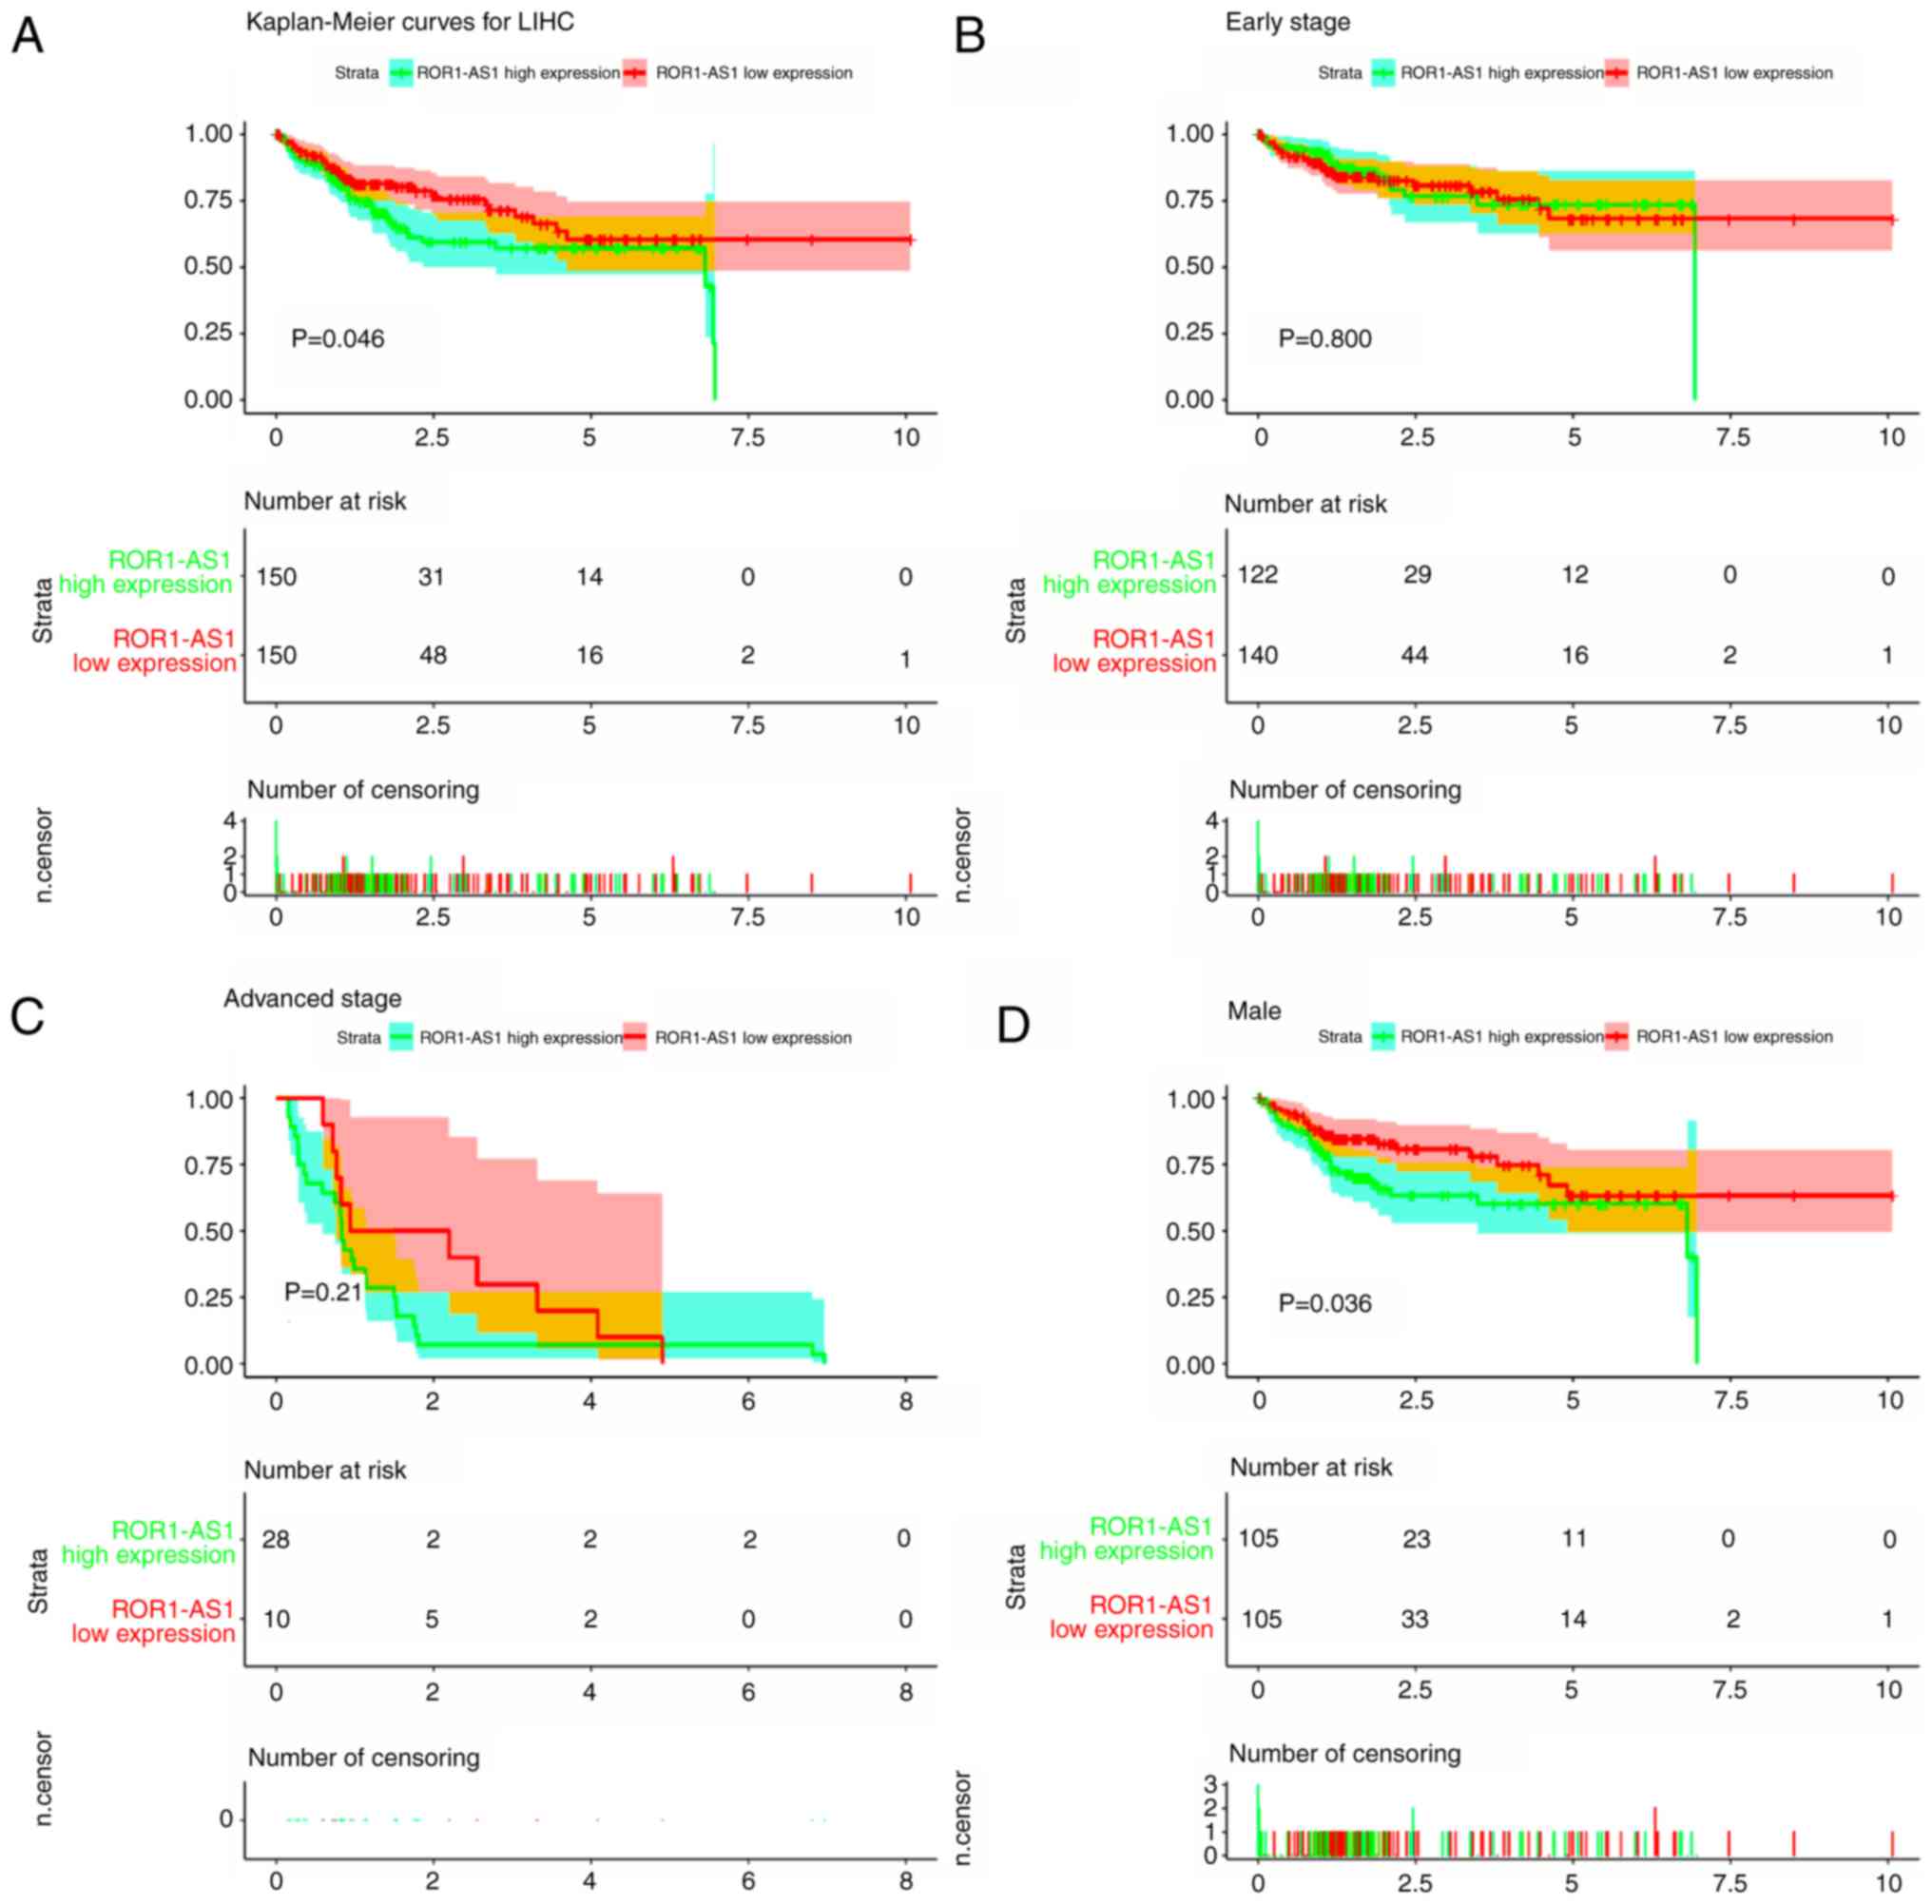 | Figure 3.Kaplan-Meier curves for survival of
patients with HCC according to ROR1-AS1 expression in HCC tissues.
Green and red curves denote ROR1-AS1 high- and low-expression
groups respectively. The ordinal (y-axis) indicates the percentage
of survival, the abscissa (x-axis) represents survival years, and
the number of survivors at the corresponding time. Censoring
samples are shown as ‘+’ marks. Kaplan-Meier curves and performance
of stratification analysis by (A) overall expression, (B) early
clinical stage and (C) advanced clinical stage, expression in (D)
males and (E) females, expression in patients with (F) early T
stage and (G) advanced T stage, (H) M0 stage, (I) N0 stage,
patients aged (J) ≤55 and (K) >55 years, according to (L) early
pathological status and (M) advanced pathological status, and in
patients from (N) Asian and (O) other races. ROR1-AS1, tyrosine
protein kinase transmembrane receptor 1 antisense RNA. Kaplan-Meier
curves for survival of patients with HCC according to ROR1-AS1
expression in HCC tissues. Green and red curves denote ROR1-AS1
high- and low-expression groups respectively. The ordinal (y-axis)
indicates the percentage of survival, the abscissa (x-axis)
represents survival years, and the number of survivors at the
corresponding time. Censoring samples are shown as ‘+’ marks.
Kaplan-Meier curves and performance of stratification analysis by
(A) overall expression, (B) early clinical stage and (C) advanced
clinical stage, expression in (D) males and (E) females, expression
in patients with (F) early T stage and (G) advanced T stage, (H) M0
stage, (I) N0 stage, patients aged (J) ≤55 and (K) >55 years,
according to (L) early pathological status and (M) advanced
pathological status, and in patients from (N) Asian and (O) other
races. ROR1-AS1, tyrosine protein kinase transmembrane receptor 1
antisense RNA. Kaplan-Meier curves for survival of patients with
HCC according to ROR1-AS1 expression in HCC tissues. Green and red
curves denote ROR1-AS1 high- and low-expression groups
respectively. The ordinal (y-axis) indicates the percentage of
survival, the abscissa (x-axis) represents survival years, and the
number of survivors at the corresponding time. Censoring samples
are shown as ‘+’ marks. Kaplan-Meier curves and performance of
stratification analysis by (A) overall expression, (B) early
clinical stage and (C) advanced clinical stage, expression in (D)
males and (E) females, expression in patients with (F) early T
stage and (G) advanced T stage, (H) M0 stage, (I) N0 stage,
patients aged (J) ≤55 and (K) >55 years, according to (L) early
pathological status and (M) advanced pathological status, and in
patients from (N) Asian and (O) other races. ROR1-AS1, tyrosine
protein kinase transmembrane receptor 1 antisense RNA. Kaplan-Meier
curves for survival of patients with HCC according to ROR1-AS1
expression in HCC tissues. Green and red curves denote ROR1-AS1
high- and low-expression groups respectively. The ordinal (y-axis)
indicates the percentage of survival, the abscissa (x-axis)
represents survival years, and the number of survivors at the
corresponding time. Censoring samples are shown as ‘+’ marks.
Kaplan-Meier curves and performance of stratification analysis by
(A) overall expression, (B) early clinical stage and (C) advanced
clinical stage, expression in (D) males and (E) females, expression
in patients with (F) early T stage and (G) advanced T stage, (H) M0
stage, (I) N0 stage, patients aged (J) ≤55 and (K) >55 years,
according to (L) early pathological status and (M) advanced
pathological status, and in patients from (N) Asian and (O) other
races. ROR1-AS1, tyrosine protein kinase transmembrane receptor 1
antisense RNA. |
| Table III.Univariate and multivariate analyses
of high lncRNA ROR1-AS1 expression in patients with liver
cancer. |
Table III.
Univariate and multivariate analyses
of high lncRNA ROR1-AS1 expression in patients with liver
cancer.
|
| Univariate
analysis | Multivariate
analysis |
|---|
|
|
|
|
|---|
| Parameters | HR | 95% CI | P-value | HR | 95% CI | P-value |
|---|
| Age, years (≤55 vs.
>55) | 1.022 | 0.994–1.05 | 0.132 |
|
|
|
| Gender (female vs.
male) | 1.002 | 0.517–1.943 | 0.995 |
|
|
|
| Race (Asian vs. of
African descent vs. Caucasian) | 0.669 | 0.432–1.038 | 0.073 |
|
|
|
| Grade (G1 vs. G2
vs. G3 vs. G4) | 0.868 | 0.561–1.343 | 0.524 | 0.899 | 0.815–1.129 | 0.736 |
| Stage (Stage I vs.
II vs. III vs. IV) | 0.804 | 0.259–2.492 | 0.705 | 0.935 | 0.472–2.247 | 0.638 |
| T stage (T1 vs. T2
vs. T3 vs. T4) | 2.899 | 1.039–8.095 | 0.042a | 2.258 | 1.638–3.113 | 0.039a |
| M stage (M0 vs.
M1) | 2.450 | 1.443–4.159 | 0.011a |
|
|
|
| N stage (N0 vs.
N1) | 1.724 | 1.441–2.189 |
<0.001a |
|
|
|
GSEA identifies ROR1-AS1-related
biological functions and proteins
To identify biological functions activated in liver
cancer, data from 161 tissue chips in the GEO database were
screened (GSE54236; Fig. S1). GSEA
between high and low ROR1-AS1 expression data sets was conducted.
GSEA revealed significant differences (FDR <0.25, P<0.05) in
the enrichment of ‘MSigDB Collection’, and the specific contents
are presented in Tables IV and
V. In HCC, the expression profiles of
patients with high ROR1-AS1 expression were significantly enriched
with the following GO terms: Cytosolic ribosome, cell substrate
junction, integrin binding, positive regulation of Wnt signaling
pathway, regulation of establishment of planar polarity, negative
regulation of development, nonmotile primary cilium assembly,
protein kinase A catalytic subunit binding and signal transduction
in absence of ligand (Table IV).
Analysis of TCGA data revealed a significant positive effect of
tumor grade and clinical stage on ROR1-AS1 expression (Fig. 1E and F), and there was a positive
regulatory relationship between the expression levels of epidermal
growth factor receptor, placental growth factor, leukotriene E2 and
ERB2 (Table V). Conversely, a
negative regulatory relationship was identified between the
expression levels of ROR1-AS1, and those of P53, JNK and Janus
kinase 2. Meanwhile, the expression levels of E2F1, lymphoid
enhancer binding factor 1, mTOR, activating transcription factor 2,
RAF and downstream signaling pathways activated by cAMP were only
initially positively associated with elevated expression of
ROR1-AS1; as ROR1-AS1 continued to increased, these genes exhibited
a negative expression relationship (Table
V).
| Table IV.LncRNA ROR1-AS1 high
expression-associated GO terms and KEGG pathways in hepatocellular
carcinoma. |
Table IV.
LncRNA ROR1-AS1 high
expression-associated GO terms and KEGG pathways in hepatocellular
carcinoma.
| A, KEGG
pathways |
|---|
|
|---|
| Term | Size | ES | NES | NOM P-value |
|---|
|
KEGG_ACUTE_MYELOID_LEUKEMIA | 57 | 0.32575217 | 1.174568 | 0.27732792 |
|
KEGG_ALLOGRAFT_REJECTION | 37 | 0.33567113 | 0.7853709 | 0.69214875 |
|
KEGG_AMINO_SUGAR_AND_NUCLEOTIDE_SUGAR_METABOLISM | 44 | 0.21193676 | 0.7724282 | 0.7308448 |
|
KEGG_ARACHIDONIC_ACID_METABOLISM | 54 | 0.29082343 | 0.84411997 | 0.6816406 |
|
KEGG_ARRHYTHMOGENIC_RIGHT_VENTRICULAR_CARDIOMYOPATHY_ARVC | 74 | 0.38242388 | 1.1008065 | 0.32595575 |
| KEGG_ASTHMA | 30 | 0.4253977 | 1.035566 | 0.41453832 |
|
KEGG_AXON_GUIDANCE | 129 | 0.38427946 | 1.4202099 | 0.03307393 |
|
KEGG_BASAL_CELL_CARCINOMA | 55 | 0.47928926 | 1.3821044 | 0.058252428 |
|
KEGG_BLADDER_CANCER | 42 | 0.36261615 | 1.1552858 | 0.28235295 |
|
KEGG_CELL_ADHESION_MOLECULES_CAMS | 132 | 0.30416217 | 0.9411326 | 0.532 |
|
KEGG_CELL_CYCLE | 123 | 0.15106098 | 0.42698383 | 0.9573643 |
|
KEGG_CHEMOKINE_SIGNALING_PATHWAY | 186 | 0.39880365 | 1.3102372 | 0.14285715 |
|
KEGG_CHRONIC_MYELOID_LEUKEMIA | 73 | 0.30524614 | 1.1764947 | 0.2647059 |
|
KEGG_COLORECTAL_CANCER | 62 | 0.37809 | 1.325293 | 0.14285715 |
|
KEGG_COMPLEMENT_AND_COAGULATION_CASCADES | 68 | 0.30028233 | 0.8569669 | 0.6302187 |
|
KEGG_CYTOKINE_CYTOKINE_RECEPTOR_INTERACTION | 257 | 0.37159464 | 1.1011451 | 0.31853282 |
|
KEGG_DILATED_CARDIOMYOPATHY | 90 | 0.42610824 | 1.1813916 | 0.2446184 |
|
KEGG_DORSO_VENTRAL_AXIS_FORMATION | 24 | 0.2639202 | 0.7730944 | 0.8376238 |
|
KEGG_ECM_RECEPTOR_INTERACTION | 84 | 0.5676372 | 1.5391657 | 0.03420523 |
|
KEGG_ENDOCYTOSIS | 180 | 0.2655919 | 1.3141135 | 0.10337972 |
|
| B, GO
terms |
|
| Term | Size | ES | NES | NOM
P-value |
|
|
GO_POSITIVE_REGULATION_OF_CANONICAL_WNT_SIGNALING_PATHWAY | 117 | 0.5034494 | 2.0831583 | 0 |
|
GO_CYTOSOLIC_RIBOSOME | 110 | 0.5240906 | 2.074979 | 0.006160164 |
|
GO_TRANSLATIONAL_INITIATION | 143 | 0.44866154 | 2.0731091 | 0.01002004 |
|
GO_NUCLEAR_TRANSCRIBED_MRNA_CATABOLIC_PROCESS_NONSENSE_MEDIATED_DECAY | 118 | 0.45694864 | 2.0709035 | 0.004056795 |
|
GO_REGULATION_OF_ESTABLISHMENT_OF_PLANAR_POLARITY | 108 | 0.4920704 | 2.0078113 | 0.002109705 |
|
GO_CYTOSOLIC_LARGE_RIBOSOMAL_SUBUNIT | 59 | 0.551799 | 1.9801823 | 0.003984064 |
|
GO_ESTABLISHMENT_OF_PROTEIN_LOCALIZATION_TO_ENDOPLASMIC_RETICULUM | 104 | 0.500903 | 1.9766974 | 0.004024145 |
|
GO_POSITIVE_REGULATION_OF_WNT_SIGNALING_PATHWAY | 149 | 0.4659426 | 1.9148449 | 0 |
|
GO_CELL_SUBSTRATE_JUNCTION | 396 | 0.4012108 | 1.8526521 | 0.009708738 |
|
GO_PROTEIN_TARGETING_TO_MEMBRANE | 156 | 0.33212492 | 1.8498257 | 0.021956088 |
| GO_U1_SNRNP | 17 | 0.5754599 | 1.8482453 | 0.012244898 |
|
GO_CYTOSOLIC_SMALL_RIBOSOMAL_SUBUNIT | 43 | 0.5705049 | 1.8452722 | 0.007677543 |
|
GO_MULTI_ORGANISM_METABOLIC_PROCESS | 137 | 0.3726918 | 1.8385631 | 0.022821577 |
|
GO_NON_CANONICAL_WNT_SIGNALING_PATHWAY | 137 | 0.44534308 | 1.8334067 | 0 |
|
GO_NEGATIVE_REGULATION_OF_EMBRYONIC_DEVELOPMENT | 25 | 0.7196995 | 1.8151437 | 0 |
|
GO_CYTOSOLIC_PART | 217 | 0.34144697 | 1.7857713 | 0.013461539 |
|
GO_NONMOTILE_PRIMARY_CILIUM_ASSEMBLY | 22 | 0.662353 | 1.7724643 | 0.002066116 |
|
GO_PROTEIN_KINASE_A_CATALYTIC_SUBUNIT_BINDING | 15 | 0.642496 | 1.7654687 | 0.012 |
|
GO_INTEGRIN_BINDING | 105 | 0.56900364 | 1.7639837 | 0.002 |
|
GO_SIGNAL_TRANSDUCTION_IN_ABSENCE_OF_LIGAND | 32 | 0.51555276 | 1.7639508 | 0.004366812 |
| Table V.Altered gene expression in patients
with high lncRNA ROR1-AS1 expression as determined via GSEA. |
Table V.
Altered gene expression in patients
with high lncRNA ROR1-AS1 expression as determined via GSEA.
| Expression
change | Gene names |
|---|
| Decreased
expression | STK33, P53,
CRX-NRL, SNF5, EIF4E, JNK, CRX, NRL, JAK2, PKCA, YAP1 |
| Increased
expression | EGFR, PIGF, TBK1,
LTE2, ESC, LEF1, ERB2, MEK, GLI1, TGFB, RAF, PRC2, AKT, BCAT, E2F3,
Cyclin D1, GCNP |
| First increased
then decreased | RAF, mTOR, ATF2,
LET1, E2F1, CSR, VEGF, IL2, SRC, MYC, MEK, IL15, PDGF, TGFB,
WNT |
| First decreased
then increased | P53, KRAS, HOXA9,
RB, BMI1, MEL18, RPS14, PTEN, SNF5, ALK, NRL, ERLA, CTIP |
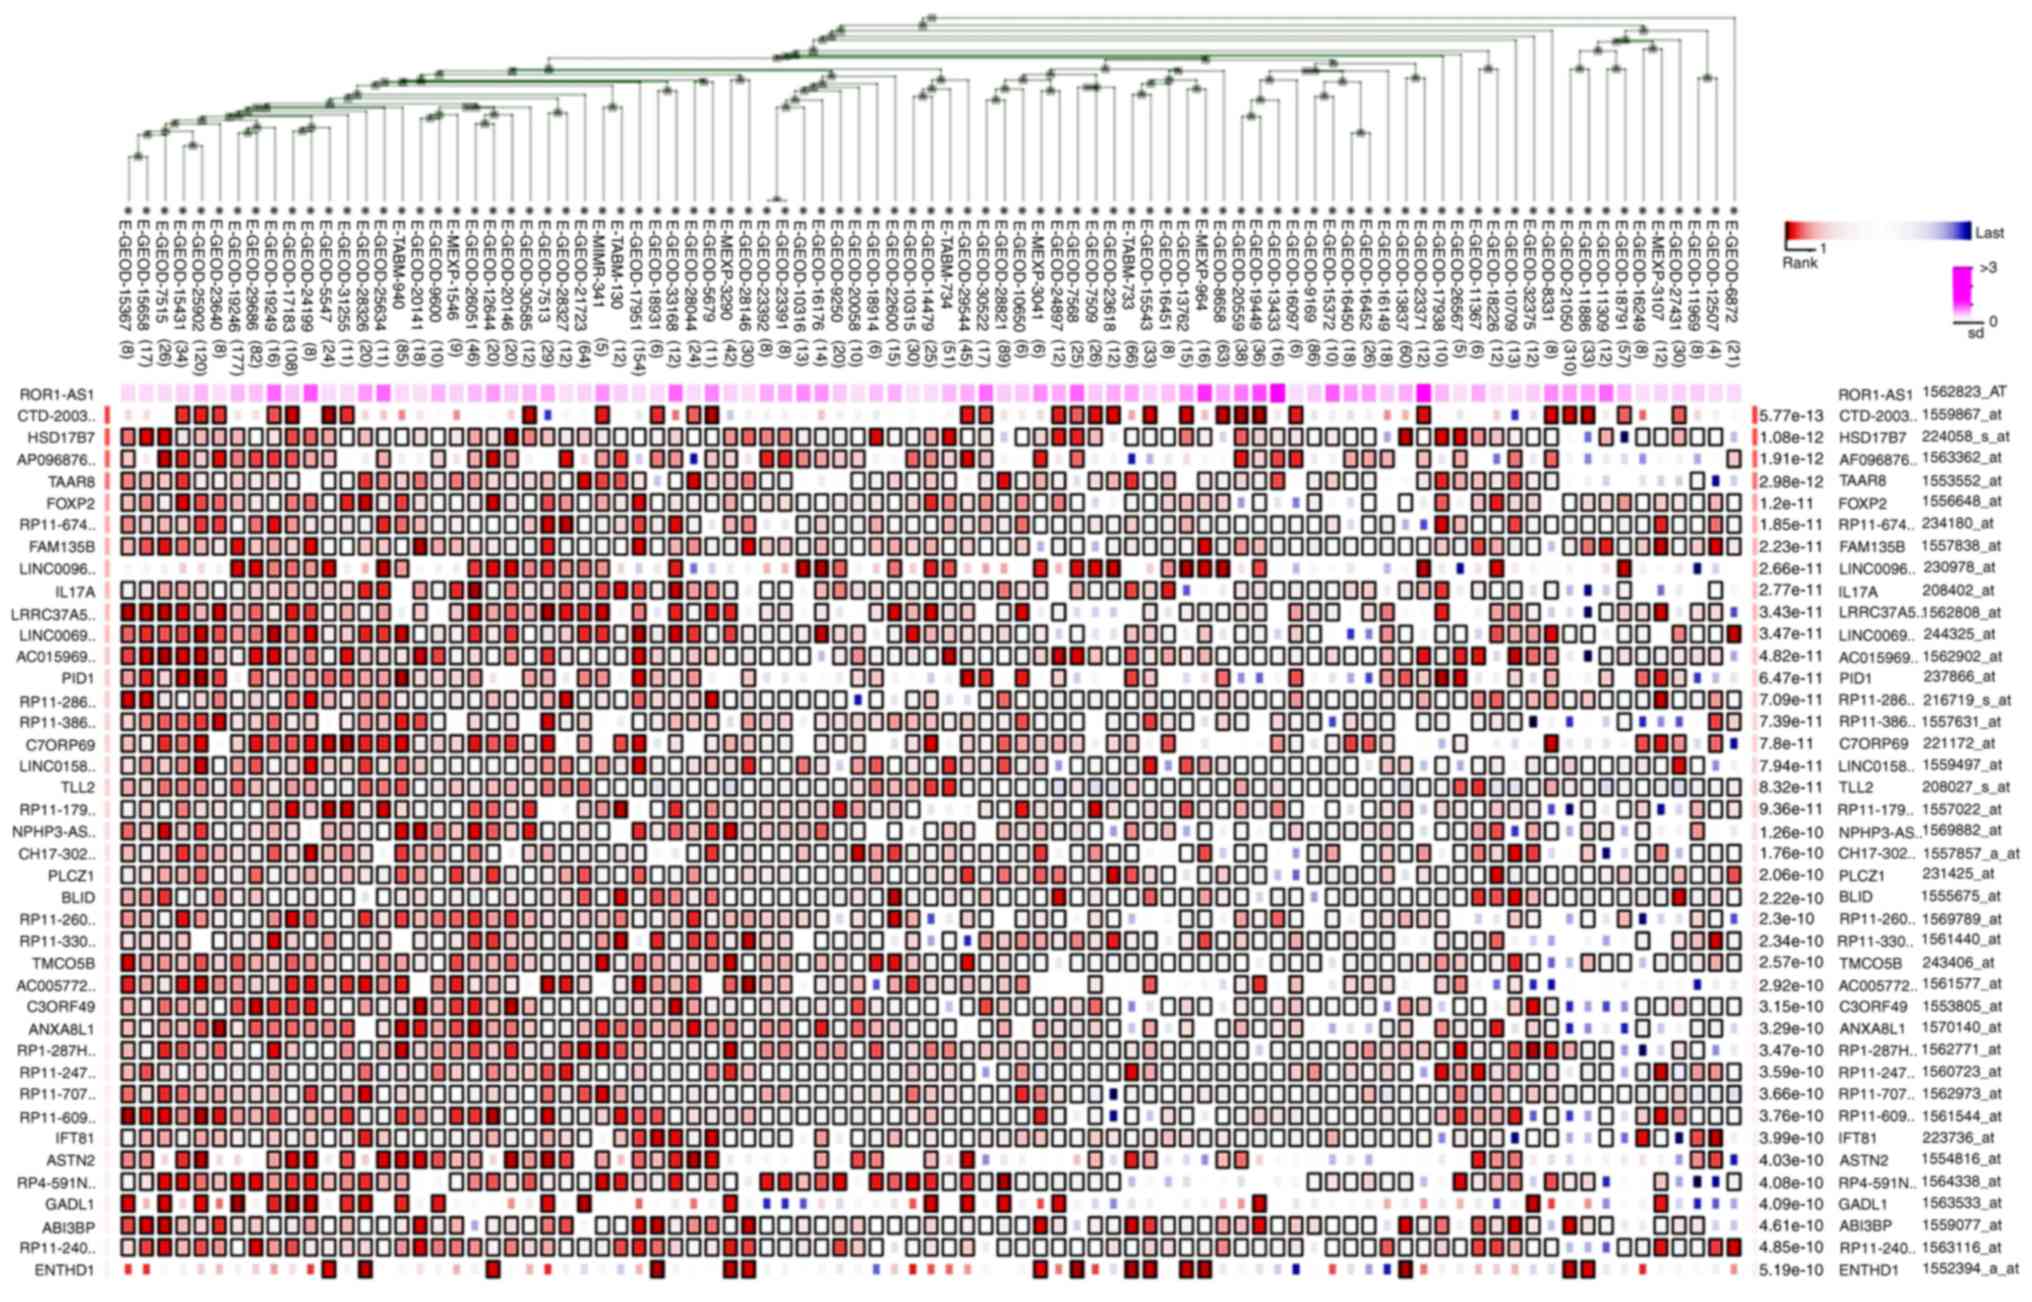
Prediction of related genes, and gene
enrichment and functional annotation analyses
A total of 100 datasets including 1,694 samples were
used to analyze the genes co-expressed with ROR1-AS1 in MEM. In
Fig. 5, only samples with liver
tissue as the research background were selected, and 40 genes most
closely associated with ROR1-AS1 were listed. The significant GO
terms and KEGG pathways were identified by KOBAS and DAVID. First,
STRING was used to enrich the functional protein association
network. After removing nodes without additional links, it was
found that there may be certain small regulatory networks within
the whole system (Fig. S2). Then, R
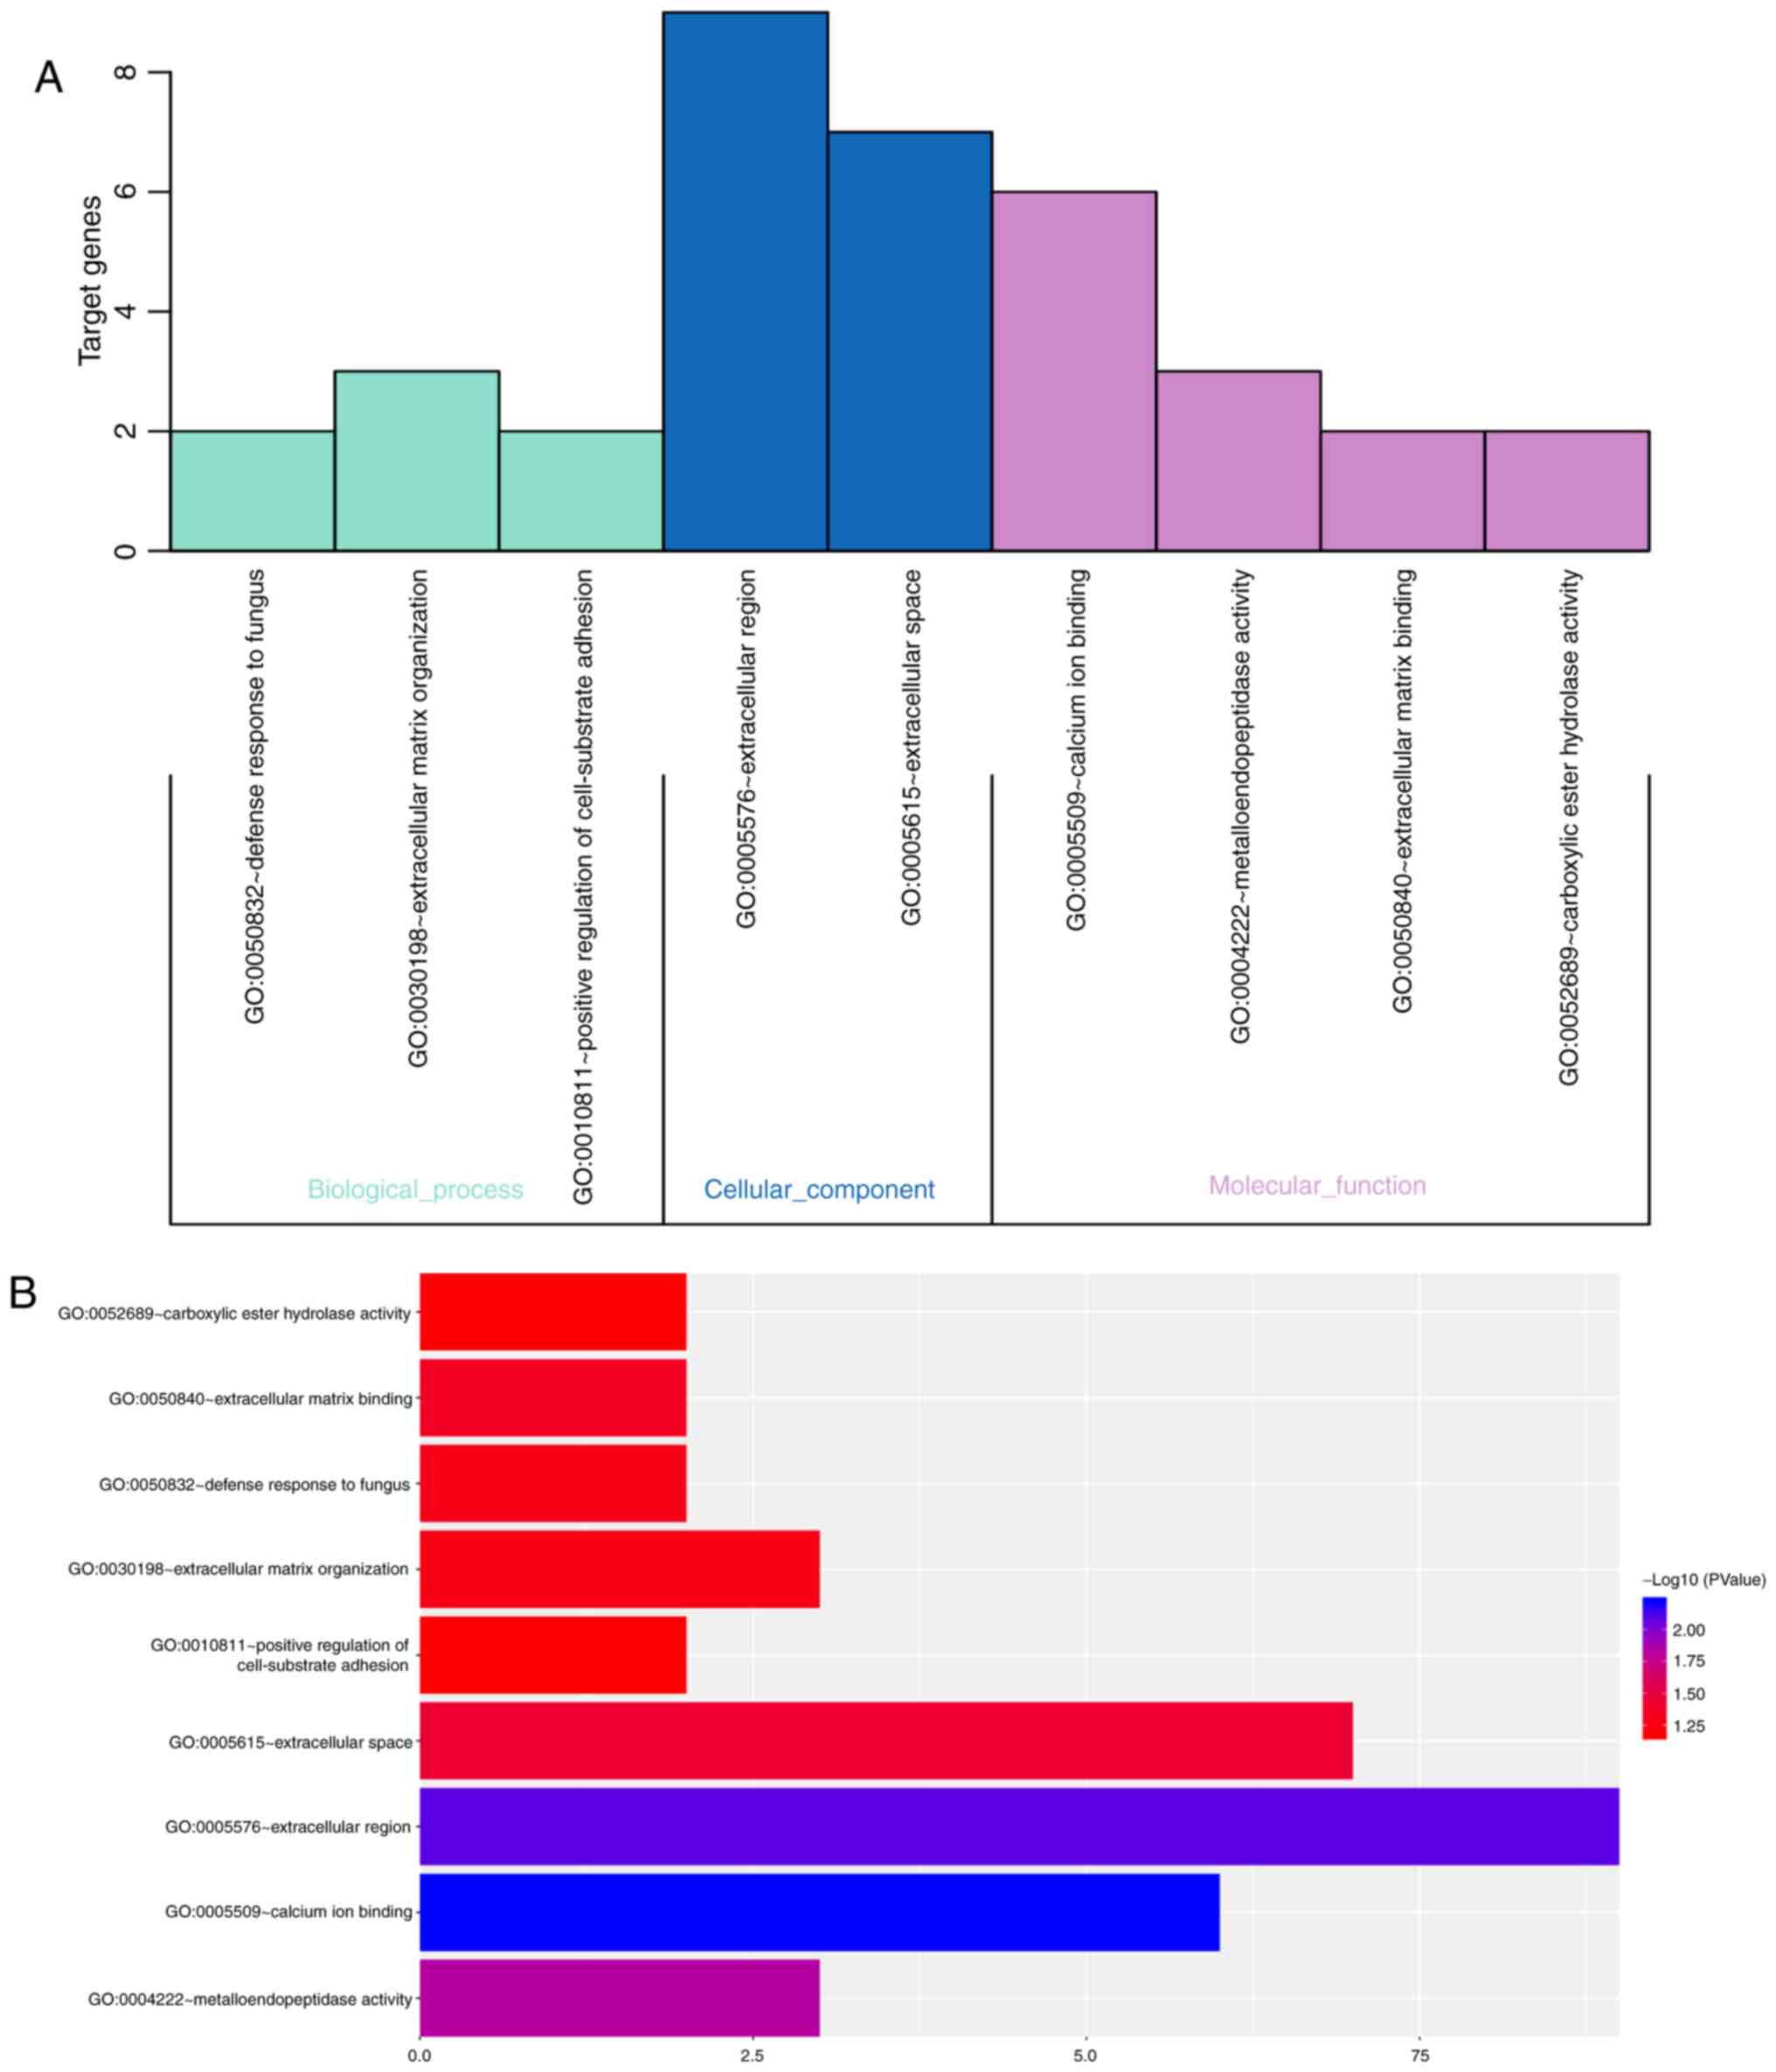
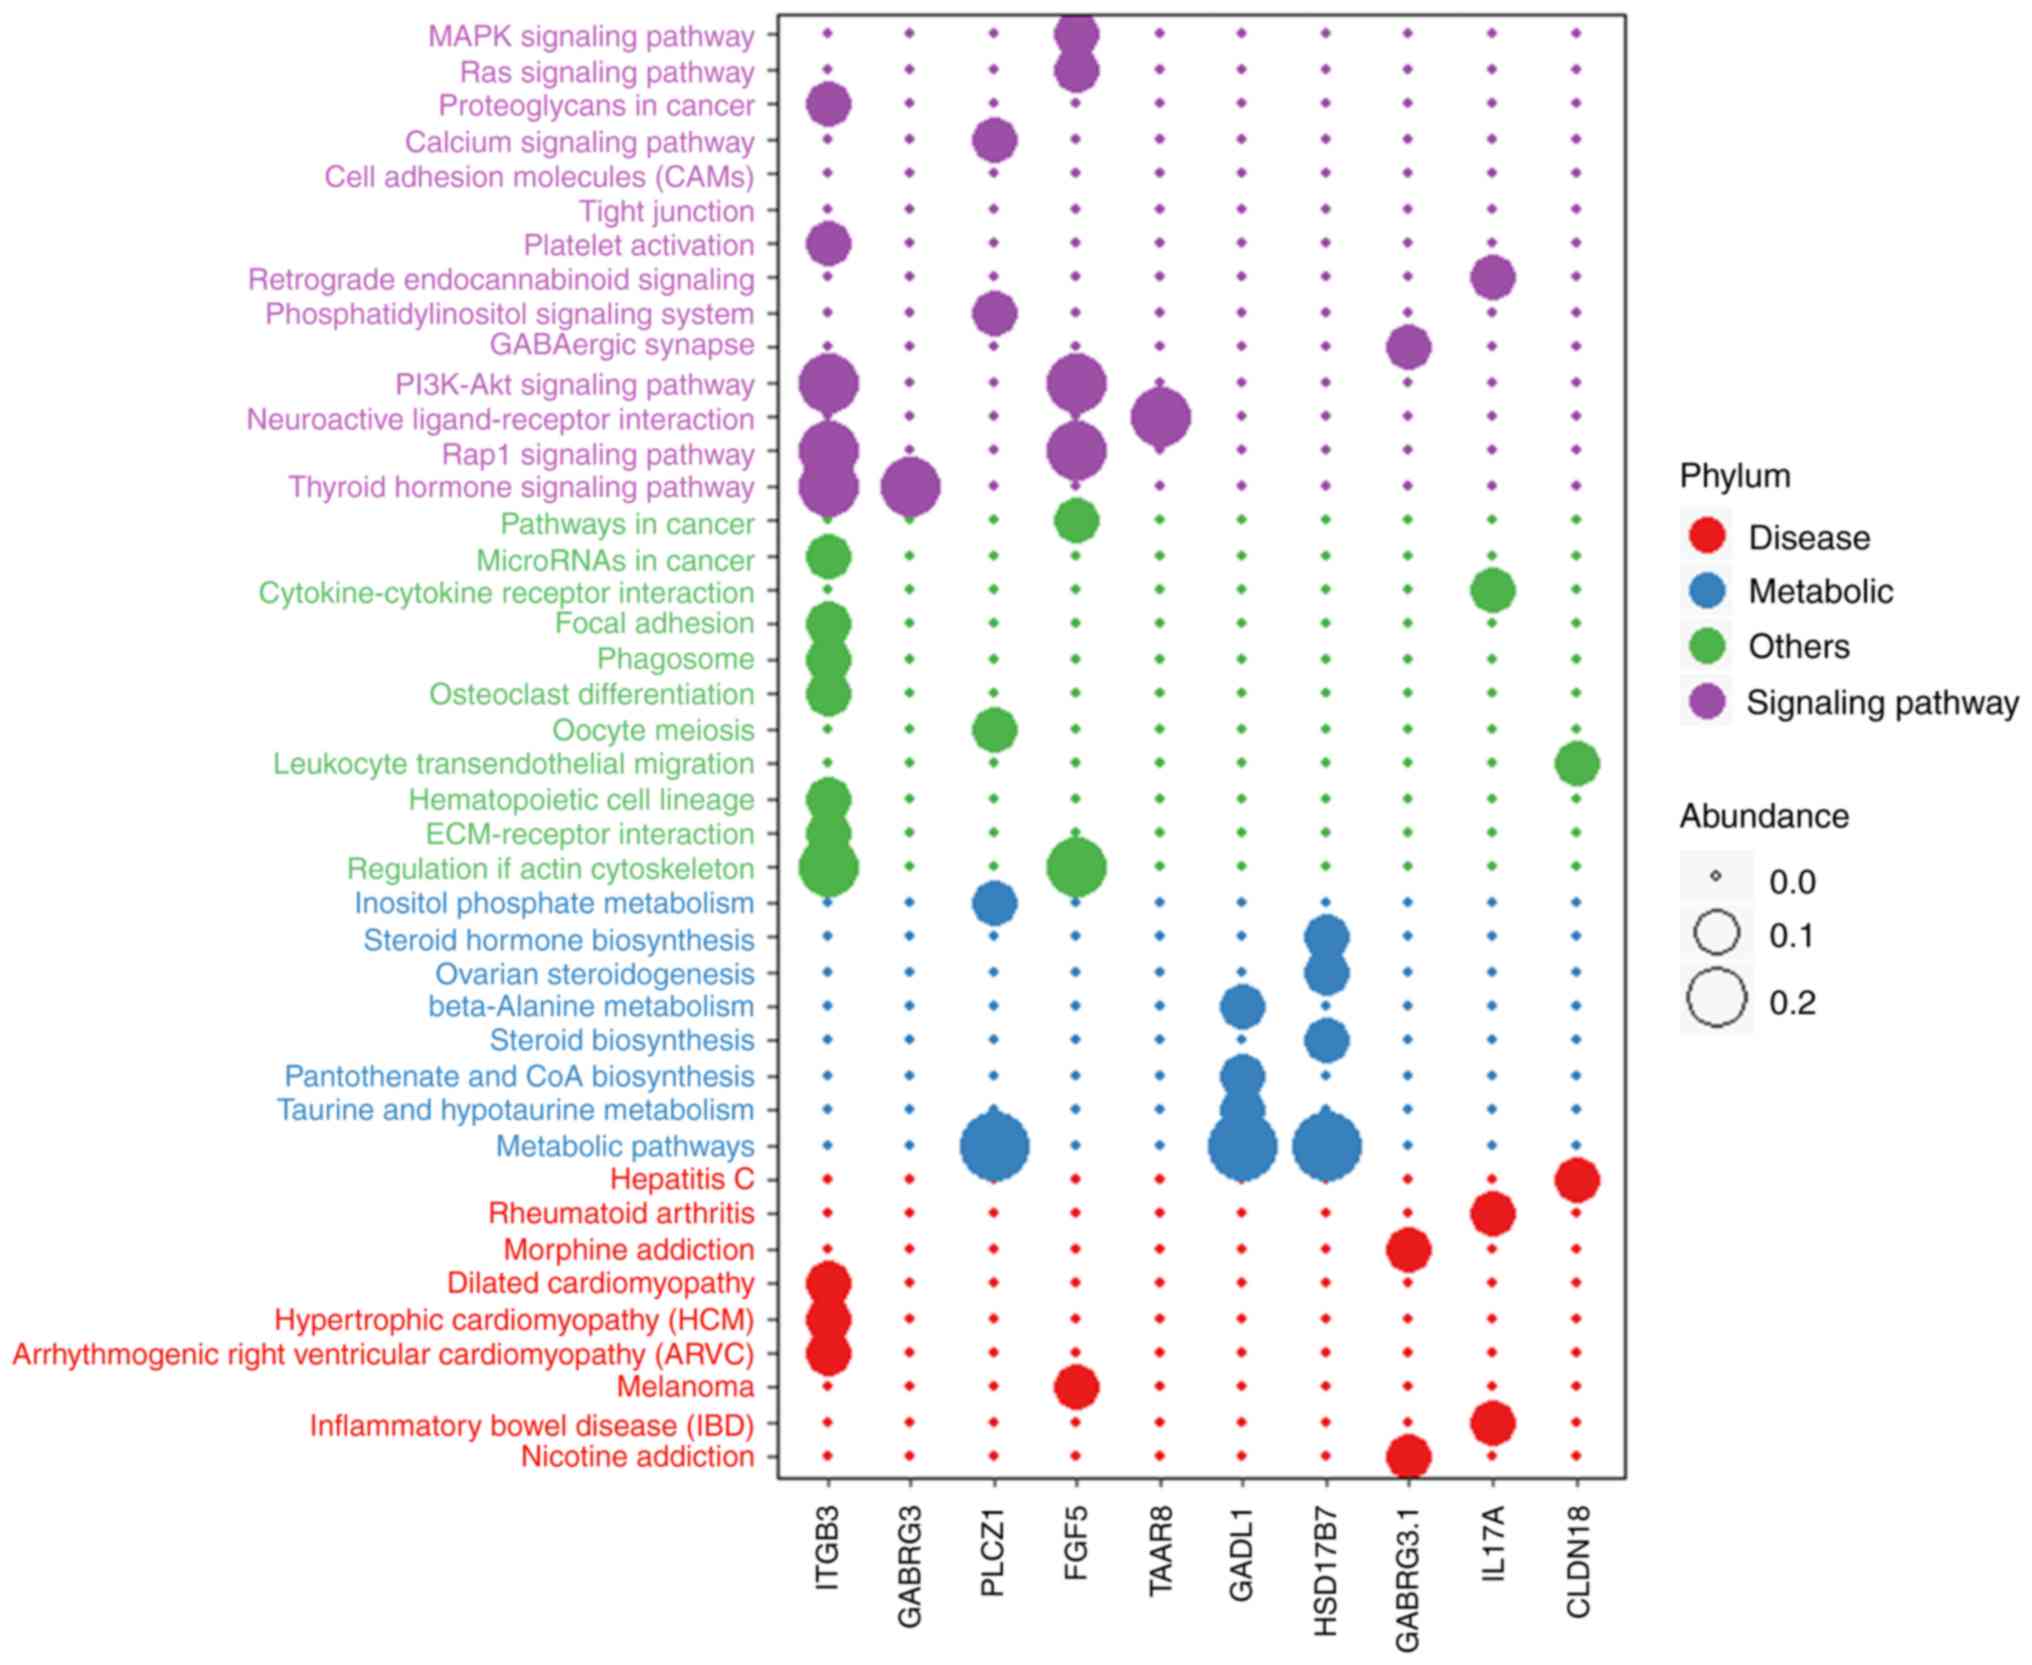
was used to determine these enriched GO terms (Fig. 6) and KEGG pathways (Fig. 7). To conduct a visual enrichment
analysis of genes enriched in the GO pathways and build an
interaction network for related genes, Cytoscape was used. The
results in Table VI revealed that
the target genes were most highly enriched in the following GO
terms: Calcium ion binding, extracellular region,
metalloendopeptidase activity, extracellular space, extracellular
matrix binding and defense response to fungus (Fig. 6), and through the following KEGG
pathways: Thyroid hormone signaling pathway, Rap1 signaling
pathway, regulation of actin cytoskeleton, Pi3K-Akt signaling
pathway, neuroactive ligand-receptor interaction and metabolic
related pathways (Fig. 7).
| Table VI.LncRNA ROR1-AS1-associated GO terms
and KEGG pathways in hepatocellular carcinoma. |
Table VI.
LncRNA ROR1-AS1-associated GO terms
and KEGG pathways in hepatocellular carcinoma.
| ID | Percentage
enrichment (%) | R-value | P-value | FDR | Term/pathway |
|---|
| GO:0005509 | 10.52631579 | N/A | 0.005942049 | 6.078863585 | Calcium ion
binding |
| GO:0005576 | 15.78947368 | N/A | 0.008242573 | 8.138546109 | Extracellular
region |
| GO:0004222 | 5.263157895 | N/A | 0.014987253 | 14.69223656 |
Metalloendopeptidase activity |
| GO:0005615 | 12.28070175 | N/A | 0.036377209 | 31.61735184 | Extracellular
space |
| GO:0050840 | 3.50877193 | N/A | 0.042273690 | 36.52490946 | Extracellular
matrix binding |
| GO:0050832 | 3.50877193 | N/A | 0.048703923 | 45.96726280 | Defense response to
fungus |
| hsa04919 | N/A | 0.218307346 | 0.012053686 | N/A | Thyroid hormone
signaling pathway |
| hsa04015 | N/A | 0.218307346 | 0.035140101 | N/A | Rap1 signaling
pathway |
| hsa04810 | N/A | 0.218307346 | 0.036348782 | N/A | Regulation of actin
cytoskeleton |
| hsa04151 | N/A | 0.218307346 | 0.038191424 | N/A | PI3K-Akt signaling
pathway |
| hsa04080 | N/A | 0.218307346 | 0.045736192 | N/A | Neuroactive
ligand-receptor interaction |
| hsa01100 | N/A | 0.281923180 | 0.047118941 | N/A | Metabolic pathways
LncRNA ROR1-AS1, long noncoding |
Co-expression network
construction
To further analyze the important biological role of
ROR1-AS1 in HCC, co-expression analysis was conducted on the data
from GSE54236. Next, the co-expressed genes identified in GEO were
comprehensively analyzed using the gene matrix recorded in
TCGA-LIHC. The WGCNA package in R was employed to analyze the
relationship between lncRNAs and miRNAs (power value=3), and the
relationship between miRNAs and mRNAs (power value=2).
Subsequently, genes associated with ROR1-AS1 were selected for the
co-expression grid (Fig. S3).
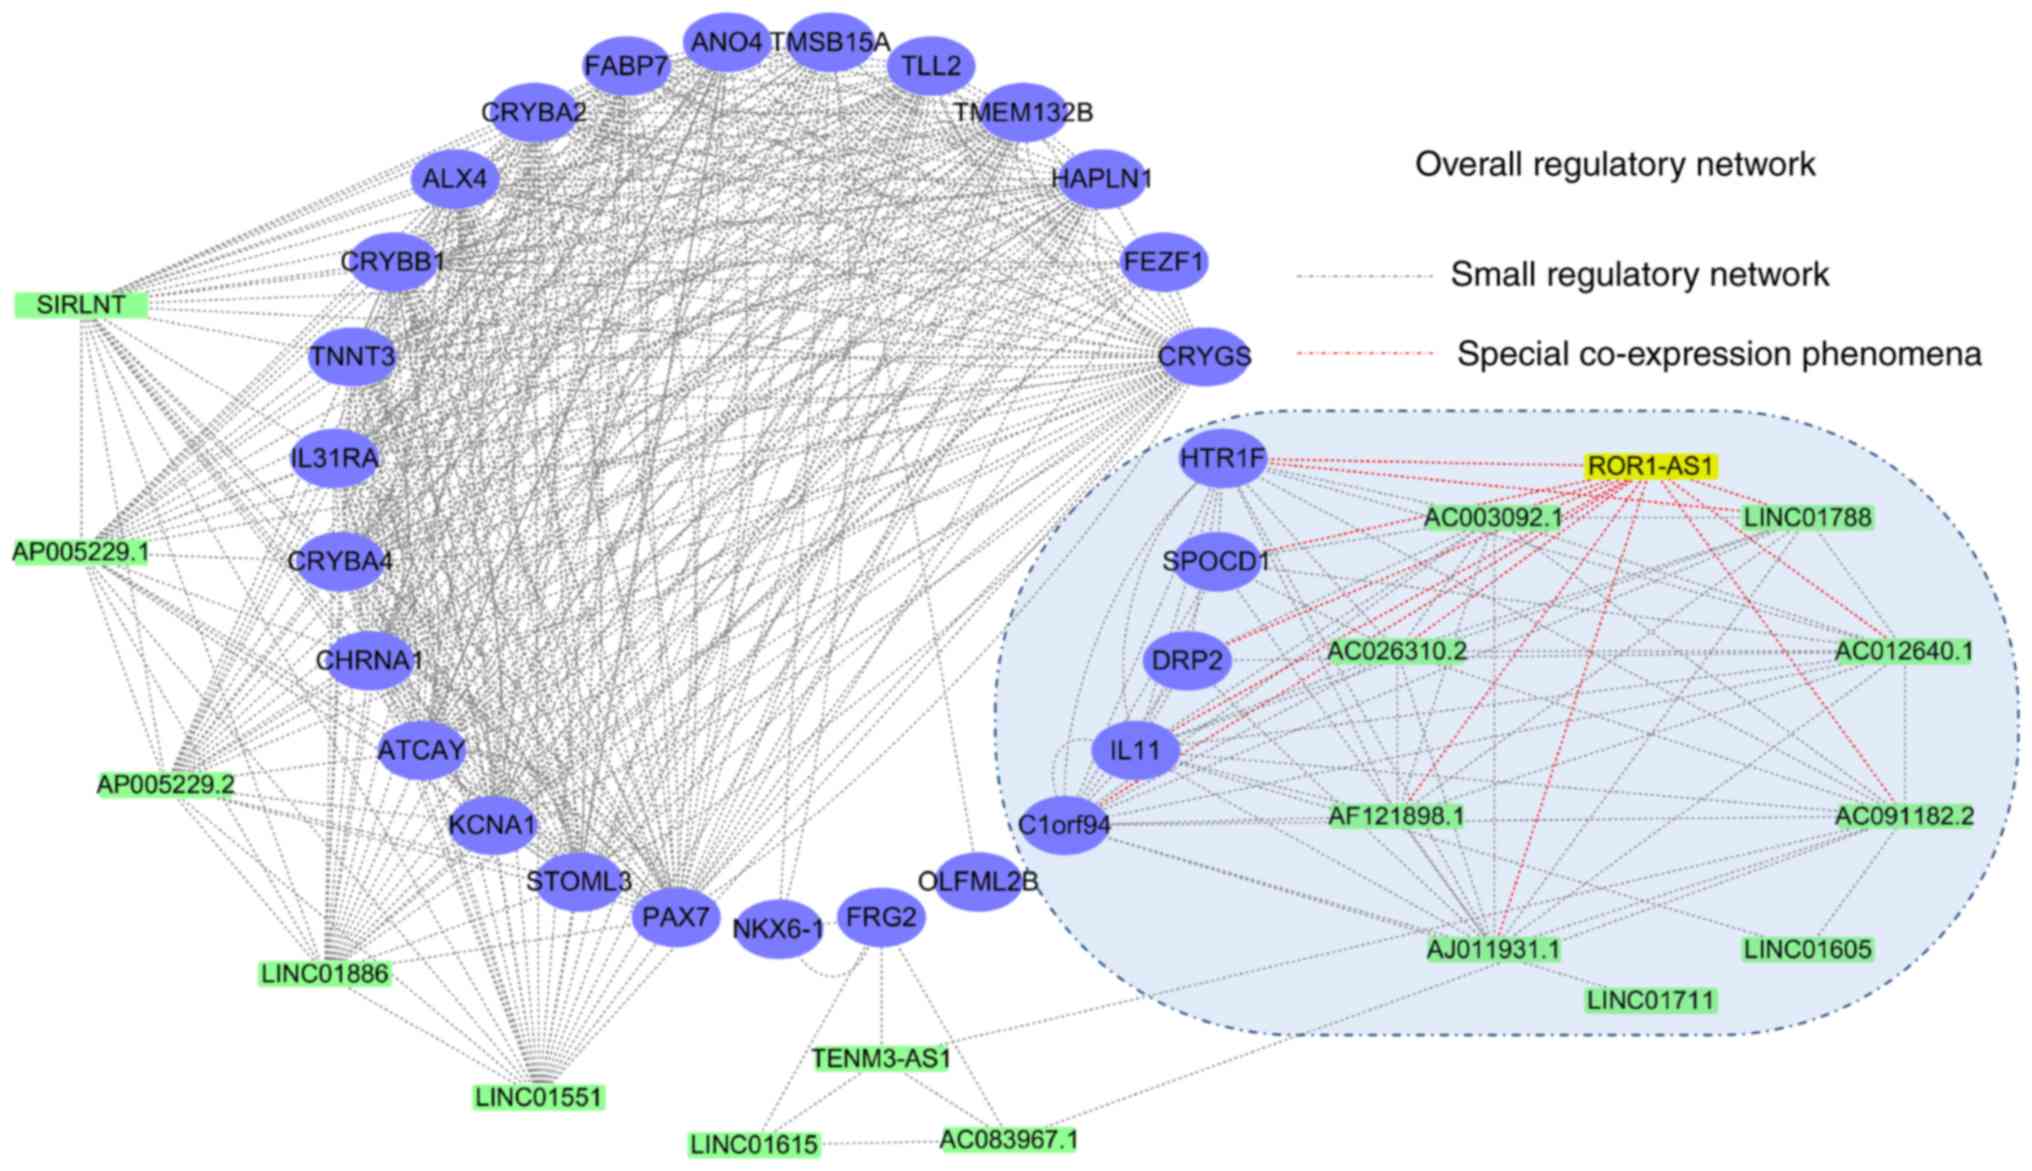
Cytoscape was used to identify potential co-expression regulatory
networks, revealing that based on these co-expressed genes, there
may be a large regulatory network containing 45 genes and a small
regulatory network containing 15 genes (Fig. 8). Notably, 10 pairs of genes were
found to exhibit direct regulatory interactions with ROR1-AS1
(highlighted with red lines; Fig.
8).
Phylogenetic tree and Co-expressed
genome maps
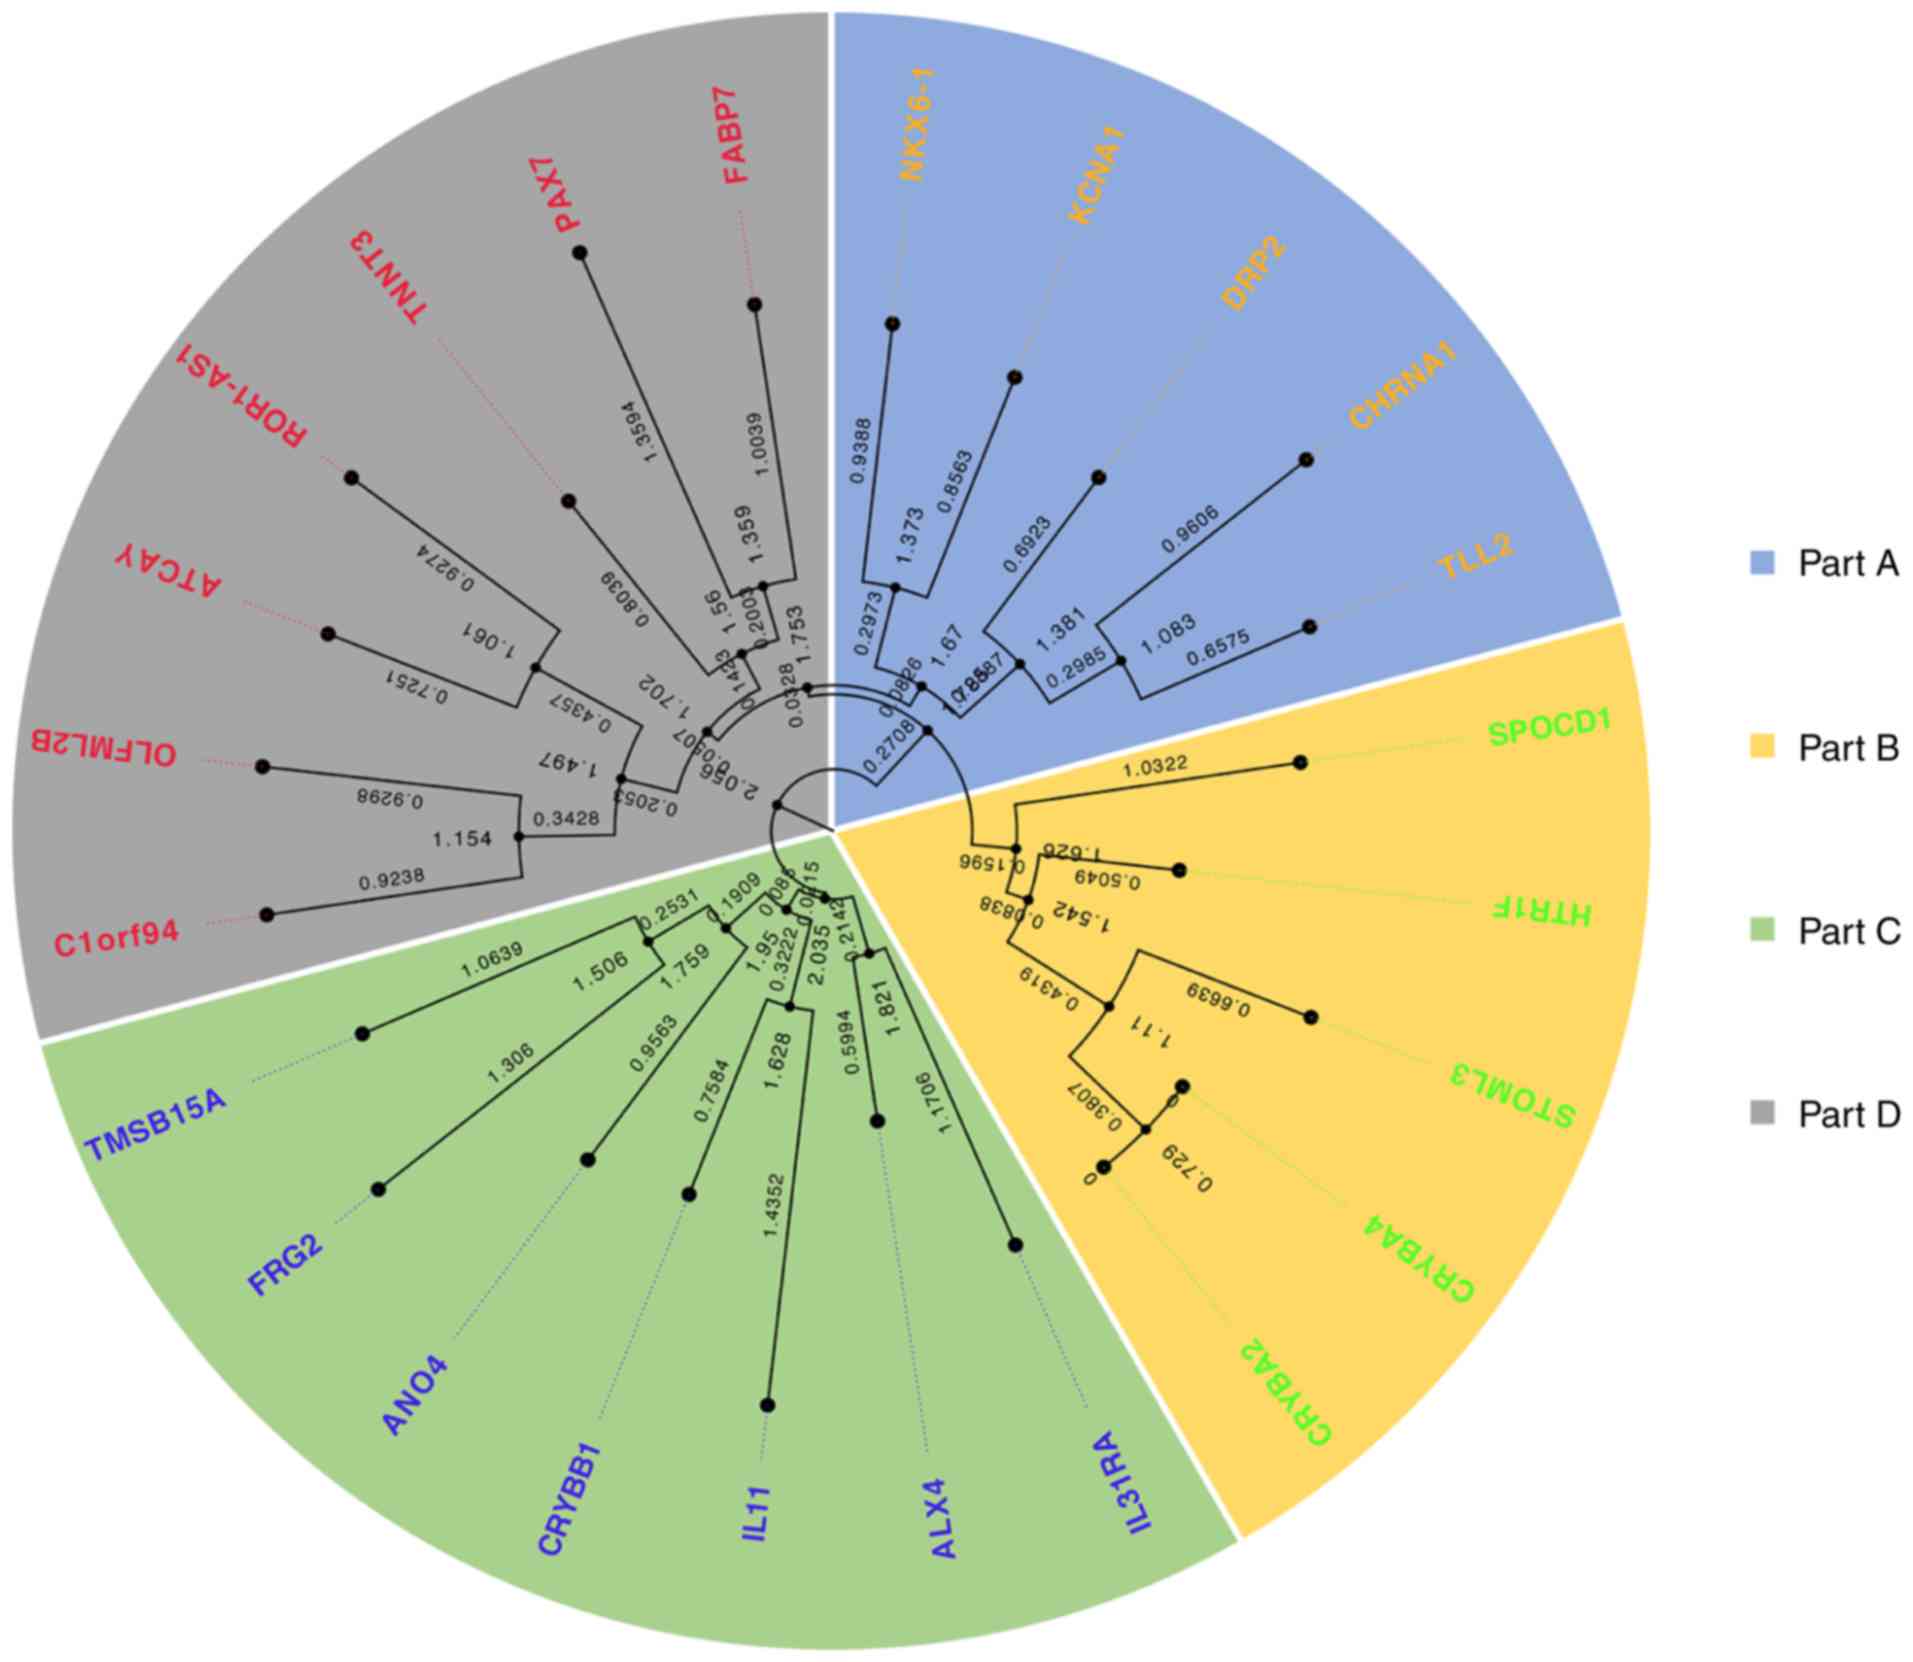
In Fig. 9, the spatial
structure of ROR1-AS1 and its transcript information in the NONCODE
database is presented. A phylogenetic tree was constructed using 23
genes collected from the NCBI and NONCODE databases for which there
is clear transcript information for homo sapiens (Fig. 9). The phylogenetic tree showed that
these co-expressed genes were split into 4 subfamilies; chromosome
1 open reading frame 94 (C1orf94), olfactomedin-like 2b (OLFML2B),
caytaxin (ATCAY), troponin T3(TNNT3), PAX7 and fatty acid-binding
protein 7 (FABP7) were located in the same subfamily as ROR1-AS1
(Fig. S4). Based on the
co-expression network presented in Fig.
8, the degree of relevance of the 15 genes contained in the
small regulatory network was analyzed. Excluding genes with
R<0.5, only 12 genes with R values >0.5 were maintained and
then verified in three databases (Fig.
10).
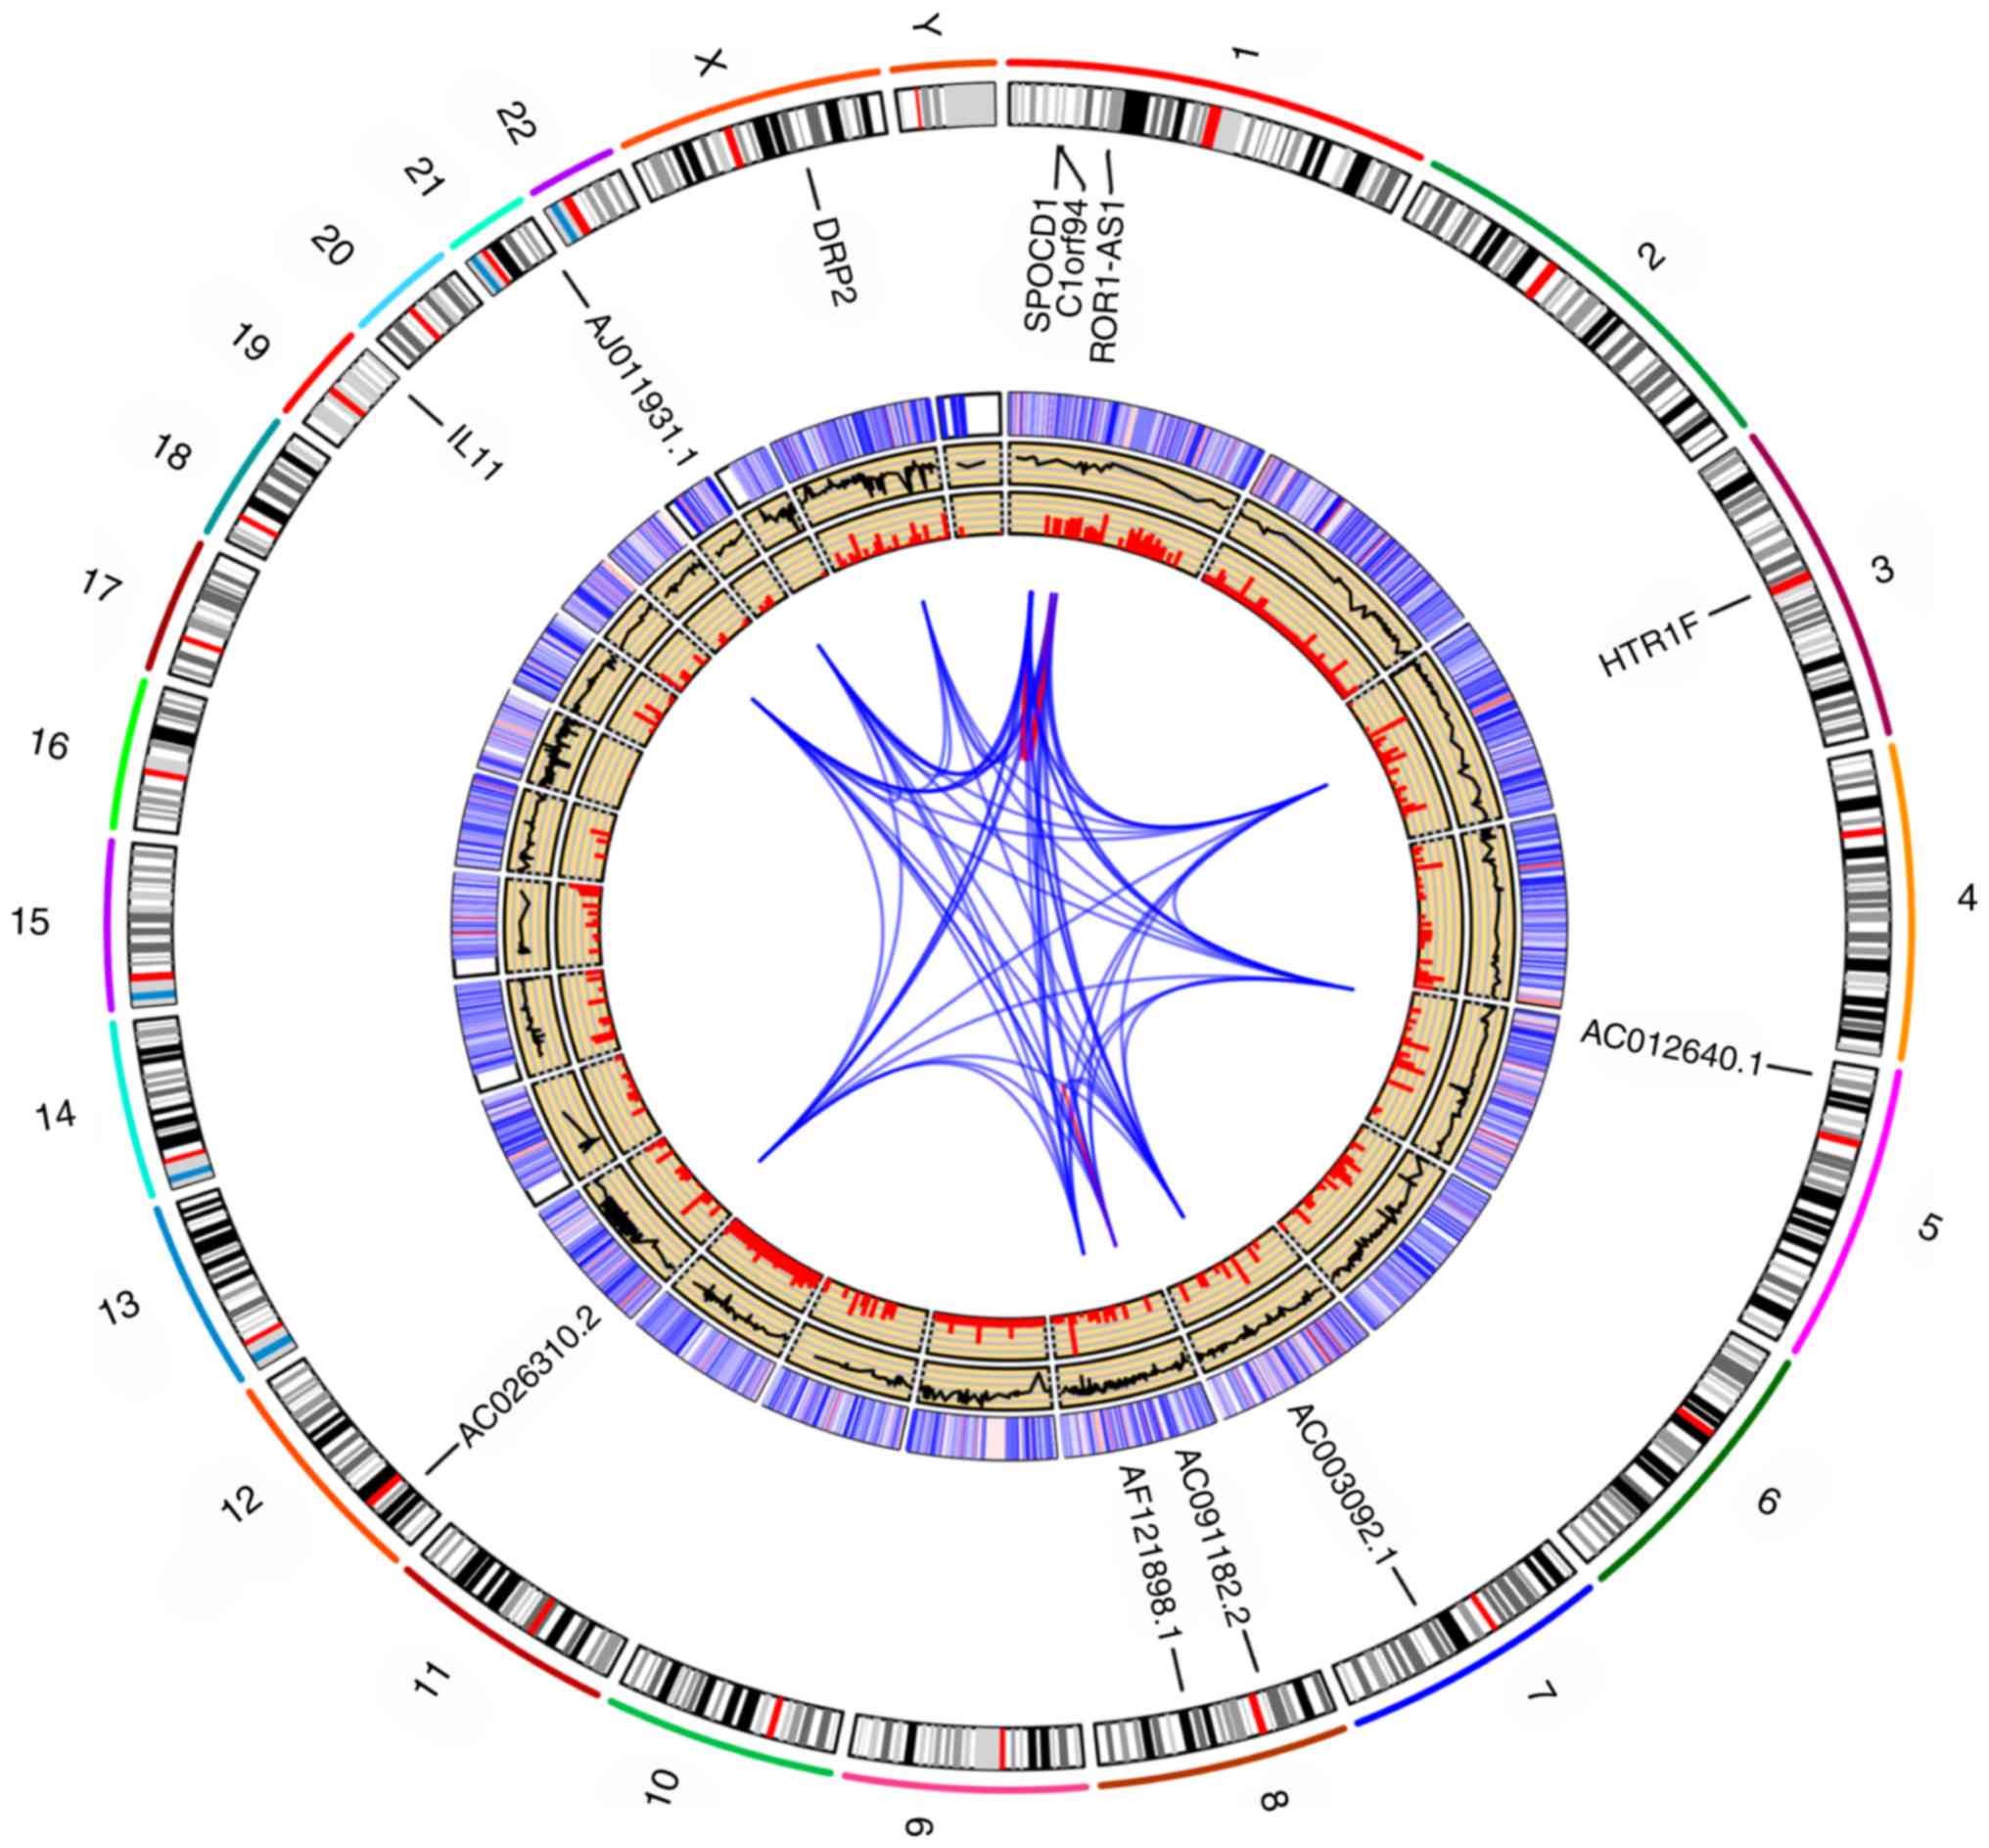
Alignments of gene co-expression maps to GRCh38.95
identified reference genomic regions contributing to the
composition of the 12 genome sets (Fig.
S5). To find the most typical reference fragments, all
GRCh38.95 loci present in the gene co-expression maps were deduced
and merged, resulting in 12 reference donor fragments as settled in
the outermost track. Subsequently, the number of gene co-expression
maps containing each of these fragments were counted in the second
track, excluding duplicate counts. In the inner sector, these pairs
of gene sets showing co-expression relationships were linked. The
sum of gene co-expression map alignments across the whole genome
acted as the copy number profile for the 12 gene co-expression maps
in the Circos plot (Fig. 10).
Discussion
LncRNAs can exhibit high or low expression in
various cancers. LncRNAs can also acts as oncogenes, which interact
with mRNAs and miRNAs to regulate cytological behavior and modulate
cancer development (48). According
to the present study, lncRNA ROR1-AS1 is important in HCC, and may
serve as a biomarker for monitoring the prognosis of liver cancer.
ROR1-AS1 expression in patients with HCC was analyzed, and it was
found that ROR1-AS1 expression significantly varied based on
clinical stage, T stage, vital status and other factors.
Recently, considerable advances have been made
regarding the function of ROR1-AS1, focusing on ROR1-AS1
upregulation in certain common digestive tumors (12,13,49,50).
Recent studies have reported the relation between ROR1-AS1
upregulation and cancers, such as MCL and colorectal cancer
(11–13). According to the findings of the
present study, ROR1-AS1 was highly expressed in HCC, consistent
with other cancer studies (12,13).
ROR1-AS1 expression progressively increased from T1 to T4, and from
clinical stage I to clinical stage IV, suggesting a role in the
progression of HCC. Additionally, ROR1-AS1 expression was higher in
patients that succumbed to HCC compared with those that survived,
suggesting a link between ROR1-AS1 expression and patient
survival.
Numerous previous studies have focused on the
effects of ROR1-AS1 on the occurrence and growth of tumors
(12,13,51).
Large-scale clinical statistics identified high expression of
ROR1-AS1 during the growth process of liver cell lines (52,53). In
this study, it was suggested ROR1-AS1 may inform upon the diagnosis
of tumors, as expression was associated with TNM classification.
ROR1-AS1 exhibited a strong association with cancer prognosis; it
was found that higher ROR1-AS1 expression was associated with
poorer OS, particularly in males, patients aged ≤55 years, and
those with advanced T stage (T3/4), N0 stage and early pathological
stage (G1/2). Cox analysis demonstrated the independent prognostic
effect of ROR1-AS1 on the OS of patients; therefore, it may serve
as a useful biomarker for the prognosis of HCC. Studies have also
shown that in addition to affecting common biological functions of
tumor cells, the lncRNA ROR1-AS1 can also affect certain specific
cytological behaviors, such as epithelial mesenchymal transition
and cell proliferation (12,13,51). After
functional enrichment analysis of ROR1-AS1, it was found that
ROR1-AS1 exhibited a very close relationship with cytosolic
ribosomes, cell substrate junctions, integrin binding, positive
regulation of Wnt signaling pathway, regulation of establishment of
planar polarity, negative regulation of development, nonmotile
primary cilium assembly, protein kinase A catalytic subunit binding
and signal transduction in absence of ligand.
To explore the biological role of lncRNA ROR1-AS1 in
HCC in depth, MEM was used. In total, >50 genes were indicated
to be closely associated with ROR1-AS1. First, the functional
protein association network indicated that there may be certain
small regulatory sub-networks in the whole network, suggesting that
is a hierarchy of regulatory networks involved in ROR1-AS1. After
functional enrichment of co-expressed genes with GO and KEGG, these
genes were found to be enriched in the following biological
processes and compartments: Calcium ion binding,
metalloendopeptidase activity, extracellular matrix binding and
defense response to fungus, and the extracellular region and
extracellular space. Additionally, KEGG analysis revealed that
ROR1-AS1 and co-expressed genes were associated with the thyroid
hormone, Rap1 and PI3K-Akt signaling pathways, regulation of the
actin cytoskeleton, neuroactive ligand-receptor interactions and
metabolic pathways.
To further analyze the important biological role of
ROR1-AS1 in HCC, co-expression analysis was conducted using data
obtained from GSE54236. Then, a comprehensive analysis was
conducted using the co-expressed genes of ROR1-AS1 identified in
GSE54236. WGCNA analysis identified a potential co-expression
regulatory network, suggesting that within these co-expressed
genes, there may be a large regulatory network comprising 45 genes
and a small regulatory network comprising 15 genes. It is
noteworthy that 10 genes exhibited direct regulatory interactions
with ROR1-AS1. Using the NCBI and NONCODE databases, spatial
structures and transcript information for these genes included in
the large regulatory network were obtained. A phylogenetic tree was
constructed using 23 genes collected from the NCBI and NONCODE
databases which possessed clear transcript information from homo
sapiens. The phylogenetic tree showed that the co-expressed genes
were split into 4 subfamilies; C1orf94, OLFML2B, ATCAY, TNNT3, PAX7
and FABP7 were in the same subfamily as ROR1-AS1.
The integration of data from MEM, GEO and TCGA
enabled exclusion of genes with R<0.5, and 12 genes with
R>0.5 were maintained and verified in the three databases. The
number of co-expressed gene pairs was obtained, including the
aforementioned 12 genes of different types (lncRNAs and mRNAs).
Finally, these data were combined with gene expression data to
predict possible co-expression regulatory networks. GRCh38.95
helped to perform whole-genome mapping, covering the 12 genes that
exhibited the strongest regulatory relationships with ROR1-AS1 in
HCC. Therefore, the co-expression regulatory network can be seen
directly without relying on complex algorithmic methods that rely
on complex assumptions.
Based on existing literature, the present study is
the first, to our knowledge, to report a potential role for lncRNA
ROR1-AS1 in the prognosis of HCC. However, to ensure the wide
application of ROR1-AS1 in evaluating the prognosis of liver
cancer, future clinical studies should be conducted to verify these
conclusions.
The present found that expression of lncRNA ROR1-AS1
was significantly increased in HCC patients and associated with
several clinical features and an undesirable prognosis; therefore,
lncRNA ROR1-AS1 may serve as a useful biomarker for the prognosis
of patients with HCC.
Supplementary Material
Supporting Data
Acknowledgements
Not applicable.
Funding
This study was supported by the Key Science and
Technology R&D Project of Jilin Science and Technology
Department, no. 20180201055YY (Sponsor: Meng ZH).
Availability of data and materials
The datasets generated and/or analyzed during the
current study are available in the TCGA (https://portal.gdc.cancer.gov/), GEO (https://www.ncbi.nlm.nih.gov/geo/download/?acc=GSE54236)
and MEM (http://biit.cs.ut.ee/mem/)
repositories.
Authors' contributions
ZZ, YHL and ZHM participated in the design and
conception of the study, the collection of data and drafting of the
manuscript. ZZ and SQW performed statistical analyses. ZZ and YF
participated in the interpretation of data. YHL and ZHM revised the
manuscript critically. All authors read and approved the final
manuscript.
Ethics approval and consent to
participate
Not applicable.
Patient consent for publication
Not applicable.
Competing interests
The authors declare that there are no competing
interests.
Glossary
Abbreviations
Abbreviations:
|
Cox
|
proportional hazards model
|
|
DAVID
|
Database for Annotation,
Visualization, and Integrated Discovery
|
|
FDR
|
false discovery rate
|
|
GEO
|
Gene Expression Omnibus
|
|
GO
|
Gene Ontology
|
|
GSEA
|
gene set enrichment analysis
|
|
HCC
|
hepatocellular carcinoma
|
|
KEGG
|
Kyoto Encyclopedia of Genes and
Genomes
|
|
KOBAS
|
KO-Based Annotation System
|
|
LncRNA
|
long noncoding RNA
|
|
MCL
|
mantle cell lymphoma
|
|
Mega
|
Molecular Evolutionary Genetics
Analysis
|
|
MEM
|
Multi Experiment Matrix
|
|
OS
|
overall survival
|
|
ROC
|
receiver operating characteristic
curve
|
|
ROR1-AS1
|
tyrosine protein kinase transmembrane
receptor 1 antisense RNA 1
|
|
STRING
|
Search Tool for the Retrieval of
Interacting Genes/Proteins
|
|
TCGA-LIHC
|
The Cancer Genome Atlas Liver
Hepatocellular Carcinoma
|
References
|
1
|
Hartke J, Johnson M and Ghabril M: The
diagnosis and treatment of hepatocellular carcinoma. Semin Diagn
Pathol. 34:153–159. 2017. View Article : Google Scholar : PubMed/NCBI
|
|
2
|
Ranganathan S, Lopez-Terrada D and Alaggio
R: Hepatoblastoma and pediatric hepatocellular carcinoma: An
update. Pediatr Dev Pathol. Sep 25–2019.(Epub ahead of print).
View Article : Google Scholar
|
|
3
|
Fang Q, Xie QS, Chen JM, Shan SL, Xie K,
Geng XP and Liu FB: Long-term outcomes after hepatectomy of huge
hepatocellular carcinoma: A single-center experience in China.
Hepatobiliary Pancreat Dis Int. Sep 11–2019.(Epub ahead of prin).
View Article : Google Scholar
|
|
4
|
Arendt BM, Teterina A, Pettinelli P,
Comelli EM, Ma DWL, Fung SK, McGilvray ID, Fischer SE and Allard
JP: Cancer-related gene expression is associated with disease
severity and modifiable lifestyle factors in non-alcoholic fatty
liver disease. Nutrition. 62:100–107. 2019. View Article : Google Scholar : PubMed/NCBI
|
|
5
|
Ma YC, Yang JY and Yan LN: Relevant
markers of cancer stem cells indicate a poor prognosis in
hepatocellular carcinoma patients: A meta-analysis. Eur J
Gastroenterol Hepatol. 25:1007–1016. 2013. View Article : Google Scholar : PubMed/NCBI
|
|
6
|
Shiani A, Narayanan S, Pena L and Friedman
M: The role of diagnosis and treatment of underlying liver disease
for the prognosis of primary liver cancer. Cancer Control.
24:10732748177292402017. View Article : Google Scholar : PubMed/NCBI
|
|
7
|
Yin Z, Dong C, Jiang K, Xu Z, Li R, Guo K,
Shao S and Wang L: Heterogeneity of cancer-associated fibroblasts
and roles in the progression, prognosis, and therapy of
hepatocellular carcinoma. J Hematol Oncol. 12:1012019. View Article : Google Scholar : PubMed/NCBI
|
|
8
|
Pang B, Wang Q, Ning S, Wu J, Zhang X,
Chen Y and Xu S: Landscape of tumor suppressor long noncoding RNAs
in breast cancer. J Exp Clin Cancer Res. 38:792019. View Article : Google Scholar : PubMed/NCBI
|
|
9
|
Zhang Z, Liu F, Yang F and Liu Y: Kockdown
of OIP5-AS1 expression inhibits proliferation, metastasis and EMT
progress in hepatoblastoma cells through up-regulating miR-186a-5p
and down-regulating ZEB1. Biomed Pharmacother. 101:14–23. 2018.
View Article : Google Scholar : PubMed/NCBI
|
|
10
|
Zhu X, Liu Y, Yu J, Du J, Guo R, Feng Y,
Zhong G, Jiang Y and Lin J: LncRNA HOXA-AS2 represses endothelium
inflammation by regulating the activity of NF-κB signaling.
Atherosclerosis. 281:38–46. 2019. View Article : Google Scholar : PubMed/NCBI
|
|
11
|
Hu G, Gupta SK, Troska TP, Nair A and
Gupta M: Long non-coding RNA profile in mantle cell lymphoma
identifies a functional lncRNA ROR1-AS1 associated with EZH2/PRC2
complex. Oncotarget. 8:80223–80234. 2017.PubMed/NCBI
|
|
12
|
Wang FZ, Zhang MQ, Zhang L and Zhang MC:
Long non-coding RNA ROR1-AS1 enhances colorectal cancer metastasis
by targeting miR-375. Eur Rev Med Pharmacol Sci. 23:6899–6905.
2019.PubMed/NCBI
|
|
13
|
Liao T, Maierdan SL and Lv C: ROR1-AS1
promotes tumorigenesis of colorectal cancer via targeting
Wnt/β-catenin. Eur Rev Med Pharmacol Sci. 23((3 Suppl)): S217–S223.
2019.
|
|
14
|
Samur MK: RTCGAToolbox: A new tool for
exporting TCGA Firehose data. PLoS One. 9:e1063972014. View Article : Google Scholar : PubMed/NCBI
|
|
15
|
R Core Team, . R: A language and
environment for statistical computingR Foundation for Statistical
Computing; Vienna: 2013
|
|
16
|
Villa E, Critelli R, Lei B, Marzocchi G,
Camma C, Giannelli G, Pontisso P, Cabibbo G, Enea M, Colopi S, et
al: Neoangiogenesis-related genes are hallmarks of fast-growing
hepatocellular carcinomas and worst survival. Results from a
prospective study. Gut. 65:861–869. 2016. View Article : Google Scholar : PubMed/NCBI
|
|
17
|
Zubiete-Franco I, Garcia-Rodriguez JL,
Lopitz-Otsoa F, Serrano-Macia M, Simon J, Fernandez-Tussy P,
Barbier-Torres L, Fernandez-Ramos D, Gutierrez-de-Juan V, Lopez de
Davalillo S, et al: SUMOylation regulates LKB1 localization and its
oncogenic activity in liver cancer. EBioMedicine. 40:406–421. 2019.
View Article : Google Scholar : PubMed/NCBI
|
|
18
|
Jiao Y, Fu Z, Li Y, Meng L and Liu Y: High
EIF2B5 mRNA expression and its prognostic significance in liver
cancer: A study based on the TCGA and GEO database. Cancer Manag
Res. 10:6003–6014. 2018. View Article : Google Scholar : PubMed/NCBI
|
|
19
|
Ginestet C: ggplot2: Elegant Graphics for
Data Analysis. J Royal Statistic Soc Series A. 174:245. 2011.
View Article : Google Scholar
|
|
20
|
Mitteer DR, Greer BD, Fisher WW and Cohrs
VL: Teaching behavior technicians to create publication-quality,
single-case design graphs in graphpad prism 7. J Appl Behav Anal.
51:998–1010. 2018. View Article : Google Scholar : PubMed/NCBI
|
|
21
|
Schober P, Boer C and Schwarte LA:
Correlation Coefficients: Appropriate Use and Interpretation.
Anesth Analg. 126:1763–1768. 2018. View Article : Google Scholar : PubMed/NCBI
|
|
22
|
Kourou K, Exarchos TP, Exarchos KP,
Karamouzis MV and Fotiadis DI: Machine learning applications in
cancer prognosis and prediction. Comput Struct Biotechnol J.
13:8–17. 2015. View Article : Google Scholar : PubMed/NCBI
|
|
23
|
Lin H and Zelterman D: Modeling Survival
Data: Extending the Cox Model. Technometrics. 44:85–86. 2002.
View Article : Google Scholar
|
|
24
|
Robin X, Turck N, Hainard A, Tiberti N,
Lisacek F, Sanchez JC and Muller M: pROC: An open-source package
for R and S+ to analyze and compare ROC curves. BMC Bioinformatics.
12:772011. View Article : Google Scholar : PubMed/NCBI
|
|
25
|
Li N, Zhao L, Guo C, Liu C and Liu Y:
Identification of a novel DNA repair-related prognostic signature
predicting survival of patients with hepatocellular carcinoma.
Cancer Manag Res. 11:7473–7484. 2019. View Article : Google Scholar : PubMed/NCBI
|
|
26
|
Mootha VK, Lindgren CM, Eriksson KF,
Subramanian A, Sihag S, Lehar J, Puigserver P, Carlsson E,
Ridderstrale M, Laurila E, et al: PGC-1alpha-responsive genes
involved in oxidative phosphorylation are coordinately
downregulated in human diabetes. Nat Genet. 34:267–273. 2003.
View Article : Google Scholar : PubMed/NCBI
|
|
27
|
Subramanian A, Tamayo P, Mootha VK,
Mukherjee S, Ebert BL, Gillette MA, Paulovich A, Pomeroy SL, Golub
TR, Lander ES and Mesirov JP: Gene set enrichment analysis: A
knowledge-based approach for interpreting genome-wide expression
profiles. Proc Natl Acad Sci USA. 102:15545–15550. 2005. View Article : Google Scholar : PubMed/NCBI
|
|
28
|
Huang da W, Sherman BT and Lempicki RA:
Systematic and integrative analysis of large gene lists using DAVID
bioinformatics resources. Nat Protoc. 4:44–57. 2009. View Article : Google Scholar : PubMed/NCBI
|
|
29
|
Ashburner M, Ball CA, Blake JA, Botstein
D, Butler H, Cherry JM, Davis AP, Dolinski K, Dwight SS, Eppig JT,
et al: Gene ontology: Tool for the unification of biology. The Gene
Ontology Consortium. Nat Genet. 25:25–29. 2000. View Article : Google Scholar : PubMed/NCBI
|
|
30
|
The Gene Ontology C, . The Gene Ontology
Resource: 20 years and still GOing strong. Nucleic Acids Res.
47:D330–D338. 2019. View Article : Google Scholar : PubMed/NCBI
|
|
31
|
Kanehisa M and Goto S: KEGG: Kyoto
encyclopedia of genes and genomes. Nucleic Acids Res. 28:27–30.
2000. View Article : Google Scholar : PubMed/NCBI
|
|
32
|
Kanehisa M, Sato Y, Furumichi M, Morishima
K and Tanabe M: New approach for understanding genome variations in
KEGG. Nucleic Acids Res. 47:D590–D595. 2019. View Article : Google Scholar : PubMed/NCBI
|
|
33
|
Kanehisa M: Toward understanding the
origin and evolution of cellular organisms. Protein Sci.
28:1947–1951. 2019. View Article : Google Scholar : PubMed/NCBI
|
|
34
|
Zhang B and Horvath S: A general framework
for weighted gene co-expression network analysis. Stat Appl Genet
Mol Biol. 4:Article 17. 2005. View Article : Google Scholar : PubMed/NCBI
|
|
35
|
Deng Y, He RQ, Zhang R, Gan BL, Zhang Y,
Chen G and Hu XH: The expression of HOXA13 in lung adenocarcinoma
and its clinical significance: A study based on The Cancer Genome
Atlas, Oncomine and reverse transcription-quantitative polymerase
chain reaction. Oncol Lett. 15:8556–8572. 2018.PubMed/NCBI
|
|
36
|
He RQ, Xiong DD, Ma J, Hu XH, Chen G and
Sun WL: The clinicopathological significance and correlative
signaling pathways of an autophagy-related gene, ambra1, in breast
cancer: A study of 25 microarray RNA-Seq datasets and in-house gene
silencing. Cell Physiol Biochem. 51:1027–1040. 2018. View Article : Google Scholar : PubMed/NCBI
|
|
37
|
Chan EKF, Cameron DL, Petersen DC, Lyons
RJ, Baldi BF, Papenfuss AT, Thomas DM and Hayes VM: Optical mapping
reveals a higher level of genomic architecture of chained fusions
in cancer. Genome Res. 28:726–738. 2018. View Article : Google Scholar : PubMed/NCBI
|
|
38
|
Dean CB and Nielsen JD: Generalized linear
mixed models: A review and some extensions. Lifetime Data Anal.
13:497–512. 2007. View Article : Google Scholar : PubMed/NCBI
|
|
39
|
Pei G, Chen L and Zhang W: WGCNA
application to proteomic and metabolomic data analysis. Methods
Enzymol. 585:135–158. 2017. View Article : Google Scholar : PubMed/NCBI
|
|
40
|
Winden KD, Oldham MC, Mirnics K, Ebert PJ,
Swan CH, Levitt P, Rubenstein JL, Horvath S and Geschwind DH: The
organization of the transcriptional network in specific neuronal
classes. Mol Syst Biol. 5:2912009. View Article : Google Scholar : PubMed/NCBI
|
|
41
|
Yang J, Yu H, Liu BH, Zhao Z, Liu L, Ma
LX, Li YX and Li YY: DCGL v2.0: An R package for unveiling
differential regulation from differential co-expression. PLoS One.
8:e797292013. View Article : Google Scholar : PubMed/NCBI
|
|
42
|
Ravasz E, Somera AL, Mongru DA, Oltvai ZN
and Barabasi AL: Hierarchical organization of modularity in
metabolic networks. Science. 297:1551–1555. 2002. View Article : Google Scholar : PubMed/NCBI
|
|
43
|
Hameed MS, Wang Z, Vasseur L and Yang G:
Molecular characterization and the function of argonaute3 in RNAi
pathway of plutella xylostella. Int J Mol Sci. 19(pii):
E12492018. View Article : Google Scholar : PubMed/NCBI
|
|
44
|
Hall BG: Building phylogenetic trees from
molecular data with MEGA. Mol Biol Evol. 30:1229–1235. 2013.
View Article : Google Scholar : PubMed/NCBI
|
|
45
|
Kumar S, Stecher G and Tamura K: MEGA7:
Molecular evolutionary genetics analysis version 7.0 for bigger
datasets. Mol Biol Evol. 33:1870–1874. 2016. View Article : Google Scholar : PubMed/NCBI
|
|
46
|
Porcella SF, Carlson JH, Sturdevant DE,
Sturdevant GL, Kanakabandi K, Virtaneva K, Wilder H, Whitmire WM,
Song L and Caldwell HD: Transcriptional profiling of human
epithelial cells infected with plasmid-bearing and
plasmid-deficient Chlamydia trachomatis. Infect Immun. 83:534–543.
2015. View Article : Google Scholar : PubMed/NCBI
|
|
47
|
Kumar R, Sobhy H, Stenberg P and Lizana L:
Genome contact map explorer: A platform for the comparison,
interactive visualization and analysis of genome contact maps.
Nucleic Acids Res. 45:e1522017. View Article : Google Scholar : PubMed/NCBI
|
|
48
|
Choi S, Lee S, Kim Y, Hwang H and Park T:
HisCoM-GGI: Hierarchical structural component analysis of gene-gene
interactions. J Bioinform Comput Biol. 16:18400262018. View Article : Google Scholar : PubMed/NCBI
|
|
49
|
Pekarsky Y and Croce CM: Noncoding RNA
genes in cancer pathogenesis. Adv Biol Regul. 71:219–223. 2019.
View Article : Google Scholar : PubMed/NCBI
|
|
50
|
Cetin M, Odabas G, Douglas LR, Duriez PJ,
Balcik-Ercin P, Yalim-Camci I, Sayan AE and Yagci T: ROR1
expression and its functional significance in hepatocellular
carcinoma cells. Cells. 8:E2102019. View Article : Google Scholar : PubMed/NCBI
|
|
51
|
Xu C, Aragam N, Li X, Villla EC, Wang L,
Briones D, Petty L, Posada Y, Arana TB, Cruz G, et al: BCL9 and
C9orf5 are associated with negative symptoms in schizophrenia:
Meta-analysis of two genome-wide association studies. PLoS One.
8:e516742013. View Article : Google Scholar : PubMed/NCBI
|
|
52
|
Rose JE, Behm FM, Drgon T, Johnson C and
Uhl GR: Personalized smoking cessation: Interactions between
nicotine dose, dependence and quit-success genotype score. Mol Med.
16:247–253. 2010. View Article : Google Scholar : PubMed/NCBI
|
|
53
|
Kabir MH, Patrick R, Ho JWK and O'Connor
MD: Identification of active signaling pathways by integrating gene
expression and protein interaction data. BMC Syst Biol. 12 (Suppl
9):S1202018. View Article : Google Scholar
|