Introduction
Esophageal cancer (EC) is the seventh most common
type of cancer and the sixth highest cause of cancer-associated
death (1). Based on the
histopathological appearance, EC is primarily classified into two
types, esophageal squamous cell carcinoma (ESCC) and esophageal
adenocarcinoma (EAC) (2). ESCC is
the most general type of EC, which accounts for ~90% of all EC
patients in China, whereas EAC is more frequently observed in
developed countries (3). Treatment
of ESCC includes surgery, radiotherapy and chemotherapy, and have
drastically improved survival. However, the five-year survival in
patients with ESCC remains relatively low, primarily due to delayed
diagnosis (4). Squamous cell
carcinoma antigen and CYFRA 21-1 are tumor markers commonly used
for managing patients with ESCC; however they have limited
application for detection of early stage ESCC due to their lack of
specificity and accuracy (5,6).
Therefore, the identification of novel molecular biomarkers may
assist in the development of novel diagnostic and therapeutic
strategies for ESCC.
Matrix metalloproteinases (MMPs) are considered to
serve vital roles in early carcinogenic events, tumor growth,
invasion, metastasis and tumor-induced angiogenesis (7). The MMP family of proteins are
zinc-dependent endopeptidases, and to date, 23 members have been
identified in humans (8). MMPs
participate in the cleavage of extracellular matrix (ECM)
components, such as collagen and elastin (9). MMP dysregulation is associated with
diagnostic and prognostic significance in breast, ovarian and colon
cancer (10,11). Based on previous studies, the
protein expression levels of several MMPs, such as MMP-1 and
MMP-12, are associated with malignancy and metastasis in human ESCC
(12,13). However, to date, there are no
studies which have systematically assessed the impact of all MMP
family members on the prognosis of ESCC to the best of our
knowledge.
Bioinformatics analysis has been used to identify
potential targets for cancer prevention and treatment (14,15),
establishing a theoretical framework to efficiently guide
experimental verification and research. Both Gene Expression
Omnibus (GEO; ncbi.nlm.nih.gov/geo/) and The Cancer Genome Atlas
(TCGA; cancer.gov/tcga.) databases contain
clinical data on cancer patients and their gene expression
profiles. In the present study, based on expression information
from these two databases, whether MMPs could be used to predict the
diagnosis and prognosis of patients with ESCC was assessed. The
potential role of MMPs in the growth and migration of ESCC cells
were assessed in vitro. The results showed that MMPs may
serve as potential diagnostic markers of ESCC, and that inhibition
of MMPs may be a potential therapeutic approach for treatment of
ESCC.
Materials and methods
Patient data
Microarray data from GSE53625 (16), GSE23400 (17) and GSE38129 (18) datasets were obtained from the GEO
database, whereas the RNA seq data from an ESCC cohort was
downloaded from TCGA. Clinicopathological characteristics,
including age, Tumor-Node-Metastasis (TNM) stage (19), tumor grade and sex, as well as
survival data were included in the GSE53625 dataset (179 cases) and
in TCGA (95 cases). Using SPSS version 23.0 (IBM, Corp.), the
association between overall survival (OS) and clinicopathological
characteristics of patients were investigated using univariate Cox
regression analysis. In addition, characteristics with P<0.3 in
the univariate analysis were further screened and used for
multivariate Cox regression analysis.
Identification of differentially
expressed genes (DEGs)
To identify important gene signatures within the MMP
family of proteins, differential gene expression analysis was
performed on the 4 datasets. The MMPs with a P value <0.05 were
considered DEGs. Using R version 64 3.6.1 (20), an Empirical Bayes statistical test
from the ‘limma’ package was used to analyze the GEO data, whereas
an exact test in ‘edgeR’ package (which is analogous to the
Fisher's exact test) was used to analyze TCGA data (21,22).
The MMP expression levels in all 4 datasets were shown through
construction of heat maps. Overlapping DEGs were shown in Venn
diagrams, and their expression is presented as box diagrams.
Prognostic value analysis of the MMP
family
Using the ‘survival’ package in R, the most suitable
combination of DEGs, the one with the best predictive ability, was
selected out through a stepwise multivariate Cox hazard regression
analysis (23). Pearson correlation
coefficients between all the MMP family members were also
calculated. Subsequently, the screened MMPs were used to establish
a prognosis scoring system. According to this analysis, the
adjusted hazard ratio (HR) was calculated. The risk scores for
patients with ESCC were calculated using the following formula:
Risk score=∑i=1nCoefi x Expi
where n indicates the gene number being used in the
model, Coef is the coefficient of each gene, and Exp is the gene
expression level. Based on the MMP signature, a nomogram which
could predict the survival rate of patients was constructed
(24). Also, the concordance index
(C index), which can assess the accuracy of the prediction model,
was calculated. Moreover, the receiver operating characteristic
(ROC) curve was plotted and the area under the curve (AUC) was
calculated to measure both the sensitivity and specificity of the
prediction model which applied when the AUC value was >0.6
(25). Based on the median value of
risk scores, the samples were stratified into low-risk and
high-risk groups, and the prognostic difference between these two
groups was investigated using Kaplan-Meier (K-M) survival curves.
In addition, the predictive value of a survival prediction model
based on the TNM stage using the ROC and the K-M curves was
determined.
Nomogram integrating the signature of
MMPs and TNM stage
Based on the coefficients from the multivariate Cox
regression analysis, a nomogram integrating the MMP signature and
TNM stage was constructed using the ‘rms’ package (26). The accuracy of the nomogram was
evaluated based both on the C index and AUC values. Additionally,
to graphically assess the performance of this nomogram, calibration
curves were plotted. According to the median value of the risk
scores calculated using Cox regression analysis, patients were
separated into two groups; the distribution of the risk score and
survival status of the patients were visualized to evaluate the
prognostic difference between the two groups.
Gene set enrichment analysis
(GSEA)
Using the expression profiles of tumor tissues, GSEA
was used to identify significantly enriched pathways between the
low-risk and high-risk groups defined by the MMP signature model
(27). Oncogenic signatures gene
sets (c6), Hallmark gene sets (h) and Kyoto Encyclopedia of Genes
and Genomes gene sets (c2) in which the pathways are associated
with the cancer process were used as references. Additional details
can be found from the Molecular Signatures Database (28). Gene sets with P<0.05 were defined
as indicators of significant differences. When gene sets had a
normalized enrichment score (NES) >0, the pathway represented by
this gene set was considered upregulated in the high-risk group,
otherwise, it was considered downregulated. Subsequently, weighted
gene co-expression network analysis (WGCNA) was performed using the
‘WGCNA’ package in R to identify co-expressed MMP genes within the
model (29). The networks of
co-expressed genes were drawn using Cytoscape (version 3.7.1)
(30).
Cell lines and cell culture
KYSE30 and KYSE450 cell lines were purchased from
The Cell Bank of Type Culture Collection of the Chinese Academy of
Sciences. Cells were cultured in RPMI-1640 medium (Gibco; Thermo
Fisher Scientific, Inc.) supplemented with 10% FBS (Gibco; Thermo
Fisher Scientific, Inc.), 100 U/ml penicillin (Gibco; Thermo Fisher
Scientific, Inc.), and 100 µg/ml streptomycin (Gibco; Thermo Fisher
Scientific, Inc.) and incubated at 37°C in a humidified incubator
with 5% CO2.
Cell proliferation and colony
formation assays
Cell proliferation was measured using a Cell
Counting Kit-8 (CCK-8) assay (Beyotime Institute of Biotechnology).
Briefly, ESCC cells were seeded in a 96-well plate with
2×10³ cells/well. BB-94 (Selleck Chemicals, cat. no.
S7155) was added to the wells at final concentrations of 0, 10, 20
or 40 µM. After 24, 48 or 72 h of treatment, 10 µl CCK-8 reagent
was added to each well and incubated at 37°C for 2 h. The
absorbance was measured at 450 nm using a microplate reader
(Bio-Rad Laboratories Inc.).
To perform colony formation assays, 500 cells were
seeded in a 6-well plate. After a 24 h incubation at 37°C, BB-94
was added to the wells to a final concentration of 0, 10, 20 or 40
µM. Cells were incubated for 7 days and the medium was removed and
plates were washed with PBS. Cells were then fixed with methanol
for 15 min at 25°C and stained with 0.1% crystal violet for 5 min
at room temperature. Images of cell colonies were captured using a
scanner (Canon).
Wound healing assay
ESCC cells were seeded in 6-well plates. Using the
tip of a 20 µl micropipette, a scratch was made in the middle of
the well, and cells were washed 3 times with PBS. ESCC cells were
incubated in 2 ml serum-free medium containing different
concentrations of BB-94 (0, 10, 20 or 40 µM). After 24 h, migration
was observed and recorded under an inverted light microscope
(magnification, ×40; Zeiss GmbH). The distances between the edges
of the scratches were measured using ImageJ (FIJI distribution,
version 1.52n, National Institutes of Health).
Western blotting
Proteins were extracted from ESCC cells using RIPA
lysis buffer containing both a protease inhibitor cocktail and a
phosphatase inhibitor cocktail (Beyotime Institute of
Biotechnology). Protein concentrations were determined using a
bicinchoninic acid assay kit (Beyotime Institute of Biotechnology).
Proteins were resolved using SDS-PAGE with a 6–12% separation gel
and 5% concentration gel using the Laemmli discontinuous buffer
system and transferred to PVDF membranes (EMD Millipore). After
blocking the membranes in 5% skimmed milk for 1 h at room
temperature, they were incubated with primary antibodies diluted in
PBS with 0.1% Tween 20 (PBST) overnight at 4°C. Primary antibodies
used were anti-GAPDH (1:3,000; cat. no. 5174S) and an
epithelial-mesenchymal transition (EMT) Antibody Sampler kit (cat.
no. 9782T), which included E-Cadherin (1:2,000), Vimentin
(1:3,000), β-Catenin (1:3,000), snail (1:3,000) and slug (1:3,000)
antibodies, all of which were purchased from Cell Signaling
Technology, Inc. After washing the membranes 3 times with PBST,
they were incubated with secondary horseradish peroxidase
(HRP)-conjugated antibodies (1:2,000; cat. no. 7074; Cell Signaling
Technology, Inc.) for 1 h at room temperature. Signals were
visualized using a Chemiluminescent HRP Substrate (EMD Millipore)
and visualized with a UVP GelStudio PLUS Touch Imaging system
(Analytik Jena).
Statistical analysis
R version 3.61, SPSS version 23.0 (IBM Corp) and
GraphPad Prism version 8 (GraphPad Software, Inc.) were used to
analyze obtained data. Two-tailed P values <0.05 were considered
to indicate a statistically significant difference. The difference
in MMP expression levels between normal and tumor tissues was
compared using a paired Student's t-test. Univariate and
multivariate Cox regression analyses were used to screen the
independent prognostic variables of OS; and the variables
considered significant (P<0.05) were used to establish the risk
score formula and to construct the nomograms. A stepwise
multivariate Cox hazard regression analysis was used to screen MMPs
to construct the best prediction model. Samples were separated into
two groups (low- and high-risk groups) based on the median value of
the risk score. K-M survival curves were plotted, and survival was
compared using a log rank test. The AUC was used to as a measure of
the accuracy of the predictive models at the indicated times. The
performance of the nomogram was validated by assessing the
calibration curves as well. Experimental data are presented as the
mean ± standard deviation of at least 3 independent experiments and
results were analyzed using an ANOVA with a Bonferroni post hoc
test.
Results
Cox regression analysis of ESCC
patient clinical data
The GSE53625 dataset and TCGA database which
included the complete clinical data of patients (Tables SI and SII, respectively) were used for Cox
regression analysis. Univariate Cox regression analysis of the
GSE53625 dataset showed that the TNM stage, age and N stage were
significantly associated with OS (P<0.001, P=0.021 and P=0.030,
respectively; Fig. 1A).
Characteristics with P<0.3 in the univariate analysis were
further screened and used for multivariate analysis. The TNM stage
was an independent prognostic factor (P=0.001; Fig. 1B). Furthermore, univariate Cox
regression analysis of the data from TCGA showed that sex, TNM
stage and N stage were significantly correlated with OS (P=0.020,
P=0.015 and P=0.012, respectively; Fig.
1C). Multivariate Cox regression analysis indicated that both
sex and the N stage were independent prognostic factors (P=0.047
and P=0.012, respectively; Fig.
1D).
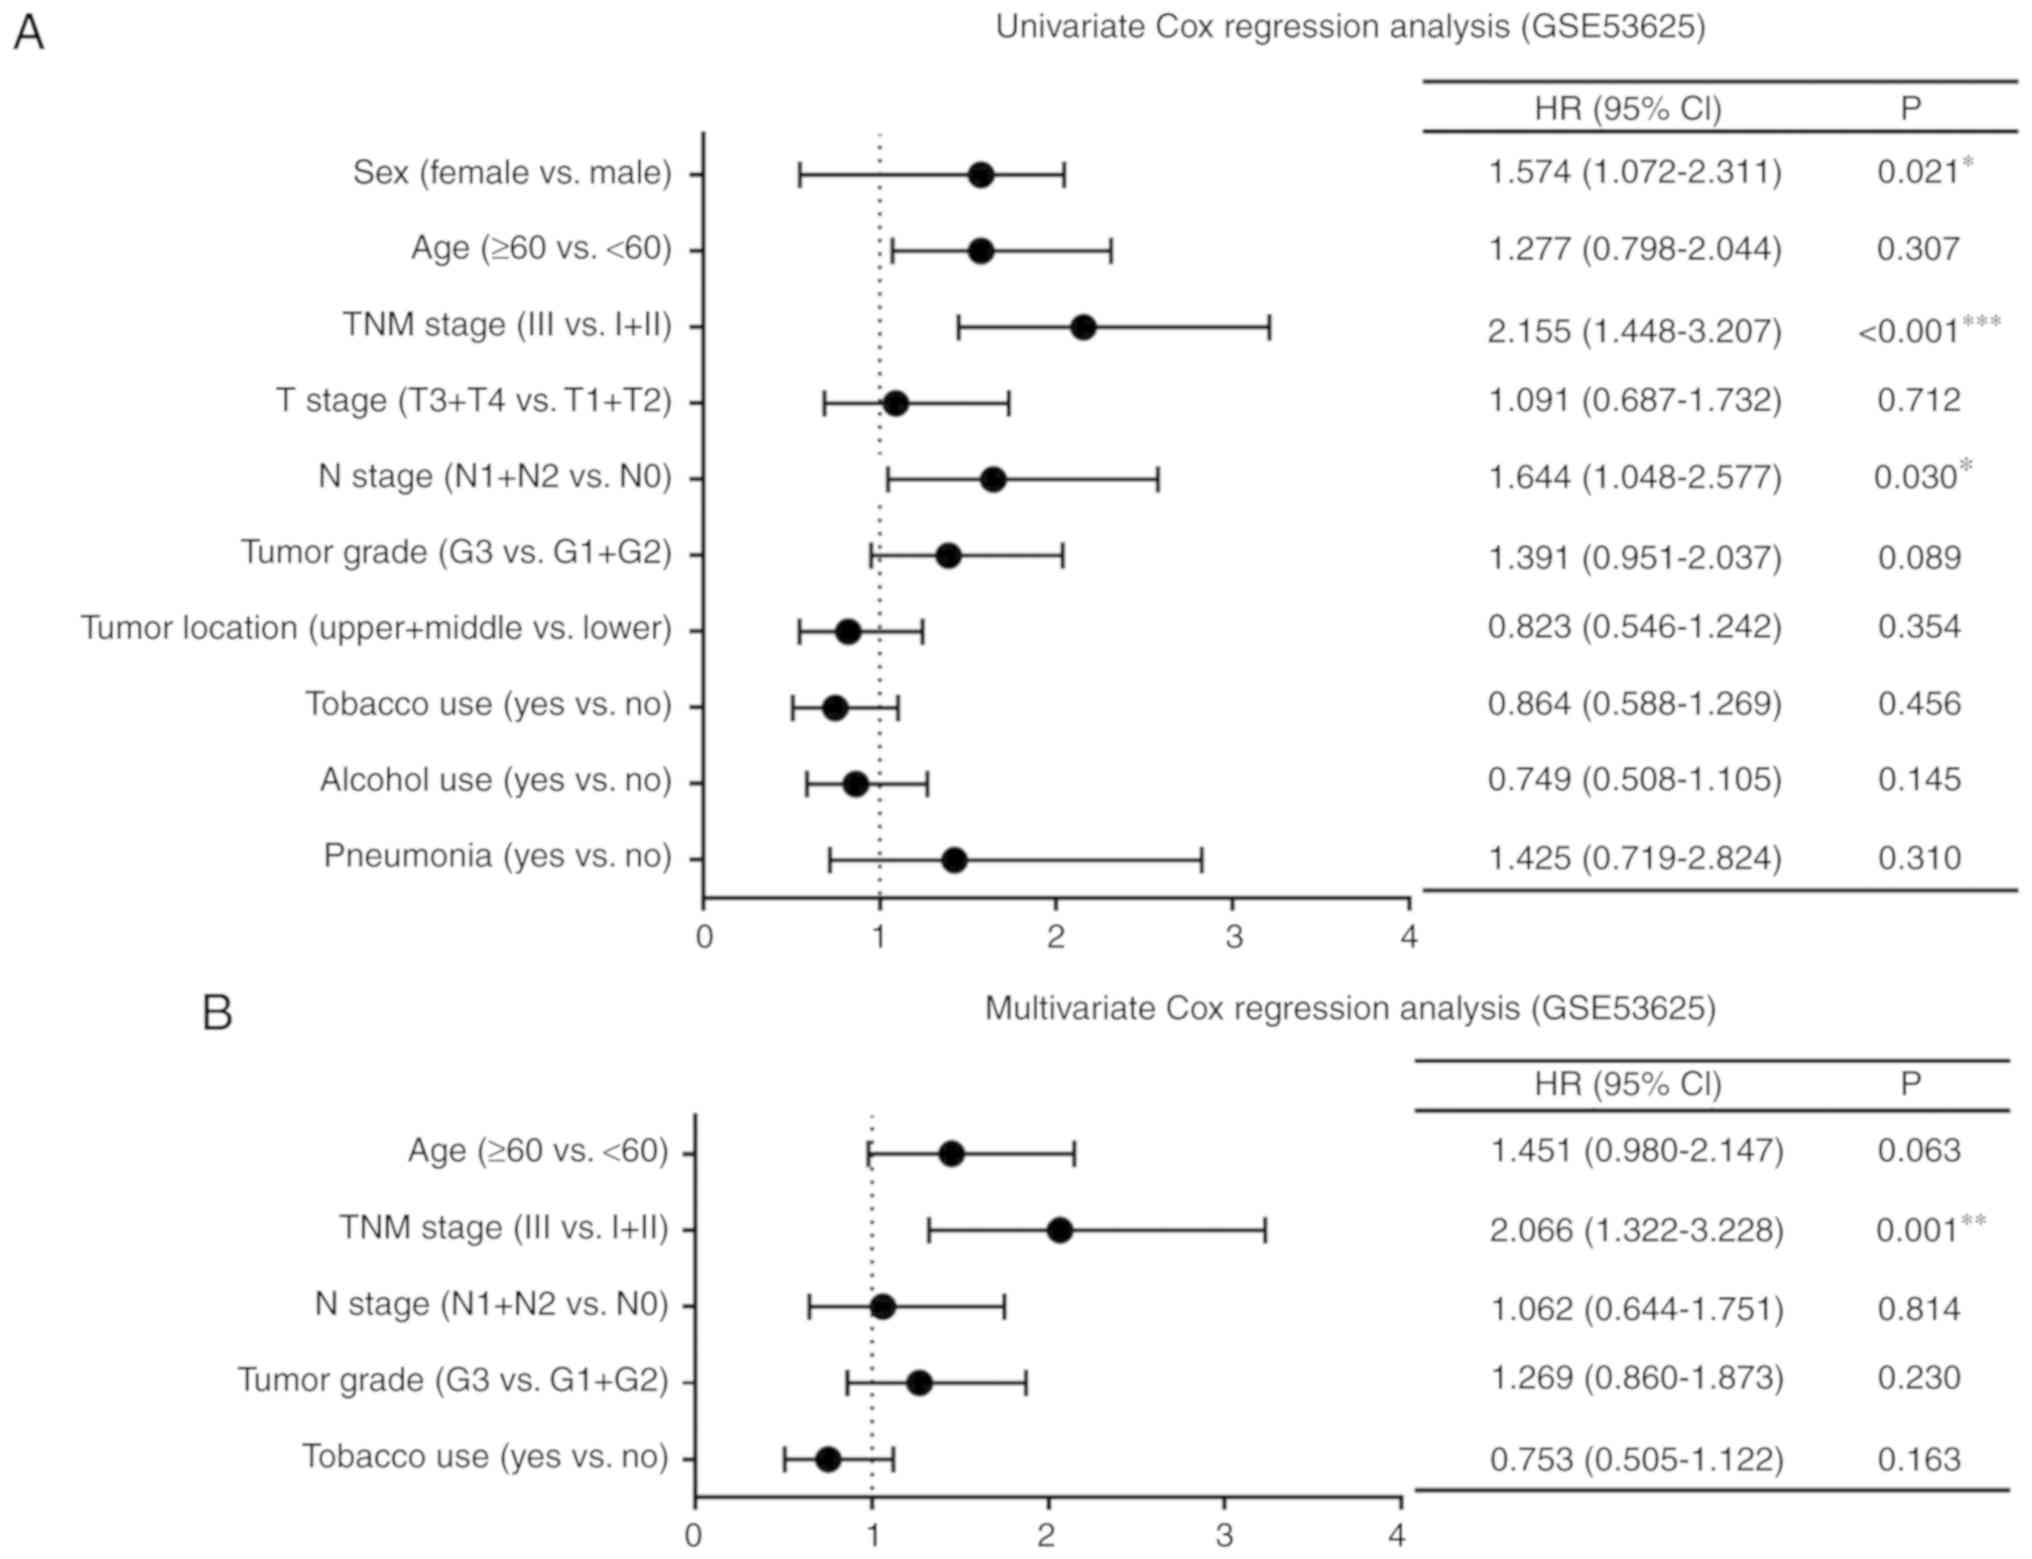 | Figure 1.Cox regression analysis of clinical
data of patients with ESCC. Forest plots of univariate and
multivariate Cox regression analysis of clinicopathological
characteristics affecting OS in patients with ESCC in (A and B) the
GSE53625 dataset and (C and D) TCGA. *P<0.05, **P<0.01,
***P<0.001. TNM stage, Tumor-Node-Metastasis stage; HR, hazard
ratio; 95% CI, 95% confidence interval; T stage, stage of tumor
invasion; N stage, stage of regional lymph node invasion; ESCC,
esophageal squamous cell carcinoma; OS, overall survival; TCGA, The
Cancer Genome Atlas. |
Identification of differentially
expressed MMPs in the 4 datasets
DEGs of the MMP family were identified; detailed
results including the logarithm of fold change (log FC) and P
values are shown in Tables
SIII–SVI. Gene expression
profiles of the MMP family members are displayed in heat maps and
20, 13, 12 and 17 DEGs were identified in GSE53625, GSE23400,
GSE38129 and TCGA datasets, respectively (Fig. 2A-D). A Venn diagram showed 8
overlapping MMPs (MMP-1, −3, −9, −10, −11, −12, −13 and −14) were
dysregulated in ESCC (Fig. 2E). In
addition, box diagrams showing the expression levels of these
overlapping DEGs from the 4 datasets showed that all these MMPs
were upregulated in tumor tissues (Fig.
2F-I). These results suggest that these MMPs may serve as
potential diagnostic markers for ESCC.
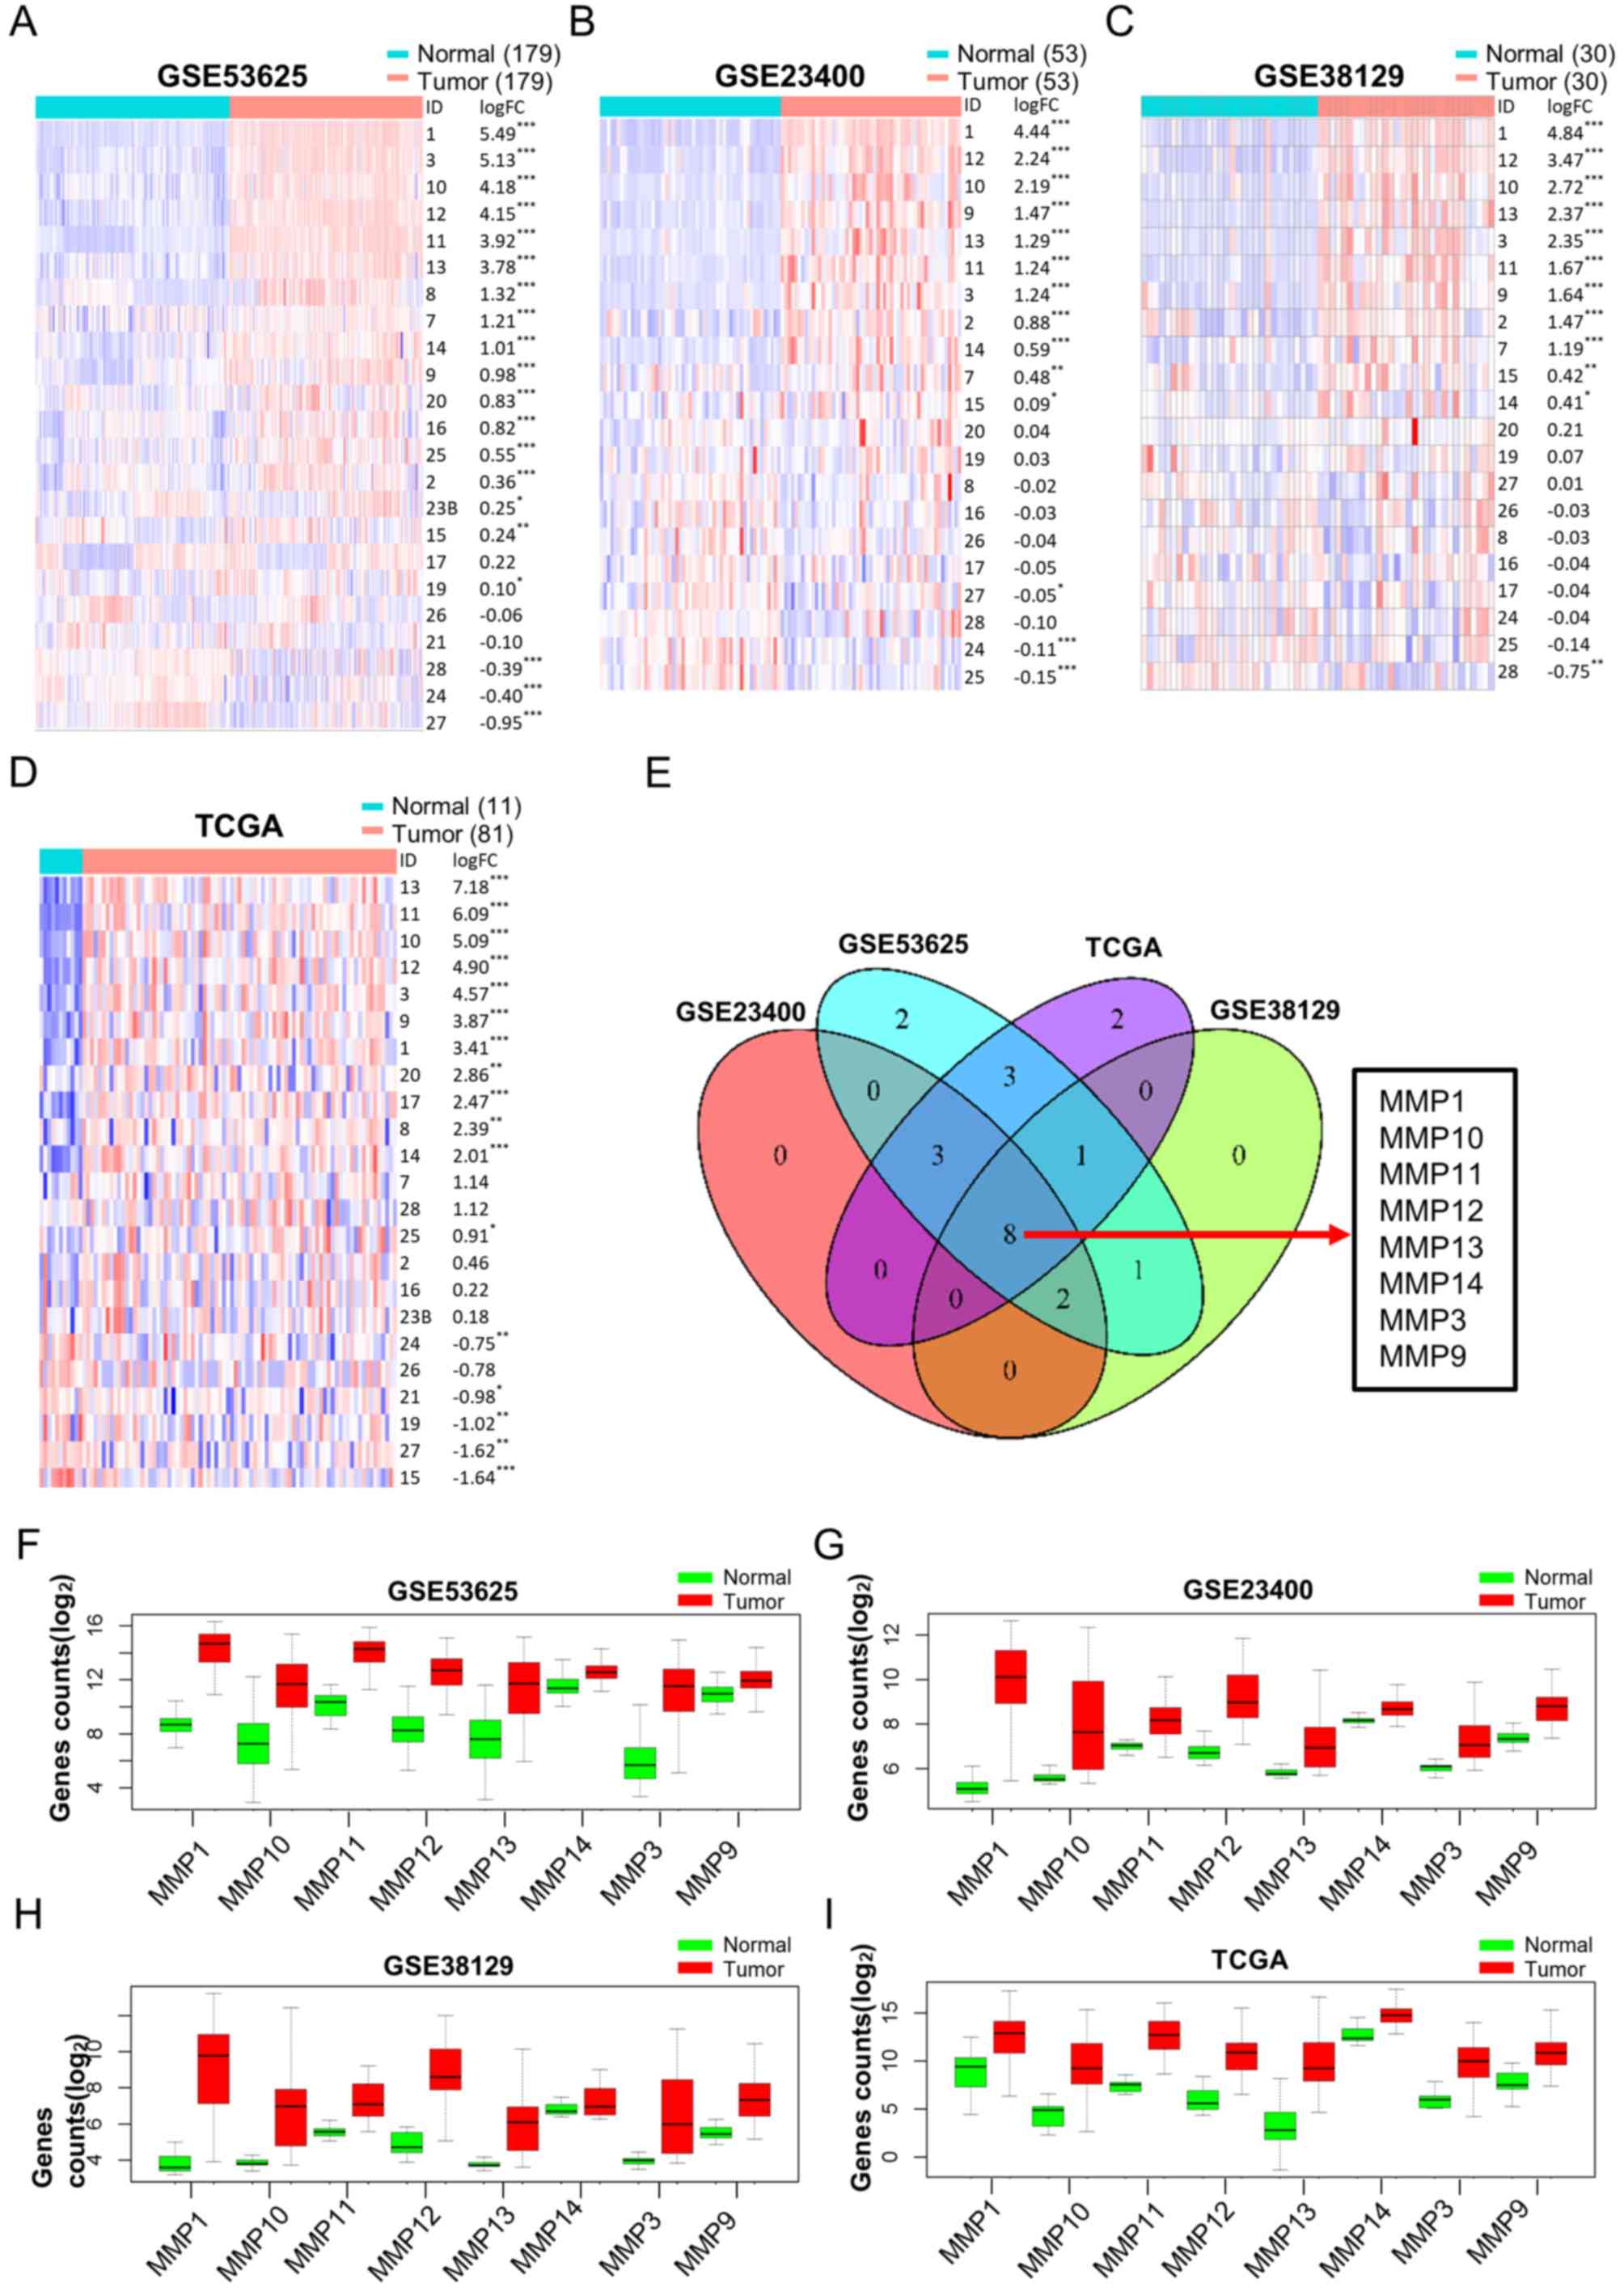 | Figure 2.Differential MMP expression analysis
between tumor and normal tissues in ESCC. Heat maps, sorted in
descending order of log FC, including every MMP in (A) GSE53625,
(B) GSE23400 and (C) GSE38129 datasets, and in (D) TCGA database.
Red and blue colors represent high and low expression,
respectively. (E) Venn diagram showing overlapping dysregulated
MMPs based on the 4 datasets mentioned above. (F-I) Box diagrams
showing the expression levels of the 8 overlapping dysregulated
MMPs in tumor tissues compared with normal tissues in all 4
datasets. *P<0.05, **P<0.01, ***P<0.001. MMP, matrix
metalloproteinase; ESCC, esophageal squamous cell carcinoma; FC,
fold change; TCGA, The Cancer Genome Atlas. |
Prognostic value of the MMP signature
and TNM stage models for ESCC
To investigate the prognostic values of MMPs, DEGs
were screened to construct a prediction model based on GSE53625 and
TCGA, both of which contained clinical data. Using the GSE53625
dataset, a heat map showing the log FCs and HRs of DEGs was
constructed; from these, 6 differentially expressed MMPs (MMP-1,
−8, −9, −13, −25 and −28) were screened out to construct a
prediction model using a stepwise multivariate Cox hazard
regression analysis (Fig. 3A).
Subsequently, the adjusted HRs of the 6 selected MMPs were shown in
a forest plot, which suggested that MMP-1 (HR=0.76; CI, 0.65–0.88;
P<0.001), MMP-8 (HR=1.18; CI, 1.03–1.36; P=0.019) and MMP-25
(HR=0.72; CI, 0.53–0.98; P=0.036) were independent prognostic
factors (Fig. 3B). According to the
coefficients and gene expression levels (Exp) of these MMPs, the
risk score of ESCC patients was calculated based on the following
formula: Risk score=Exp MMP-13 ×0.82-Exp MMP-1 ×2.72-Exp MMP-25
×2.23+Exp MMP-28 ×1.04+Exp MMP-8 ×0.71+Exp MMP-9 ×1.80. In
addition, an MMP signature nomogram was constructed to predict the
survival rates of ESCC patients (C index=0.617, Fig. 3C). To evaluate the accuracy of this
model, ROC curves were drawn, and their relative AUC values were
calculated. As shown in Fig. 3D and
E, the AUC value of the MMP signature model reached 0.671,
which was higher than that of the prediction model based on the TNM
stage (AUC=0.637) (31). The latter
is commonly used to predict the prognosis of cancer patients.
Finally, based on the median risk score, ESCC patients were divided
into low-risk and high-risk groups; a survival curve indicated that
patients with lower risk scores had improved survival (P=0.009;
Fig. 3F). Patients at TNM stage
I/II also showed significantly higher survival rates compared with
patients at TNM stage III (P=0.000; Fig. 3G). Survival and ROC curves of each
selected MMP are shown in Fig.
S1A-B, and the survival curves were generally consistent with
the results from the website OSescc (bioinfo.henu.edu.cn/DBList.jsp), a tool to assess OS
and relapse free survival based on the expression of given genes or
probes (32). To analyze the
correlation among each MMP gene, Pearson correlation coefficients
of all the MMP family members were also calculated (Fig. S1C). Notably, similar results,
including both ROC and survival curves of the prediction model,
were obtained using TCGA (81 cases) which had a smaller sample size
than the GSE53625 dataset (179 cases; Fig. S1D-G). Thus, MMPs were accurate
prognostic predictive factors of ESCC.
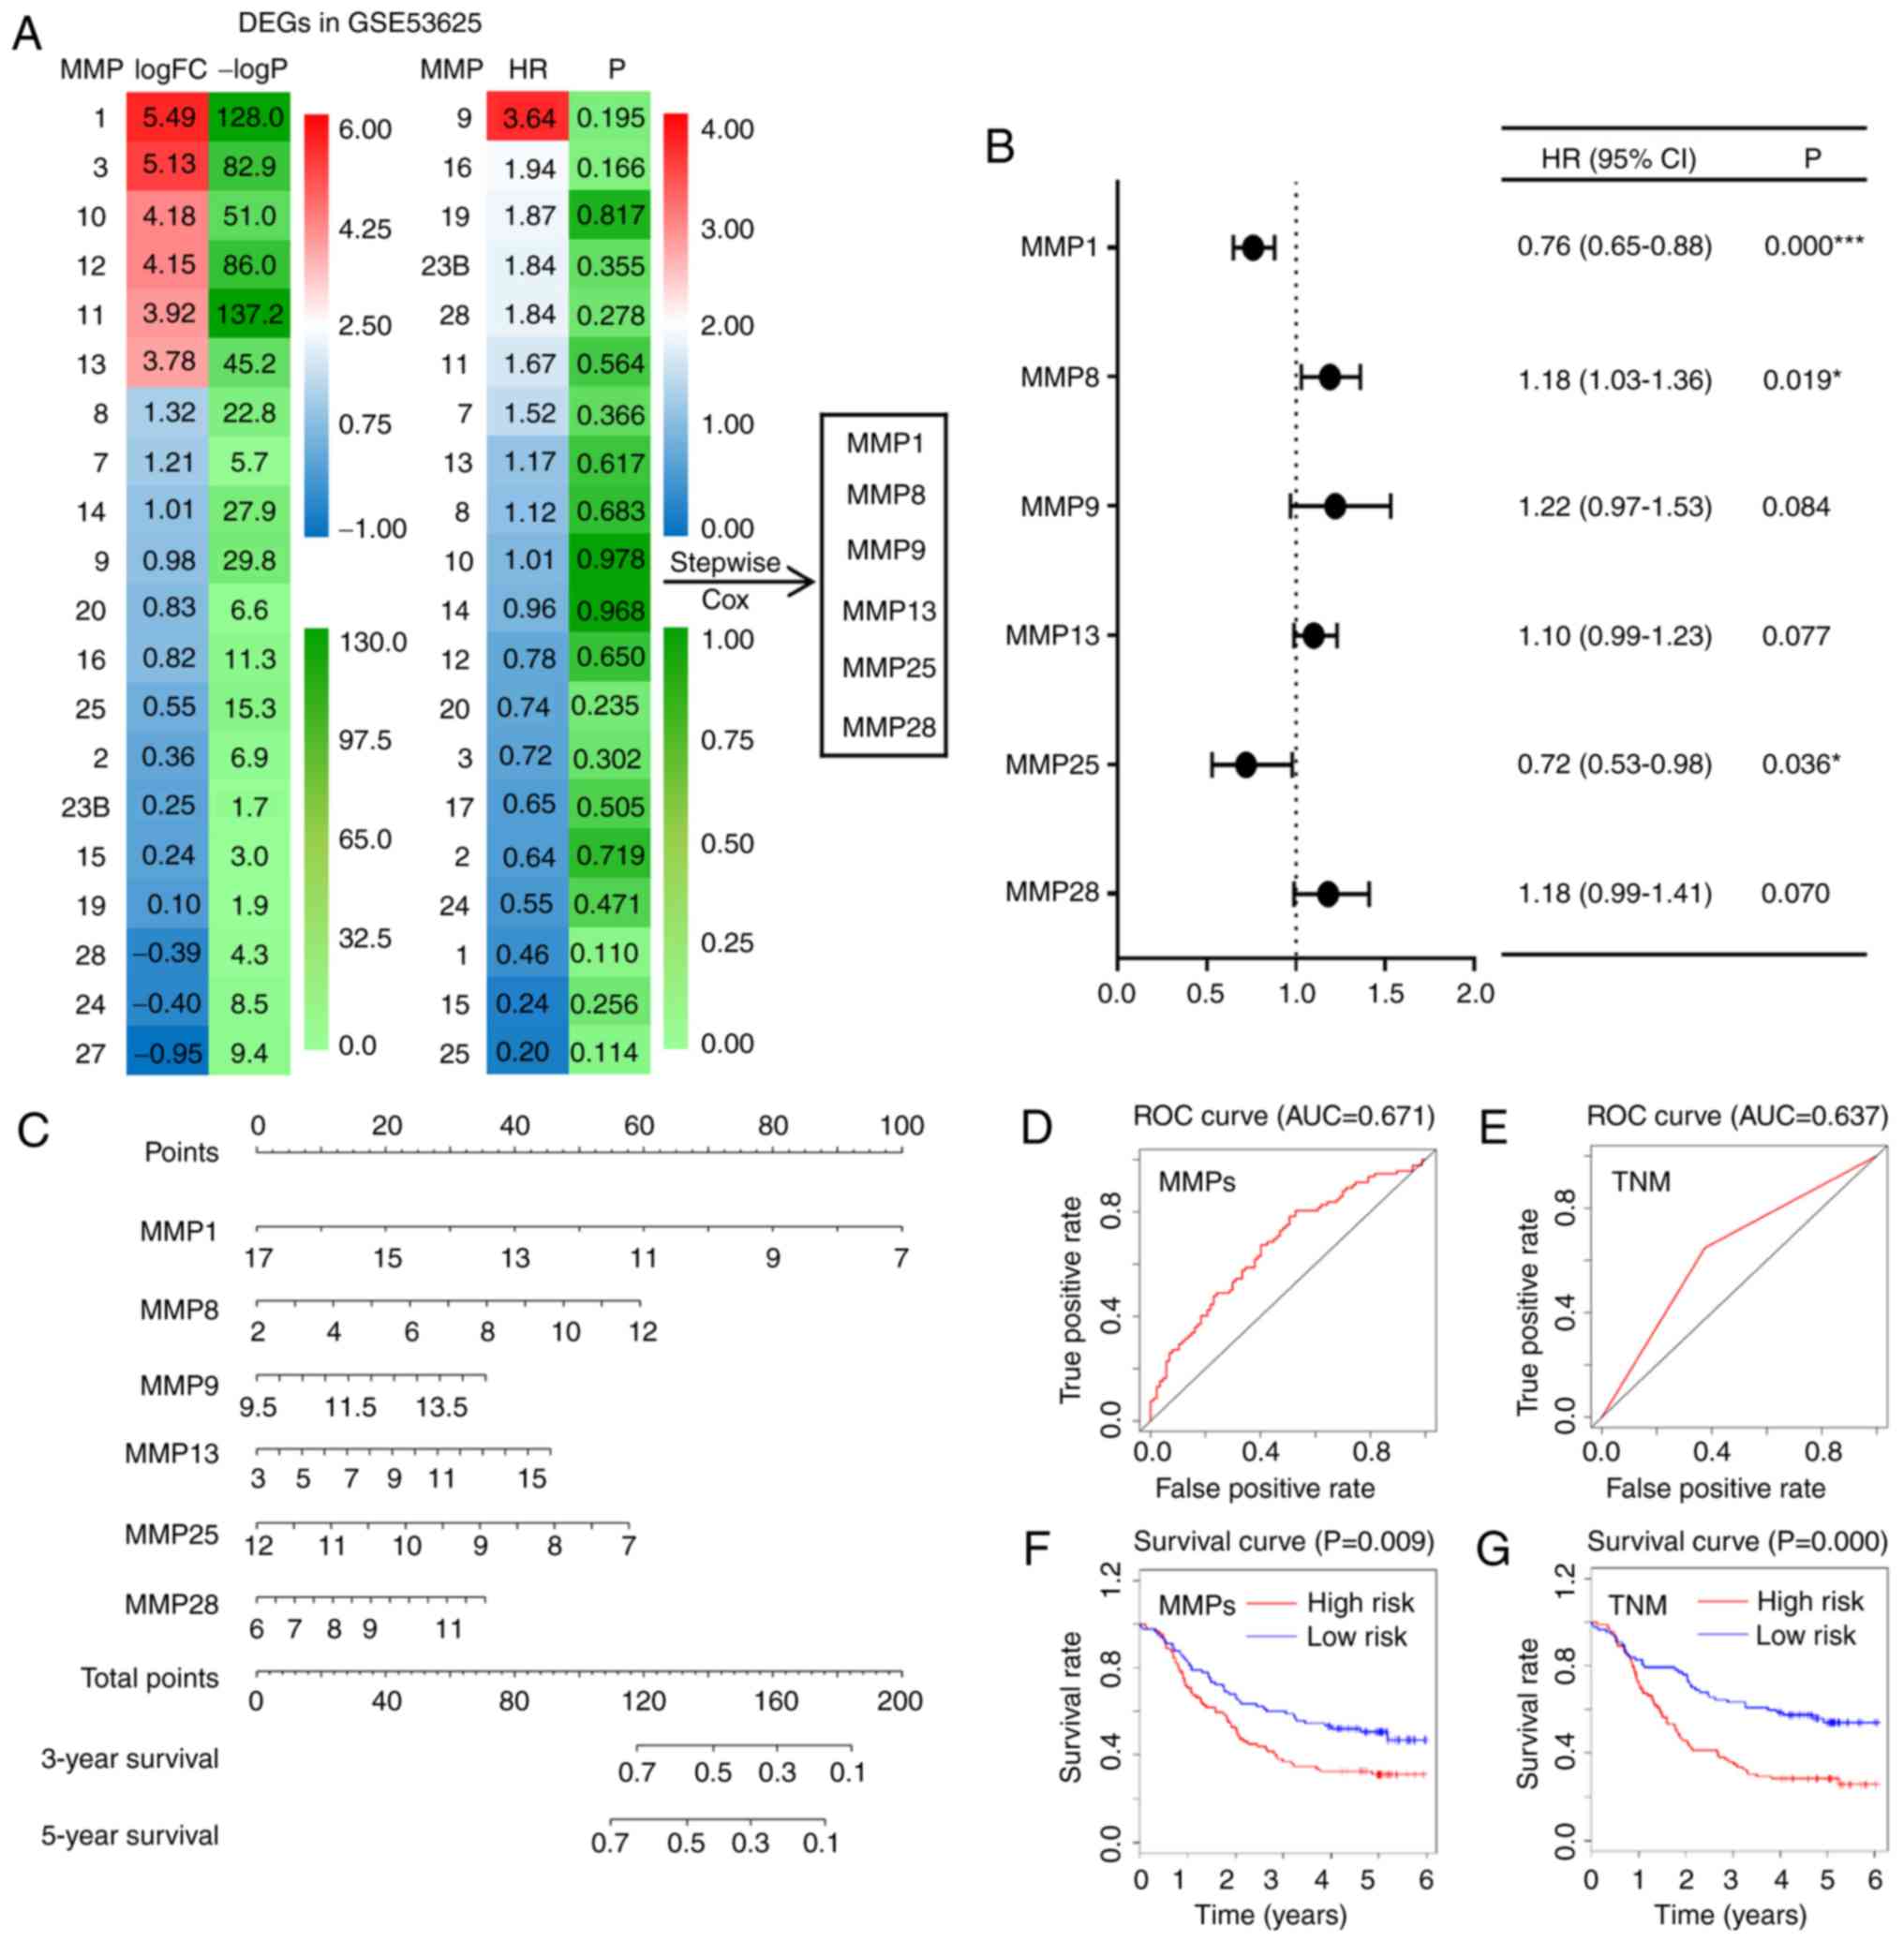 | Figure 3.Prediction models based on MMP
expression or TNM stage for ESCC. (A) Heat maps showing the log FCs
and HRs of DEGs in the GSE53625 dataset. Based on six of the DEGs,
a stepwise multivariate Cox hazard regression analysis was
performed to screen the best MMP signature. (B) Forest plot of the
adjusted HRs, 95% CIs of HR, and P values of the MMPs included in
the model. (C) Nomogram to visualize the MMP signature prediction
model. (D and E) ROC curves of both the MMP model and the TNM stage
model. (F and G) Kaplan-Meier curves of the risk scores calculated
using the prediction models. *P<0.05, ***P<0.001. MMP, matrix
metalloproteinase; TNM stage, Tumor-Node-Metastasis stage; ESCC,
esophageal squamous cell carcinoma; FC, fold change; HR, hazard
ratio; DEG, differentially expressed gene; 95% CI, 95% confidence
interval; ROC, receiver operating characteristic. |
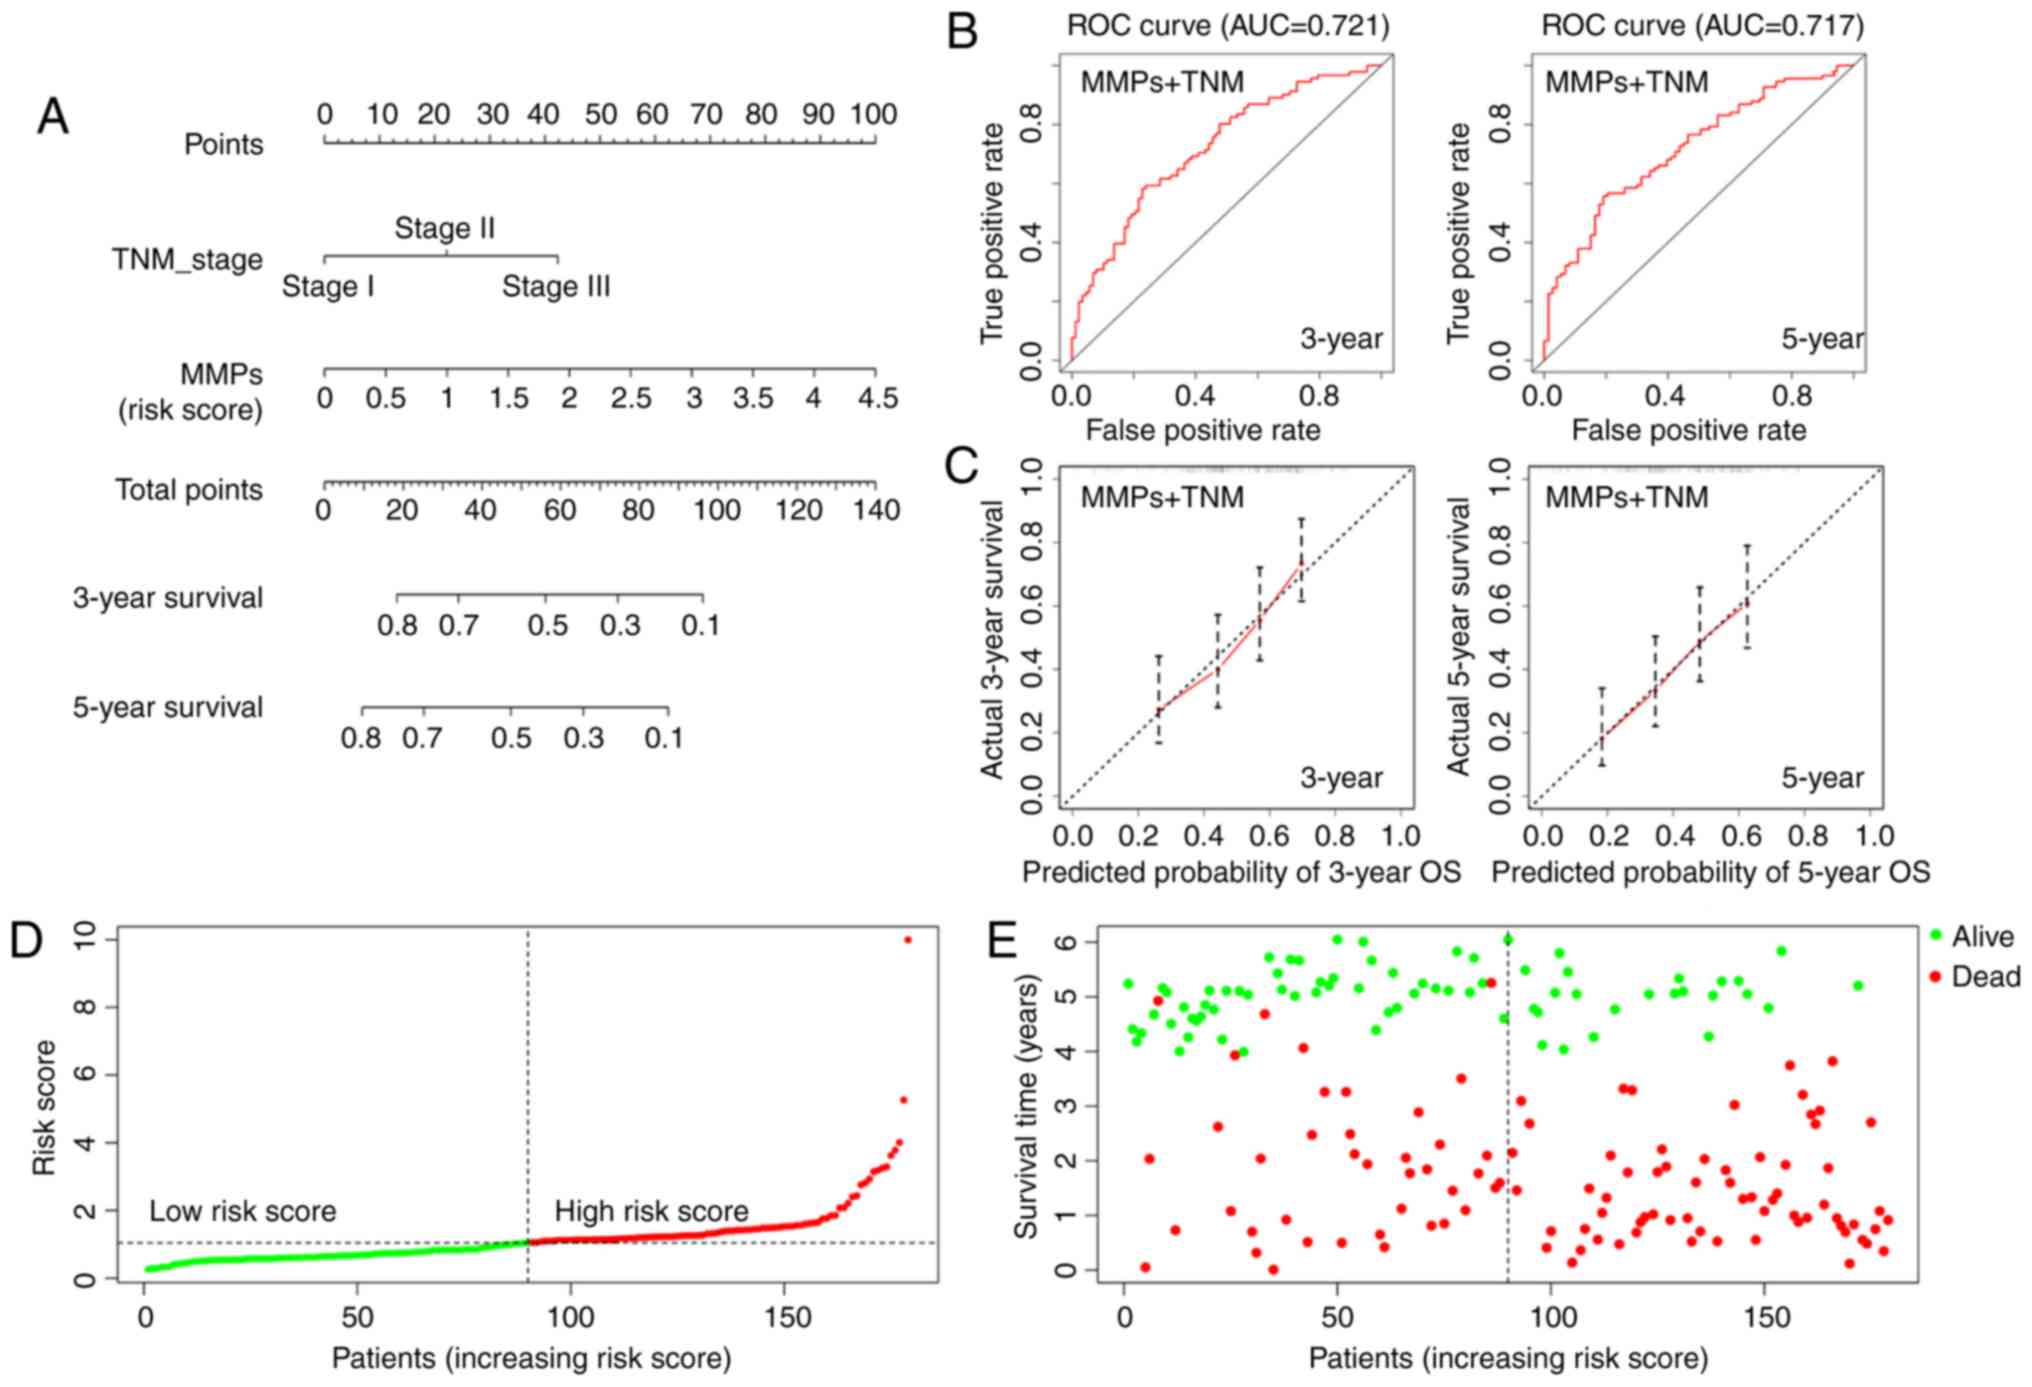
Prognostic value of a model combining
the MMP signature model and the TNM stage model
To develop a more accurate prediction model, a
nomogram was constructed integrating both the MMP signature and TNM
stage (C index=0.652; Fig. 4A). The
ROC curves indicated that the MMP-TNM-integrated nomogram had
improved predictive ability compared with each model alone
(AUC=0.721 for 3-year survival, AUC=0.717 for 5-year; Fig. 4B). The calibration curves indicated
that the predicted outcome was broadly consistent with the actual
outcome, suggesting that the new model accurately predicted the
results (Fig. 4C). In addition, the
risk scores of patients were calculated using the combined model,
resulting in a reclassification of patients as belonging to either
a low-risk or a high-risk group (Fig.
4D). Accordingly, in the distribution chart of survival status,
the number of surviving patients from the low-risk group was 51,
while the number of deaths was 39. By contrast, there were 22
patients alive and 67 dead in the high-risk group (Fig. 4E). The distribution map of survival
status showed that the patients from the high-risk group had higher
mortality rates. Therefore, the MMP-TNM-integrated nomogram may be
a more effective tool for clinicians to predict prognosis of ESCC
patients.
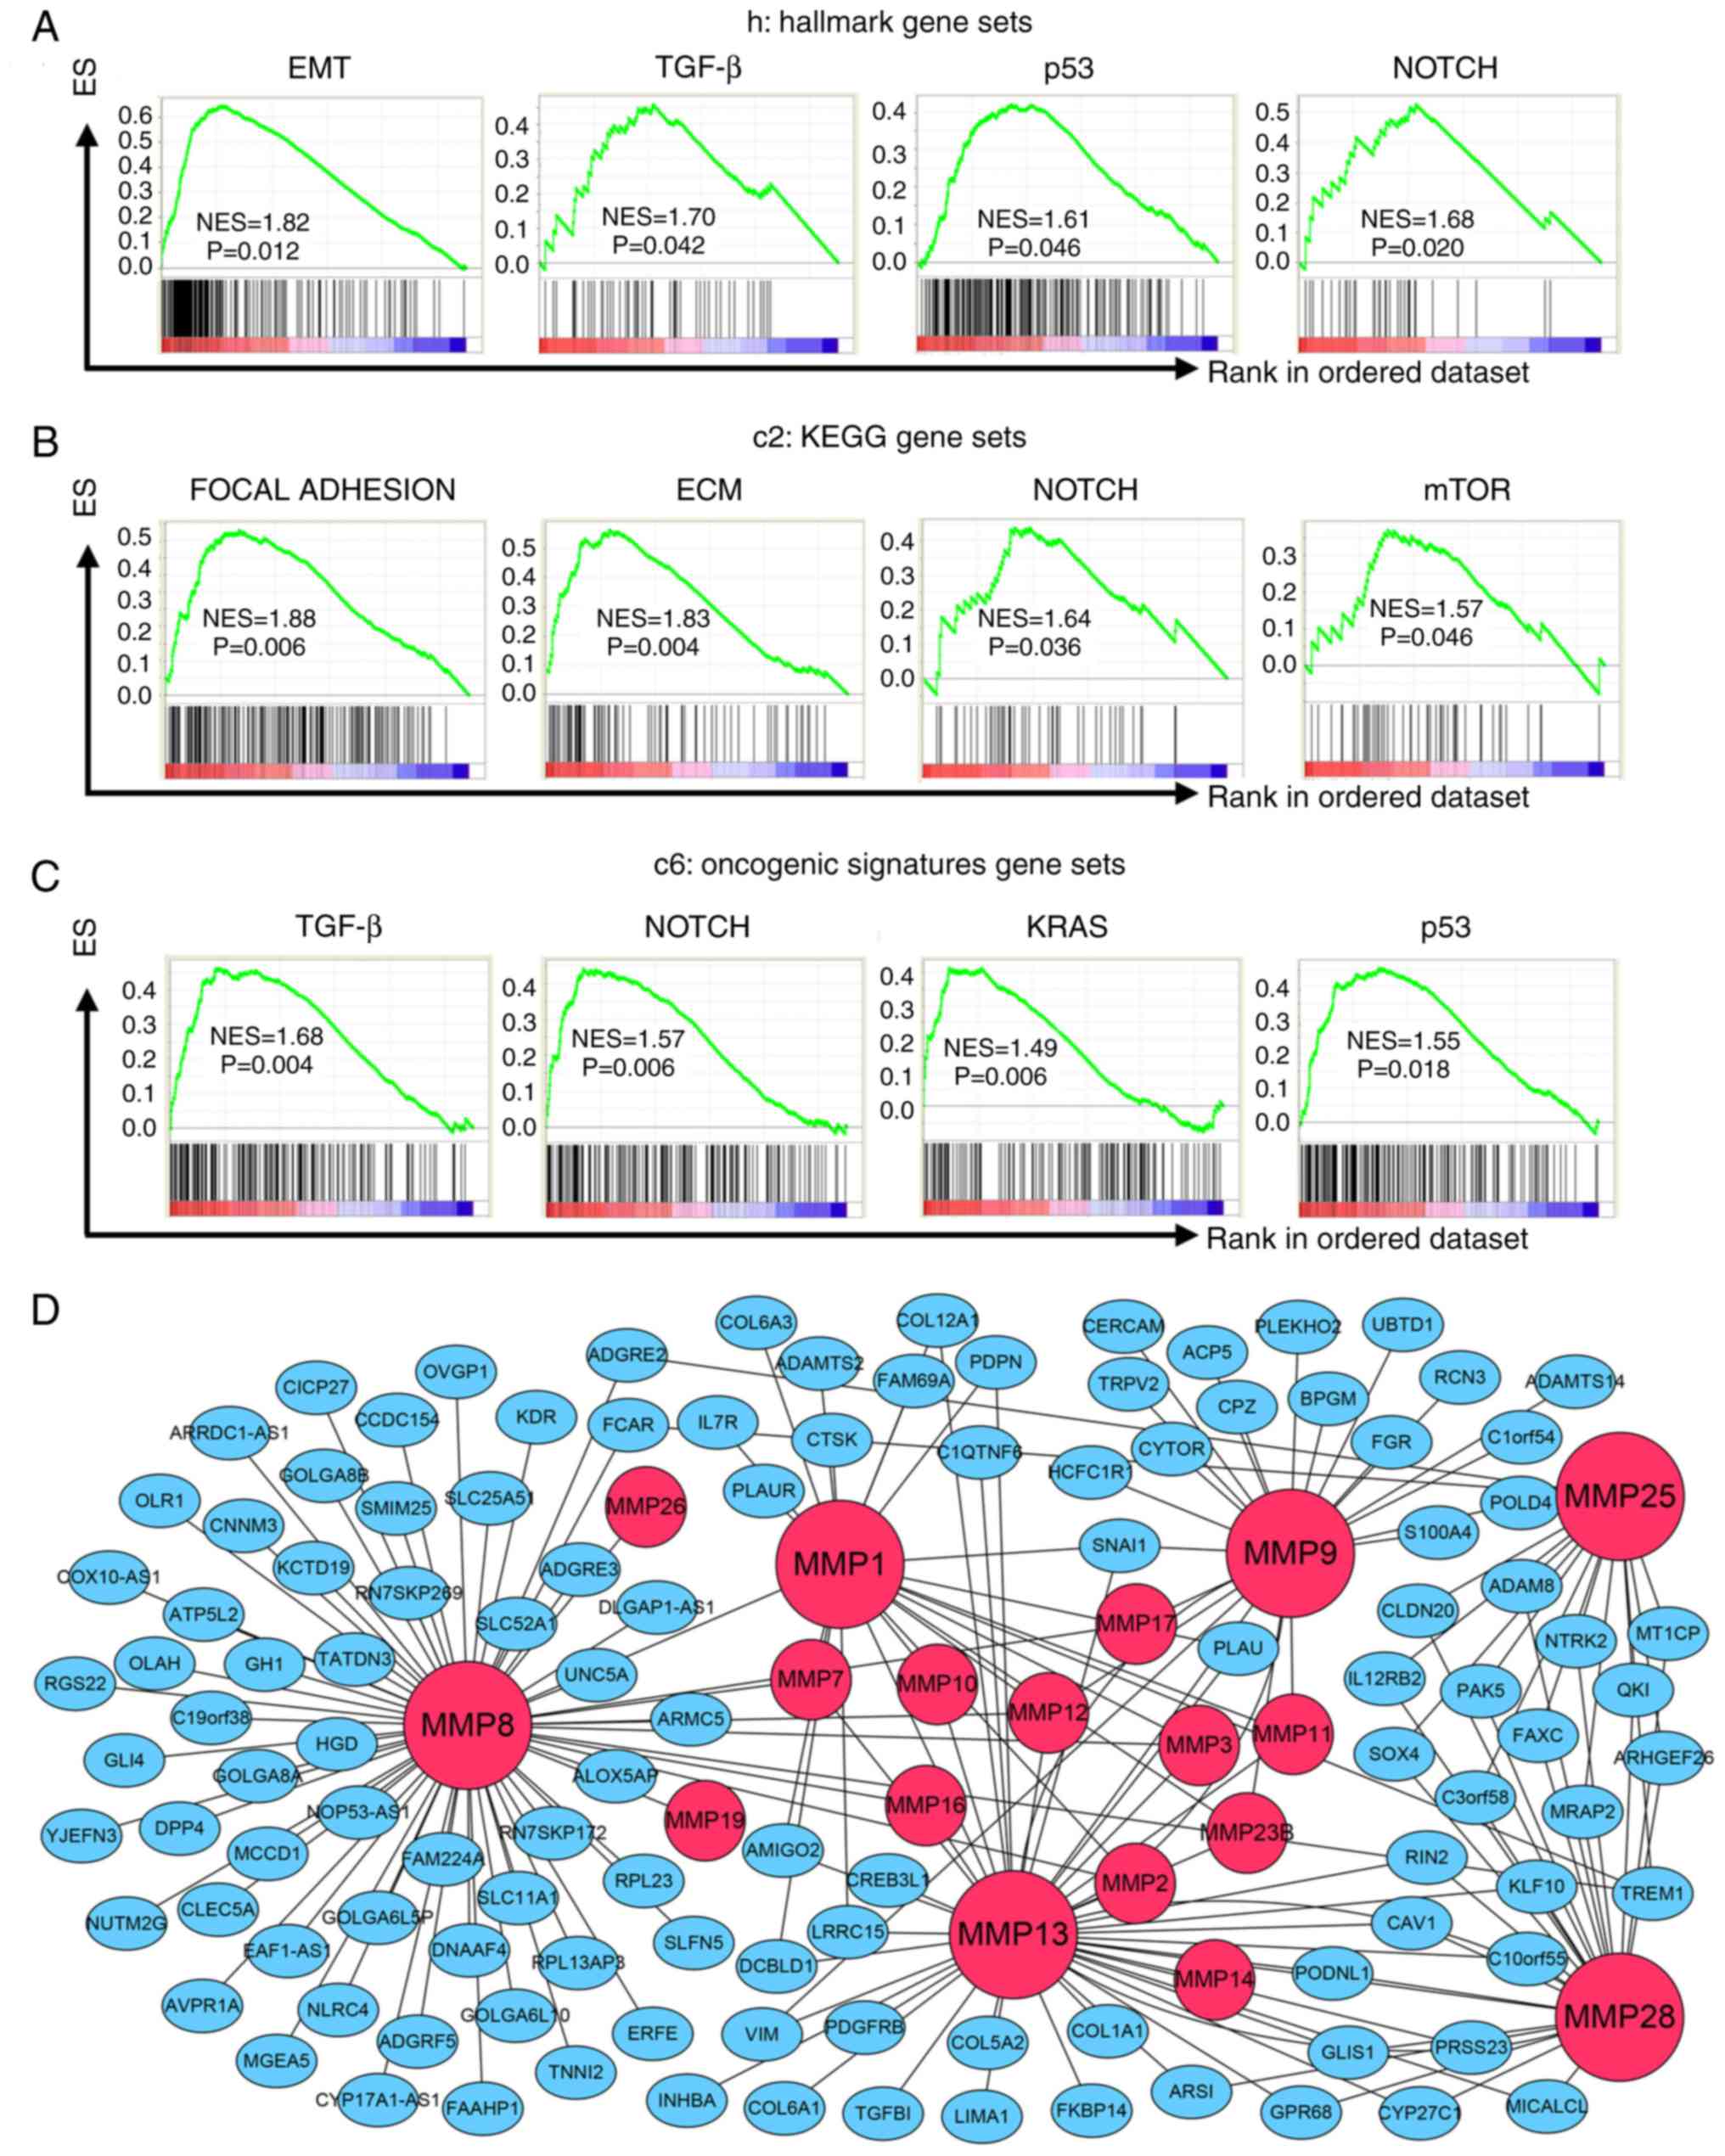
Biological function of MMP family
members in ESCC
To determine how MMPs affect ESCC cells, GSEA was
performed based on the risk score calculated by the MMP signature
model. Tables SVII–IX show all the
results which were significant (P<0.05), whereas Fig. 5 shows those the signaling pathways
that were tightly associated with cancer. Based on hallmark gene
sets, signaling pathways including EMT, TGF-β, P53 and Notch
signaling were significantly enriched in the high-risk score group
(Fig. 5A). Cancer-associated
pathways from the KEGG gene sets included focal adhesion, ECM
receptor interaction, Notch signaling pathway and mTOR signaling
(Fig. 5B). In addition, results
based on oncogenic signature gene sets indicated that the high-risk
score group was significantly associated with TGF-β, Notch, KRAS
and P53 pathways (Fig. 5C).
Moreover, a co-expression gene network of the 6 MMPs included in
the MMP signature was constructed (Fig.
5D). These 6 MMPs are marked as large red nodes, whereas
smaller red nodes are used to represent the other MMP family
members co-expressed with these 6 MMPs. Blue nodes represent the
other co-expressed genes. The gene network clearly showed that
vimentin and SNAI1 were associated with both MMP-13 and MMP-9.
SNAI1 was also correlated with MMP-1, whereas TGFB1 was associated
with MMP-13. In addition, COL12A1, COL1A1, COL5A2, COL6A1 and
COL6A3, which belong to collagen family of proteins, were
associated with MMP family members. These results suggest that MMPs
may participate in ESCC cell growth and migration.
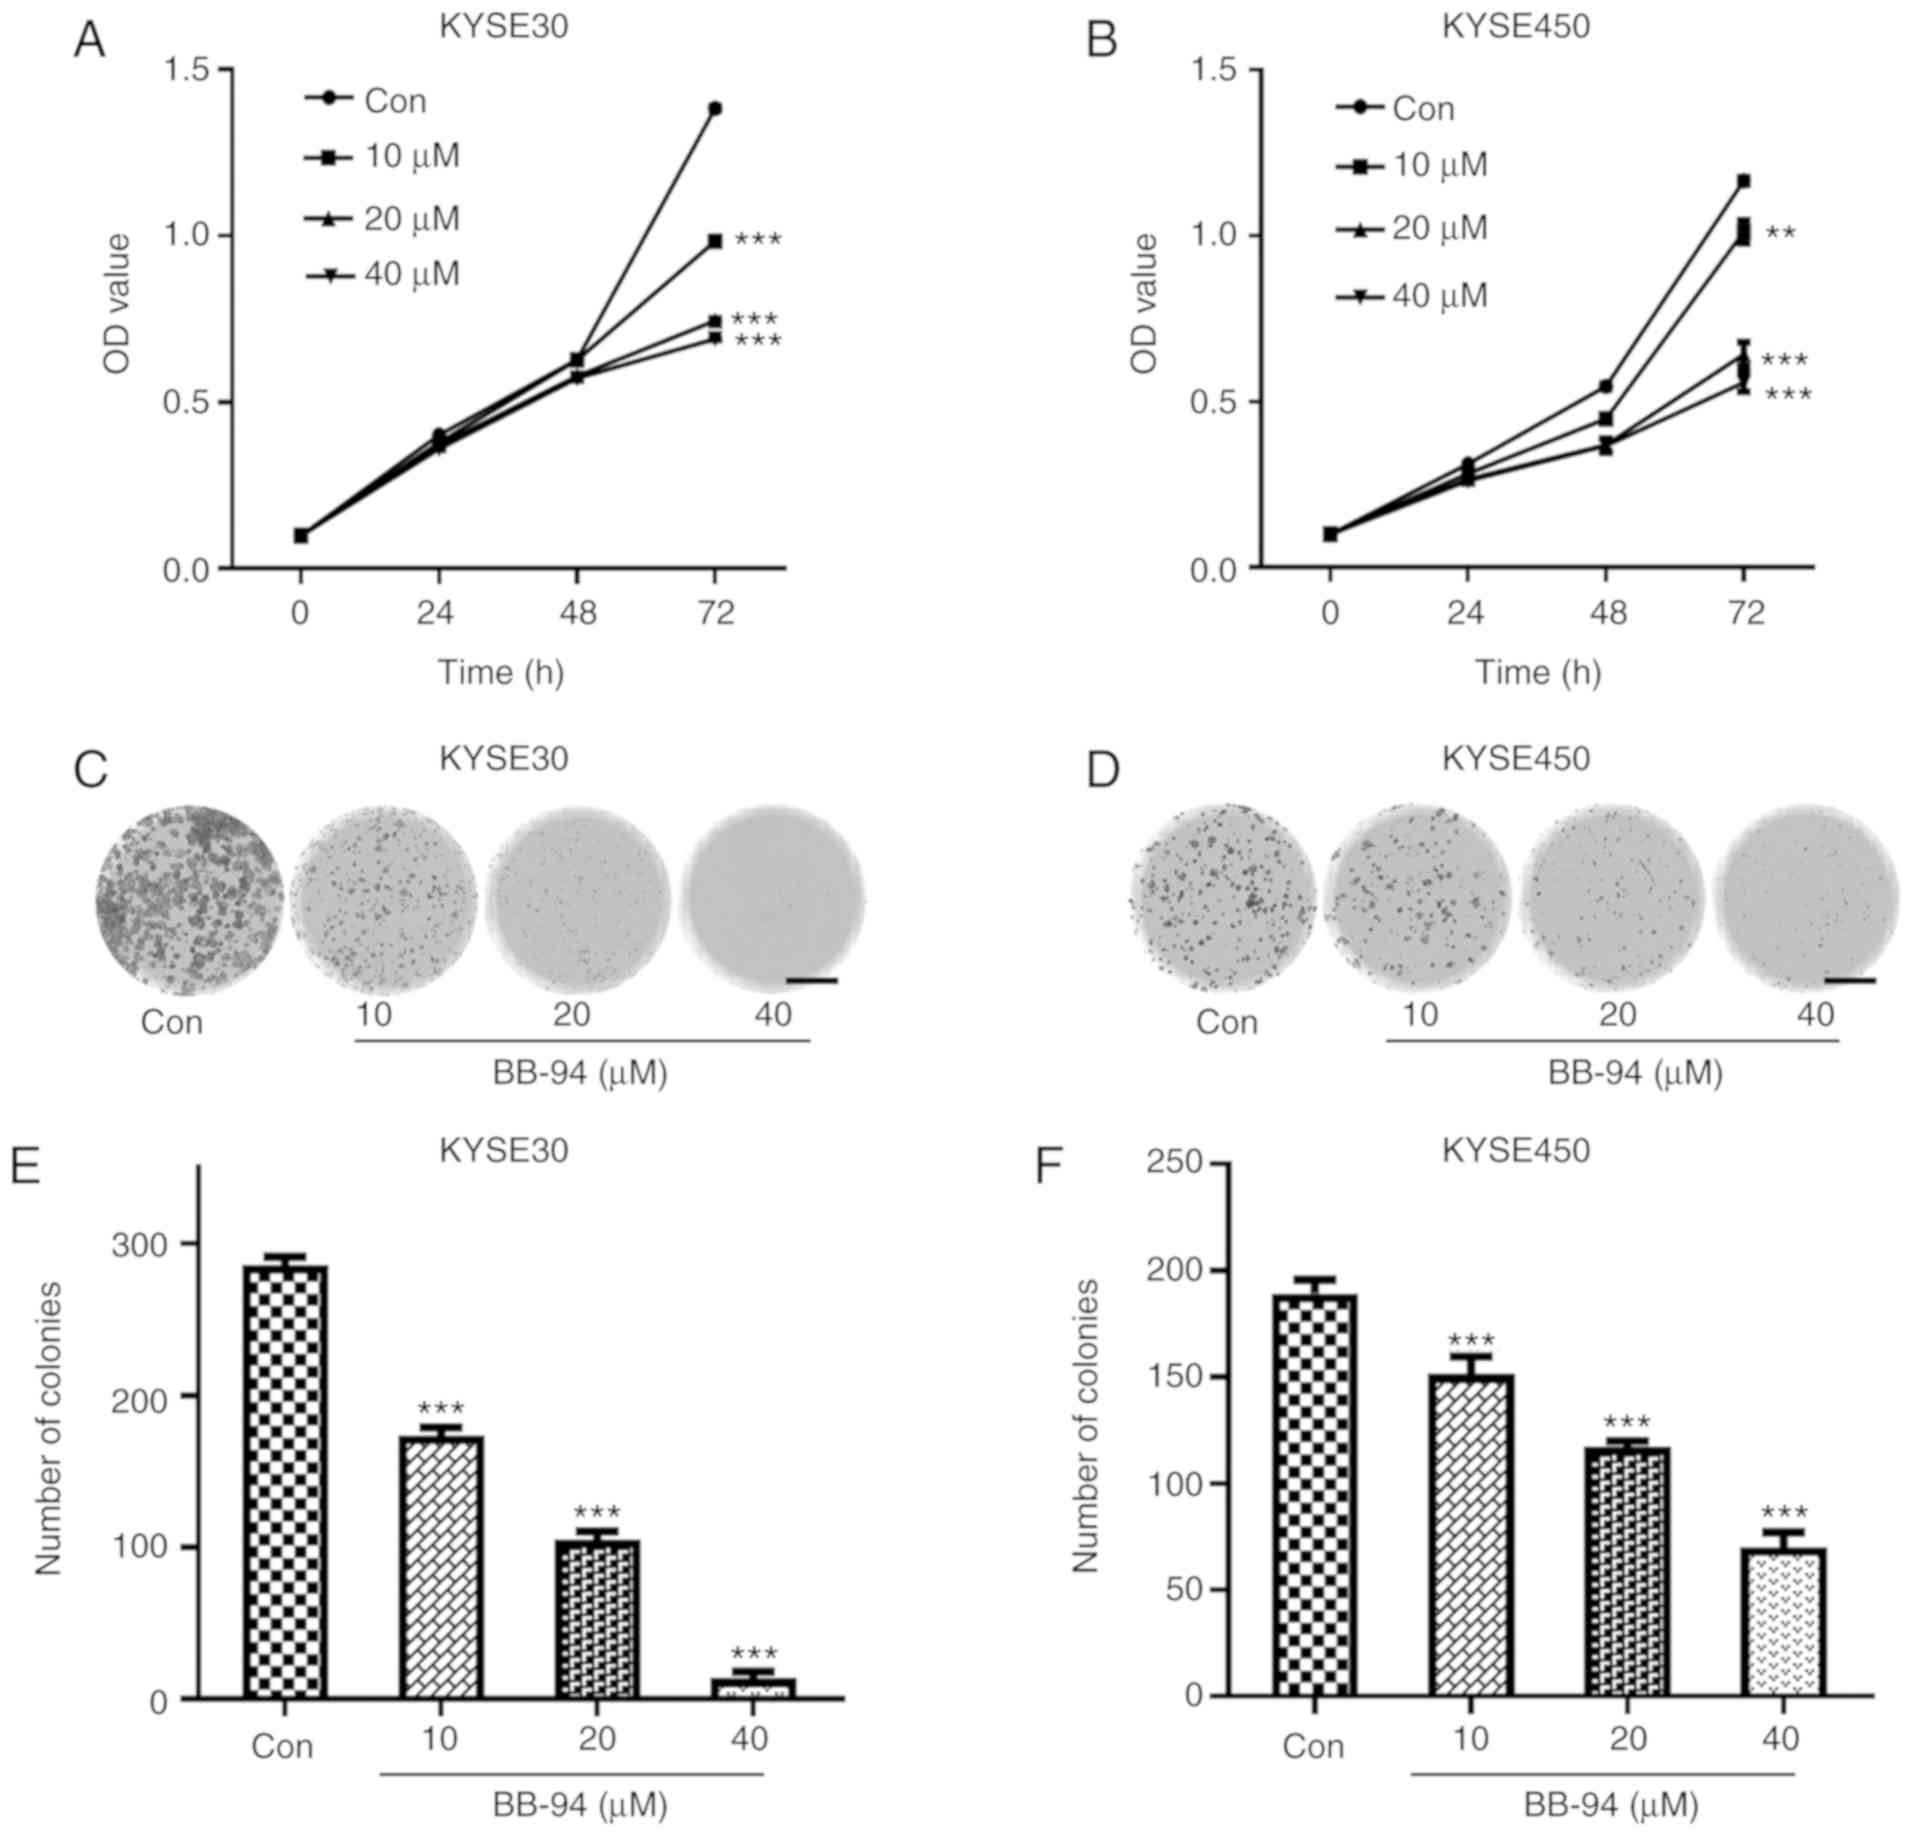
Effect of MMP inhibition on ESCC cell
growth
Based on the results of GSEA, the effect of
inhibition of MMPs using BB-94, a pan MMP inhibitor on ESCC cell
proliferation was assessed. BB-94 significantly reduced viability
of ESCC cells after 72 h. (P<0.05; Fig. 6A and B). Colony formation assays
also revealed that, compared with the control group, the number of
colonies formed in the BB-94-treated groups decreased significantly
(Fig. 6C-F). These results suggest
that MMP inhibition reduced growth of ESCC cells.
MMPs affect migration and expression
of EMT markers in ESCC cells
GSEA and gene co-expression analysis suggested that
there was a tight association between MMPs and cell migration.
Therefore, the effect of BB-94 on ESCC cell migration was examined.
Wound healing rate was used to evaluate the migration of ESCC cells
treated with different concentrations of BB-94. When compared with
the control group, the wound healing rates in BB-94 treated groups
were significantly reduced, both in KYSE30 and KYSE450 cell lines
(Fig. 7A-D). Furthermore,
inhibition of MMPs by BB-94 altered the protein expression levels
of several EMT markers in both KYSE30 and KYSE450 cells. E-Cadherin
expression was increased and expression of Vimentin, β-Catenin,
Snail and Slug were decreased (Fig. 7E
and F). Finally, the Pearson correlation coefficients between
MMPs selected in the prediction model and EMT markers were
calculated. Gene expression of MMP-9 and MMP-13 were positively
associated with Vimentin. In addition, MMP-1, −9 and −13 were
positively associated with SNAI1 expression (Fig. 7G). These results suggest that the
MMP family members are involved in the regulation of ESCC
migration.
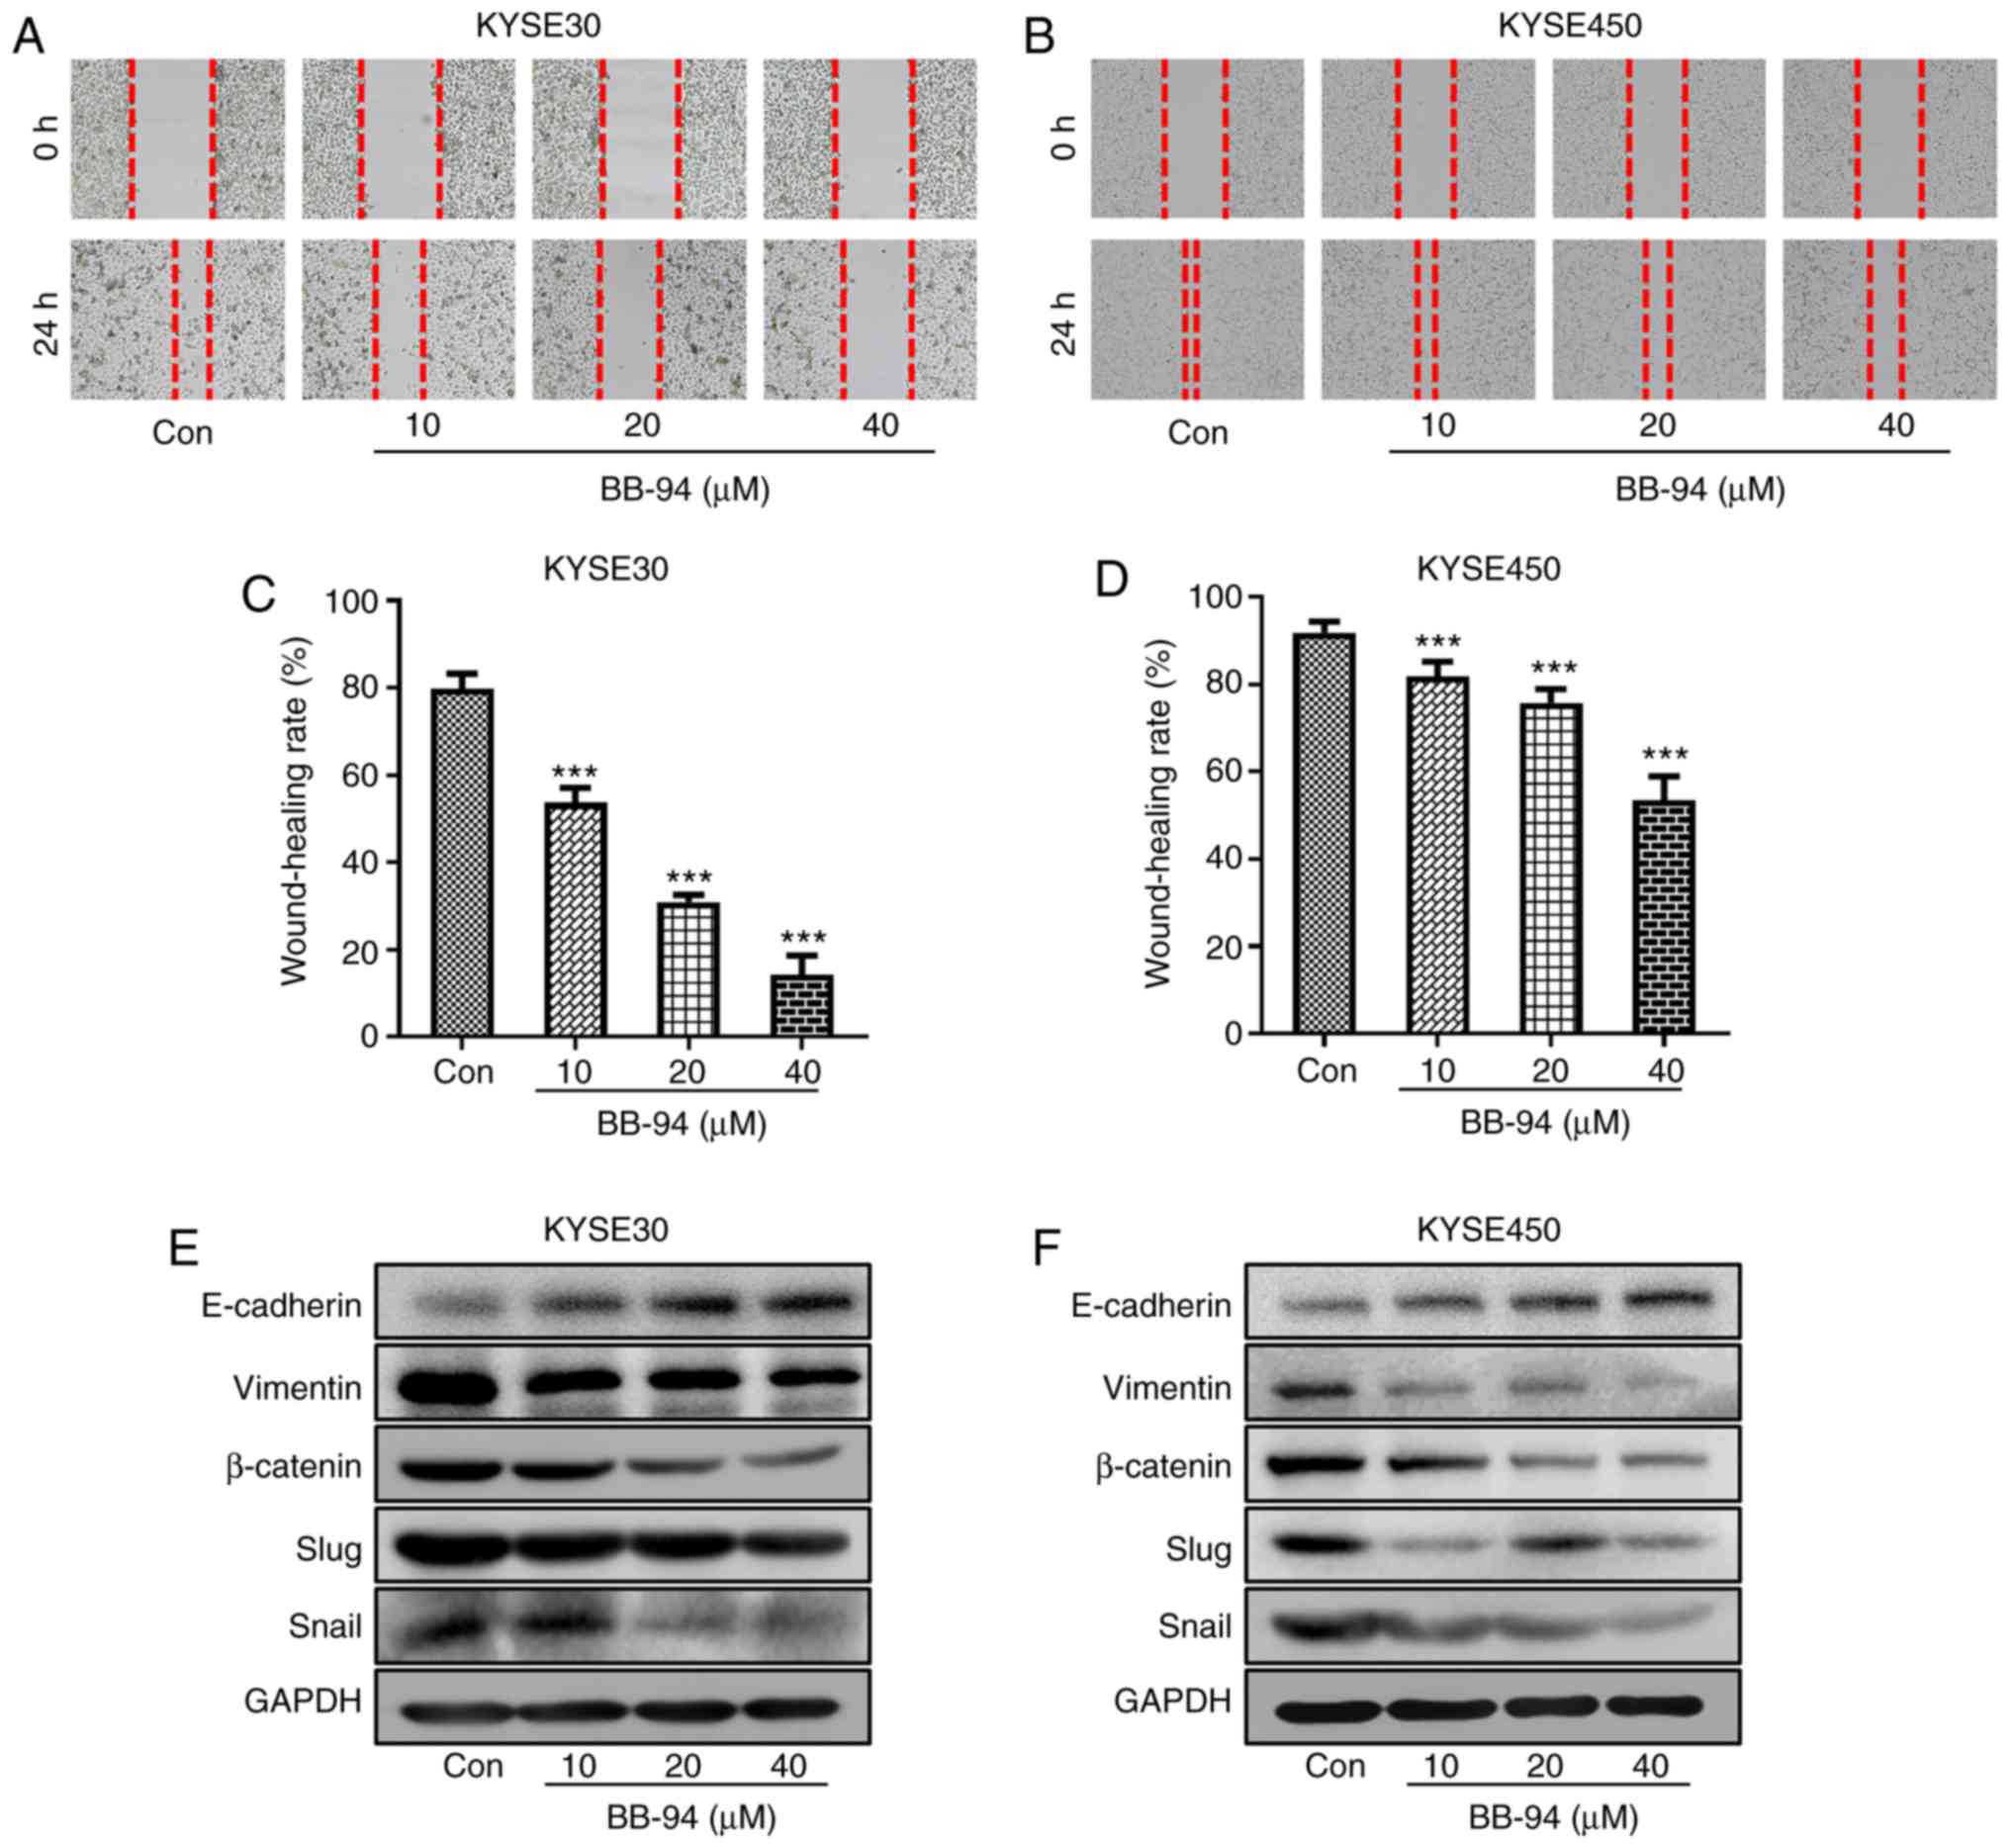 | Figure 7.ESCC cell migration and association
between expression of EMT markers and MMP expression.
Representative images of wound healing assays in (A) KYSE30 and (B)
KYSE450 cells treated with different concentrations of BB-94.
Quantitative analysis of wound healing in the (C) KYSE30 and (D)
KYSE450 cells. (E and F) Protein expression levels of the EMT
markers, E-Cadherin, Vimentin, β-Catenin, Snail and Slug were
detected by western blot. (G) Pearson correlation coefficient plots
between expression of MMPs and EMT markers based on the GSE53625
dataset. ***P<0.001 vs. Con. ESCC, esophageal squamous cell
carcinoma; EMT, epithelial-mesenchymal transition; MMP, matrix
metalloproteinase; Con, control; Cor, correlation coefficient; VIM,
vimentin. |
Discussion
Poor prognosis for ESCC patients is largely due to
delayed diagnosis. The 5-year survival rate for patients with ESCC
is relatively higher when the cancer is diagnosed at an earlier
stage (33), highlighting the
importance of novel biomarkers for early detection of ESCC. MMP
family members degrade ECM structural components, and this
underlies tumor progression (34).
Duffy et al (35)
demonstrated that MMP family members participate in tumor
initiation and progression of breast cancer. The MMP family has
been extensively studied in different types of cancer, highlighting
the importance of the involvement of MMPs in development and
progression of various types of cancer, but previous studies were
not systematic, instead focusing on one or a few MMPs (36,37).
Furthermore, the prognostic role of specific MMPs remains
controversial. For example, MMP-9, which is one of the best studied
MMPs, was identified as a significant prognostic factor in certain
studies (38,39), whereas in other studies no
significant effects were observed (40,41).
Unlike the previous studies that only focused on one or several MMP
proteins detected by immunohistochemistry or ELISA, in the present
study, the transcriptomics of all 23 MMPs were systematically
investigated, with a focus on the prognostic value of the
combination of MMPs in ESCC using bioinformatics analysis. The
results of the bioinformatics analysis were subsequently confirmed
in vitro.
Upregulated expression of MMP-1, −9, −13 has been
previously observed in ESCC tumor tissues compared with normal
tissues using immunohistochemistry (39). Han et al (13) also showed that MMP-12 expression was
also upregulated in ESCC tumor tissues. Consistent with these
studies, 8 MMPs, MMP-1, −3, −9, −10, −11, −12, −13 and −14) were
differentially expressed in 4 different datasets; all of which were
upregulated in tumor tissues and shown to be clinically significant
for potential use as diagnostic markers for ESCC. The majority of
previous studies reported to date suggest that increased gene
expression levels of certain MMPs are significantly associated with
a poor prognosis of ESCC (36,38).
The use of multivariate Cox regression analysis to construct a
prediction model incorporating several related genes provides a
more robust predictive effect than models based on a single gene
(42). In the present study, all
the MMP genes deemed to be dysregulated were used to establish a
survival prediction model. Using the GSE53625 dataset, after
screening using a stepwise multivariate Cox hazard regression
analysis, the best prognostic MMP signature was established. Of
note, none of the genes in this signature alone was considered a
significant prognostic factor (data not shown), but the combination
of these genes accurately predicted the prognosis of ESCC patients.
Compared with the survival prediction model based on the TNM stage
that is commonly used (31), the
model established in the present study predicted the survival rate
of patients with ESCC with improved accuracy, highlighting its
suitability for clinical use. The second model, comprised of
screened MMPs from TCGA, also showed an improved predictive ability
compared with the TNM stage model; the corresponding survival
curves showed a similar tendency, that is, the high-risk group had
a worse prognosis compared with low-risk group. Although the
GSE53625 dataset was a considerably larger dataset than TCGA (179
samples vs. 81), similar results were obtained from both datasets,
suggesting that the MMP-based prediction model was more powerful
for predicting survival. In addition, a nomogram was constructed
integrating both the MMP signature and TNM stage, and this
exhibited improved accuracy compared with the MMP signature-based
model and may thus be a more suitable tool for clinicians to
predict the prognosis of patients with ESCC. This type of
prediction model is in line with current trends toward personalized
medicine and being more commonly used in other research areas
(43,44). Therefore, the MMP-TNM nomogram may
be a vital tool for predicting survival of patients with ESCC.
Several signaling pathways associated with cancer
progression, such as EMT, Notch, TGF-β, mTOR and P53, are
associated with the expression of different members of the MMP
family of proteins. MMPs could stimulate processes associated with
EMT (45). For instance, the
expression of MMP-9 was associated with EMT genes in breast cancer
samples (46). Pang et al
(47) also showed that MMP-14
increases ESCC invasion and metastasis by reducing E-Cadherin
expression and subsequently inducing EMT. Overexpression of MMP-13
was observed in ESCC clinical tissues, and its upregulated
expression increased cancer cell aggressiveness (48). Knockdown of MMP-9 attenuated EMT
induced by TGF-β1, and inhibited invasiveness and migration in ESCC
(49). Notably, numerous studies
have demonstrated the association between MMPs and Notch signaling
in several types of cancer (50,51),
the latter of which serves an important role in development and
determination of cell fate (52).
For example, a previous study identified Notch1 as an MMP-14
substrate in melanoma (53).
Moreover, activation of the PI3K/PTEN/AKT/mTOR pathway upregulated
MMP-9 expression in hepatocellular carcinoma (54). On the contrary, P53, as a metastasis
suppressor, downregulated MMP-1 and MMP-9 expression (55).
Regarding co-expression, several MMP genes are
co-expressed with PDGFRB, CREB3L1, COL1A1 and other collagen
family members, such as COL12A1, COL5A2, COL6A1 and
COL6A3, suggesting that MMPs participate in
collagen-mediated metabolic processes in ESCC. MMP-13
expression is downregulated by CREB3L1, a metastasis suppressor
which regulates the expression of a number of genes involved in
angiogenesis (56). Co-expression
analysis showed that certain collagen family members, which are
involved in cell proliferation and migration, are co-expressed with
specific MMP genes (58). In
addition, co-expressed genes, including QKI, KDR, PDGFRB and
COL1A1, are associated with vasculature development
(GO:0001944). In a previous study, it was demonstrated that both
MMP-13 and PDGFRB were upregulated in papillary thyroid carcinoma
(59). It is widely known that MMPs
are associated with EMT, in the gene co-expression network
analysis, it was shown that MMPs were correlated with EMT markers
such as VIM and SNAI1. In addition, MMP-13 was
associated with TGFB1, which is important for tumor
viability, migration and metastasis in multiple types of cancer
(60). Taken together, these
results highlight how MMP family members may influence the
progression of ESCC and may be used to identify novels targets for
the development of specific therapeutic strategies for ESCC
treatment.
Cell proliferation and migration ability assays were
performed to confirm the role of MMP family members in ESCC cell
proliferation and migration using a pan-MMP inhibitor. It has been
demonstrated that the pan-MMP inhibitor BB-94 inhibits growth and
metastasis of human colon tumors in a patient-like orthotopic model
in nude mice (61). However, to the
best of our knowledge, there are no studies assessing the effect of
BB-94 in ESCC. In the present study, the cytotoxic and phenotypic
changes observed following treatment with BB-94 were consistent
with previous studies (62,63). Inhibition of MMPs by BB-94
significantly reduced cell proliferation and suppressed EMT. Thus,
BB-94 may be a potential therapeutic agent for treatment of ESCC.
Further studies are required to determine the detailed mechanism
and in vivo anti-ESCC activity of BB-94.
The present study has several limitations. There
were 81 tumor samples, whereas only 11 normal samples in TCGA. In
TCGA, the number of normal samples is frequently lower than the
number of tumor samples in several types of cancer, such as bladder
urothelial carcinoma, breast invasive carcinoma and colon
adenocarcinoma (64). Thus, the GEO
database GSE53625 dataset (including 179 normal samples and 179
tumor samples) was used to reduce the potential bias introduced by
the large difference in the number of samples. The design of the
inhibition experiment was not completely consistent with our
prediction model. The optimal ESCC therapeutic regimen would
promote the activation of MMP-1 and MMP-25, and inhibit MMP-8, −9,
−13 and −28 concurrently. However, using a cocktail of agents able
to exert these effects is difficult. BB-94 is one of the most
widely used broad-spectrum inhibitors (63,65).
However, using BB-94 may have suppressed several other MMPs
upregulated in tumor tissues with different risk contributions.
Thus, future studies should focus on developing specific inhibitors
targeting certain MMPs with high risk scores. Another limitation
was that gene expression profiles were used and the results showed
that no single MMP had a significant predictive ability by itself,
but instead the combination of specific MMPs exhibited good
predictive ability. Thus, the expression of MMP protein expression
levels or activity were not measured. Further testing regarding MMP
protein expression or activity in ESCC cell lines treated with
BB-94 and relevant clinical specimen are required to confirm their
potential involvement.
In summary, members of the MMP family may be used as
diagnostic and prognostic markers for ESCC. The MMP signature model
was more accurate for predicting the survival of patients with ESCC
compared with the TNM stage-based model. When integrating the MMP
signature model and TNM stage to predict the survival rate,
accuracy was further improved, suggesting that MMPs have
considerable predictive value. Moreover, it was shown that MMP
family members may influence the prognosis of ESCC through
impacting signaling pathways involved in cancer, such as EMT,
TGF-β, Notch, mTOR and P53. Finally, wound healing migration assays
and western blotting showed that inhibition of MMPs using BB-94
reduced migration of ESCC cells by suppressing EMT. Thus, MMP
family members may constitute potential therapeutic targets for
prevention and treatment of ESCC.
Supplementary Material
Supporting Data
Acknowledgements
Not applicable.
Funding
This study was financially supported by the National
Natural Science Foundation of China (grant no. 81602625), the
Natural Science Foundation of Guangdong Province (grant no.
2018A030313122), the Science and Technology Planning Project of
Guangdong Province (grant no. 2017A010105013), the Pearl River
S&T Nova Program of Guangzhou (grant no. 201710010011), the
Cultivating Fund Project of Shenzhen People's Hospital (grant no.
SYKYPY201926), and the Shenzhen Science and Technology Project
(grant nos. JCYJ20170302145059926, JCYJ20180305163658916 and
JCYJ20180228175059744).
Availability of data and materials
The datasets used and/or analyzed during the present
study are available from the corresponding author on reasonable
request.
Authors' contributions
GX and SxW designed the study and performed the
bioinformatics analysis. KZ, LO, and YL performed the laboratory
experiments. XW was responsible for the statistical analysis. GX
wrote the manuscript. KZ and SxW revised the manuscript. JiL, KL,
JuL, DH and SqW assisted with the bioinformatics analysis. All
authors read and approved the final version of the manuscript.
Ethics approval and consent to
participate
Not applicable.
Patient consent for publication
Not applicable.
Competing interests
The authors declare that they have no competing
interests.
References
|
1
|
Bray F, Ferlay J, Soerjomataram I, Siegel
RL, Torre LA and Jemal A: Global cancer statistics 2018: GLOBOCAN
estimates of incidence and mortality worldwide for 36 cancers in
185 countries. CA Cancer J Clin. 68:394–424. 2018. View Article : Google Scholar : PubMed/NCBI
|
|
2
|
Pennathur A, Gibson MK, Jobe BA and
Luketich JD: Oesophageal carcinoma. Lancet. 381:400–412. 2013.
View Article : Google Scholar : PubMed/NCBI
|
|
3
|
Zeng H, Zheng R, Zhang S, Zuo T, Xia C,
Zou X and Chen W: Esophageal cancer statistics in China, 2011:
Estimates based on 177 cancer registries. Thoracic cancer.
7:232–237. 2016. View Article : Google Scholar : PubMed/NCBI
|
|
4
|
Rustgi A and El-Serag H: Esophageal
carcinoma. N Engl J Med. 372:1472–1473. 2015.PubMed/NCBI
|
|
5
|
Shimada H, Nabeya Y, Okazumi SI, Matsubara
H, Miyazawa Y, Shiratori T, Hayashi H, Gunji Y and Ochiai T:
Prognostic significance of CYFRA 21-1 in patients with esophageal
squamous cell carcinoma. J Am Coll Surg. 196:573–578. 2003.
View Article : Google Scholar : PubMed/NCBI
|
|
6
|
Shimada H, Nabeya Y, Okazumi SI, Matsubara
H, Shiratori T, Gunji Y, Kobayashi S, Hayashi H and Ochiai T:
Prediction of survival with squamous cell carcinoma antigen in
patients with resectable esophageal squamous cell carcinoma.
Surgery. 133:486–494. 2003. View Article : Google Scholar : PubMed/NCBI
|
|
7
|
Deryugina EI and Quigley JP: Matrix
metalloproteinases and tumor metastasis. Cancer Metastasis Rev.
25:9–34. 2006. View Article : Google Scholar : PubMed/NCBI
|
|
8
|
Park HI, Ni J, Gerkema FE, Liu D,
Belozerov VE and Sang QX: Identification and characterization of
human endometase (matrix metalloproteinase-26) from endometrial
tumor. J Biol Chem. 275:20540–20544. 2000. View Article : Google Scholar : PubMed/NCBI
|
|
9
|
Page-McCaw A, Ewald AJ and Werb Z: Matrix
metalloproteinases and the regulation of tissue remodelling. Nat
Rev Mol Cell Biol. 8:221–233. 2007. View
Article : Google Scholar : PubMed/NCBI
|
|
10
|
Wang S, Jia J, Liu D, Wang M, Wang Z, Li
X, Wang H, Rui Y, Liu Z, Guo W, et al: Matrix Metalloproteinase
expressions play important role in prediction of ovarian cancer
outcome. Sci Rep. 9:116772019. View Article : Google Scholar : PubMed/NCBI
|
|
11
|
Gobin E, Bagwell K, Wagner J, Mysona D,
Sandirasegarane S, Smith N, Bai S, Sharma A, Schleifer R and She
JX: A pan-cancer perspective of matrix metalloproteases (MMP) gene
expression profile and their diagnostic/prognostic potential. BMC
cancer. 19:5812019. View Article : Google Scholar : PubMed/NCBI
|
|
12
|
Peng HH, Zhang X and Cao PG: MMP-1/PAR-1
signal transduction axis and its prognostic impact in esophageal
squamous cell carcinoma. Braz J Med Biol Res. 45:86–92. 2012.
View Article : Google Scholar : PubMed/NCBI
|
|
13
|
Han F, Zhang S, Zhang L and Hao Q: The
overexpression and predictive significance of MMP-12 in esophageal
squamous cell carcinoma. Pathol Res Pract. 213:1519–1522. 2017.
View Article : Google Scholar : PubMed/NCBI
|
|
14
|
Yang X, Zhu S, Li L, Zhang L, Xian S, Wang
Y and Cheng Y: Identification of differentially expressed genes and
signaling pathways in ovarian cancer by integrated bioinformatics
analysis. Onco Targets Ther. 11:1457–1474. 2018. View Article : Google Scholar : PubMed/NCBI
|
|
15
|
Zheng MJ, Li X, Hu YX, Dong H, Gou R, Nie
X, Liu Q, Ying-Ying H, Liu JJ and Lin B: Identification of
molecular marker associated with ovarian cancer prognosis using
bioinformatics analysis and experiments. J Cell Physiol.
234:11023–11036. 2019. View Article : Google Scholar : PubMed/NCBI
|
|
16
|
Li J, Chen Z, Tian L, Zhou C, He MY, Gao
Y, Wang S, Zhou F, Shi S, Feng X, et al: LncRNA profile study
reveals a three-lncRNA signature associated with the survival of
patients with oesophageal squamous cell carcinoma. Gut.
63:1700–1710. 2014. View Article : Google Scholar : PubMed/NCBI
|
|
17
|
Su H, Hu N, Yang HH, Wang C, Takikita M,
Wang QH, Giffen C, Clifford R, Hewitt SM, Shou JZ, et al: Global
gene expression profiling and validation in esophageal squamous
cell carcinoma and its association with clinical phenotypes. Clin
Cancer Res. 17:2955–2966. 2011. View Article : Google Scholar : PubMed/NCBI
|
|
18
|
Hu N, Wang C, Clifford RJ, Yang HH, Su H,
Wang L, Wang Y, Xu Y, Tang ZZ, Ding T, et al: Integrative genomics
analysis of genes with biallelic loss and its relation to the
expression of mRNA and micro-RNA in esophageal squamous cell
carcinoma. BMC Genomics. 16:7322015. View Article : Google Scholar : PubMed/NCBI
|
|
19
|
Brierley JD, Gospodarowicz MK and
Wittekind C: TNM classification of malignant tumours, 8th edition.
John Wiley & Sons; 2017
|
|
20
|
Team RC: A language and environment for
statistical computing. R Foundation for Statistical Computing.
(Vienna, Austria). ISBN 3-900051-07-0. Journal 2012, .
|
|
21
|
Ritchie ME, Phipson B, Wu D, Hu Y, Law CW,
Shi W and Smyth G: Limma powers differential expression analyses
for RNA-sequencing and microarray studies. Nucleic Acids Res.
43:e472015. View Article : Google Scholar : PubMed/NCBI
|
|
22
|
Robinson MD, McCarthy DJ and Smyth GK:
edgeR: A Bioconductor package for differential expression analysis
of digital gene expression data. Bioinformatics. 26:139–140. 2010.
View Article : Google Scholar : PubMed/NCBI
|
|
23
|
Cox DR: Regression models and life-tables.
J Royal Stat Soc Series B (Methodological). 34:187–202. 1972.
View Article : Google Scholar
|
|
24
|
Iasonos A, Schrag D, Raj GV and Panageas
KS: How to build and interpret a nomogram for cancer prognosis. J
Clin Oncol. 26:1364–1370. 2008. View Article : Google Scholar : PubMed/NCBI
|
|
25
|
Lüdemann L, Grieger W, Wurm R, Wust P and
Zimmer C: Glioma assessment using quantitative blood volume maps
generated by T1-weighted dynamic contrast-enhanced magnetic
resonance imaging: A receiver operating characteristic study. Acta
Radiol. 47:303–310. 2006. View Article : Google Scholar : PubMed/NCBI
|
|
26
|
Harrell FE Jr: rms: Regression modeling
strategies. R package version 5.1-2. http://cran.nexr.com/web/packages/rms/rms.pdfJanuary
7–2018
|
|
27
|
Subramanian A, Tamayo P, Mootha VK,
Mukherjee S, Ebert BL, Gillette MA, Paulovich A, Pomeroy SL, Golub
TR, Lander ES and Mesirov JP: Gene set enrichment analysis: A
knowledge-based approach for interpreting genome-wide expression
profiles. Proc Natl Acad Sci USA. 102:15545–15550. 2005. View Article : Google Scholar : PubMed/NCBI
|
|
28
|
Liberzon A: A description of the molecular
signatures database (MSigDB) web site. Stem Cell Transcriptional
Networks. Springer. 153–160. 2014. View Article : Google Scholar
|
|
29
|
Langfelder P and Horvath S: WGCNA: An R
package for weighted correlation network analysis. BMC
Bioinformatics. 9:5592008. View Article : Google Scholar : PubMed/NCBI
|
|
30
|
Shannon P, Markiel A, Ozier O, Baliga NS,
Wang JT, Ramage D, Amin N, Schwikowski B and Ideker T: Cytoscape: A
software environment for integrated models of biomolecular
interaction networks. Genome Res. 13:2498–2504. 2003. View Article : Google Scholar : PubMed/NCBI
|
|
31
|
D'Journo XB: Clinical implication of the
innovations of the 8th edition of the TNM classification for
esophageal and esophago-gastric cancer. J Thorac Dis. 10 (Suppl
22):S2671–S2681. 2018. View Article : Google Scholar : PubMed/NCBI
|
|
32
|
Wang Q, Wang F, Lv J, Xin J, Xie L, Zhu W,
Tang Y, Li Y, Zhao X, Wang Y, et al: Interactive online consensus
survival tool for esophageal squamous cell carcinoma prognosis
analysis. Oncol Lett. 18:1199–1206. 2019.PubMed/NCBI
|
|
33
|
Lambert R and Hainaut P: Epidemiology of
oesophagogastric cancer. Best Pract Res Clin Gastroenterol.
21:921–945. 2007. View Article : Google Scholar : PubMed/NCBI
|
|
34
|
Coussens LM, Fingleton B and Matrisian LM:
Matrix metalloproteinase inhibitors and cancer-trials and
tribulations. Science. 295:2387–2392. 2002. View Article : Google Scholar : PubMed/NCBI
|
|
35
|
Duffy MJ, Maguire TM, Hill A, McDermott E
and O'Higgins N: Metalloproteinases: Role in breast carcinogenesis,
invasion and metastasis. Breast Cancer Res. 2:252–257. 2000.
View Article : Google Scholar : PubMed/NCBI
|
|
36
|
Liu M, Hu Y, Zhang MF, Luo KJ, Xie XY, Wen
J, Fu JH and Yang H: MMP1 promotes tumor growth and metastasis in
esophageal squamous cell carcinoma. Cancer Lett. 377:97–104. 2016.
View Article : Google Scholar : PubMed/NCBI
|
|
37
|
Li H, Qiu Z, Li F and Wang C: The
relationship between MMP-2 and MMP-9 expression levels with breast
cancer incidence and prognosis. Oncol Lett. 14:5865–5870.
2017.PubMed/NCBI
|
|
38
|
Zeng R, Duan L, Kong Y, Liang Y, Wu X, Wei
X and Yang K: Clinicopathological and prognostic role of MMP-9 in
esophageal squamous cell carcinoma: A meta-analysis. Chin J Cancer
Res. 25:6372013.PubMed/NCBI
|
|
39
|
Gu ZD, Li JY, Li M, Gu J, Shi XT, Ke Y and
Chen KN: Matrix metalloproteinases expression correlates with
survival in patients with esophageal squamous cell carcinoma. Am J
Gastroenterol. 100:1835–1843. 2005. View Article : Google Scholar : PubMed/NCBI
|
|
40
|
Mroczko B, Kozłowski M, Groblewska M,
Łukaszewicz M, Nikliński J, Jelski W, Laudański J, Chyczewski L and
Szmitkowski M: The diagnostic value of the measurement of matrix
metalloproteinase 9 (MMP-9), squamous cell cancer antigen (SCC) and
carcinoembryonic antigen (CEA) in the sera of esophageal cancer
patients. Clin Chim Acta. 389:61–66. 2008. View Article : Google Scholar : PubMed/NCBI
|
|
41
|
Li Y, Ma J, Guo Q, Duan F, Tang F, Zheng
P, Zhao Z and Lu G: Overexpression of MMP-2 and MMP-9 in esophageal
squamous cell carcinoma. Dis Esophagus. 22:664–667. 2009.
View Article : Google Scholar : PubMed/NCBI
|
|
42
|
Chai R, Zhang K, Wang K, Li G, Huang R,
Zhao Z, Liu Y and Chen J: A novel gene signature based on five
glioblastoma stem-like cell relevant genes predicts the survival of
primary glioblastoma. J Cancer Res Clin Oncol. 144:439–447. 2018.
View Article : Google Scholar : PubMed/NCBI
|
|
43
|
Liu GM, Xie WX, Zhang CY and Xu JW:
Identification of a four-gene metabolic signature predicting
overall survival for hepatocellular carcinoma. J Cell Physiol.
235:1624–1636. 2020. View Article : Google Scholar : PubMed/NCBI
|
|
44
|
Mariani P, Dureau S, Savignoni A, Rouic
LL, Levy-Gabriel C, Piperno-Neumann S, Rodrigues MJ, Desjardins L,
Cassoux N and Servois V: Development of a prognostic nomogram for
liver metastasis of uveal melanoma patients selected by liver MRI.
Cancers (Basel). 11:E8632019. View Article : Google Scholar : PubMed/NCBI
|
|
45
|
Orlichenko LS and Radisky DC: Matrix
metalloproteinases stimulate epithelial-mesenchymal transition
during tumor development. Clin Exp Metastasis. 25:593–600. 2008.
View Article : Google Scholar : PubMed/NCBI
|
|
46
|
Moirangthem A, Bondhopadhyay B, Mukherjee
M, Bandyopadhyay A, Mukherjee N, Konar K, Bhattacharya S and Basu
A: Simultaneous knockdown of uPA and MMP9 can reduce breast cancer
progression by increasing cell-cell adhesion and modulating EMT
genes. Sci Rep. 6:219032016. View Article : Google Scholar : PubMed/NCBI
|
|
47
|
Pang L, Li Q, Li S, He J, Cao W, Lan J,
Sun B, Zou H, Wang C, Liu R, et al: Membrane type 1-matrix
metalloproteinase induces epithelial-to-mesenchymal transition in
esophageal squamous cell carcinoma: Observations from clinical and
in vitro analyses. Sci Rep. 6:221792016. View Article : Google Scholar : PubMed/NCBI
|
|
48
|
Osako Y, Seki N, Kita Y, Yonemori K,
Koshizuka K, Kurozumi A, Omoto I, Sasaki K, Uchikado Y, Kurahara H,
et al: Regulation of MMP13 by antitumor microRNA-375 markedly
inhibits cancer cell migration and invasion in esophageal squamous
cell carcinoma. Int J Oncol. 49:2255–2264. 2016. View Article : Google Scholar : PubMed/NCBI
|
|
49
|
Bai X, Li YY, Zhang HY, Wang F, He HL, Yao
JC, Liu L and Li SS: Role of matrix metalloproteinase-9 in
transforming growth factor-β1-induced epithelial-mesenchymal
transition in esophageal squamous cell carcinoma. Onco Targets
Ther. 10:2837–2847. 2017. View Article : Google Scholar : PubMed/NCBI
|
|
50
|
Rajasinghe LD, Pindiprolu RH and Gupta SV:
Delta-tocotrienol inhibits non-small-cell lung cancer cell invasion
via the inhibition of NF-κB, uPA activator, and MMP-9. Onco Targets
Ther. 11:4301–4314. 2018. View Article : Google Scholar : PubMed/NCBI
|
|
51
|
Ganguly SS, Hostetter G, Tang L, Frank SB,
Saboda K, Mehra R, Wang L, Li X, Keller ET and Miranti CK: Notch3
promotes prostate cancer-induced bone lesion development via MMP-3.
Oncogene. 39:204–218. 2020. View Article : Google Scholar : PubMed/NCBI
|
|
52
|
Takebe N, Nguyen D and Yang SX: Targeting
notch signaling pathway in cancer: Clinical development advances
and challenges. Pharmacol Ther. 141:140–149. 2014. View Article : Google Scholar : PubMed/NCBI
|
|
53
|
Ma J, Tang X, Wong P, Jacobs B, Borden EC
and Bedogni B: Noncanonical activation of Notch1 protein by
membrane type 1 matrix metalloproteinase (MT1-MMP) controls
melanoma cell proliferation. J Biol Chem. 289:8442–8449. 2014.
View Article : Google Scholar : PubMed/NCBI
|
|
54
|
Chen JS, Wang Q, Fu Xh, Huang XH, Chen XL,
Cao LQ, Chen LZ, Tan HX, Li W, Bi J and Zhang LJ: Involvement of
PI3K/PTEN/AKT/mTOR pathway in invasion and metastasis in
hepatocellular carcinoma: Association with MMP-9. Hepatol Res.
39:177–186. 2009. View Article : Google Scholar : PubMed/NCBI
|
|
55
|
Powell E, Piwnica-Worms D and
Piwnica-Worms H: Contribution of p53 to metastasis. Cancer Discov.
4:405–414. 2014. View Article : Google Scholar : PubMed/NCBI
|
|
56
|
Mellor P, Deibert L, Calvert B, Bonham K,
Carlsen SA and Anderson DH: CREB3L1 is a metastasis suppressor that
represses expression of genes regulating metastasis, invasion, and
angiogenesis. Mol Cell Biol. 33:4985–4995. 2013. View Article : Google Scholar : PubMed/NCBI
|
|
57
|
Jabłońska-Trypuć A, Matejczyk M and
Rosochacki S: Matrix metalloproteinases (MMPs), the main
extracellular matrix (ECM) enzymes in collagen degradation, as a
target for anticancer drugs. J Enzyme Inhib Med Chem. 31:177–183.
2016. View Article : Google Scholar : PubMed/NCBI
|
|
58
|
Ricard-Blum S: The collagen family. Cold
Spring Harb Perspect Biol. 3:a0049782011. View Article : Google Scholar : PubMed/NCBI
|
|
59
|
Zhang H, Teng X and Liu Z, Zhang L and Liu
Z: Gene expression profile analyze the molecular mechanism of CXCR7
regulating papillary thyroid carcinoma growth and metastasis. J Exp
Clin Cancer Res. 34:162015. View Article : Google Scholar : PubMed/NCBI
|
|
60
|
Kaminska B, Wesolowska A and Danilkiewicz
M: TGF beta signalling and its role in tumour pathogenesis. Acta
Biochim Pol. 52:329–337. 2005. View Article : Google Scholar : PubMed/NCBI
|
|
61
|
Wang X, Fu X, Brown P, Crimmin M and
Hoffman R: Matrix metalloproteinase inhibitor BB-94 (batimastat)
inhibits human colon tumor growth and spread in a patient-like
orthotopic model in nude mice. Cancer Res. 54:4726–4728.
1994.PubMed/NCBI
|
|
62
|
Erba E, Ronzoni S, Bassano L, Giavazzi R
and D'lncalci M: The metalloproteinase inhibitor batimastat (BB-94)
causes cell cycle phase perturbations in ovarian cancer cells. Ann
Oncol. 10:589–591. 1999. View Article : Google Scholar : PubMed/NCBI
|
|
63
|
Kirkegaard T, Yde CW, Kveiborg M and
Lykkesfeldt AE: The broad-spectrum metalloproteinase inhibitor
BB-94 inhibits growth, HER3 and Erk activation in
fulvestrant-resistant breast cancer cell lines. Int J Oncol.
45:393–400. 2014. View Article : Google Scholar : PubMed/NCBI
|
|
64
|
Peng L, Bian XW, Xu C, Wang GM, Xia QY and
Xiong Q: Large-scale RNA-Seq transcriptome analysis of 4043 cancers
and 548 normal tissue controls across 12 TCGA cancer types. Sci
Rep. 5:134132015. View Article : Google Scholar : PubMed/NCBI
|
|
65
|
Ricci S, Grandgirard D, Wenzel M, Braccini
T, Salvatore P, Oggioni MR, Leib SL and Koedel U: Inhibition of
matrix metalloproteinases attenuates brain damage in experimental
meningococcal meningitis. BMC Infect Dis. 14:7262014. View Article : Google Scholar : PubMed/NCBI
|