Introduction
Renal cancer, the seventh most commonly encountered
cancer, is responsible for more than 140,000 deaths annually
worldwide (1). Approximately 20% of
patients with renal cell carcinoma (RCC) are diagnosed at advanced
stages (2). Localized RCC can be
treated by surgical resection; however, metastatic RCC (mRCC)
results in poor prognosis. Over the past decade, progress has been
made in the treatment of advanced-stage RCC using molecular
targeted therapy. Sunitinib malate, a tyrosine kinase inhibitor
with antitumor and antiangiogenic activities, is a widely
recognized (according to the 2018 National Comprehensive Cancer
Network guidelines for kidney cancer management) first-line
treatment option for patients with advanced-stage mRCC and
unresectable RCC (3). The efficacy
and safety of sunitinib have been evaluated in numerous clinical
trials (4–6). Moreover, in the first-line setting,
the efficacy of sunitinib was confirmed by clinical trials
(4,7–11).
However, most patients eventually develop resistance to sunitinib
therapy, and the median progression-free survival (PFS) of patients
following first-line treatment with sunitinib ranges between 9 and
11 months (4,7,9–11).
Approximately 70% of patients initially respond to therapy, while
the remaining 30% exhibit primary resistance to sunitinib. Among
patients who respond to initial therapy, durable responses are
rare, and most cases acquire sunitinib resistance within 6–15
months (12). The precise
biological mechanism underlying sunitinib resistance remains
unclear.
We have previously used ACHN cells, a human RCC cell
line, to establish a sunitinib-resistant model (SR-ACHN) for
examining the mechanism underlying sunitinib resistance (13,14).
In SR-ACHN cells, the expression level of microRNA (miR)-194-5p was
lower than that in ACHN cells, whereas the expression level of
lysosome-associated membrane protein 2 (LAMP-2), one of the
miR-194-5p target genes, was increased, suggesting that LAMP-2
plays a role in the acquisition of sunitinib resistance in RCC
cells. LAMP-2, a major lysosomal membrane protein with a single
transmembrane region, contributes to lysosomal function (15). There are three splice variants of
LAMP-2, namely, LAMP-2A, LAMP-2B, and LAMP-2C, which have different
physiological functions. However, the variant primarily responsible
for sunitinib resistance in human RCC cells remains to be
identified.
The present study aimed to identify which LAMP-2
splice variants were involved in sunitinib resistance of RCC cells
and potential biomarkers of sunitinib resistance in patients with
mRCC.
Materials and methods
RCC cell lines
ACHN, a parental human RCC cell line, was purchased
from the American Type Culture Collection and cultured in the
Roswell Park Memorial Institute (RPMI)-1640 (Thermo Fisher
Scientific, Inc.) with 10% fetal bovine serum (Sigma-Aldrich; Merck
KGaA) and 1% penicillin-streptomycin (Thermo Fisher Scientific,
Inc.). Sunitinib-resistant ACHN (SR-ACHN) cells were established
based on previously described methods (13). SR-ACHN cells were maintained in the
same medium containing 10 µM sunitinib (Tocris Bioscience).
Plasmid vectors and establishment of
LAMP-2-overexpressing ACHN cells
The following LAMP-2 expression vectors were used:
LAMP-2A (cat. no. RC221216; OriGeneTechnologies, Inc.), LAMP-2B
(cat. no. 86029) and LAMP-2C (cat. no. 89342; both from Addgene,
Inc.). Plasmids with deletions of each LAMP-2 cDNA, pCMV-Entry,
pCDNAHygro(+), and pCDNAZeo(−), were used as control vectors. For
transfection, ACHN cells were seeded into 6-cm dishes at a density
of 4×10⁵ cells per dish in a total volume of 3 ml. After
the cells were cultured overnight, they were transfected with each
plasmid vector using Lipofectamine 2000 (Thermo Fisher Scientific,
Inc.) according to the manufacturer's instructions.
The LAMP-2A expression plasmid or its control
plasmid-transfected ACHN was selected using 300 µg/ml G418 (Nacalai
Tesque, Inc.). LAMP-2B expression plasmid- or its control
plasmid-transfected ACHN was selected using 200 µg/ml hygromycin
(Nacalai Tesque, Inc.), and the LAMP-2C expression plasmid or its
control plasmid-transfected ACHN was selected using 80 µg/ml zeocin
(Thermo Fisher Scientific, Inc.).
RNA extraction and reverse
transcription-quantitative polymerase chain reaction (RT-qPCR)
Total RNA from the cell lines was extracted using
the TRIzol® Reagent (Thermo Fisher Scientific, Inc.)
according to the manufacturer's instructions. Next, 0.5 µg of RNA
was reverse-transcribed into complementary DNA using PrimeScript™
RT Master Mix (Perfect Real Time; Takara Bio, Inc.) in a 10-µl
reaction. The relative expression levels of LAMP-2A, LAMP-2B, and
LAMP-2C mRNA were measured by quantitative PCR using the TB
Green® Premix Ex Taq™ II (Tli RNaseH Plus) (Takara Bio,
Inc.) according to the manufacturer's instructions. Each 15-µl
reaction contained 7.5 µl of the TB Green® Premix, 15
pmol primers (Table I), and 3.5 µl
of the complementary DNA template, as well as a no-template
control. Amplification was performed in 40 cycles of denaturation
(95°C, 15 sec), annealing, and extension (60°C, 1 min). A
complementary DNA template-free control was included for each PCR
amplification. Gene expression was normalized to β-actin mRNA
levels, and relative gene expression was calculated using the
comparative quantification cycle (ΔΔCq) method (16).
 | Table I.Quantitative PCR primer
sequences. |
Table I.
Quantitative PCR primer
sequences.
| Target | Primer sequences
(5′-3′) |
|---|
| LAMP-2A | F:
GGGTTCAGCCTTTCAATGTG | R:
CAGCATGATGGTGCTTGAGA |
| LAMP-2B | F:
GGGTTCAGCCTTTCAATGTG | R:
CCTGAAAGACCAGCACCAAC |
| LAMP-2C | F:
GTATTCTACAGCTGAAGAATGTTCTG | R:
ACACCCACTGCAACAGGAAT |
| β-actin | F:
CGTGGGCCGCCCTAGGCACCA | R:
TTGGCTTAGGGTTCAGGGGGG |
Cell proliferation assay
Cells overexpressing LAMP-2A, LAMP-2B, and LAMP-2C
were harvested and seeded into a 96-well plate (5×10³
cells/well), and sunitinib was added at various concentrations
(2.5, 5.0, 10, 20, 40 and 80 µM). The plates were incubated for 72
h, and the cells were fixed with 5% glutaraldehyde for 30 min at
room temperature and then stained with 0.2% crystal violet with
CAPS buffer (Sigma-Aldrich; Merck KGaA) for 30 min at room
temperature. The crystal violet staining was dissolved with 10%
acetic acid and quantified using a microplate reader at 495 nm. The
results of the assay were the average value obtained from three
experiments.
Clinical samples
Ten samples from patients with RCC who underwent
nephrectomy between May 2010 and June 2017 and were treated with
sunitinib following surgery due to metastases were obtained from
the Tottori University Hospital. The median age of the 10 patients
was 62 years (age range, 26–77 years); six were male and four were
female (Table II). All materials
were obtained with written informed consent, and the procedures
were approved by the Ethics Committee of the Tottori University
(Tottori, Japan; approval no. 1558). Tissue samples were obtained
from tumor tissues of patients with RCC who underwent nephrectomy.
The sunitinib response was evaluated using the Response Evaluation
Criteria in Solid Tumors v1.1 (17). Most patients had received other
molecular target drugs or immune checkpoint inhibitors before or
after sunitinib treatment, but sunitinib was used as a single agent
only and not as a combination therapy. Therefore, overall survival
was not examined in the present study, but the effect of sunitinib
on PFS and tumor reduction was examined. It has been suggested that
immune checkpoint inhibitors may remain active even after
administration has been completed. However, the two patients
treated with nivolumab, an immune checkpoint inhibitor, both
received it after sunitinib treatment; hence, treatment with
nivolumab did not affect the efficacy of sunitinib.
| Table II.Patients and tumor characteristics as
well as responses to sunitinib treatment. |
Table II.
Patients and tumor characteristics as
well as responses to sunitinib treatment.
|
Characteristics | n |
|---|
| Age (years) |
|
|
Median | 62 |
|
Range | 26–77 |
| Sex |
|
|
Male | 6 |
|
Female | 4 |
| Histopathology |
|
| Clear
cell | 5 |
|
Papillary | 3 |
|
Chromophobe | 1 |
|
Spindle | 1 |
| Pathological
stage |
|
|
pT3 | 6 |
|
pT2 | 0 |
|
pT1 | 4 |
| Grade |
|
| G3 | 5 |
| G2 | 5 |
| G1 | 0 |
| Metastatic
sites |
|
|
Lung | 6 |
|
Pleura | 1 |
|
Liver | 3 |
|
Pancreas | 1 |
| Adrenal
gland | 1 |
|
Brain | 1 |
| Lymph
node | 3 |
|
Bone | 3 |
| Best overall
response |
|
| PR | 3 |
| SD | 6 |
| PD | 1 |
Statistical analysis
The unpaired Student's t-test was used to detect
significant changes in the expression levels of LAMP-2 splice
variants, IC50 for the cell proliferation assay, and
gene expression in clinical samples. The Bonferroni correction was
used to compare the IC50 in multiple cell lines and
relative expression levels of LAMP-2 splice variants. Pearson's
correlation coefficient was used to evaluate the correlation
between gene expression in clinical samples and their PFS or tumor
shrinkage rate. The treatment effect of sunitinib was categorized
into two groups based on the best overall response of each sample:
i) the partial response (PR) group (n=3) and ii) the stable disease
(SD) and progressive disease (PD) group (SD + PD; n=7).
Kaplan-Meier survival analysis was utilized to evaluate the
association of the expression levels of LAMP-2 splice variants with
PFS using the log-rank test. To examine the relationship between
survival curves and expression levels of LAMP-2 splice variants by
categorizing 10 samples into two groups based on their expression
levels, we defined the high expression group as samples with
expression levels above the upper quartile and the low expression
group as samples with expression levels below the upper quartile,
following a previous study (18).
All statistical analyses were performed with SPSS v23.0.0.0 (IBM
Corp.). P<0.05 was considered to indicate a statistically
significant difference.
Results
Establishment of ACHN cells
overexpressing LAMP-2A, LAMP-2B, and LAMP-2C
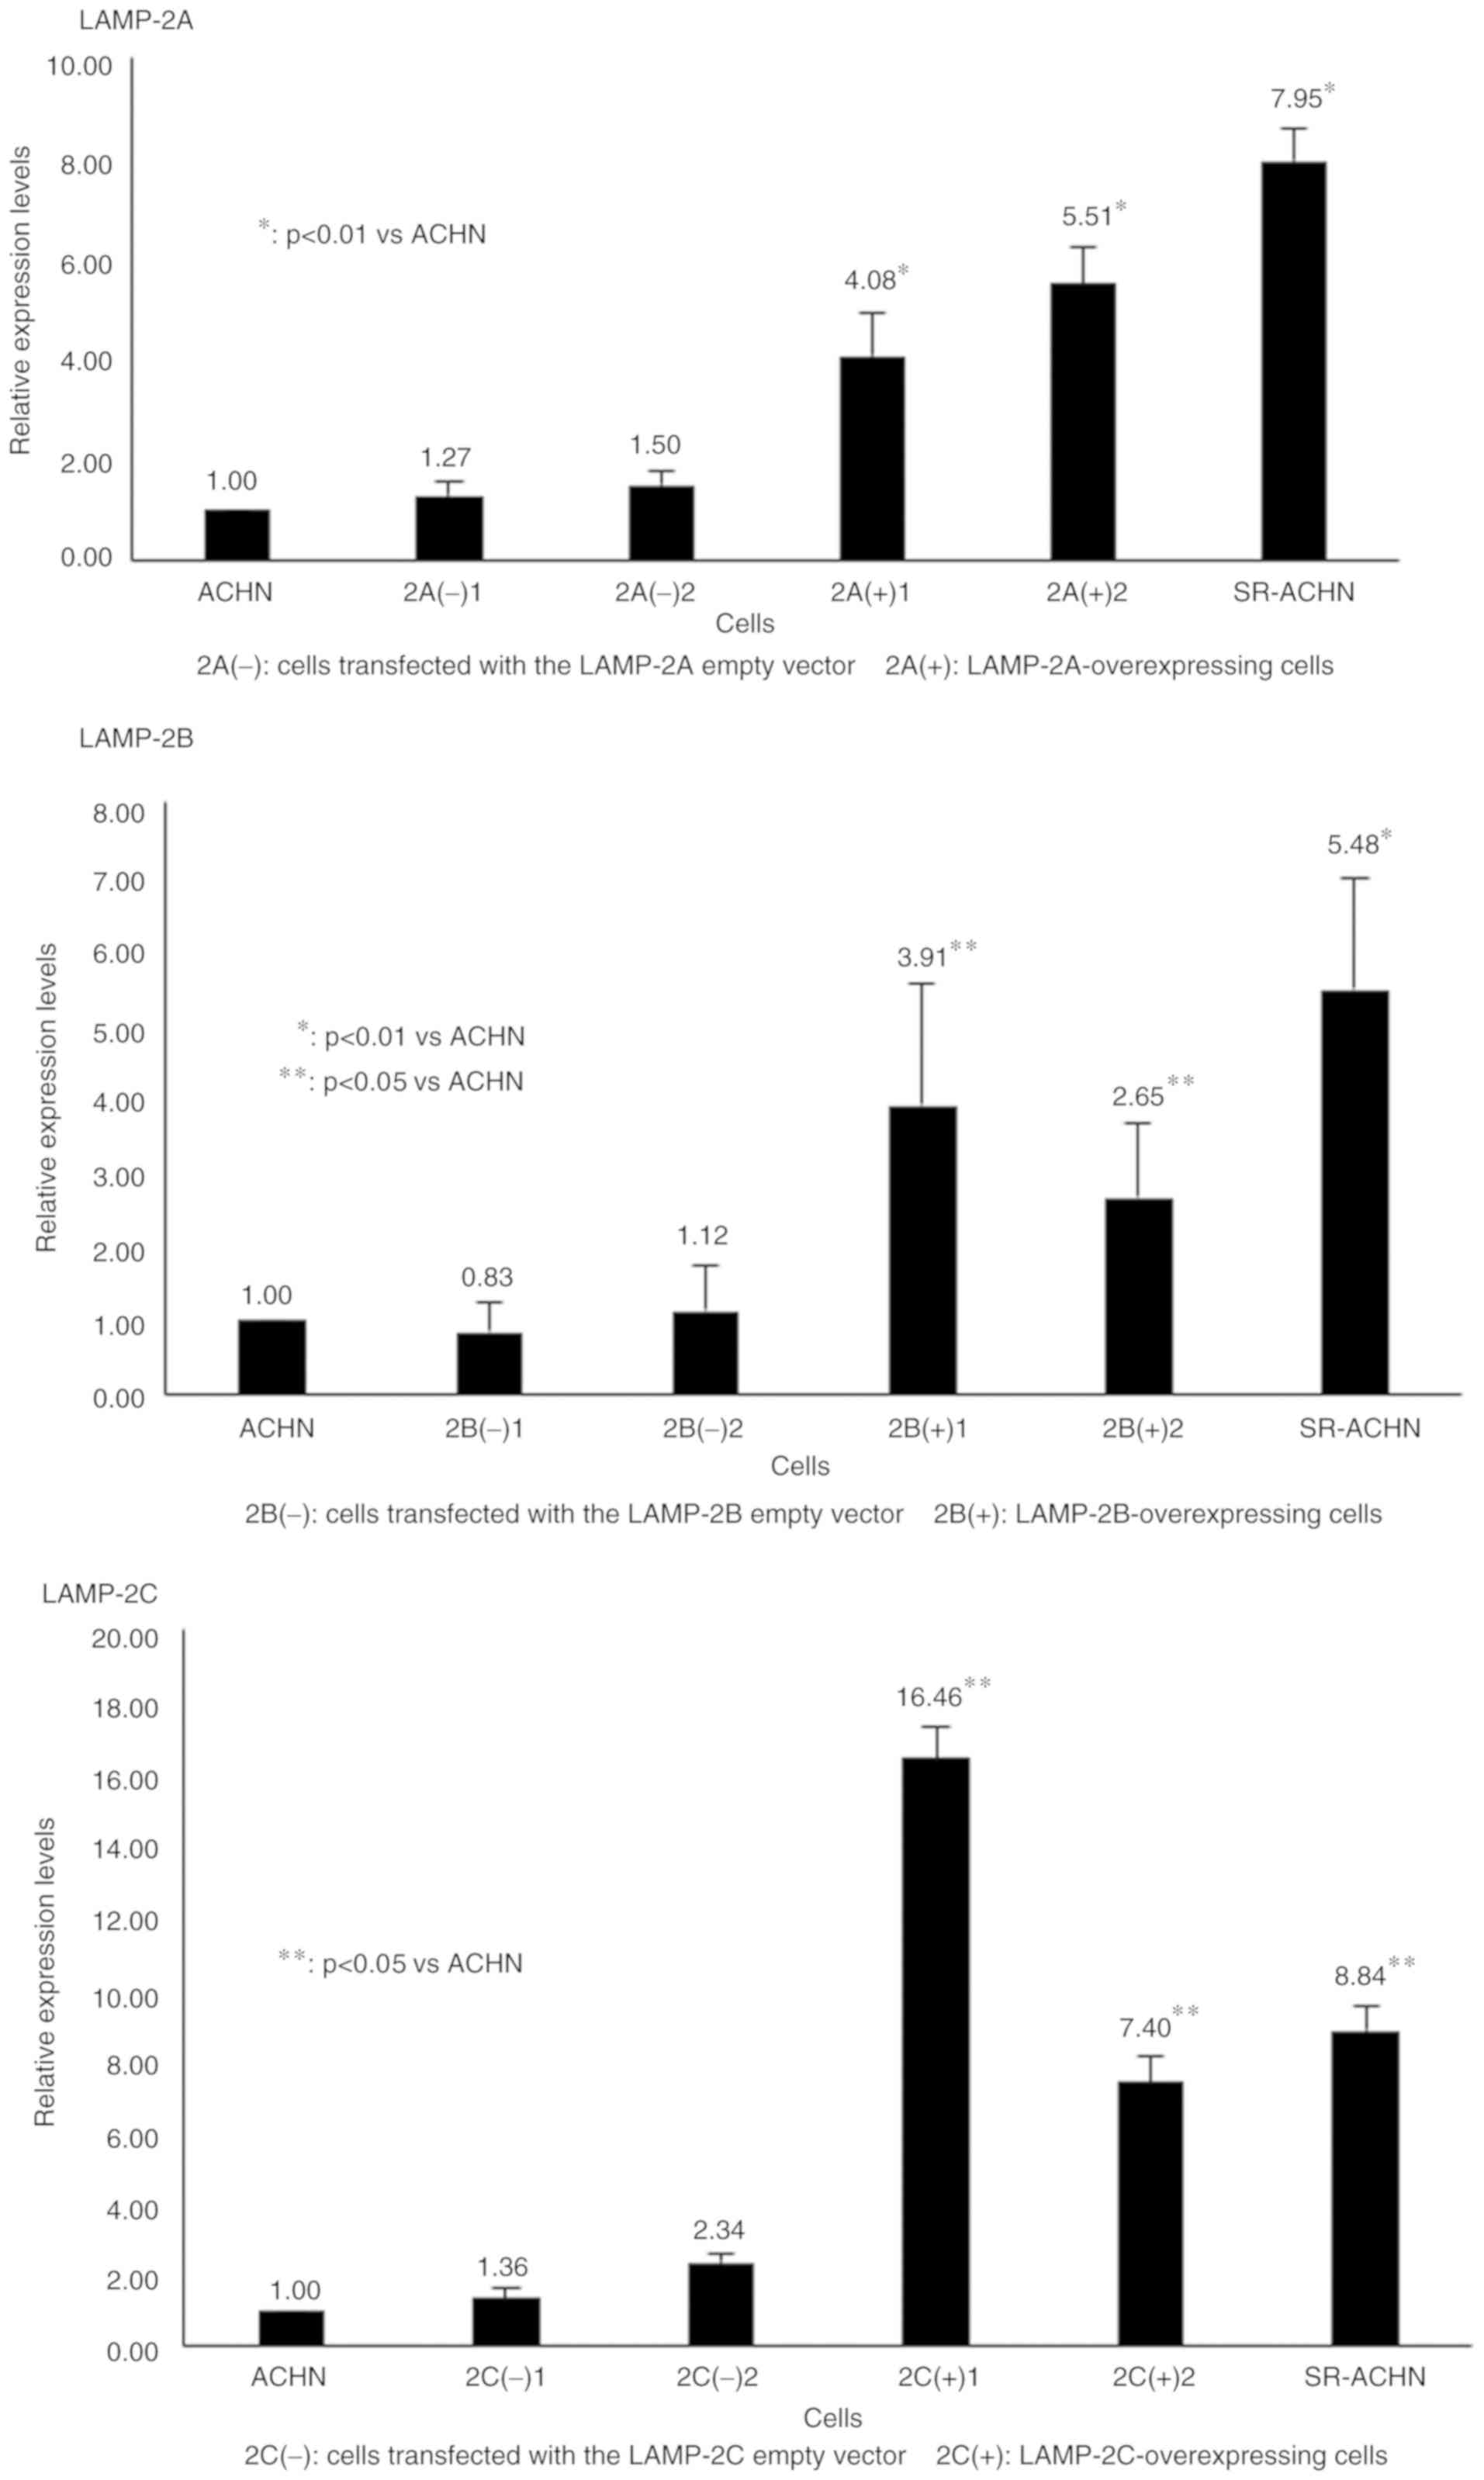
To investigate which LAMP-2 variants were required
for acquisition of the sunitinib-resistant phenotype in human RCC
cells, the LAMP-2A, LAMP-2B, or LAMP-2C expression vector or
corresponding control vector was transfected into ACHN cells, and
two representative clones were established in each transfection.
RT-qPCR revealed that the expression levels of LAMP-2A, LAMP-2B,
and LAMP-2C in the respective LAMP-overexpressing cells were higher
than those in ACHN cells and control vector-transfected ACHN cells
(Fig. 1). The LAMP-2 mRNA
expression level in the control vector-transfected cells was
similar to that in ACHN cells in each variant type.
LAMP-2A and LAMP-2B expression
contributes to sunitinib resistance in ACHN cells
Table III revealed
that the IC50 values of sunitinib for ACHN and SR-ACHN
cells were 2.58 and 6.62 µM, respectively, demonstrating that
SR-ACHN cells exhibited significantly higher resistance to
sunitinib treatment than did ACHN cells, as previously reported by
Yamaguchi et al (13) and
Yumioka et al (14). The
IC50 values in the two LAMP-2A-overexpressing ACHN
clones [2A(+)1 and 2A(+)2] were 3.52 and 3.66 µM, respectively,
significantly higher than those in ACHN cells (P<0.001).
Moreover, the IC50 values in the two
LAMP-2B-overexpressing ACHN clones [2B(+)1 and 2B(+)2] were 3.87
and 3.15 µM, respectively, also significantly higher than those in
ACHN cells (P<0.001). In contrast, the IC50 values in
the two LAMP-2C-overexpressing ACHN clones [2C(+)1 and 2C(+)2] were
similar to those in ACHN cells (2.63 and 2.68 µM, respectively).
The IC50 values in all control vector-transfected clones
were nearly equal to those in ACHN cells.
| Table III.Comparison of resistance to
sunitinib. |
Table III.
Comparison of resistance to
sunitinib.
| Groups | Average
IC50 ± SD | P-value |
|---|
| ACHN and
SR-ACHN |
|
|
|
ACHN | 2.58±0.17 | – |
|
SR-ACHN | 6.62±1.34 | <0.001 |
| LAMP-2A |
|
|
|
2A(−)1 | 2.50±0.08 | 0.422 |
|
2A(−)2 | 2.48±0.17 | 0.17 |
|
2A(+)1 | 3.52±0.17 | <0.001 |
|
2A(+)2 | 3.66±1.03 | 0.001 |
| LAMP-2B |
|
|
|
2B(−)1 | 2.91±0.86 | 0.172 |
|
2B(−)2 | 2.75±0.21 | 0.145 |
|
2B(+)1 | 3.87±0.05 | <0.001 |
|
2B(+)2 | 3.15±0.18 | <0.001 |
| LAMP-2C |
|
|
|
2C(−)1 | 2.63±0.19 | 0.618 |
|
2C(−)2 | 2.65±0.01 | 0.480 |
|
2C(+)1 | 2.63±0.19 | 0.643 |
|
2C(+)2 | 2.68±0.27 | 0.399 |
Expression of LAMP-2A and LAMP-2B in
clinical samples
To evaluate the correlation between the expression
levels of LAMP-2A, LAMP-2B, and LAMP-2C and susceptibility to
sunitinib in clinical samples, qPCR was performed using RNA derived
from 10 RCC clinical samples. The backgrounds, clinicopathological
features, characteristics of the metastatic sites, and therapeutic
effect of patients are presented in Table II.
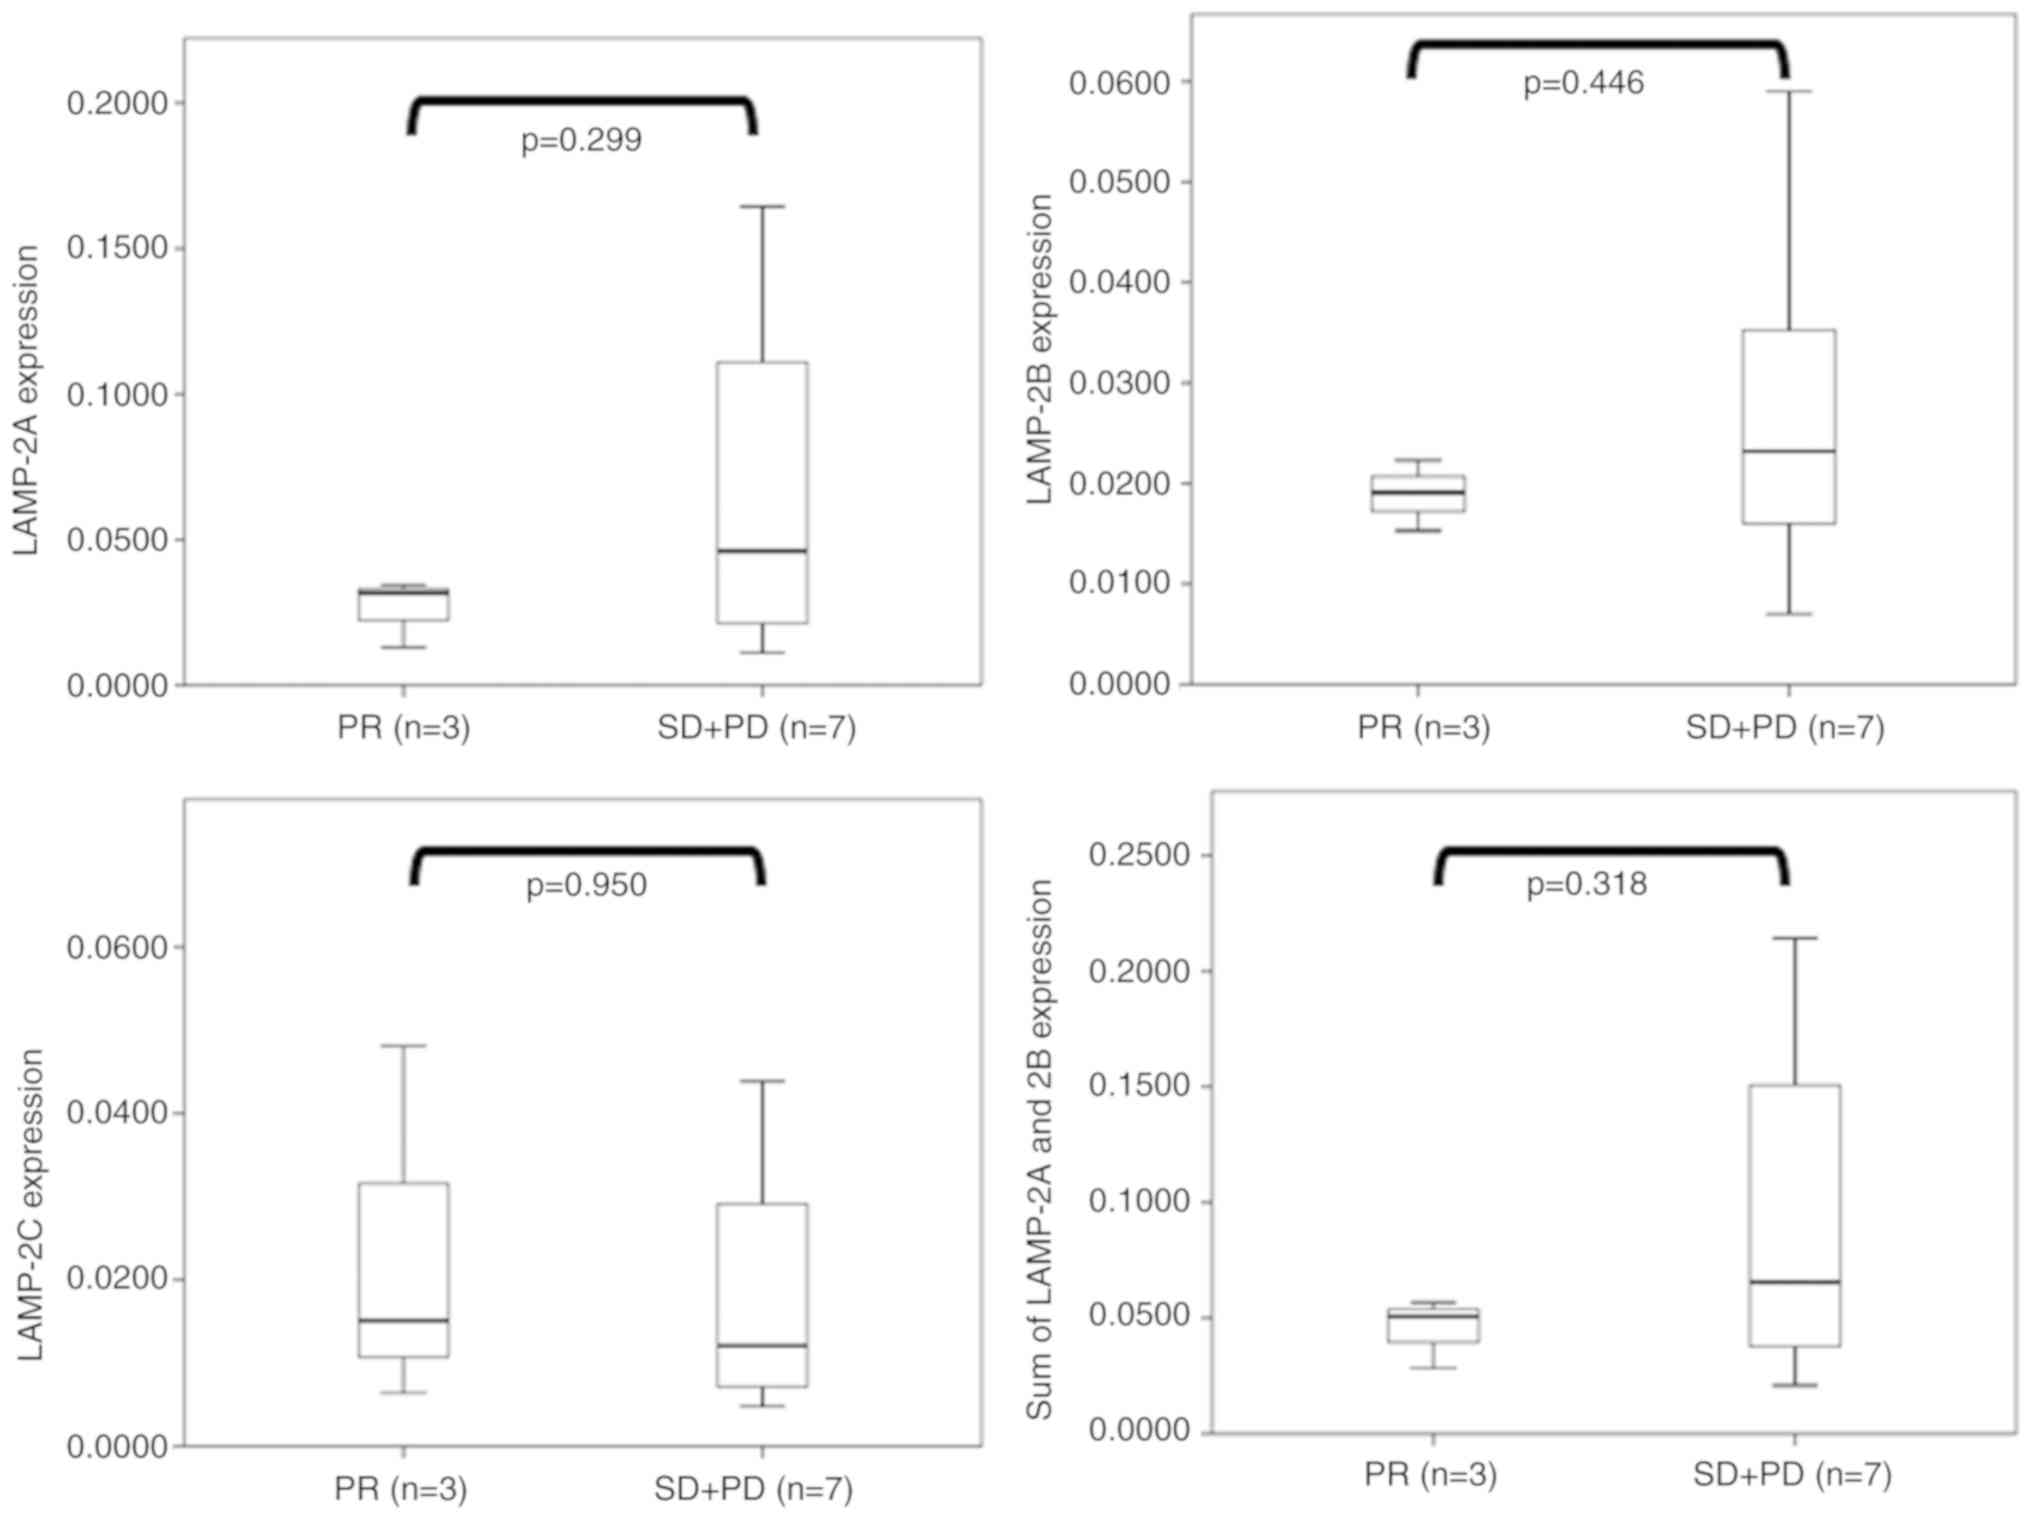
As revealed in Fig.
2, there was no significant difference between the therapeutic
effect and expression levels of any LAMP-2 variants. However,
LAMP-2A, LAMP-2B, and the sum of LAMP-2A and LAMP-2B cases
exhibiting high expression were revealed in only the SD + PD
groups, but not in the PR groups. In contrast, no difference in
LAMP-2C expression was observed between the SD + PD and PR
groups.
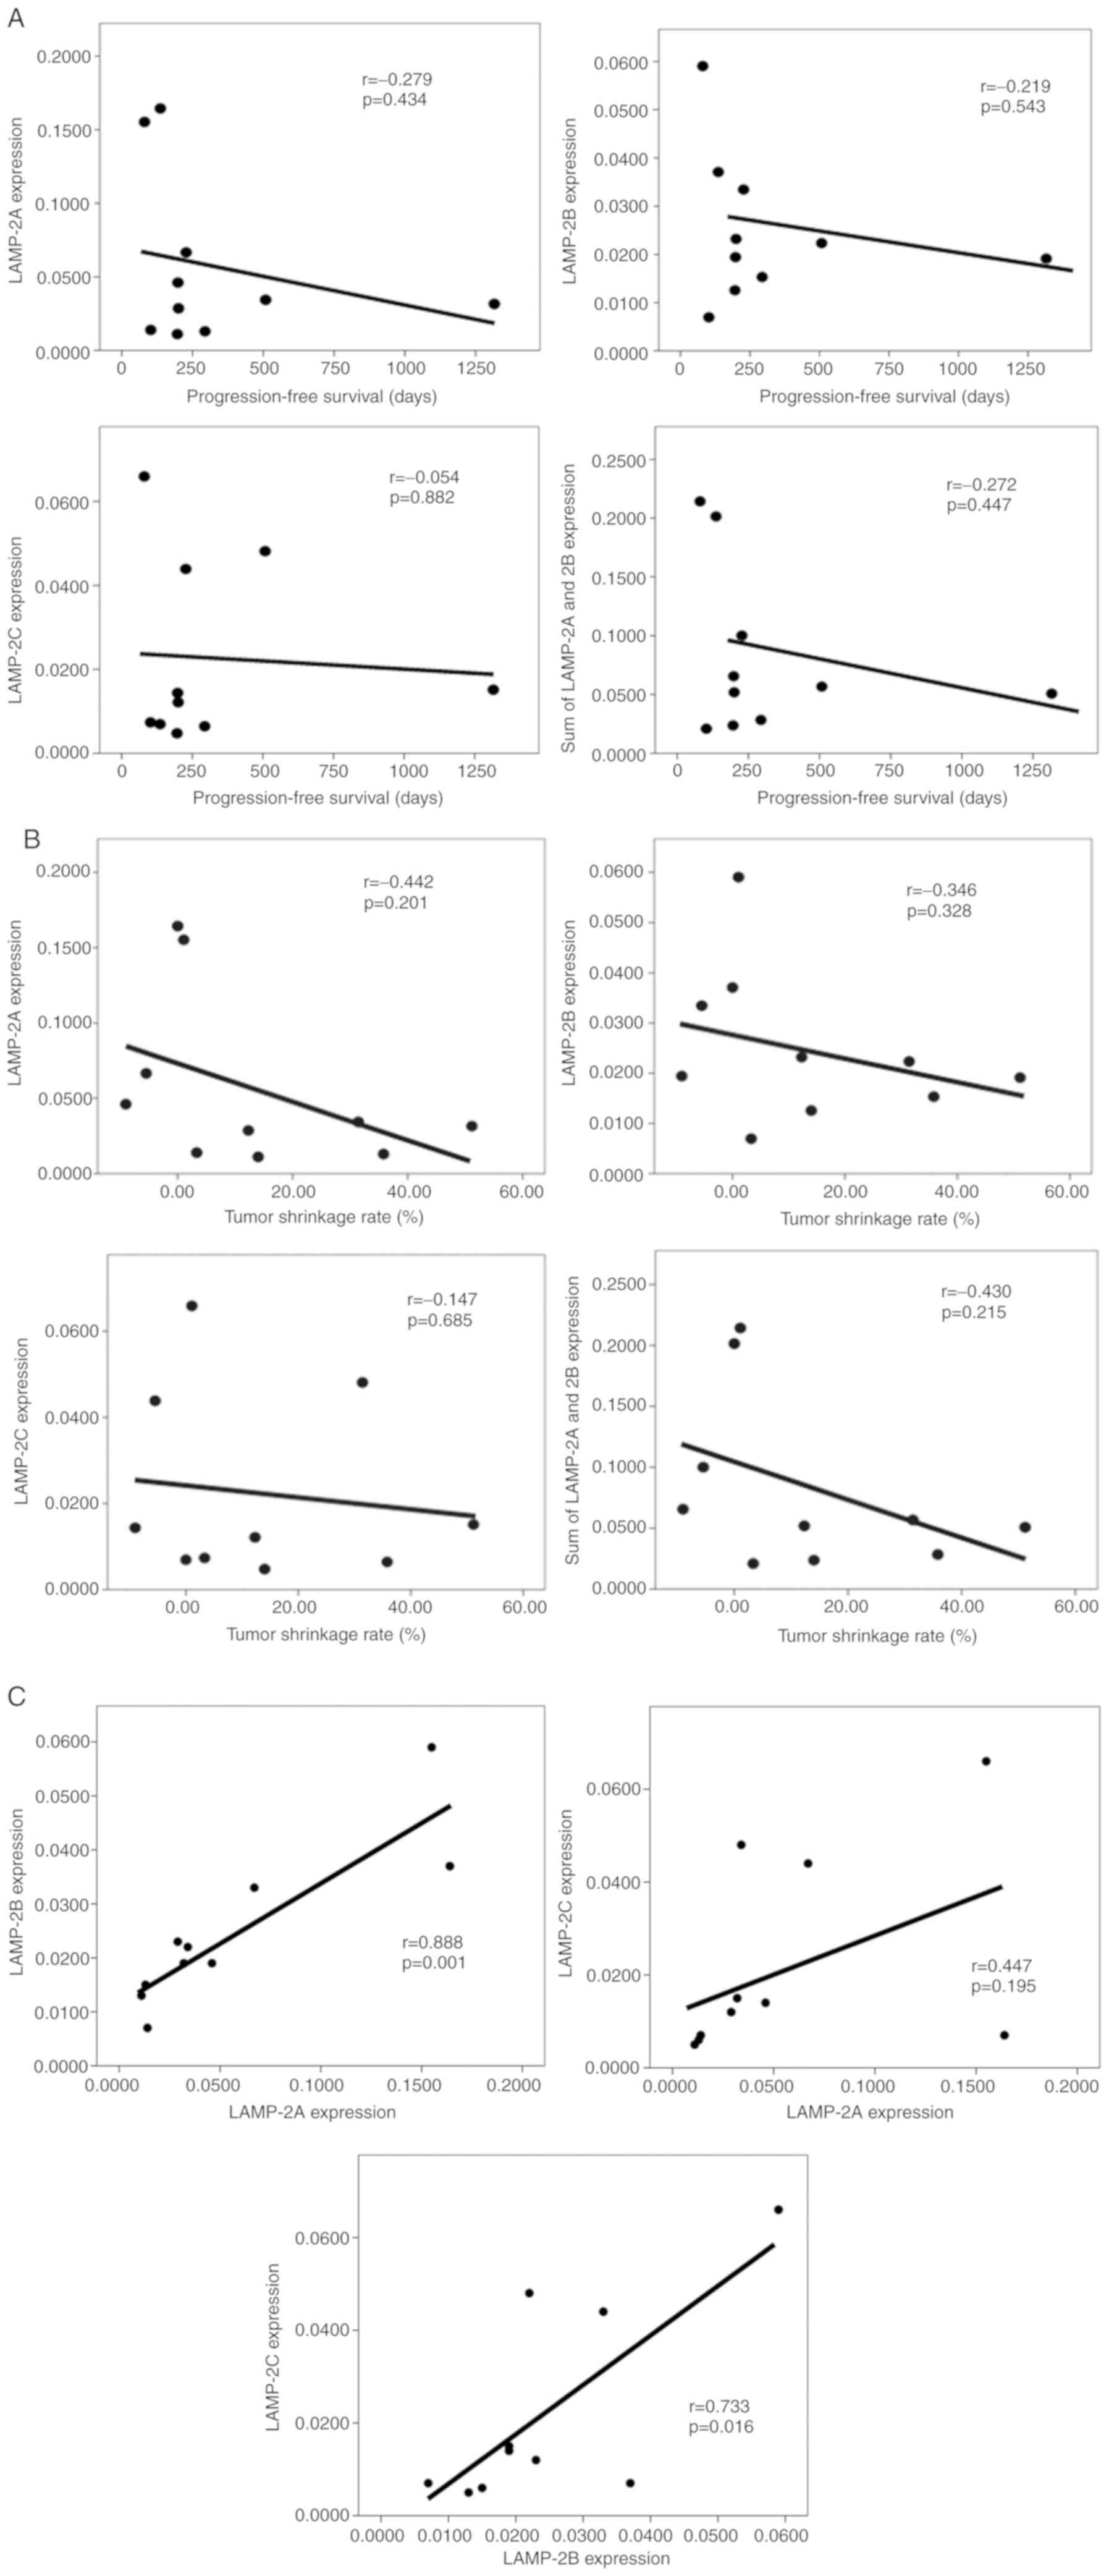
Next, the correlation between the sunitinib
treatment period PFS and the gene expression status was evaluated.
LAMP-2A (r=−0.279; P=0.434) and LAMP-2B (r=−0.219; P=0.543)
exhibited weak negative correlations between PFS and each gene
expression level (Fig. 3A). In
contrast, LAMP-2C exhibited no such correlation (r=−0.054;
P=0.882). Additionally, there were moderate correlations between a
high tumor shrinkage rate and a low expression of LAMP-2A
(r=−0.442; P=0.201), as well as the concomitant sum of LAMP-2A and
LAMP-2B expression (r=−0.430; P=0.215; Fig. 3B). There was a weak correlation
between a high tumor shrinkage rate and a low expression of LAMP-2B
(r=−0.346; P=0.328). Correlations among LAMP-2A, LAMP-2B, and
LAMP-2C were also evaluated, revealing that their expression levels
were in fact correlated, of which LAMP-2A and LAMP-2B exhibited the
strongest correlation (Fig. 3C).
Thus, although there were differences in the expression levels of
the three splice variants of LAMP-2 in the 10 patients, all three
variants were expressed at the mRNA level in all cases.
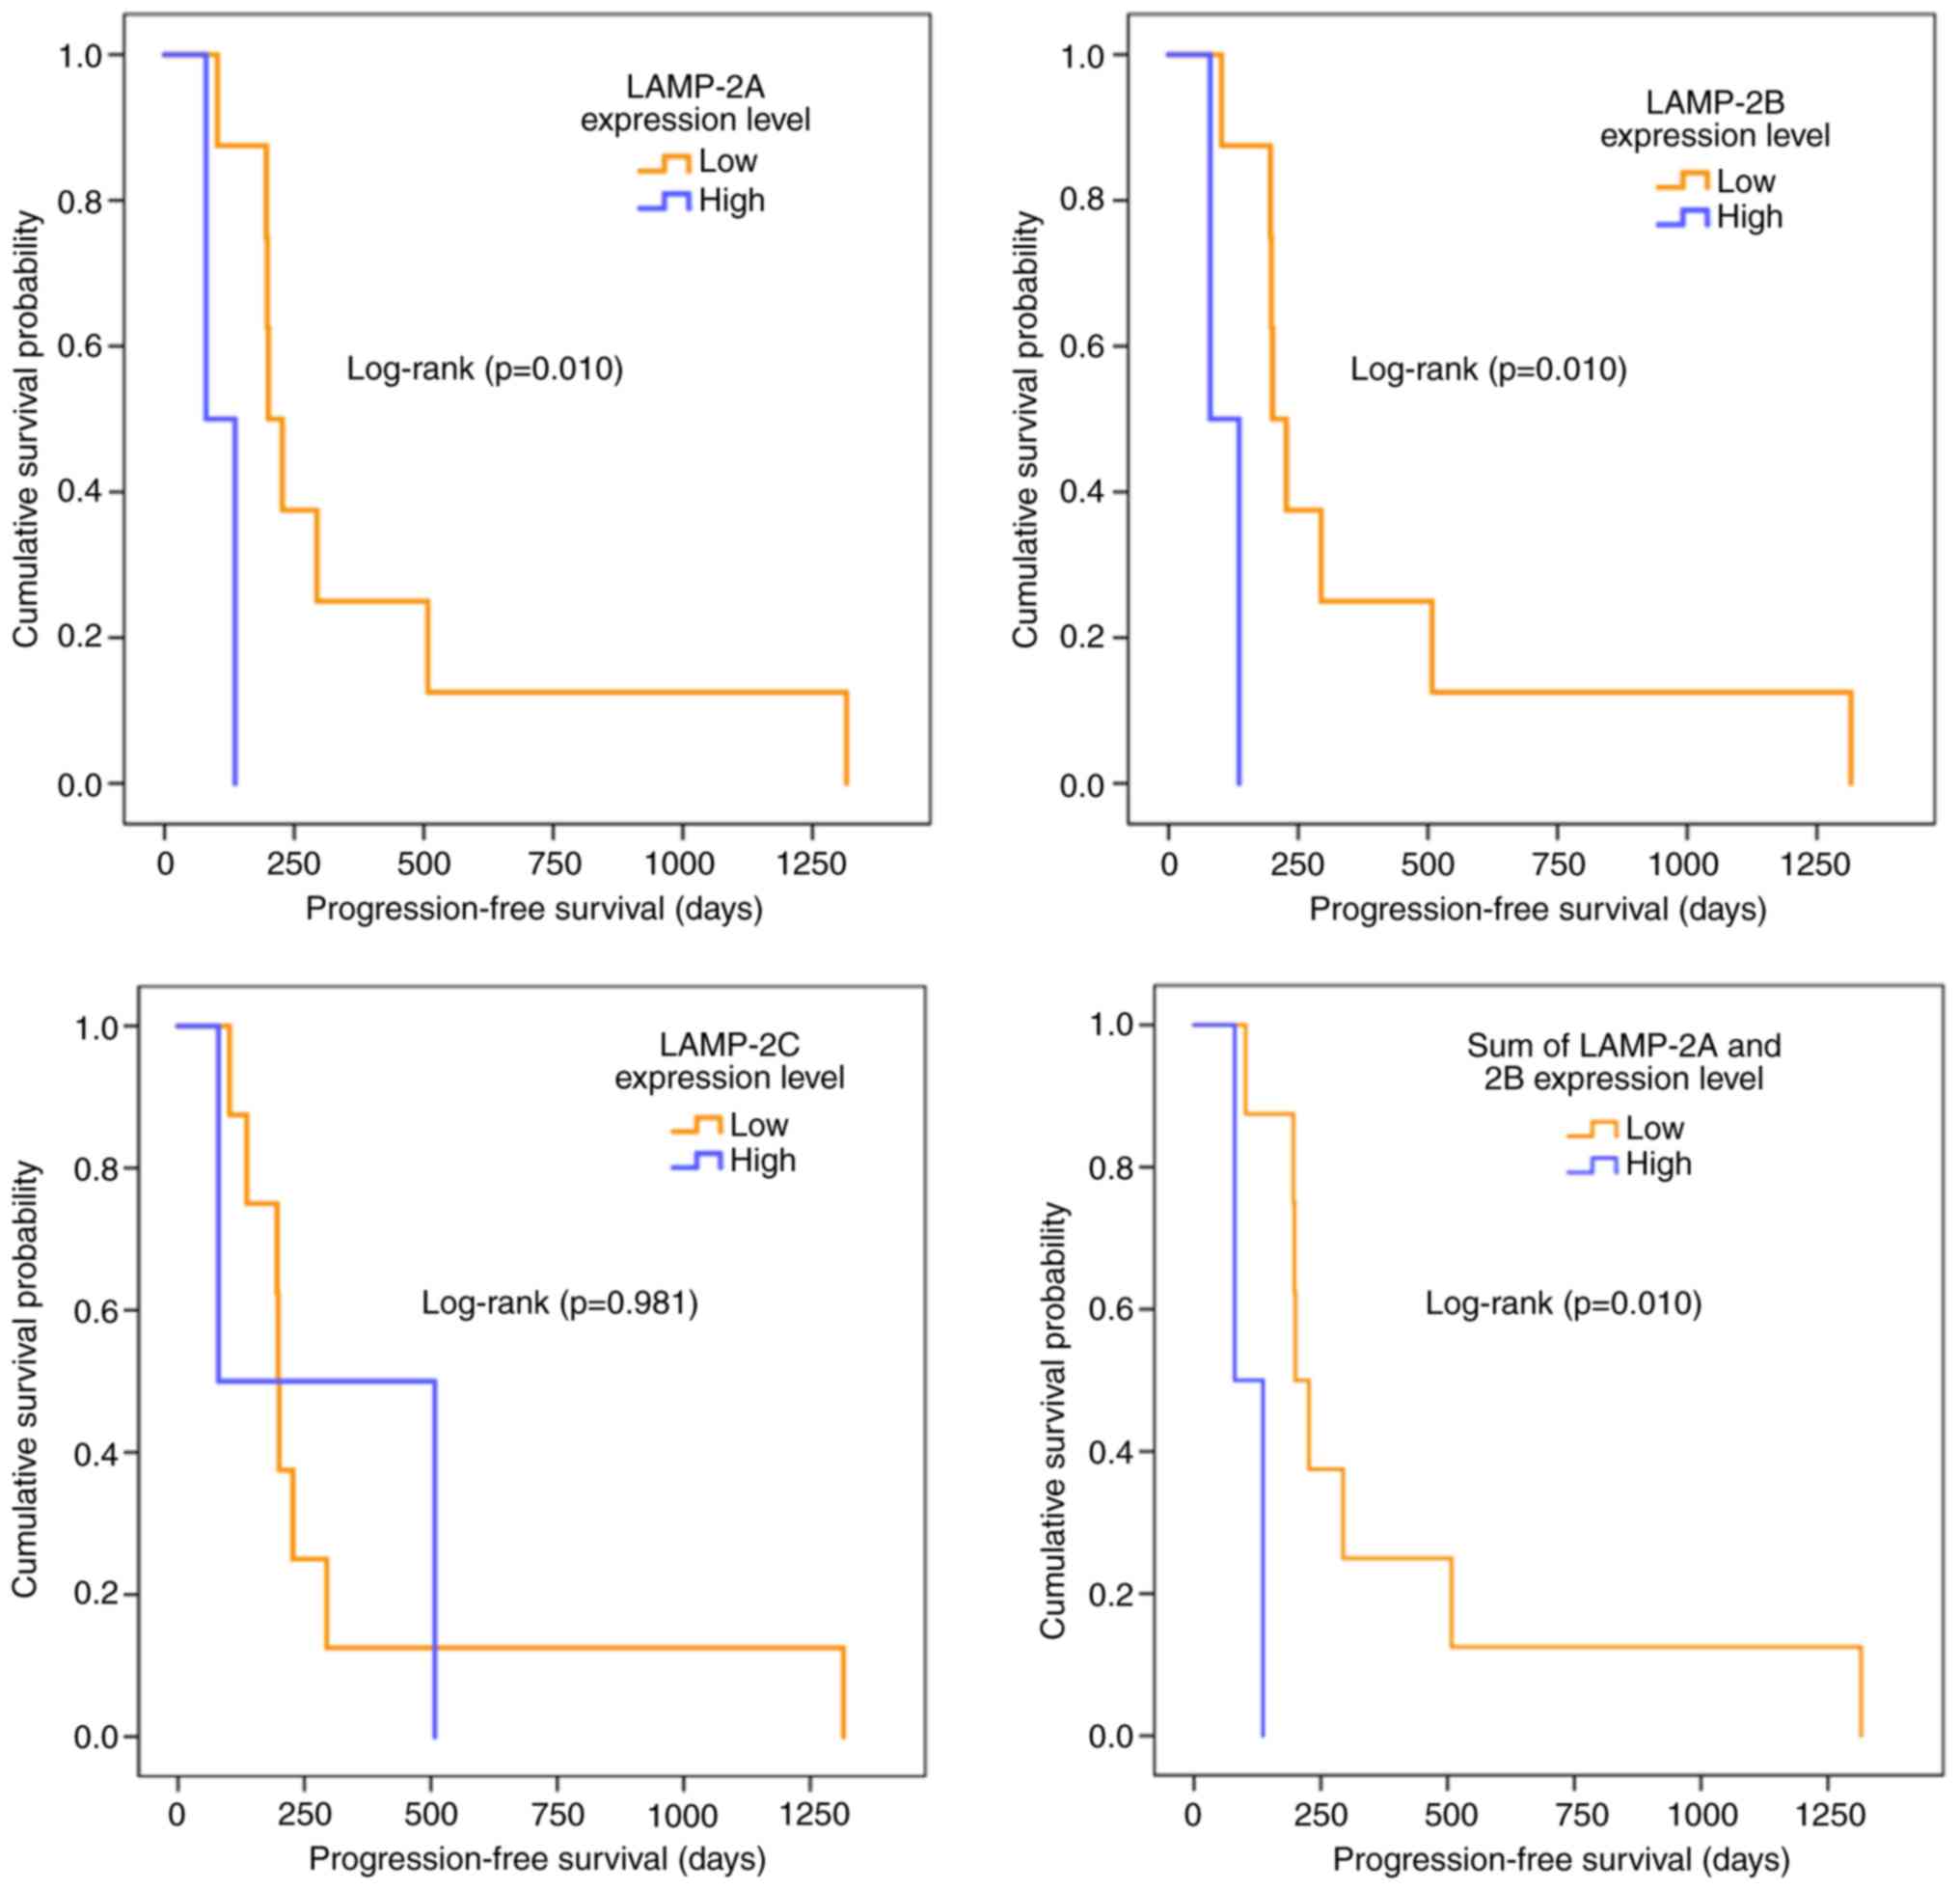
Kaplan-Meier plots were also utilized to evaluate
the effect of LAMP-2 variant expression levels on sunitinib
resistance (Fig. 4). In all LAMP-2
splice variants, there were 3 patients in the high expression group
and 7 in the low expression group. For the LAMP-2A, LAMP-2B, and
sum of LAMP-2A and LAMP-2B expression levels, the cases in the two
groups of high and low expression levels were consistent, thus
similar survival curves were obtained. Although LAMP-2C exhibited
no difference between the high expression and the low expression
groups (P=0.981), LAMP-2A, LAMP-2B, and the sum of LAMP-2A and
LAMP-2B were significantly different between the two groups
(P=0.010). The low expression group of these variants exhibited a
significantly longer PFS.
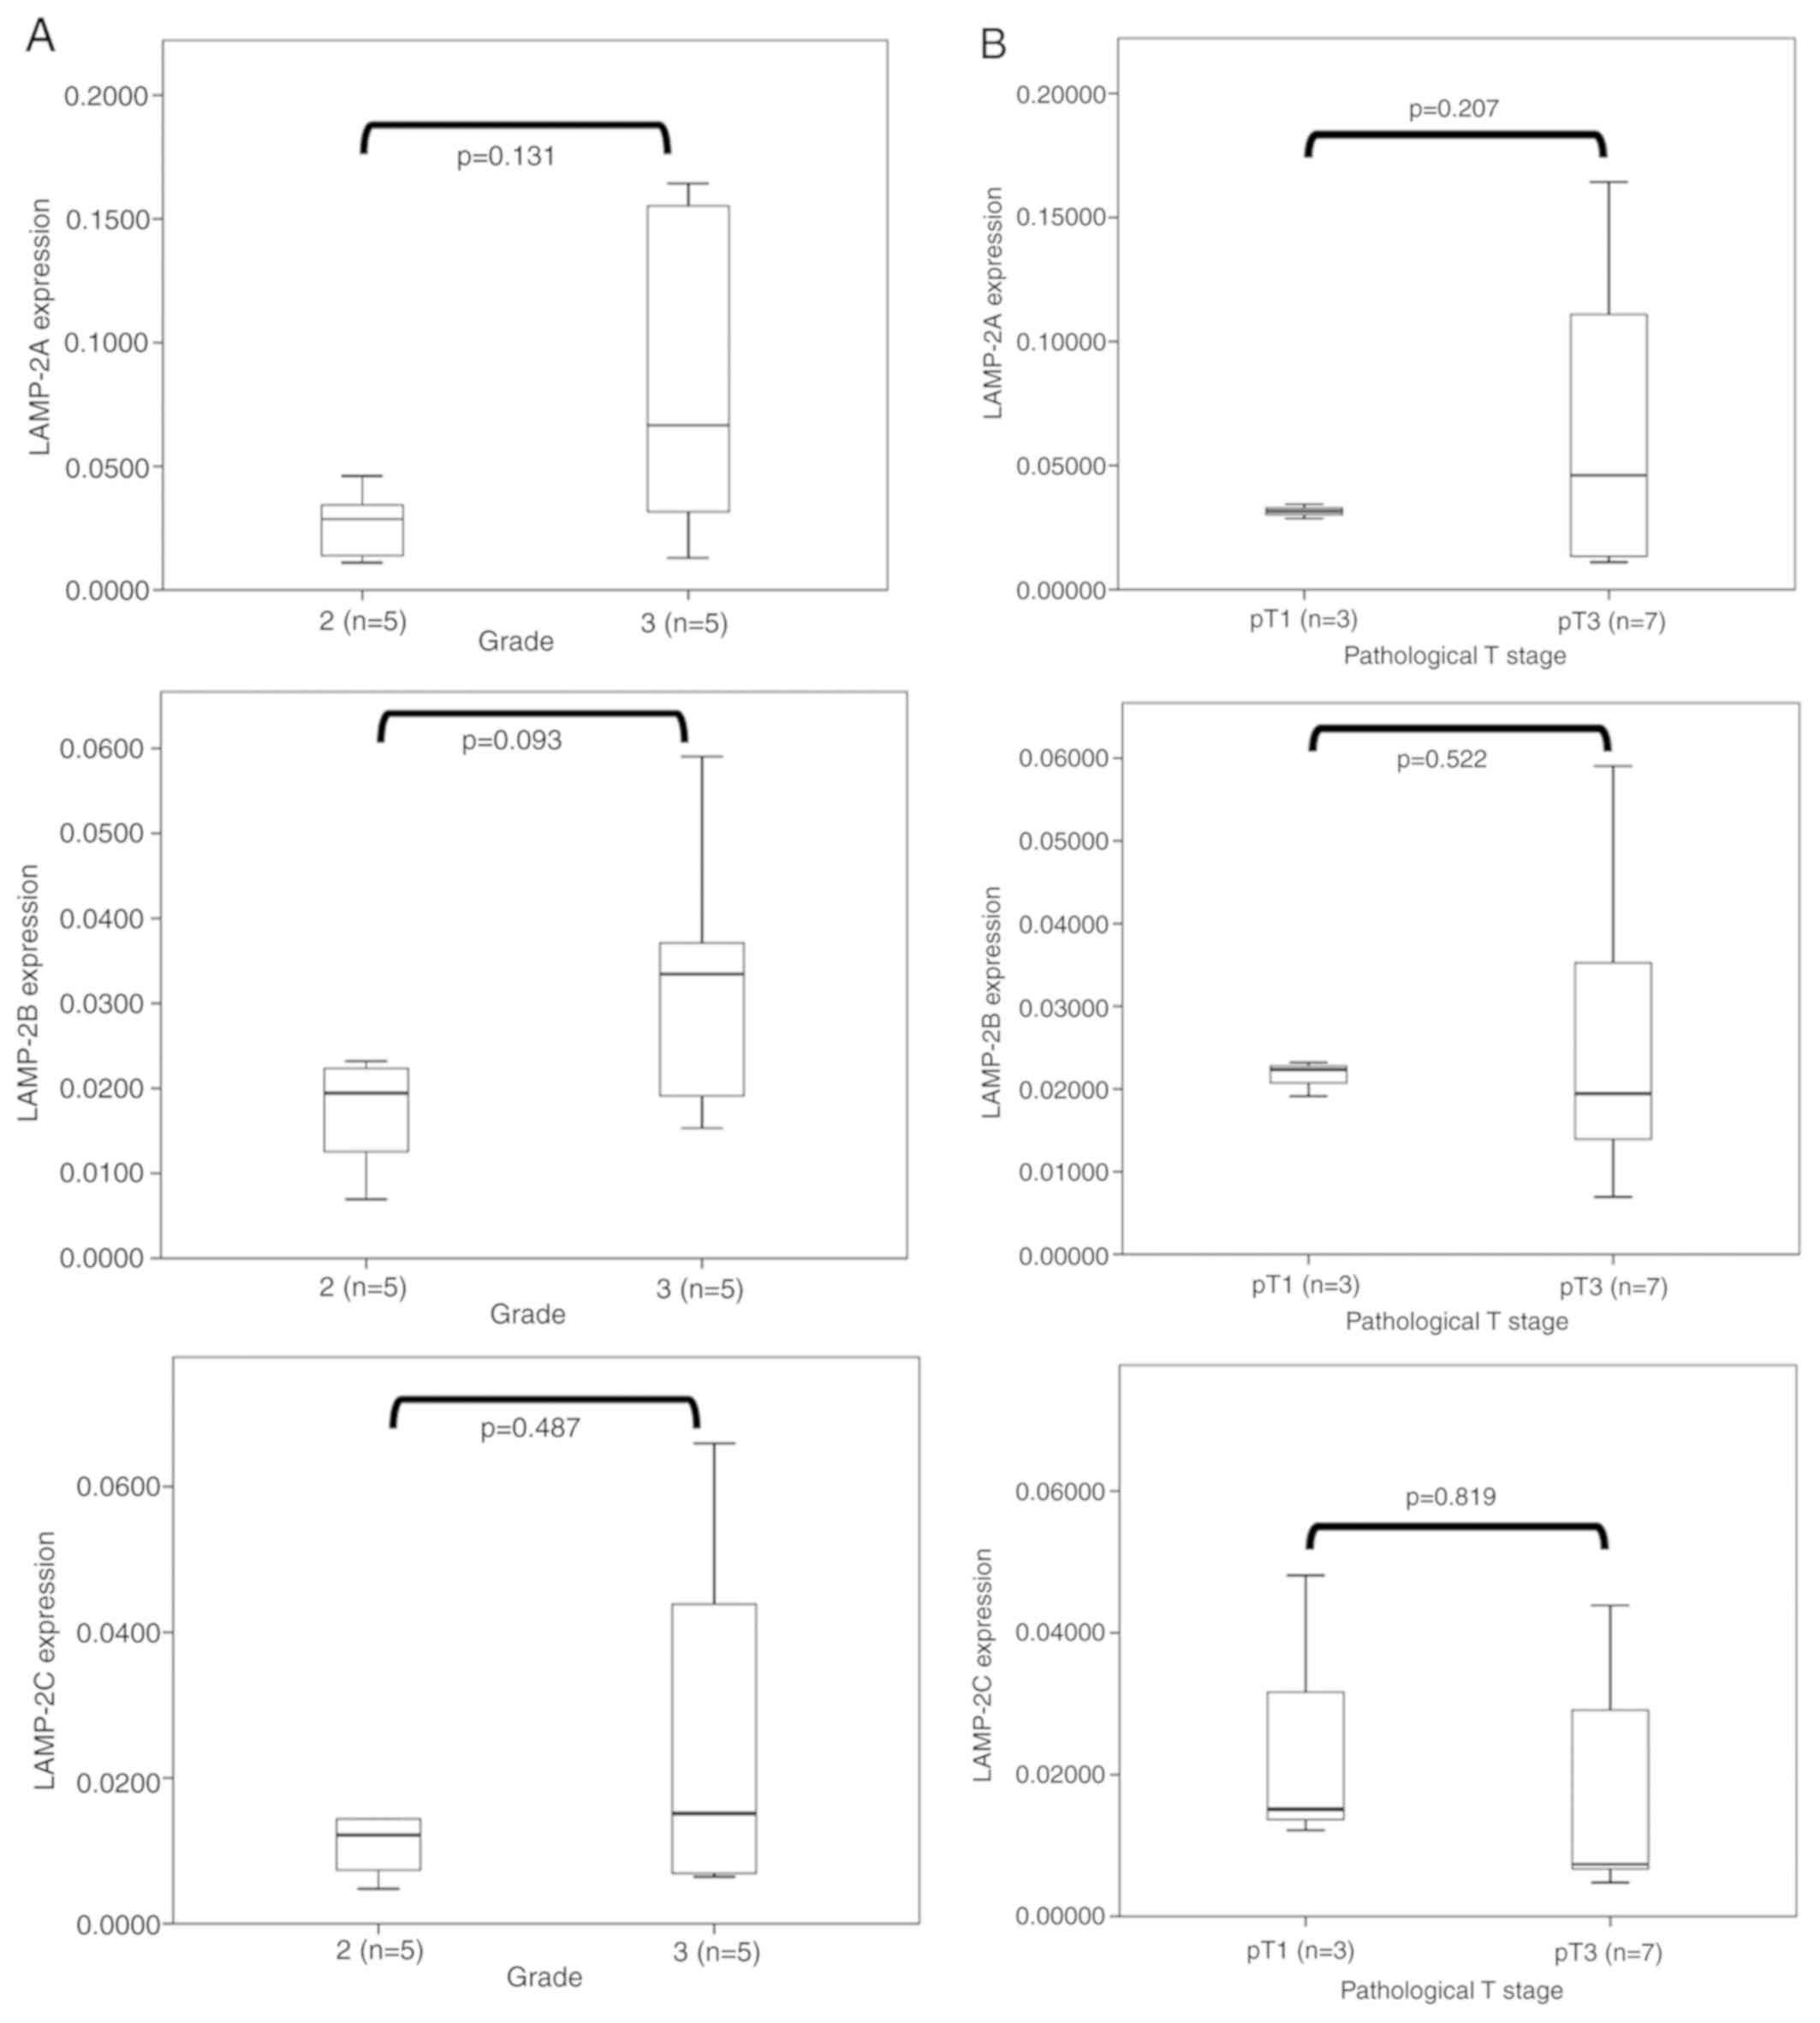
The association between LAMP-2 splice variant
expression levels and tumor pathological grades was then examined
(Fig. 5A) and no significant
difference between pathological grades 2 and 3 were revealed.
However, tumors with a higher pathological grade tended to exhibit
higher expression levels of LAMP-2A (P=0.131) and LAMP-2B
(P=0.093). The associations between pathological T stage and LAMP-2
splice variants in resected tumors were also examined (Fig. 5B). However, there was no significant
difference between the pathological stage (pT1, n=3 vs. pT3, n=7)
and the expression levels of all splice variants of LAMP-2.
Discussion
In the present study, it was demonstrated that
LAMP-2A and LAMP-2B were involved in sunitinib resistance in RCC
cells (12). Despite its
therapeutic effect in patients with advanced-stage RCC, sunitinib
use remains limited since tumors acquire drug resistance early on.
Gotink et al reported that increased sequestration of
sunitinib in lysosomes enhanced by the overexpression of LAMP-2
resulted in sunitinib resistance in RCC cells (19). We also previously revealed that
LAMP-2 is involved in sunitinib resistance in RCC cells (13,14);
however, we did not examine which splice variants (2A, 2B, and 2C)
contributed to such resistance. LAMP-2A and LAMP-2B are
constitutively expressed in most tissues and cells, whereas high
expression of LAMP-2C is limited to the brain, heart, skeletal
muscle, small intestine, and colon (20). However, their functions in the
acquisition of drug resistance in cancer cells remain unclear.
To the best of our knowledge, this is the first
study regarding the influence of LAMP-2A and LAMP-2B on sunitinib
resistance in RCC cells. LAMP-2A was reported to be a key protein
in chaperone-mediated autophagy (21). In contrast, LAMP-2B was revealed to
be involved in macroautophagy, and Danon disease is caused by loss
of the LAMP-2B isoform (22). As
both variants are involved in autophagy, the present results
indicated that the acquisition of sunitinib resistance in RCC cells
is possibly mediated by autophagy activation. Autophagy is reported
to affect both cancer cell growth and death, depending on the
tissue environment (23). It has
been suggested that chemotherapy-induced autophagy results in the
acquisition of resistance against therapy-mediated cell death
(24,25). In anti-angiogenesis therapy, such as
sunitinib treatment, the upregulation of autophagy caused sunitinib
resistance in patients with RCC (26). Giuliano et al reported that
sunitinib resistance of RCC cells was caused by inappropriate
autophagy flux via sequestration of sunitinib in lysosomes,
suggesting that LAMP-2 was involved in the mechanism (27).
Strategies for overcoming sunitinib resistance have
been developed, such as combination therapy, sunitinib
re-challenge, sequential therapy, and dose-escalation in both
animal and human studies (12,28).
Sasaki et al reported that chloroquine (CQ), an
anti-malarial agent and autophagy inhibitor, potentiates the
anticancer effect of 5-fluorouracil on colon cancer cells (29), and Li et al reported that CQ,
in combination with sunitinib, could enhance the anti-RCC effects
of sunitinib (30). In fact, the
therapeutic effects of sunitinib were enhanced when combined with
CQ against pancreatic neuroendocrine tumors via autophagy
inhibition and lysosomal membrane permeabilization (31). In this study, it was also indicated
that combination with CQ was as effective as LAMP-2 knockdown.
These studies strongly indicate that autophagy is involved in
sunitinib resistance, suggesting that the overexpression of LAMP-2A
and LAMP-2B plays a role in the acquisition of sunitinib resistance
in RCC cells. Conversely, LAMP-2C does not appear to be involved in
sunitinib resistance in RCC cells. Fujiwara et al reported
that LAMP-2C serves as a receptor for RNautophagy and DNautophagy,
in which RNA and DNA are taken up directly into lysosomes for
degradation (32,33). LAMP-2C may not be involved in taking
up drugs, including sunitinib, into lysosomes, and thus, it is
considered that LAMP-2C is not involved in the acquisition of
sunitinib resistance of RCC cells.
In clinical samples of patients with RCC who were
treated with sunitinib for metastases following nephrectomy at our
hospital, Tottori University Hospital, higher expression of LAMP-2A
and LAMP-2B was indicated to be involved in the response to
sunitinib. In terms of the best overall response rate, the
expression levels of LAMP-2A and LAMP-2B tended to be associated
with the overall response rate, although there was no significant
difference in these groups. In addition, high gene expression
levels and shorter PFS during the sunitinib treatment period were
weakly associated with both LAMP-2A and LAMP-2B. The tumor-reducing
effect of sunitinib treatment was also moderately associated with
LAMP-2A and weakly associated with LAMP-2B. Moreover, patients
exhibiting high expression levels of these two splice variants also
exhibited significantly lower survival rates in the Kaplan-Meier
curve analysis. These clinical sample data are strongly consistent
with the in vitro data, suggesting that high expression of
LAMP-2A and LAMP-2B contributes to the prognosis of
sunitinib-treated patients with RCC via acquisition of sunitinib
resistance.
There are several limitations to the present study.
One is that only one cell line was used in this experiment. The
involvement of the LAMP-2 splice variants in sunitinib resistance
may have been detected only in ACHN cells and not in other RCC cell
lines. In addition, future investigations by animal studies are
required. Future studies should involve examination of subcutaneous
transplantation of LAMP-2A- and LAMP-2B-overexpressing RCC cell
lines into mice, with differences in growth rates between normal
cells and LAMP-2-overexpressing cells after sunitinib treatment.
The involvement of LAMP-2A and LAMP-2B in sunitinib resistance
needs to be confirmed using in vitro studies as well.
Another limitation of this study is the small number of clinical
samples examined for clinicopathological analysis. It has been
difficult to obtain a larger clinical sample at our institution due
to the small number of patients with a history of nephrectomy that
have used sunitinib; thus, future studies should involve larger
sample sizes.
LAMP-2A and LAMP-2B were revealed to be involved in
the acquisition of sunitinib resistance in patients with RCC
possibly through the mediation of autophagy, strongly suggesting
that their expression in RCC can be used as a predictive marker for
sunitinib resistance. Moreover, since their low expression levels
may be associated with enhanced antitumor effects of sunitinib and
contribute to tumor reduction and longer PFS, the development of
LAMP-2A and LAMP-2B inhibitors may help overcome the acquisition of
sunitinib resistance in RCC.
Acknowledgements
Not applicable.
Funding
No funding was received.
Availability of data and materials
The datasets used and/or analyzed during the present
study are available from the corresponding author upon a reasonable
request. Patient data are confidential and therefore have not been
shared.
Authors' contributions
RN contributed majorly towards the writing of the
manuscript. MO supervised the experiments and assisted with the
writing of the manuscript. RN, RS, and MI performed the experiments
and collected the data. TK provided the reagents needed for the
experiments. RN, TY, NY and HI obtained the tumors and tissues with
their clinical information when available. RN and RS performed the
statistical analysis. RN, MO and MH analyzed the data and drafted
the manuscript. AT and FO made contributions to the design of the
study and critically revised the manuscript for intellectual
content. All authors read and approved the final manuscript.
Ethics approval and consent to
participate
All RCC tissues were obtained with informed consent,
and the procedures were approved by the Ethics Committee of Tottori
University (Tottori, Japan; approval no. 1558).
Patient consent for publication
Not applicable.
Competing interests
The authors declare that they have no competing
interests.
References
|
1
|
Capitanio U and Montorsi F: Renal cancer.
Lancet. 387:894–906. 2016. View Article : Google Scholar : PubMed/NCBI
|
|
2
|
Eggener SE, Yossepowitch O, Pettus JA,
Snyder ME, Motzer RJ and Russo P: Renal cell carcinoma recurrence
after nephrectomy for localized disease: Predicting survival from
time of recurrence. J Clin Oncol. 24:3101–3106. 2006. View Article : Google Scholar : PubMed/NCBI
|
|
3
|
National Comprehensive Cancer Network, .
Guidelines are available at. https://www.nccn.org/professionals/physician_gls/default.aspx
|
|
4
|
Motzer RJ, Hutson TE, Tomczak P,
Michaelson MD, Bukowski RM, Oudard S, Negrier S, Szczylik C, Pili
R, Bjarnason GA, et al: Overall survival and updated results for
sunitinib compared with interferon alfa in patients with metastatic
renal cell carcinoma. J Clin Oncol. 27:3584–3590. 2009. View Article : Google Scholar : PubMed/NCBI
|
|
5
|
Motzer RJ, Michaelson MD, Redman BG, Hudes
GR, Wilding G, Figlin RA, Ginsberg MS, Kim ST, Baum CM, DePrimo SE,
et al: Activity of SU11248, a multitargeted inhibitor of vascular
endothelial growth factor receptor and platelet-derived growth
factor receptor, in patients with metastatic renal cell carcinoma.
J Clin Oncol. 24:16–24. 2006. View Article : Google Scholar : PubMed/NCBI
|
|
6
|
Motzer RJ, Rini BI, Bukowski RM, Curti BD,
George DJ, Hudes GR, Redman BG, Margolin KA, Merchan JR, Wilding G,
et al: Sunitinib in patients with metastatic renal cell carcinoma.
JAMA. 295:2516–2524. 2006. View Article : Google Scholar : PubMed/NCBI
|
|
7
|
Barrios CH, Hernandez-Barajas D, Brown MP,
Lee SH, Fein L, Liu JH, Hariharan S, Martell BA, Yuan J, Bello A,
et al: Phase II trial of continuous once-daily dosing of sunitinib
as first-line treatment in patients with metastatic renal cell
carcinoma. Cancer. 118:1252–1259. 2012. View Article : Google Scholar : PubMed/NCBI
|
|
8
|
Motzer RJ, Hutson TE, Olsen MR, Hudes GR,
Burke JM, Edenfield WJ, Wilding G, Agarwal N, Thompson JA, Cella D,
et al: Randomized phase II trial of sunitinib on an intermittent
versus continuous dosing schedule as first-line therapy for
advanced renal cell carcinoma. J Clin Oncol. 30:1371–1377. 2012.
View Article : Google Scholar : PubMed/NCBI
|
|
9
|
Gore ME, Szczylik C, Porta C, Bracarda S,
Bjarnason GA, Oudard S, Hariharan S, Lee SH, Haanen J, Castellano
D, et al: Safety and efficacy of sunitinib for metastatic
renal-cell carcinoma: An expanded-access trial. Lancet Oncol.
10:757–763. 2009. View Article : Google Scholar : PubMed/NCBI
|
|
10
|
Gore ME, Szczylik C, Porta C, Bracarda S,
Bjarnason GA, Oudard S, Lee SH, Haanen J, Castellano D, Vrdoljak E,
et al: Final results from the large sunitinib global
expanded-access trial in metastatic renal cell carcinoma. Br J
Cancer. 113:12–19. 2015. View Article : Google Scholar : PubMed/NCBI
|
|
11
|
Motzer RJ, Hutson TE, Cella D, Reeves J,
Hawkins R, Guo J, Nathan P, Staehler M, de Souza P, Merchan JR, et
al: Pazopanib versus sunitinib in metastatic renal-cell carcinoma.
N Engl J Med. 369:722–731. 2013. View Article : Google Scholar : PubMed/NCBI
|
|
12
|
Morais C: Sunitinib resistance in renal
cell carcinoma. J Kidney Cancer VHL. 1:1–11. 2014. View Article : Google Scholar : PubMed/NCBI
|
|
13
|
Yamaguchi N, Osaki M, Onuma K, Yumioka T,
Iwamoto H, Sejima T, Kugoh H, Takenaka A and Okada F:
Identification of MicroRNAs involved in resistance to sunitinib in
renal cell carcinoma cells. Anticancer Res. 37:2985–2992.
2017.PubMed/NCBI
|
|
14
|
Yumioka T, Osaki M, Sasaki R, Yamaguchi N,
Onuma K, Iwamoto H, Morizane S, Honda M, Takenaka A and Okada F:
Lysosome-associated membrane protein 2 (LAMP-2) expression induced
by miR-194-5p downregulation contributes to sunitinib resistance in
human renal cell carcinoma cells. Oncol Lett. 15:893–900.
2018.PubMed/NCBI
|
|
15
|
Eskelinen EL, Cuervo AM, Taylor MR,
Nishino I, Blum JS, Dice JF, Sandoval IV, Lippincott-Schwartz J,
August JT and Saftig P: Unifying nomenclature for the isoforms of
the lysosomal membrane protein LAMP-2. Traffic. 6:1058–1061. 2005.
View Article : Google Scholar : PubMed/NCBI
|
|
16
|
Livak KJ and Schmittgen TD: Analysis of
relative gene expression data using real-time quantitative PCR and
the 2(-Delta Delta C(T)) method. Methods. 25:402–408. 2001.
View Article : Google Scholar : PubMed/NCBI
|
|
17
|
Eisenhauer EA, Therasse P, Bogaerts J,
Schwartz LH, Sargent D, Ford R, Dancey J, Arbuck S, Gwyther S,
Mooney M, et al: New response evaluation criteria in solid tumours:
Revised RECIST guideline (version 1.1). Eur J Cancer. 45:228–247.
2009. View Article : Google Scholar : PubMed/NCBI
|
|
18
|
Punt S, Houwing-Duistermaat JJ, Schulkens
IA, Thijssen VL, Osse EM, de Kroon CD, Griffioen AW, Fleuren GJ,
Gorter A and Jordanova ES: Correlations between immune response and
vascularization qRT-PCR gene expression clusters in squamous
cervical cancer. Mol Cancer. 14:712015. View Article : Google Scholar : PubMed/NCBI
|
|
19
|
Gotink KJ, Broxterman HJ, Labots M, de
Haas RR, Dekker H, Honeywell RJ, Rudek MA, Beerepoot LV, Musters
RJ, Jansen G, et al: Lysosomal sequestration of sunitinib: A novel
mechanism of drug resistance. Clin Cancer Res. 17:7337–7346. 2011.
View Article : Google Scholar : PubMed/NCBI
|
|
20
|
Pérez L, McLetchie S, Gardiner GJ, Deffit
SN, Zhou D and Blum JS: LAMP-2C Inhibits MHC Class II presentation
of cytoplasmic antigens by disrupting chaperone-mediated autophagy.
J Immunol. 196:2457–2465. 2016. View Article : Google Scholar : PubMed/NCBI
|
|
21
|
Dice JF: Chaperone-mediated autophagy.
Autophagy. 3:295–299. 2007. View Article : Google Scholar : PubMed/NCBI
|
|
22
|
Endo Y, Furuta A and Nishino I: Danon
disease: A phenotypic expression of LAMP-2 deficiency. Acta
Neuropathol. 129:391–398. 2015. View Article : Google Scholar : PubMed/NCBI
|
|
23
|
Goldsmith J, Levine B and Debnath J:
Autophagy and cancer metabolism. Methods Enzymol. 542:25–57. 2014.
View Article : Google Scholar : PubMed/NCBI
|
|
24
|
Ng G and Huang J: The significance of
autophagy in cancer. Mol Carcinog. 43:183–187. 2005. View Article : Google Scholar : PubMed/NCBI
|
|
25
|
Notte A, Leclere L and Michiels C:
Autophagy as a mediator of chemotherapy-induced cell death in
cancer. Biochem Pharmacol. 82:427–434. 2011. View Article : Google Scholar : PubMed/NCBI
|
|
26
|
Liu J, Fan L, Wang H and Sun G: Autophagy,
a double-edged sword in anti-angiogenesis therapy. Med Oncol.
33:102016. View Article : Google Scholar : PubMed/NCBI
|
|
27
|
Giuliano S, Cormerais Y, Dufies M, Grépin
R, Colosetti P, Belaid A, Parola J, Martin A, Lacas-Gervais S,
Mazure NM, et al: Resistance to sunitinib in renal clear cell
carcinoma results from sequestration in lysosomes and inhibition of
the autophagic flux. Autophagy. 11:1891–1904. 2015. View Article : Google Scholar : PubMed/NCBI
|
|
28
|
Adelaiyr R, Ciamporcero E, Miles KM,
Sotomayor P, Bard J, Tsompana M, Conroy D, Shen L, Ramakrishnan S,
Ku SY, et al: Sunitinib dose escalation overcomes transient
resistance in clear cell renal cell carcinoma and is associated
with epigenetic modifications. Mol Cancer Ther. 14:513–522. 2015.
View Article : Google Scholar : PubMed/NCBI
|
|
29
|
Sasaki K, Tsuno NH, Sunami E, Tsurita G,
Kawai K, Okaji Y, Nishikawa T, Shuno Y, Hongo K, Hiyoshi M, et al:
Chloroquine potentiates the anti-cancer effect of 5-fluorouracil on
colon cancer cells. BMC Cancer. 10:3702010. View Article : Google Scholar : PubMed/NCBI
|
|
30
|
Li ML, Xu YZ, Lu WJ, Li YH, Tan SS, Lin
HJ, Wu TM, Li Y, Wang SY and Zhao YL: Chloroquine potentiates the
anticancer effect of sunitinib on renal cell carcinoma by
inhibiting autophagy and inducing apoptosis. Oncol Lett.
15:2839–2846. 2018.PubMed/NCBI
|
|
31
|
Wiedmer T, Blank A, Pantasis S, Normand L,
Bill R, Krebs P, Tschan MP, Marinoni I and Perren A: Autophagy
inhibition improves sunitinib efficacy in pancreatic neuroendocrine
tumors via a lysosome-dependent mechanism. Mol Cancer Ther.
16:2502–2515. 2017. View Article : Google Scholar : PubMed/NCBI
|
|
32
|
Fujiwara Y, Furuta A, Kikuchi H, Aizawa S,
Hatanaka Y, Konya C, Uchida K, Yosihmura A, Tamai Y, Wada K and
Kabuta T: Discovery of a novel type of autophagy targeting RNA.
Autophagy. 9:403–409. 2013. View Article : Google Scholar : PubMed/NCBI
|
|
33
|
Fujiwara Y, Kikuchi H, Aizawa S, Furuta A,
Hatanaka Y, Konya C, Uchida K, Wada K and Kabuta T: Direct uptake
and degradation of DNA by lysosomes. Autophagy. 9:1167–1171. 2013.
View Article : Google Scholar : PubMed/NCBI
|