Introduction
The incidence and mortality of breast cancer (BC)
are rapidly increasing worldwide (1–3).
Among females, breast cancer is the most commonly diagnosed cancer
(24.2% of total cancer cases) and the leading cause of cancer
mortality (15.0% of total cancer deaths) (4). Although surgical resection combined
with chemotherapy and radiotherapy has been widely applied in
patients with BC, therapeutic outcomes remain unsatisfactory
(5). Despite the fact that it has
been proven that BC development and/or progression is closely
associated with a number of genetic alterations, the molecular
pathogenesis has not been fully elucidated. Therefore,
understanding the molecular profiles of BC as well as elucidating
the role of genetic changes involved in BC may lead to novel
therapeutic strategies for individual patients with BC (6,7).
Ribosome biogenesis is a complex process involving
the synthesis and processing of pre-ribosomal RNAs, coordinated
ribosome protein synthesis, and ribosome subunit assembly and
transport. Moreover, ribosome assembly is highly dynamic and
tightly linked to cell growth and proliferation (8–10).
Mounting evidence reveals that both upregulation of ribosome
biogenesis and intrinsic dysfunctions in ribosomes support
increased cancer risk (11). In
addition, a series of epidemiologic observations and
population-based studies has highlighted the importance of the
association between ribosome biogenesis and cancer, including BC
(12,13). In eukaryotes, the assembly of the
ribosomal subunits is facilitated by more than 200 assembly factors
including helicases, ATPases, GTPases, and kinases (14–17).
In the absence of just one of these proteins, ribosome biogenesis
is stalled, and cell growth is terminated even under optimal growth
conditions (18–20). Defects in ribosome assembly and its
regulation underlie many human diseases, including cancer (21,22).
Previous observations have revealed that the upregulation of the
ribosome assembly pathway is a hallmark of human cancers (23).
Ribosome assembly factor partner of NOB1 homolog
(PNO1; Gene ID: 56902) has been revealed to be overexpressed in
colorectal cancer (CRC) cells and associated with poor overall
survival (OS) (24). Knockdown of
PNO1 suppressed CRC growth in vitro and in vivo by
inhibition of ribosome biogenesis and activation of the p53/p21
signaling pathway (24). However,
the role of PNO1 in BC remains largely unknown. To explore the role
of PNO1 in BC, bioinformatics and immunohistochemistry-based tissue
microarray analyses were used to demonstrate that both the mRNA and
protein levels of PNO1 were increased in BC compared to normal
breast tissue. Moreover, the anti-tumorigenic effects of PNO1
knockdown in vitro and in vivo were demonstrated by
determining the cell viability, cell cycle progression, as well as
the expression of relative proteins. The present study provided
further insight into the role of PNO1 in BC and suggest its
potential use as a prognostic/diagnostic marker for BC.
Materials and methods
Bioinformatics analyses
Oncomine, an online cancer microarray database
collecting gene expression array datasets, was queried to assess
PNO1 mRNA expression in BC and noncancerous breast tissues. The
expression of PNO1 in 3 different datasets (25,26)
including the Curtis et al breast cancer dataset, the Zhao
et al breast cancer dataset and The Cancer Genome Atlas
(TCGA), were analyzed and presented using scatter plots in the
present study. Data analysis was performed according to
standardized normalization techniques and statistical calculations
provided by the Oncomine website. The Kaplan-Meier plotter
(www.kmplot.com), containing gene expression data
and survival information of patients with BC, was queried to
analyze the association between PNO1 mRNA expression and survival
of patients with BC, including OS and RFS. The expression of PNO1
among the samples was divided into high or low groups according to
the median expression, and the association of PNO1 expression with
the survival of patients with BC was analyzed using the log-rank
test method.
The R2 application (http://r2.amc.nl)
was used to explore the association between PNO1 expression and RFS
of patients with BC (dataset: Tumor Breast
(Relapse)-Smid-210-MAS5.0-u133p2; GEO ID: GSE29271) using the
log-rank method, and the correlation of PNO1 mRNA expression with
CDK1 and CCNB1 was assessed using the Pearson correlation
method.
To explore the potential prognostic impact of PNO1
in human BC, online analysis through bc-GenExMiner v4.0 (http://bcgenex.ico.unicancer.fr/BC-GEM/GEM-Accueil.php?js=1)
was conducted to compare target gene expression according to
clinical criteria (27,28). The association between PNO1
expression with clinicopathological parameters (including hormonal
receptors, nodal status and other factors) were evaluated.
Reagent and antibodies
Fetal bovine serum (FBS), trypsin-EDTA (0.25%),
Pierce™ BCA Protein Assay kit, FxCycle™ PI/RNase Staining Solution
and Dulbecco's modified Eagle's medium (DMEM) were purchased from
Thermo Fisher Scientific, Inc. L-15 medium containing 80 U/ml
penicillin and 80 µg/ml streptomycin (Nanjing KeyGen Biotech Co.,
Ltd.) was used to culture MDA-MB-231 cells. Western and IP Lysis
Buffer were acquired from Beyotime Institute of Biotechnology.
CCK-8 and antibody for glyceraldehyde 3-phosphate dehydrogenase
(GAPDH; polyclonal; cat. no. ABP57259) were obtained from Abbkine,
Inc. Matrigel was purchased from BD Biosciences. Cyclin B1
polyclonal (product no. 4138S) antibody and β-actin monoclonal
(product no. 4970S) antibody were purchased from Cell Signaling
Technology, Inc. CDK1 monoclonal (product code ab18) antibody was
purchased from Abcam. PNO1 antibodies were purchased from LSBio,
Inc. (polyclonal; cat. no. LS-C179090) and Santa Cruz
Biotechnology, Inc. (monoclonal; cat. no. sc-514727) respectively.
Goat anti-rabbit IgG HRP-conjugated secondary antibody (cat. no.
L3012) and goat anti-mouse HRP-conjugated IgG secondary antibody
(cat. no. L3032) were purchased from Signalway Antibody LLC.
Immunohistochemistry (IHC)-based
tissue microarray
TMA slides containing BC (cat. no. HBreD145Su01;
n=145), or noncancerous adjacent breast tissues (cat. no.
HBre-Duc090Sur-01; n=90) were purchased from Shanghai Outdo Biotech
Company Co., Ltd. The specimens were obtained from Taizhou Hospital
of Zhejiang Province (Zhejiang, China) from January 2001 to July
2013 (approval no. SHYJS-CP-1807007). IHC was performed to detect
PNO1 (dilution 1:500; cat. no. LS-C179090; LSBio, Inc.) expression
in clinical samples, followed by scoring using a grading system
based on staining intensity as previously described (24,29).
Staining intensity was assessed using a four-point scale (0,
undetectable; 1, weak; 2, moderate; 3, strong), while the
percentage of positively stained cells was expressed as one of four
categories (0–25, 26–50, 51–75 and 76–100%). The final score was
calculated as intensity score × percentage area score. The research
was carried out according to the World Medical Association
Declaration of Helsinki.
Cell culture and transduction
Human triple-negative breast cancer (TNBC) cell
lines MDA-MB-231 (cat. no. TCHu227) and HS578T (cat. no. TCHu127)
were purchased from the Cell Bank of the Chinese Academy of
Sciences. MDA-MB-231 cells were maintained in L-15 medium
supplemented with 10% FBS, and incubated at 37°C in a humidified
atmosphere containing 5% CO2. HS578T cells were cultured
in DMEM medium supplemented with 10% FBS and 100 U/ml penicillin,
and 100 µg/ml streptomycin (Hyclone; Cytiva). The cells were
verified using short tandem repeat (STR) genotyping and examined
for Mycoplasma contamination using polymerase chain reaction
(PCR) analysis according to the manufacturer's instructions
(MycoFree™ Mycoplasma detection kit; cat. no. GCMF82801QS; Shanghai
GeneChem, Co., Ltd.). Briefly, the cells were collected and
amplified by PCR, and then the sample was detected by agarose gel
electrophoresis. The sequences of primers are listed in Table SI. The cell line was characterized
by Genetic Testing Biotechnology Corporation using STR markers.
The generation system used was the 2nd and 293T
cells were used as the interim cell line. To infect the plasmid,
293T cells were sub-cultured and seeded into 10-cm plates at a
density of 5×10⁶ cells/15 ml. The medium was replaced
with serum-free medium 2 h before transfection. The DNA solution
including GV vector plasmid 20 µg, pHelper 1.0 carrier plasmid 15
µg, pHelper 2.0 vector plasmid 10 µg and corresponding volume of
transfection reagent were evenly mixed. The total volume was
adjusted to 1 ml and incubated at room temperature for 15 min. The
medium was changed after 6 h of transduction and 10 ml PBS was
added once. Subsequently, 20 ml fresh medium was added and the
cells were incubated at 37°C in a humidified atmosphere containing
5% CO2 for an additional 48–72 h. For cell transduction,
MDA-MB-231 and HS578T cells were sub-cultured and seeded into
12-well plates at a density of 0.4×10⁵ cells/well, and
cultured overnight. Equivalent lentivirus coding short hairpin
(sh)RNA targeting PNO1 (LV-PNO1-RNAi (14768): GIDL74453) or sh-Ctrl
(CON053; hU6-MCS-CMV-EGFP: GCPL0169334; both from Shanghai GeneChem
Co., Ltd.) was added at a multiplicity of infection (MOI) of 10.
The double-stranded shRNAs for PNO1 are presented in Table SII. The medium was changed after
12 h of transduction and fresh medium was added. Cells were
incubated at 37°C in a humidified atmosphere containing 5%
CO2 for an additional 60 h before experiments were
performed.
Cell confluence observation and cell
number counting
The confluence of transduced cells was observed
using light microscope (Leica Microsystems GmbH) and the
representative images were obtained at a magnification of ×200. The
cells were then collected and the number of cells was calculated
after staining with 0.4% Trypan blue for 3 min at room temperature
using Countstar Automatic Cell Counting Apparatus (Shanghai ALIT
Life Science).
Proliferation assay
At the end of the transduction, cells were reseeded
in 96-well plates at a density of 0.2×10⁴ cells/well and
cultured at 37°C in a 5% CO2 humidified incubator. Cell
viability was examined at 24, 48, 72, 96 or 120 h using CCK-8 assay
(Abbkine, Inc.). Briefly, 10 µl of CCK-8 was added to each well,
and plates were incubated for an additional 2 h at 37°C, followed
by the measurement of the absorbance at 450 nm using an Infinite
200 Pro microplate reader (Tecan Group, Ltd.). The cell viability
of both sh-Ctrl and sh-PNO1 on day 1 were set as 1 and the cell
viability changes were present as the fold change relative to day
1.
Colony formation assay
The transduced cells were collected and reseeded in
12-well plates at a density of 500 cells/well. Cells were cultured
for 12 days at 37°C in a 5% CO2 humidified incubator.
Culture medium was changed every 3 days. Colonies were fixed using
formaldehyde (4%) for 20 min at room temperature and stained using
crystal violet (0.01%) for 20 min at room temperature. The number
of colonies was counted manually and relative change in colony
formation was determined.
Cell cycle analysis
Transduced MDA-MB-231 cells at a density of
1.0×10⁵ cells/well were fixed with 70% ethanol at 4°C
for 12–16 h. After washing with phosphate-buffered saline (PBS;
Hyclone; Cytiva), cells were incubated with FxCycle PI/RNase
Staining Solution for 30 min at room temperature, followed by
analysis with FACSCaliber (BD Biosciences). The percentages of
cells at different phases were analyzed using ModfitLT (version
3.0) (Verity Software House, Inc.).
In vivo xenograft assay
Male nude mice (4–6 weeks of age; 18–20 g) were
purchased from Shanghai SLAC Laboratory Animal Co., Ltd. Transduced
cells (1×10⁶; sh-PNO1 or sh-Ctrl) in a total volume of
100 µl of PBS containing 50% Matrigel were injected subcutaneously
into opposite flanks of individual mice (a total mice of n=6). The
tumor volume was measured and recorded every 3 days from the 5th
day after injection for a total of 43 days. The tumor volume was
calculated with the following formula: V=L × W2/2. In
order to observe whether the tumor affected the health status and
weight of the mice, the behavior and health status of the mice were
monitored every other day, and the mice were weighed every 3 days.
The growth rate and volume of the tumor were observed, and whether
the tumor was damaged and ulcerated was ascertained. The experiment
would be terminated in advance when the tumor weight exceeded 10%
of the body weight of the mouse, or the maximum diameter of the
tumor of a 25-g mice exceeded 20 mm, or the animal was agitated or
anxious, or the tumor was ulcerated or damaged. In our study, the
experiment was terminated when the tumor volume reached 400–700
mm3. At the end of the experiment, mice were
anesthetized with an induction dose of 2% isoflurane and a
maintenance dose of 1.5% isoflurane and tumor images were captured
using an IVIS Spectrum live-animal imaging system (PerkinElmer,
Inc.). After inhaling the induction and maintenance dose of 2%
isoflurane into deep anesthesia, the mice (n=6) were then
sacrificed by cervical dislocation. Confirmation of sacrifice was
performed by verifying whether their heartbeat had stopped and
their pupils were dilated, and then tumor tissues were collected
and images were captured. All mice were housed in a pathogen-free
environment with controlled temperature (22–26°C), humidity
(50–60%) and a 12-h light/dark cycle with ad libitum access
to food and water. Animal care and experiments were performed in
strict accordance with the ‘Guide for the Care and Use of
Laboratory Animals’ of the National Research Council and the
‘Principles for the Utilization and Care of Vertebrate Animals’ of
the National Institutes of Health and was approved (approval no.
2018-032) by the Animal Ethics Committee of Fujian University of
Traditional Chinese Medicine (Fuzhou, China).
Western blot analysis
The transduced cells were collected and washed twice
with PBS, and then lysed with 30–70 µl of lysis buffer supplemented
with protease and phosphatase inhibitors. Protein concentration was
determined by the BCA Protein assay. A total of 50 µg of protein
was subjected to sodium dodecyl sulfate polyacrylamide gel
electrophoresis (10%) and then transferred onto a polyvinylidene
fluoride membrane (EMD Millipore). The resulting membrane was
blocked using 5% milk in TBST buffer for 2 h at room temperature,
and then incubated with primary antibodies PNO1, cyclin B1, CDK1,
β-actin (all diluted 1:1,000), or GAPDH (dilution, 1:5,000)
overnight at 4°C, followed by incubation with secondary antibody
(dilution, 1:5,000) for 2 h at room temperature. GAPDH or β-actin
protein levels were used as a loading control. The protein bands
were detected with a chemiluminescence kit (Abbkine, Inc.) using
the Bio-Rad Chemi Doc XRS imaging system (Bio-Rad Laboratories,
Inc.) and band intensities were quantified using ImageJ software
(1.51j8; National Institutes of Health). The expression of GAPDH or
β-actin was used as an internal control. The levels of the
aforementioned proteins were calculated relative to the levels in
sh-Ctrl cells, which was set as 1.00.
Statistics analysis
Experiments were performed at least in triplicate
and data were presented as the mean ± standard deviation.
Statistical analyses between groups were performed using the
independent Student's t-test in SPSS 20.0 (IBM Corp.). P<0.05
(two sided) was considered to indicate a statistically significant
difference.
Results
PNO1 is overexpressed at the mRNA and
protein levels in BC
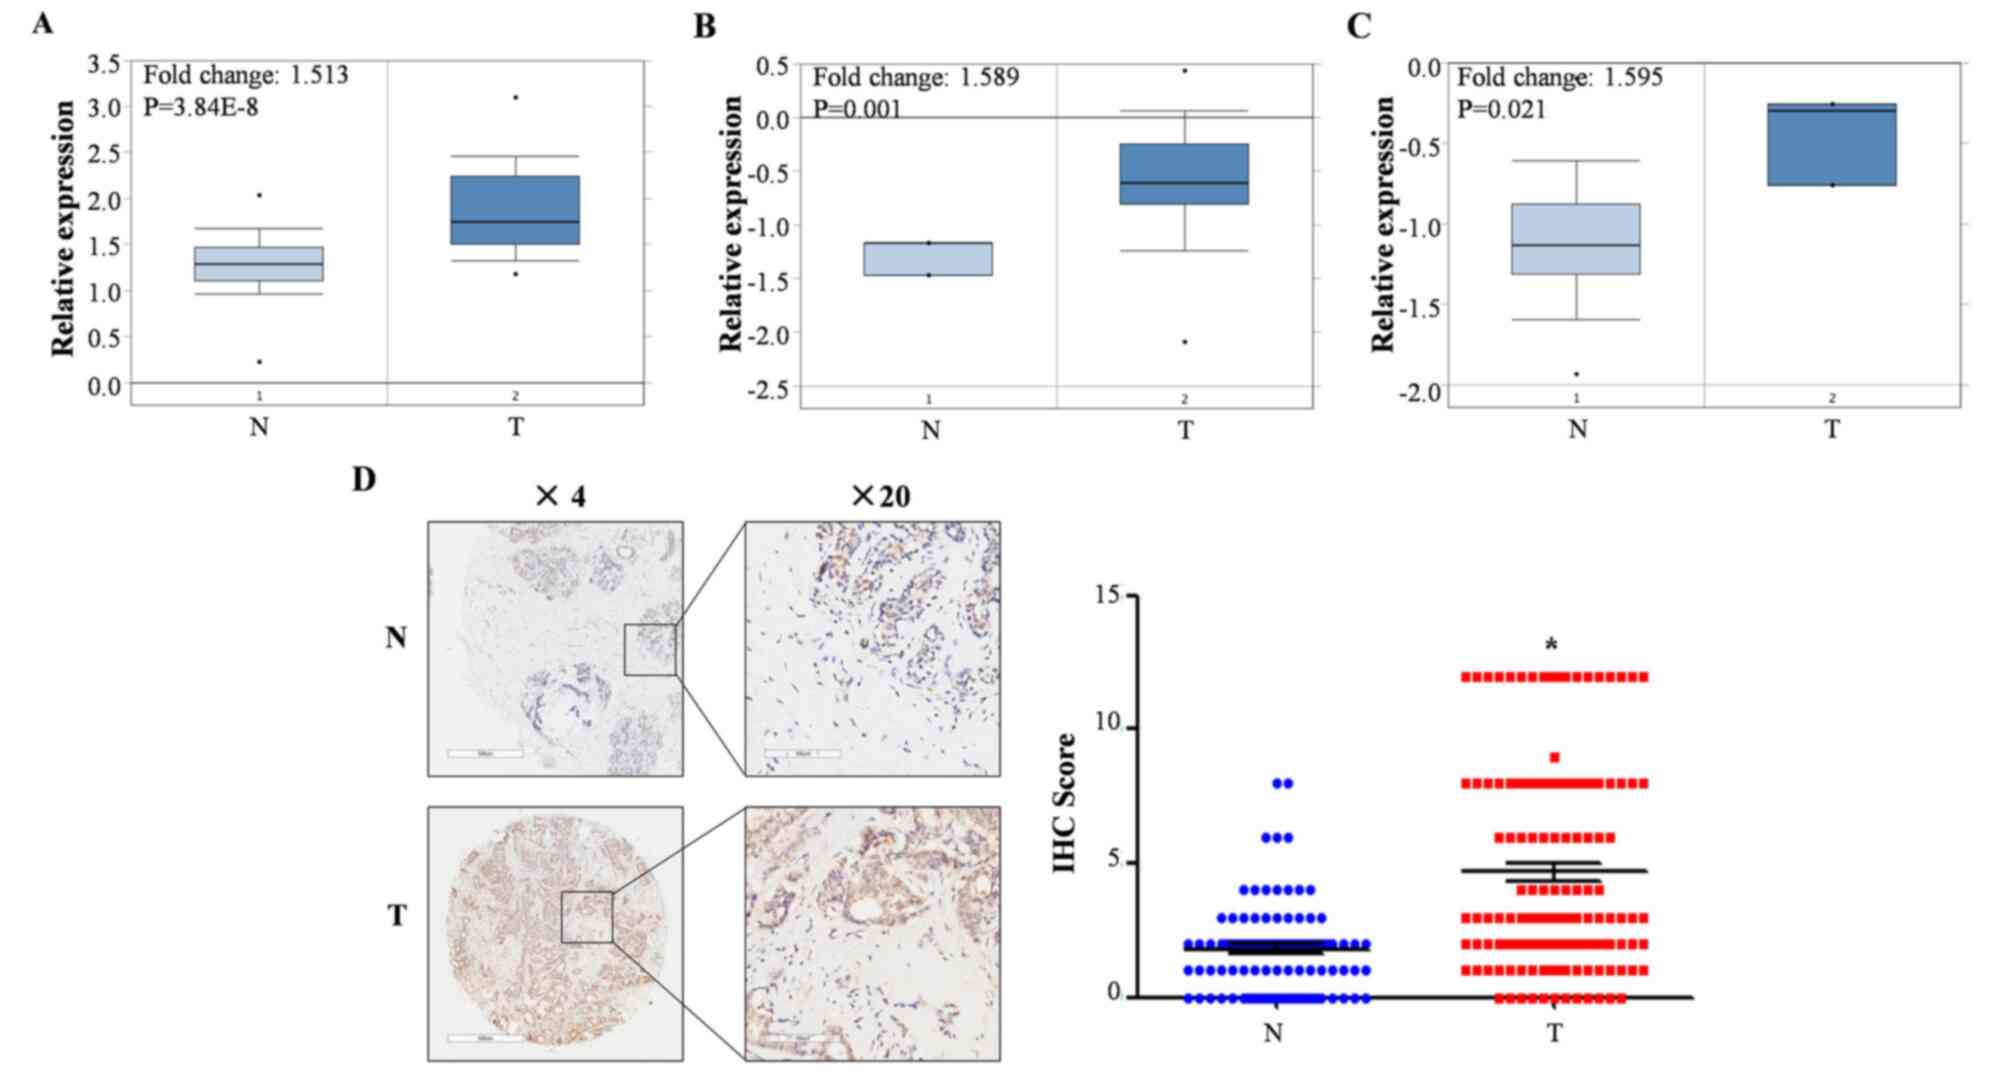
Analysis of PNO1 mRNA expression in breast cancer
using Oncomine demonstrated that the mRNA expression of PNO1 in BC
was significantly upregulated compared to non-cancerous adjacent
breast tissues (Fig. 1A-C;
P<0.05). IHC-based detection of PNO1 protein expression in BC
(n=145) and non-cancerous breast tissues (n=90) demonstrated that
the protein levels of PNO1 were significantly upregulated in BC
(Fig. 1D; P<0.05).
Clinicopathological characteristics of patients are summarized in
Table SIII and revealed that no
clinicopathological characteristics of the patients were
significantly associated with PNO1 expression. These findings
indicated that PNO1 was overexpressed at both the mRNA and protein
levels of BC tissues.
High PNO1 expression predicts
progression and shorter survival in patients with BC
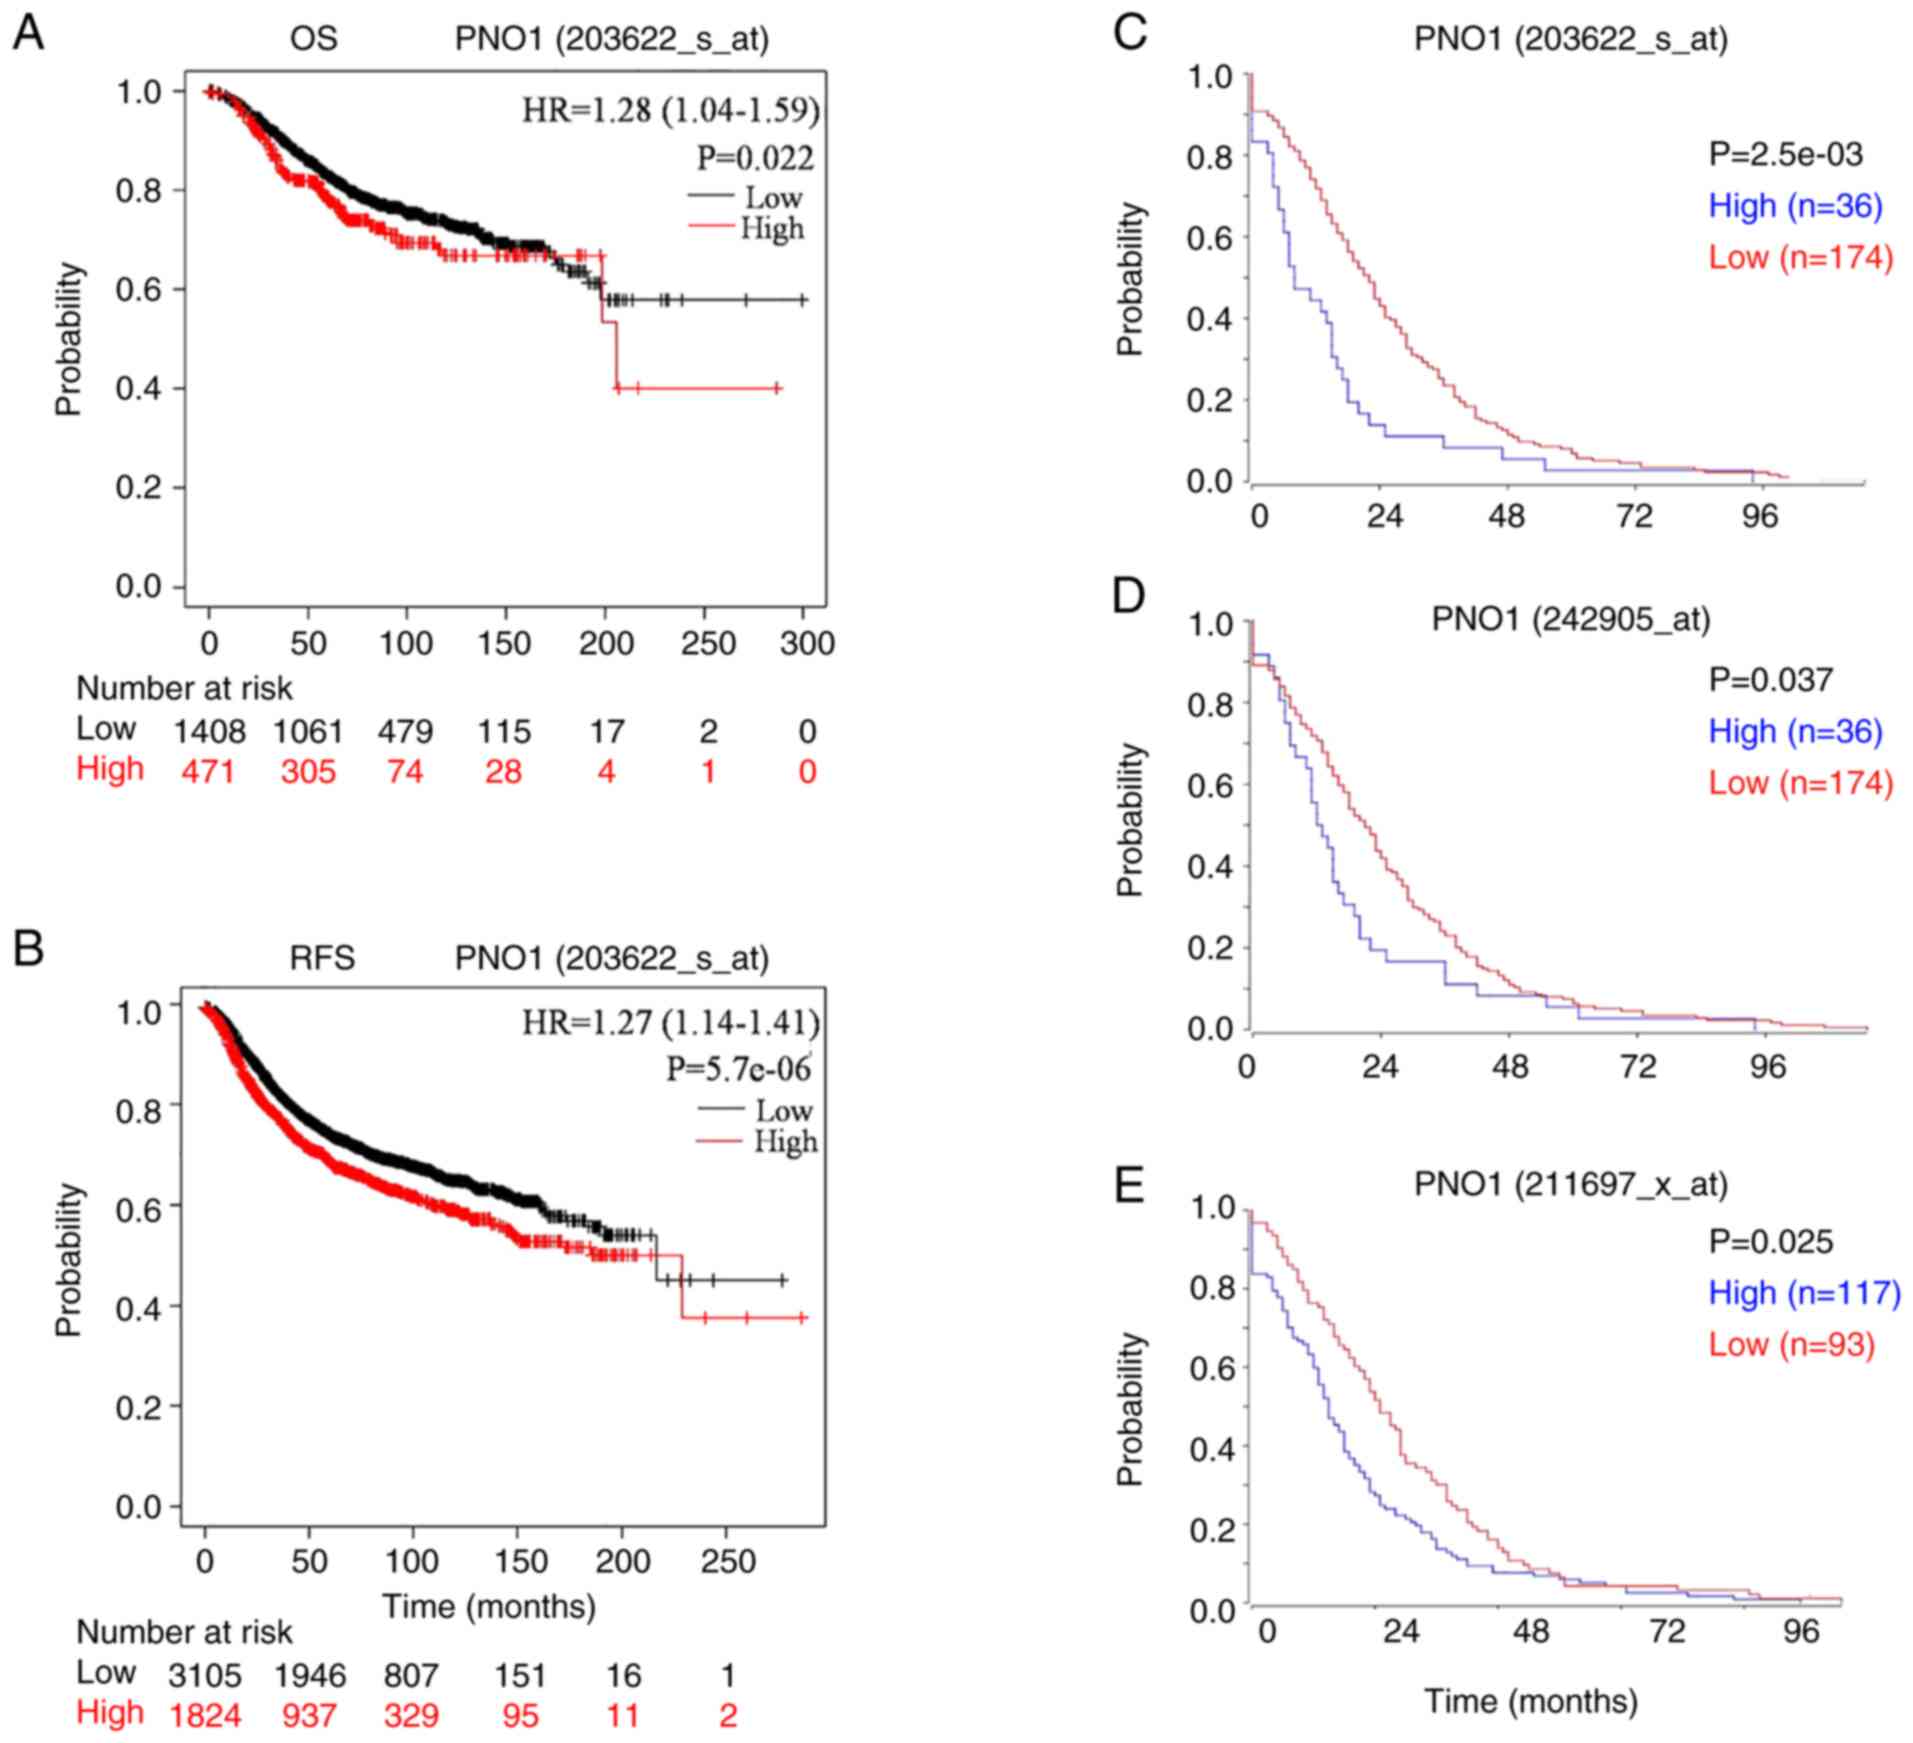
Next, the association between mRNA expression of
PNO1 and survival of patients with BC was investigated. High mRNA
expression of PNO1 in BC tissues was significantly associated with
reduced OS and RFS in patients with BC (Fig. 2A and B; P<0.05), which was
consistent with the analyses of RFS using R2 application (Fig. 2C-E). Correlation analyses of PNO1
mRNA expression with various clinicopathological parameters were
performed using bc-GenExMiner. As revealed in Fig. 3A, there were no obvious differences
in PNO1 expression between patients >51 and ≤51 years old. In
terms of nodal status in patients with BC, PNO1 expression was
higher in those with positive nodal status compared to negative
nodal status (Fig. 3B; P<0.05).
Correlation between the progesterone receptor (PR) and estrogen
receptor (ER) statuses of patients with BC revealed lower PNO1
expression in patients both with positive PR (Fig. 3C; P<0.05) and ER (Fig. 3D; P<0.05) status, while there
was no significant difference between patients with human epidermal
growth factor receptor 2 (HER2)− and HER2+ BC
(Fig. 3E; P>0.05). Moreover,
the present study revealed that PNO1 expression was significantly
increased in patients with TNBC (Fig.
3F; P<0.001). Analyses also found that PNO1 expression was
higher in patients with basal-like BC (Fig. 3G; P<0.05). With regard to
Nottingham prognostic index (NPI) grade and Scarff-Bloom-Richardson
(SBR) grading, it was determined that PNO1 expression was higher in
advanced NPI grades (Fig. 3H; NPI2
and NPI3, both P<0.05, vs. NPI1) and SBR grades (Fig. 3I; SBR2 vs. SBR1, SBR3 vs. SBR1,
SBR3 vs. SBR2, all comparisons P<0.05). These findings indicated
that high PNO1 expression was correlated with progression of cancer
in patients with BC.
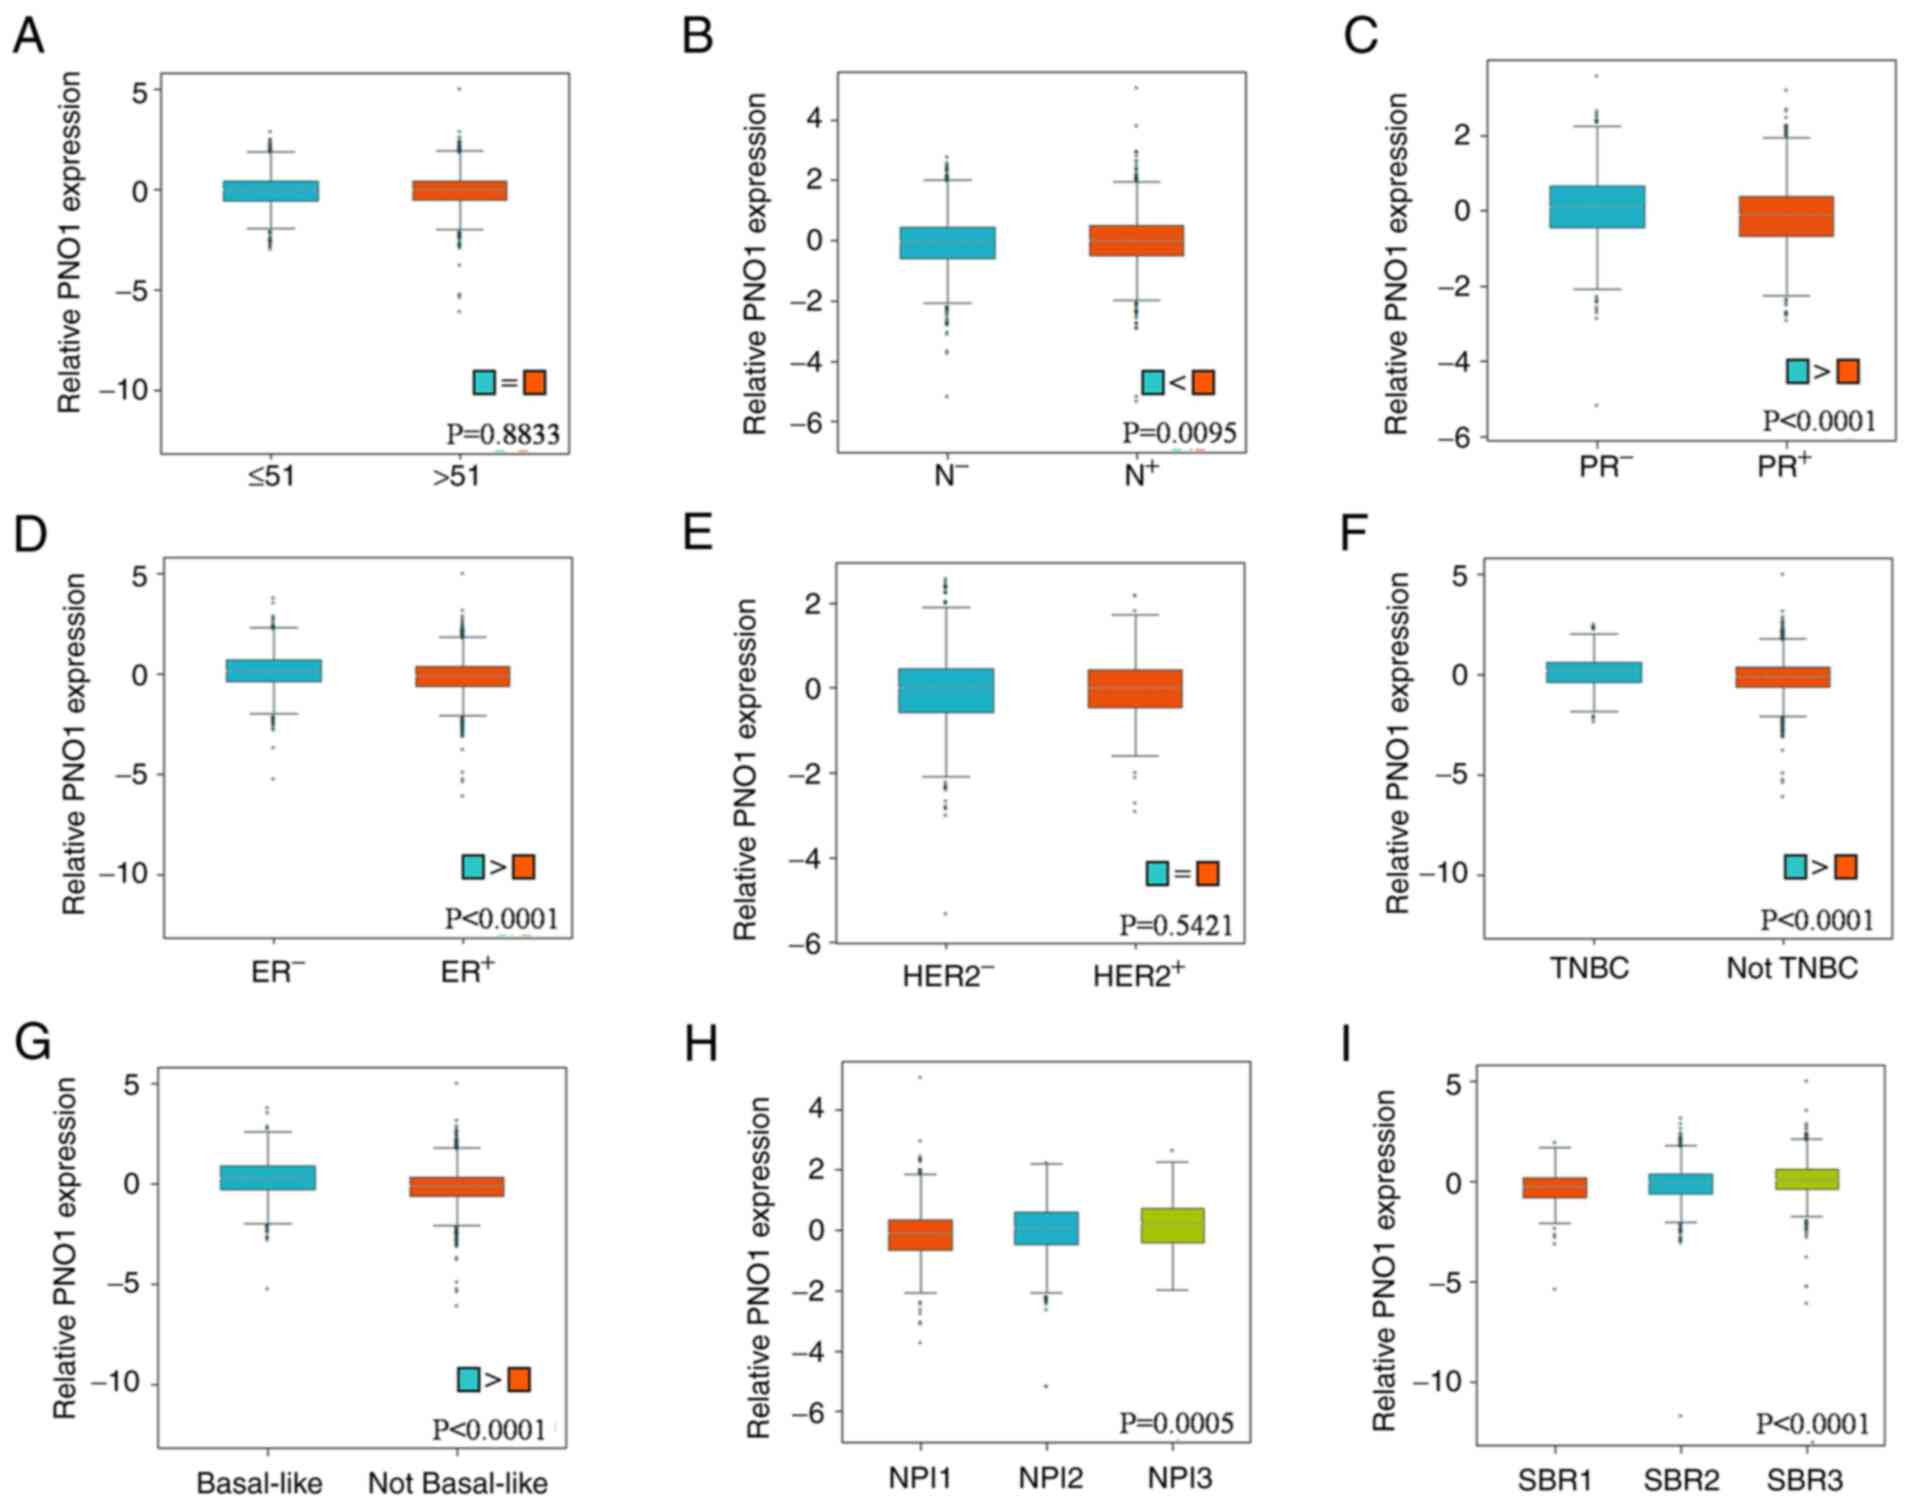 | Figure 3.Correlation of PNO1 with
clinicopathological parameters in BC patient tissues. Bc-GenExMiner
was used to analyze the correlation of PNO1 with (A) age
(P>0.05), (B) nodal status (P<0.05), (C) PR status
(P<0.05), (D) ER status (P<0.05), (E) HER2 status
(P>0.05), (F) TNBC status (P<0.05), (G) basal-like status
(P<0.05), (H) NPI status (P<0.05 for NPI2 vs. NPI1 and NPI3
vs. NPI1) and (I) SBR (P<0.05 for SBR2 vs. SBR1, SBR3 vs. SBR1,
and SBR3 vs. SBR2) based on PNO1 mRNA expression in BC tissues.
PNO1, partner of NOB1 homolog; BC, breast cancer; PR, progesterone
receptor; ER, estrogen receptor; HER2, human epidermal growth
factor receptor 2; TNBC, triple-negative breast cancer; NPI,
Nottingham prognostic index; SBR, Scarff-Bloom-Richardson. |
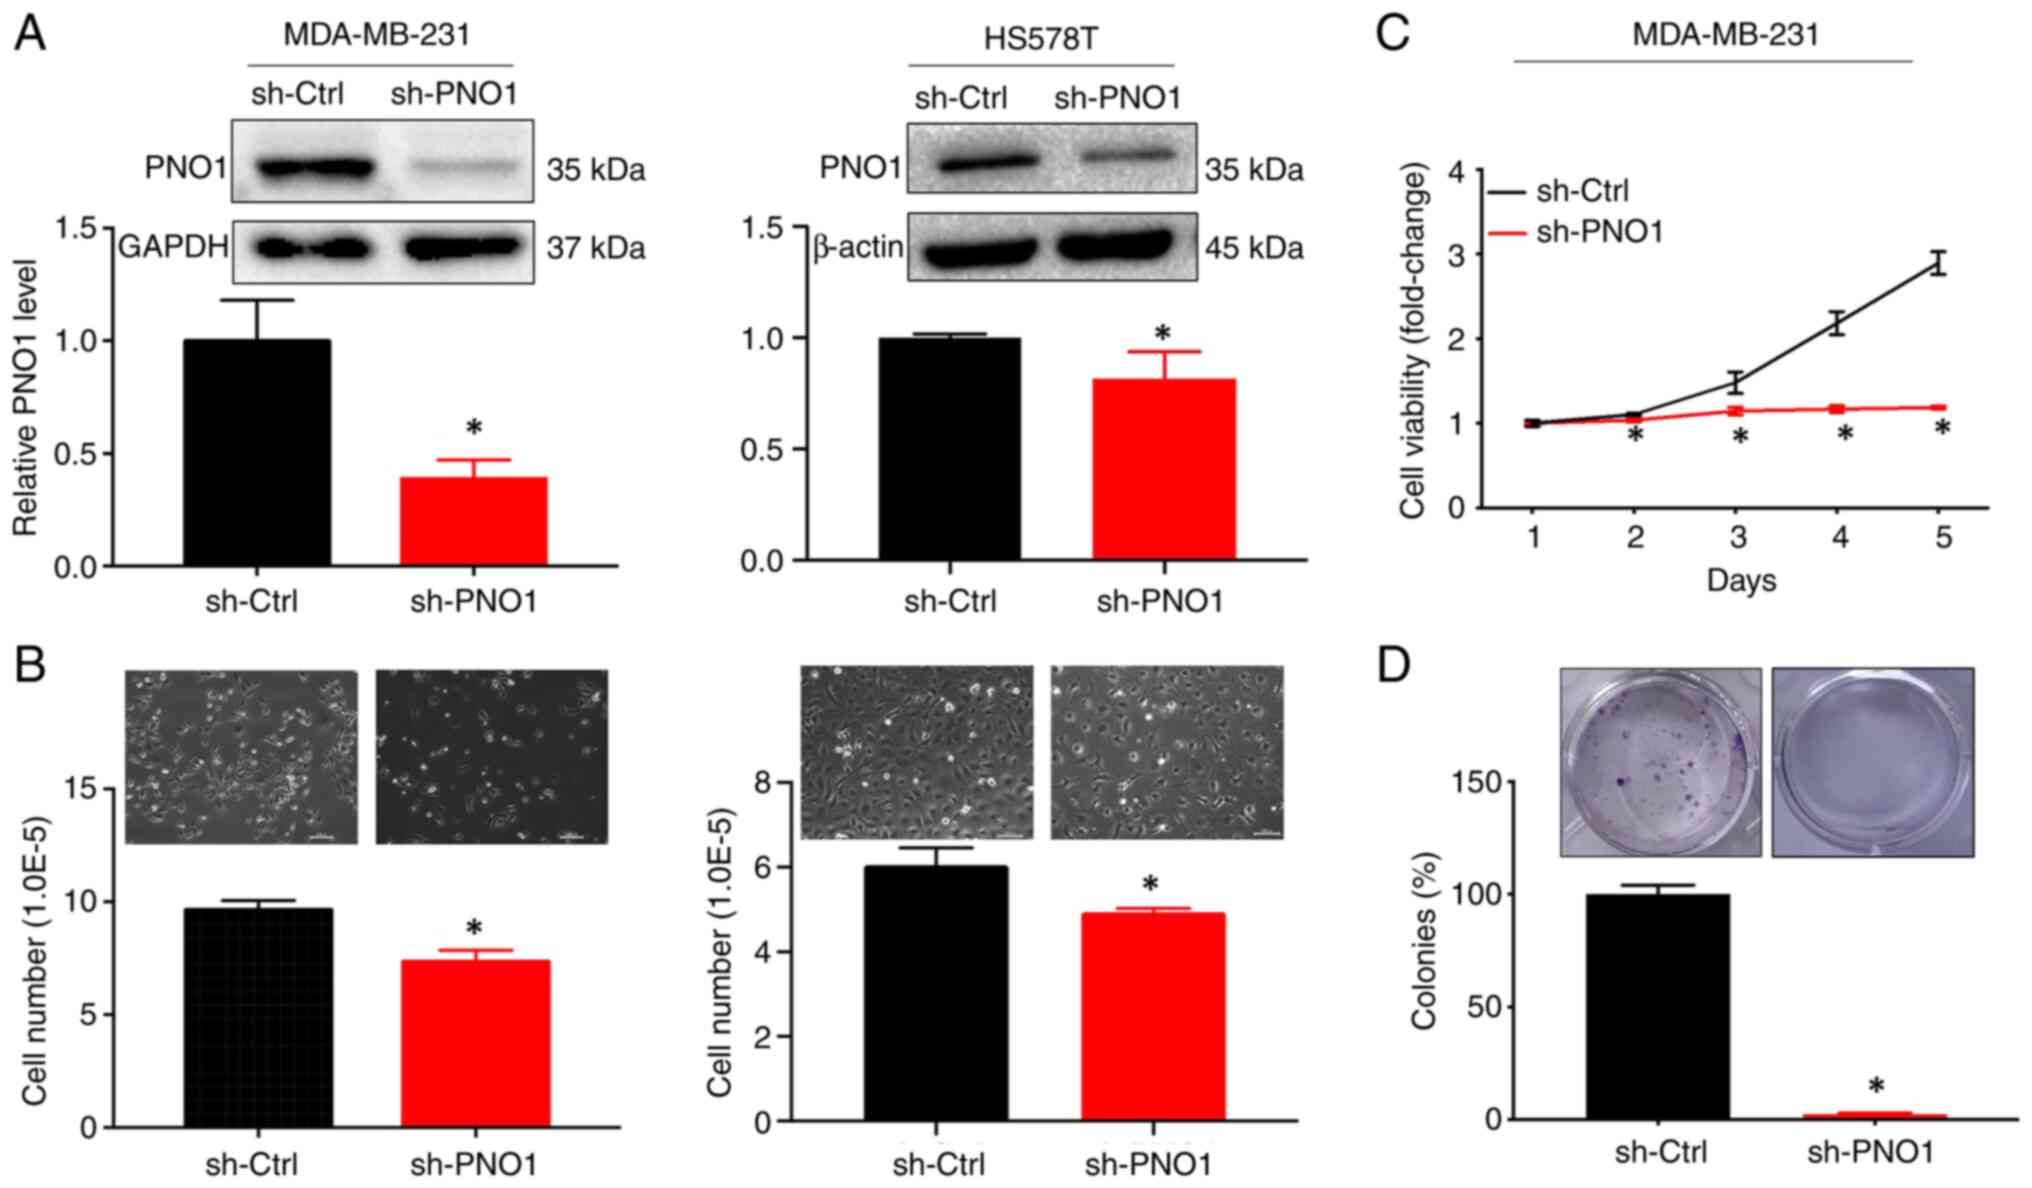
PNO1 knockdown suppresses BC cell
growth in vitro in vivo
The biological and functional role of PNO1 in BC
through manipulation of gene expression, was next investigated.
After knocking down PNO1 expression in human BC MDA-MB-231 and
HS578T cells via shRNA-PNO1 lentivirus transduction (Fig. 4A; P<0.05), observation of cell
growth by microscopy and cell number counting revealed that PNO1
knockdown significantly reduced cell confluence and the number of
cells, in both MDA-MB-231 and HS578T cells (Fig. 4B; P<0.05). Further determination
of cell viability by CCK-8 assay and cell survival by colony
formation assay indicated that PNO1 knockdown significantly
decreased cell viability (Fig. 4C;
P<0.05) and the survival rate of BC cells (Fig. 4D; P<0.05).
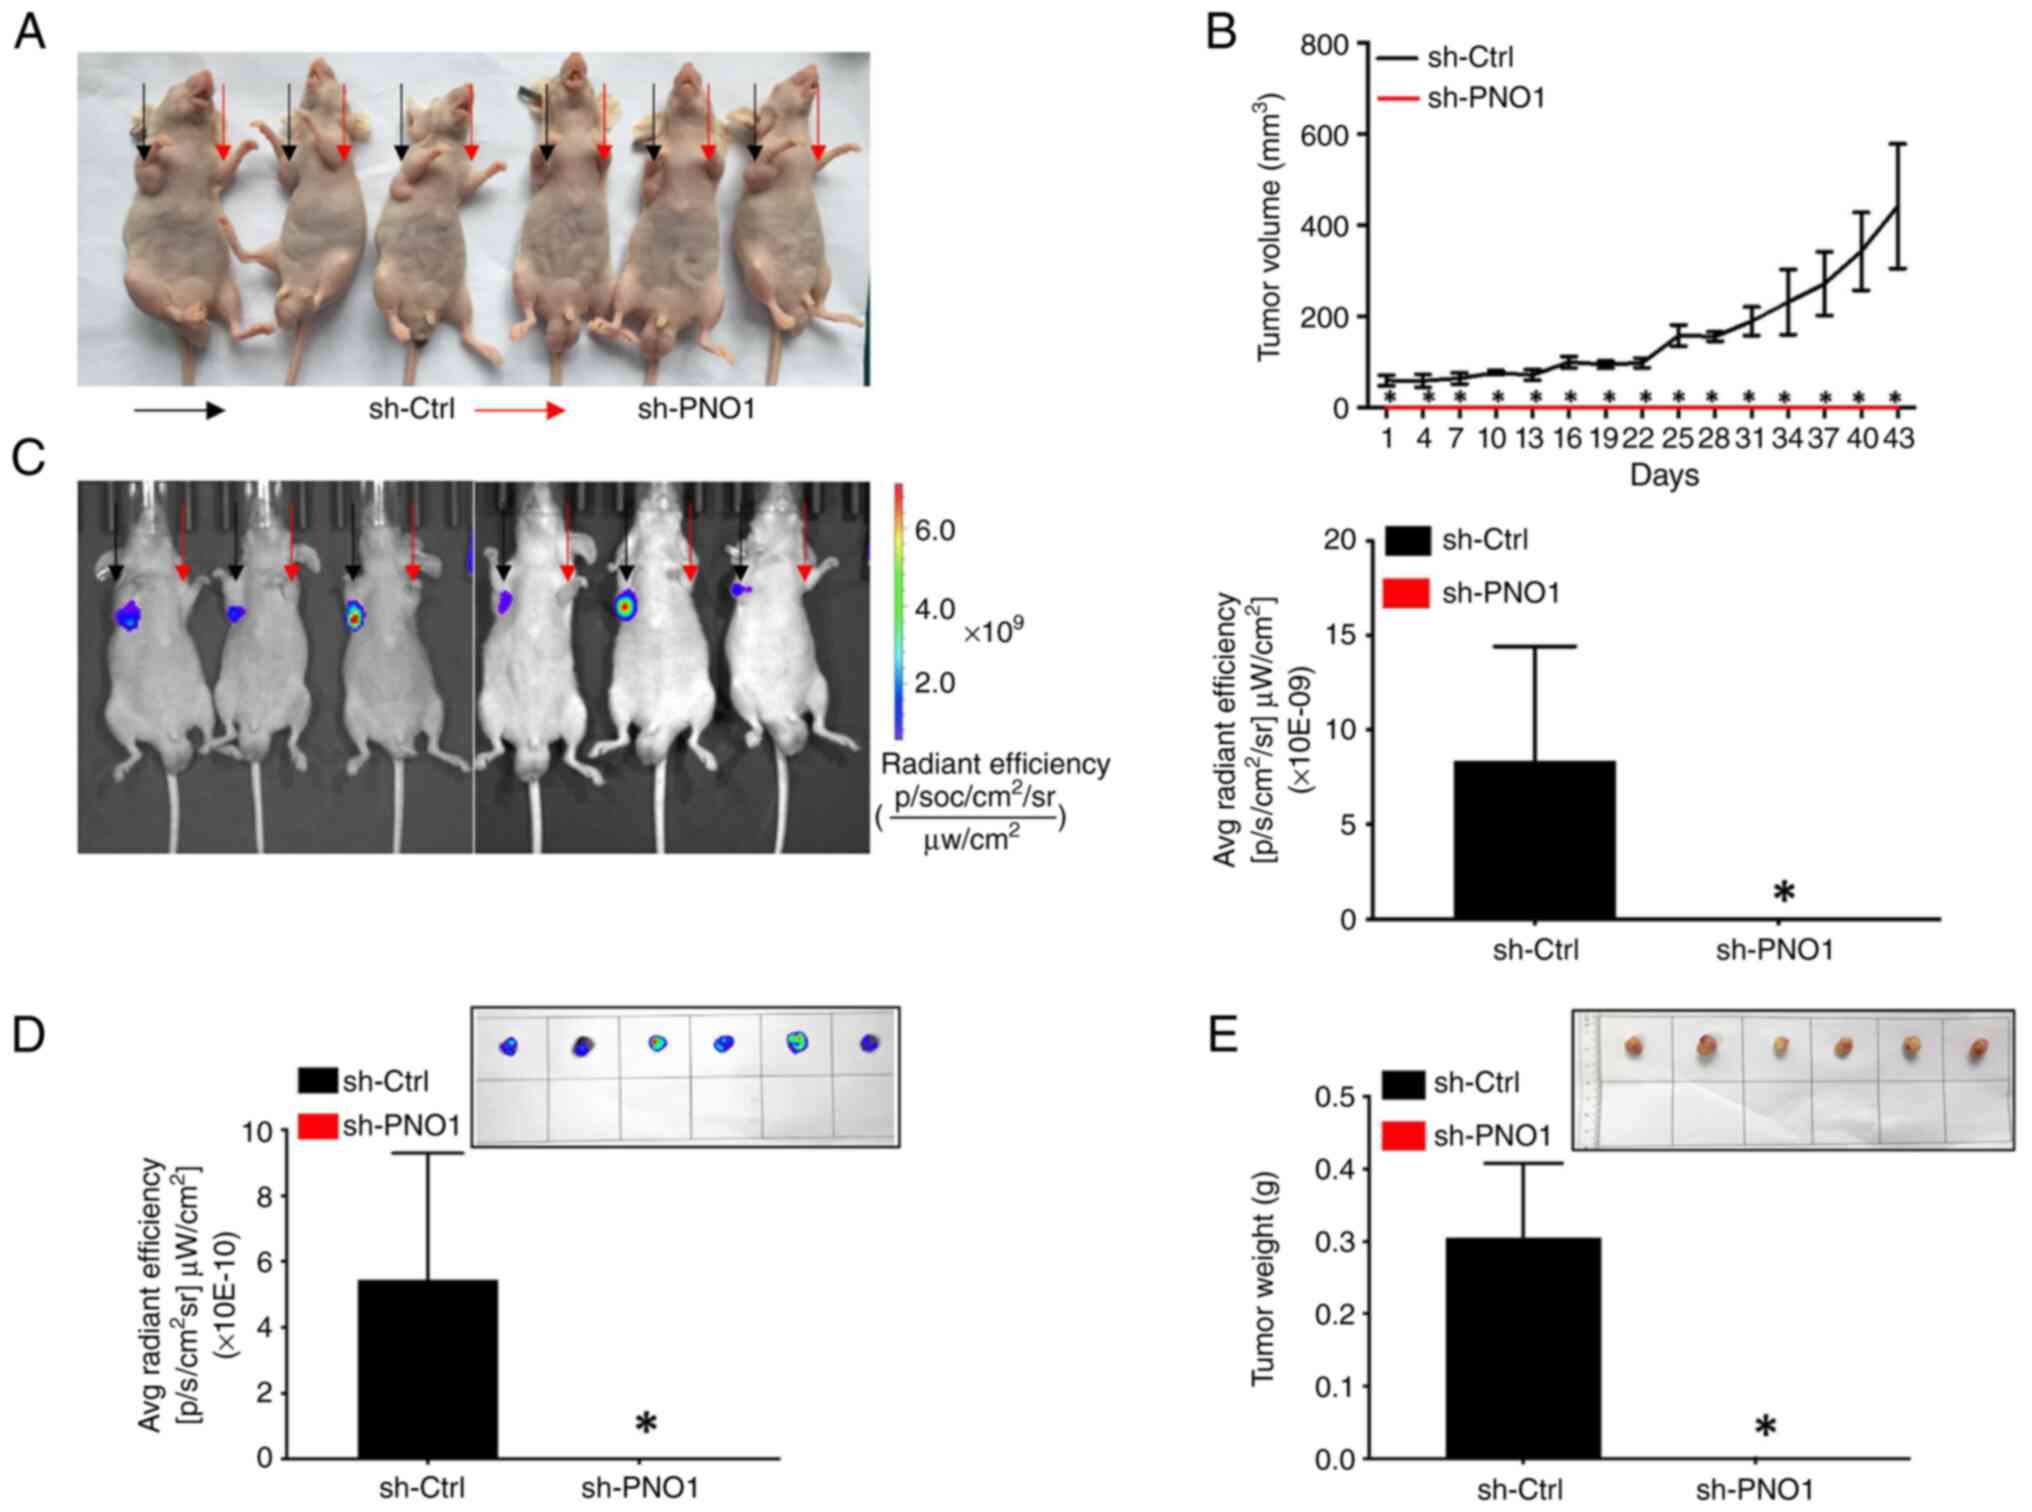
The present study further assessed the biological
function of PNO1 knockdown on tumor growth in vivo. During
the experiment, no significant weight loss, tension, anxiety of
mice or injury, or ulcer of tumor tissues was observed. Observation
of tumors using an IVIS Spectrum whole live-animal imaging system,
tumor volume measurements, endpoint determination of the tumor
weight, and analysis of the intertumoral GFP fluorescence intensity
of tumor tissues revealed that PNO1 knockdown in MDA-MB-231 cells
attenuated tumor growth (Fig. 5A),
significantly reduced the tumor volume (Fig. 5B), GFP fluorescence intensity
(Fig. 5C and D), as well as tumor
weight (Fig. 5E) in a xenograft
nude mouse model (P<0.05 for all comparisons). Collectively,
these findings demonstrated that PNO1 knockdown suppressed tumor
growth of BC cells in vivo.
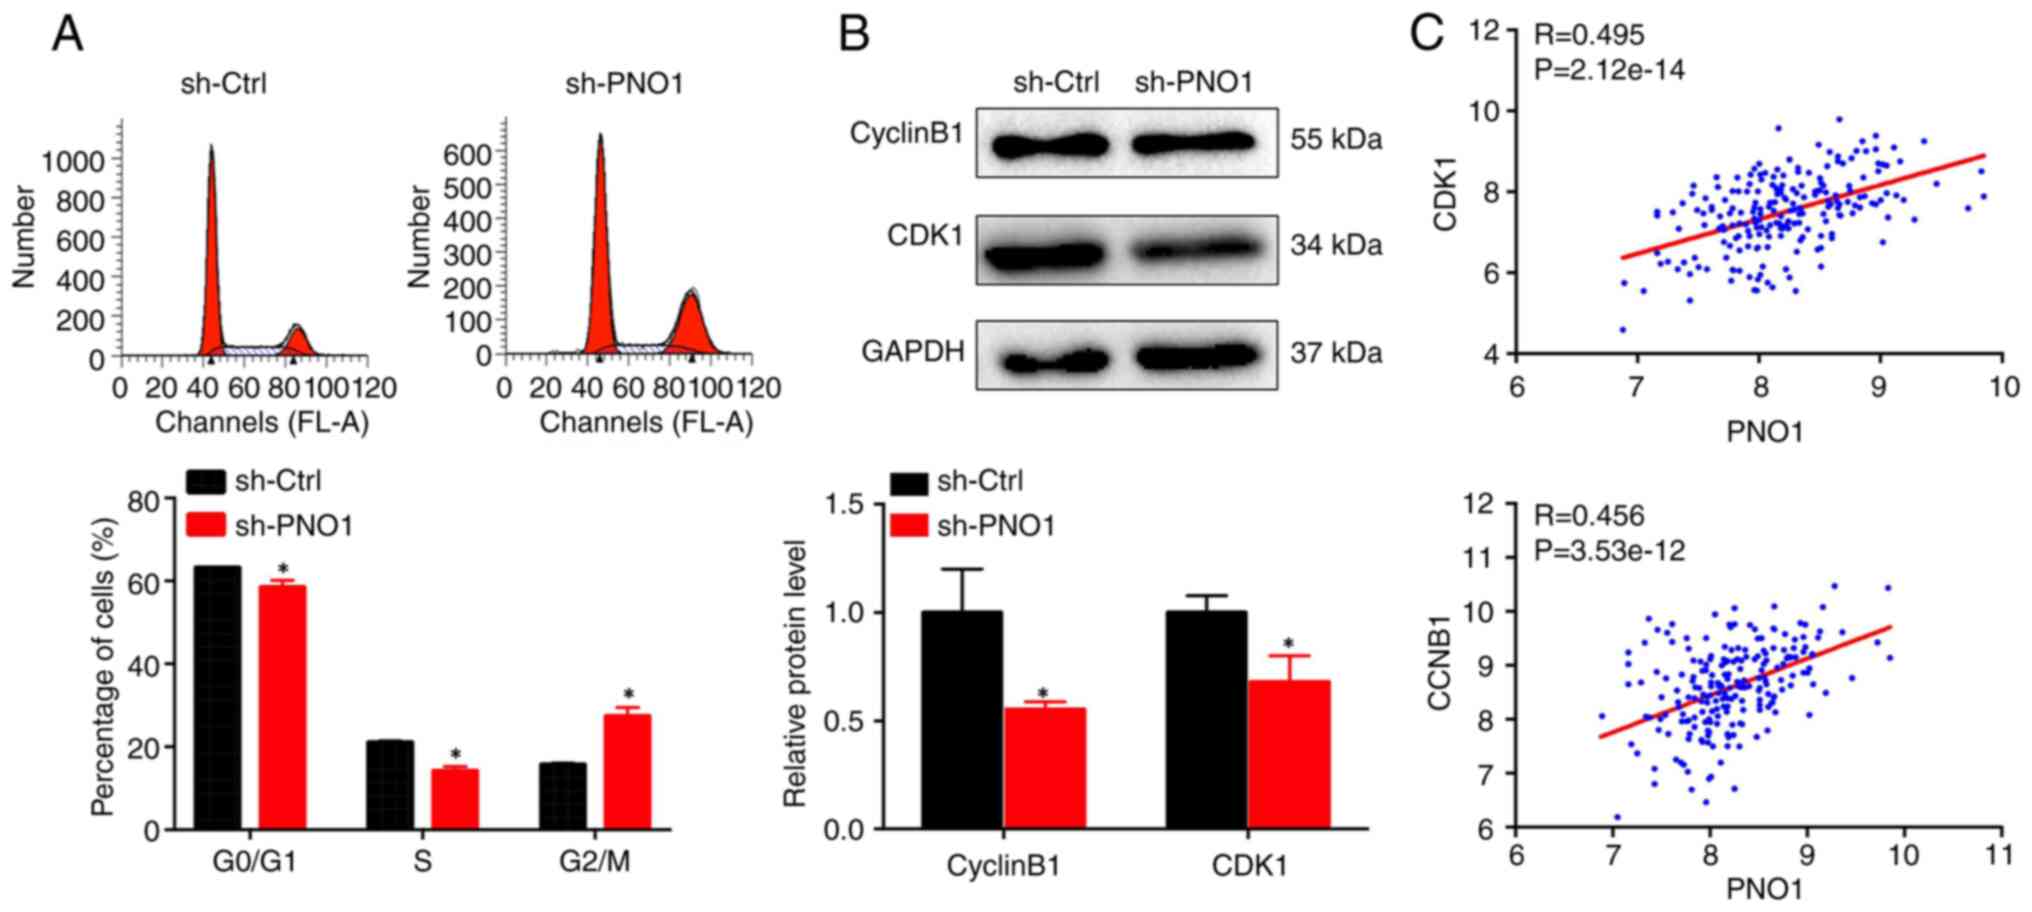
PNO1 knockdown suppresses cell
proliferation by downregulating cyclin B1 and CDK1
The effect of PNO1 on the BC cell cycle was
investigated using PI staining followed by FACS analysis. As
revealed in Fig. 6A, PNO1
knockdown significantly reduced the percentage of cells in both
G0/G1 and S phases, while increasing the percentage of cells in the
G2/M phase in MDA-MB-231 cells, suggesting that PNO1 knockdown
arrests BC cell cycle progression at the G2/M phase. Further
determination of the expression of G2/M-related proteins using
western blot analysis indicated that PNO1 knockdown downregulated
the expression of CDK1 and cyclin B1 (Fig. 6B; P<0.05). Correlation analysis
of PNO1 indicated that its expression in BC was positively
correlated with both CDK1 and CCNB1 at the mRNA level (Fig. 6C; P<0.05). These data indicated
that the anti-proliferative effect of PNO1 knockdown was due to
G2/M arrest via downregulation of CDK1 and cyclin B1
expression.
Discussion
The present study provided evidence for the
essential role of PNO1 in BC. Database analysis and verification by
IHC revealed that PNO1 expression was significantly increased in BC
tissues at both the mRNA and protein levels when compared to
non-cancerous breast tissues. Survival and clinicopathological
analyses demonstrated that increased PNO1 was associated with
shorter OS, RFS and multiple advanced clinical characteristics.
Functional and mechanistic studies indicated that PNO1 knockdown
suppressed BC cell growth in vitro and in vivo by
inhibiting the proliferation of BC cells, which likely occurred via
downregulation of CDK1 and cyclin B1 expression mediating
G2/M-phase cell cycle arrest.
Recently, more than 200 ribosome assembly factors
have been identified, some of which have been demonstrated to be
hallmarks of cancers and play an essential role in uncontrolled
proliferation of cancer cells, including NOB1 and RIO1 (30,31).
Similar to these assembly factors, our previous data showed that
PNO1 was critical for ribosome biogenesis in CRC cells (24), involved in tumor growth and
progression of CRC by regulating the p53 signaling pathway. In the
present study, focus was on verifying the clinical significance and
function of PNO1 in BC. As expected, the expression of PNO1 was
increased in BC tissues at both the mRNA and protein levels. Based
on the expression of PNO1 in BC tissues, the correlation between
its mRNA expression and clinical stage was analyzed. Unfortunately,
significant differences between stages I–II and III–IV, were not
obtained. The expression of PNO1 in different types of BC tissues
will be further addressed in our future study. Therefore, qPCR or
western blot analyses will be further used to verify the expression
of PNO1 in BC tissues after enough clinical samples from patients
with BC are gathered.
Based on the high expression of PNO1 in BC tissues,
the association between PNO1 expression and survival of patients
with BC was further analyzed. The survival analysis demonstrated
that increased PNO1 mRNA expression was significantly associated
with shorter OS and RFS in patients with BC, which provided further
evidence of the role of PNO1 in BC progression. However, an
association between PNO1 protein expression and survival of
patients with BC (data not shown) was not found, which may be due
to limitations in the number of clinical samples. Furthermore, the
correlation between PNO1 mRNA expression with various
clinicopathological parameters was analyzed and it was determined
that high PNO1 expression was correlated with lymph node
metastasis, negative PR and ER, basal-like or TNBC status, and
advanced SBR and NPI grades. The present study also analyzed the
association between PNO1 protein expression and clinical
characteristics of patients with BC based on its expression in BC
tissues. Unfortunately, no significant association between PNO1
protein expression and all clinical characteristics was revealed,
which may due to the limitations in the number of clinical samples.
These findings provide further support for the oncogenic role of
PNO1 and the possibility of using PNO1 as a biomarker for
progression of BC.
Uncontrolled proliferation of cancer cells requires
extensive protein synthesis and thus increased ribosome biogenesis
(32). Therefore, the functional
role of PNO1 in tumor growth was explored. Consistent with our
previous study on CRC (18), PNO1
knockdown suppressed BC cell growth in vitro and in
vivo. However, in a future study the suppressive effect of PNO1
knockdown on tumor growth in vivo will be verified using
female nude mice, instead of male mice. Further determination of
cell proliferation indicated that PNO1 knockdown attenuated cell
viability and colony formation in BC cells. Our previous study
found that PNO1 knockdown increased the percentage of CRC cells at
G0/G1 phase (24). Unexpectedly,
in the present study, PNO1 knockdown arrested BC cells in the G2/M
phase, which may be due to variation in the status of cell cycle
checkpoint regulators between cancer types or cell lines. In fact,
the expression of G2/M-phase-related proteins was further detected
and it was revealed that PNO1 knockdown downregulated CDK1 and
cyclin B1 protein expression in BC cells. Moreover, PNO1 expression
was positively correlated with both CDK1 and CCNB1 gene expression
in patient tissue. Further studies should assess the underlying
mechanisms involved in cell cycle differences between BC and CRC
after PNO1 knockdown. Moreover, the role of PNO1 in different tumor
types (BC and CRC, etc.) warrants further investigation. However,
due to low expression of PNO1 in normal cells, the effect of PNO1
knockdown on cell proliferation was not detected. The effects of
PNO1 knockdown and overexpression in normal cells will be verified
in our future study. Furthermore, the roles of PNO1 overexpression
on cell proliferation in vitro and in vivo and PNO1
knockdown on cell apoptosis of BC cells, as well as its underlying
mechanisms should be further addressed in a future study.
In summary, the present study revealed that PNO1
expression was overexpressed in BC tissues compared with
noncancerous breast tissue, and high PNO1 expression was
significantly associated with poor prognosis and progression of
cancer in patients with BC. Our present study also demonstrated
that PNO1 knockdown suppressed tumor growth in vivo and
in vitro by inhibiting cell proliferation which was likely
mediated by downregulation of CDK1 and cyclin B1 expression. The
present study highlights the clinical significance and biological
function of PNO1 in BC, suggesting that PNO1 may serve as a
potential biomarker or therapeutic target for BC.
Supplementary Material
Supporting Data
Acknowledgements
Not applicable.
Funding
This work was supported by the National Natural Science
Foundation of China under grant nos. 81803882, 81673721 and
81703913, the International Cooperative Project of Fujian
Department of Science and Technology under grant no. 2017I0007, the
Natural Science Foundation of Fujian Province under grant no.
2017J01846, and the 100 Talents Program of Fujian Province
(2018).
Availability of data and materials
The datasets used and/or analyzed during the current
study are available from the corresponding author on reasonable
request.
Authors' contributions
AS and JP conceived and designed the experiments, as
well as confirm the authenticity of all the raw data. JL, YoC, LL,
MW and NW conducted the bioinformatics analysis and
immunohistochemistry-based tissue microarray analysis. JL, LL, YoC,
XL and ZS conducted the cell culture, Cell Counting Kit-8 assay and
colony formation assay. YoC, MW and YH conducted the cell cycle
analysis. JL, XW, YiC, XiaC and XiC performed the animal
experiments and analysis. YiC, XiaC and LW conducted the western
blotting and the data analysis. MW and TJS conducted the
statistical analysis and prepared the images of the figures. YoC,
JL and AS wrote the manuscript. TJS, NW and JP revised the
manuscript. All authors read and approved the manuscript and agree
to be accountable for all aspects of the research in ensuring that
the accuracy or integrity of any part of the work are appropriately
investigated and resolved.
Ethics approval and consent to
participate
The specimens were obtained from Taizhou Hospital of
Zhejiang Province (Zhejiang, China) and approved by Ethics
Committee of Shanghai Outdo Biotech Company (approval no.
SHYJS-CP-1807007) with written informed consent from patients.
All animal maintenance and procedures were performed
in strict accordance with the ‘Guide for the Care and Use of
Laboratory Animals’ of the National Research Council and the
‘Principles for the Utilization and Care of Vertebrate Animals’ of
the National Institutes of Health and approved by the Animal Ethics
Committee of Fujian University of Traditional Chinese Medicine
(Fuzhou, China) (approval no. 2018-032).
Patient consent for publication
Not applicable.
Competing interests
The authors declare that they have no competing
interests.
Glossary
Abbreviations
Abbreviations:
|
BC
|
breast cancer
|
|
RFS
|
relapse-free survival
|
|
OS
|
overall survival
|
|
IHC
|
immunohistochemistry
|
|
TCGA
|
The Cancer Genome Atlas
|
|
TMA
|
tissue microarray
|
|
PCR
|
polymerase chain reaction
|
|
STR
|
short tandem repeat
|
|
NPI
|
Nottingham prognostic index
|
|
SBR
|
Scarff-Bloom-Richardson
|
|
HER2
|
human epidermal growth factor receptor
2
|
|
PR
|
progesterone receptor
|
|
ER
|
estrogen receptor
|
|
CRC
|
colorectal cancer
|
|
DMEM
|
Dulbecco's modified Eagle's medium
|
|
TNBC
|
triple-negative breast cancer
|
|
GAPDH
|
glyceraldehyde 3-phosphate
dehydrogenase
|
|
CDK1
|
cyclin-dependent kinase 1
|
|
PBS
|
phosphate-buffered saline
|
References
|
1
|
Manthri RG, Jeepalem SM, Krishna Mohan VS,
Bhargavi D, Hulikal N and Kalawat T: Metachronous second primary
malignancies in known breast cancer patients on
18F-Fluoro-2-Deoxyglucose positron emission tomography-computerized
tomography in a tertiary care center. Indian J Nucl Med.
34:284–289. 2019. View Article : Google Scholar : PubMed/NCBI
|
|
2
|
Hessami Arani S and Kerachian MA: Rising
rates of colorectal cancer among younger Iranians: Is diet to
blame? Curr Oncol. 24:e131–e137. 2017. View Article : Google Scholar : PubMed/NCBI
|
|
3
|
Fahad Ullah M: Breast cancer: Current
perspectives on the disease status. Adv Exp Med Biol. 1152:51–64.
2019. View Article : Google Scholar : PubMed/NCBI
|
|
4
|
Bray F, Ferlay J, Soerjomataram I, Siegel
RL, Torre LA and Jemal A: Global cancer statistics 2018: GLOBOCAN
estimates of incidence and mortality worldwide for 36 cancers in
185 countries. CA Cancer J Clin. 68:394–424. 2018. View Article : Google Scholar : PubMed/NCBI
|
|
5
|
Bernier J: Post-mastectomy radiotherapy
after neodjuvant chemotherapy in breast cancer patients: A review.
Crit Rev Oncol Hematol. 93:180–189. 2015. View Article : Google Scholar : PubMed/NCBI
|
|
6
|
Byler S, Goldgar S, Heerboth S, Leary M,
Housman G, Moulton K and Sarkar S: Genetic and epigenetic aspects
of breast cancer progression and therapy. Anticancer Res.
34:1071–1077. 2014.PubMed/NCBI
|
|
7
|
Cobain EF, Milliron KJ and Merajver SD:
Updates on breast cancer genetics: Clinical implications of
detecting syndromes of inherited increased susceptibility to breast
cancer. Semin Oncol. 43:528–535. 2016. View Article : Google Scholar : PubMed/NCBI
|
|
8
|
Boisvert FM, van Koningsbruggen S,
Navascués J and Lamond AI: The multifunctional nucleolus. Nat Rev
Mol Cell Biol. 8:574–585. 2007. View
Article : Google Scholar : PubMed/NCBI
|
|
9
|
Brina D, Grosso S, Miluzio A and Biffo S:
Translational control by 80S formation and 60S availability: The
central role of eIF6, a rate limiting factor in cell cycle
progression and tumorigenesis. Cell Cycle. 10:3441–3446. 2011.
View Article : Google Scholar : PubMed/NCBI
|
|
10
|
Hang R, Liu C, Ahmad A, Zhang Y, Lu F and
Cao X: Arabidopsis protein arginine methyltransferase 3 is required
for ribosome biogenesis by affecting precursor ribosomal RNA
processing. Proc Natl Acad Sci USA. 111:16190–16195. 2014.
View Article : Google Scholar : PubMed/NCBI
|
|
11
|
Montanaro L, Trere D and Derenzini M:
Changes in ribosome biogenesis may induce cancer by down-regulating
the cell tumor suppressor potential. Biochim Biophys Acta.
1825:101–110. 2012.PubMed/NCBI
|
|
12
|
Penzo M, Casoli L, Pollutri D, Sicuro L,
Ceccarelli C, Santini D, Taffurelli M, Govoni M, Brina D, Trere D
and Montanaro L: JHDM1B expression regulates ribosome biogenesis
and cancer cell growth in a p53 dependent manner. Int J Cancer.
136:E272–E281. 2015. View Article : Google Scholar : PubMed/NCBI
|
|
13
|
Catez F, Dalla Venezia N, Marcel V, Zorbas
C, Lafontaine DLJ and Diaz JJ: Ribosome biogenesis: An emerging
druggable pathway for cancer therapeutics. Biochem Pharmacol.
159:74–81. 2019. View Article : Google Scholar : PubMed/NCBI
|
|
14
|
Zemp I and Kutay U: Nuclear export and
cytoplasmic maturation of ribosomal subunits. FEBS Lett.
581:2783–2793. 2007. View Article : Google Scholar : PubMed/NCBI
|
|
15
|
Strunk BS and Karbstein K: Powering
through ribosome assembly. RNA. 15:2083–2104. 2009. View Article : Google Scholar : PubMed/NCBI
|
|
16
|
Kressler D, Hurt E and Bassler J: Driving
ribosome assembly. Biochim Biophys Acta. 1803:673–283. 2010.
View Article : Google Scholar : PubMed/NCBI
|
|
17
|
Rodriguez-Galan O, Garcia-Gomez JJ and de
la Cruz J: Yeast and human RNA helicases involved in ribosome
biogenesis: Current status and perspectives. Biochim Biophys Acta.
1829:775–790. 2013. View Article : Google Scholar : PubMed/NCBI
|
|
18
|
Iadevaia V, Liu R and Proud CG: mTORC1
signaling controls multiple steps in ribosome biogenesis. Semin
Cell Dev Biol. 36:113–120. 2014. View Article : Google Scholar : PubMed/NCBI
|
|
19
|
Pelletier J, Thomas G and Volarevic S:
Ribosome biogenesis in cancer: New players and therapeutic avenues.
Nat Rev Cancer. 18:51–63. 2018. View Article : Google Scholar : PubMed/NCBI
|
|
20
|
Vizoso-Vazquez A, Barreiro-Alonso A,
Gonzalez-Siso MI, Rodriguez-Belmonte E, Lamas-Maceiras M and Cerdan
ME: HMGB proteins involved in TOR signaling as general regulators
of cell growth by controlling ribosome biogenesis. Curr Genet.
64:1205–1213. 2018. View Article : Google Scholar : PubMed/NCBI
|
|
21
|
Freed EF, Bleichert F, Dutca LM and
Baserga SJ: When ribosomes go bad: Diseases of ribosome biogenesis.
Mol Biosyst. 6:481–493. 2010. View Article : Google Scholar : PubMed/NCBI
|
|
22
|
Armistead J and Triggs-Raine B: Diverse
diseases from a ubiquitous process: The ribosomopathy paradox. FEBS
Lett. 588:1491–1500. 2014. View Article : Google Scholar : PubMed/NCBI
|
|
23
|
Stumpf CR and Ruggero D: The cancerous
translation apparatus. Curr Opin Genet Dev. 21:474–483. 2011.
View Article : Google Scholar : PubMed/NCBI
|
|
24
|
Shen A, Chen Y, Liu L, Huang Y, Chen H, Qi
F, Lin J, Shen Z, Wu X, Wu M, et al: EBF1-mediated upregulation of
ribosome assembly factor PNO1 contributes to cancer progression by
negatively regulating the p53 signaling pathway. Cancer Res.
79:2257–2270. 2019. View Article : Google Scholar : PubMed/NCBI
|
|
25
|
Curtis C, Shah SP, Chin SF, Turashvili G,
Rueda OM, Dunning MJ, Speed D, Lynch AG, Samarajiwa S, Yuan Y, et
al: The genomic and transcriptomic architecture of 2,000 breast
tumours reveals novel subgroups. Nature. 486:346–352. 2012.
View Article : Google Scholar : PubMed/NCBI
|
|
26
|
Zhao H, Langerod A, Ji Y, Nowels KW,
Nesland JM, Tibshirani R, Bukholm IK, Karesen R, Botstein D,
Borresen-Dale AL and Jeffrey SS: Different gene expression patterns
in invasive lobular and ductal carcinomas of the breast. Mol Biol
Cell. 15:2523–2536. 2004. View Article : Google Scholar : PubMed/NCBI
|
|
27
|
Jezequel P, Campone M, Gouraud W,
Guerin-Charbonnel C, Leux C, Ricolleau G and Campion L:
bc-GenExMiner: An easy-to-use online platform for gene prognostic
analyses in breast cancer. Breast Cancer Res Treat. 131:765–775.
2012. View Article : Google Scholar : PubMed/NCBI
|
|
28
|
Jezequel P, Frenel JS, Campion L,
Guerin-Charbonnel C, Gouraud W, Ricolleau G and Campone M:
bc-GenExMiner 3.0: New mining module computes breast cancer gene
expression correlation analyses. Database (Oxford).
2013:bas0602013. View Article : Google Scholar : PubMed/NCBI
|
|
29
|
Shen A, Liu L, Chen H, Qi F, Huang Y, Lin
J, Sferra TJ, Sankararaman S, Wei L, Chu J, et al: Cell division
cycle associated 5 promotes colorectal cancer progression by
activating the ERK signaling pathway. Oncogenesis. 8:192019.
View Article : Google Scholar : PubMed/NCBI
|
|
30
|
Turowski TW, Lebaron S, Zhang E, Peil L,
Dudnakova T, Petfalski E, Granneman S, Rappsilber J and Tollervey
D: Rio1 mediates ATP-dependent final maturation of 40S ribosomal
subunits. Nucleic Acids Res. 42:12189–12199. 2014. View Article : Google Scholar : PubMed/NCBI
|
|
31
|
He XW, Feng T, Yin QL, Jian YW and Liu T:
NOB1 is essential for the survival of RKO colorectal cancer cells.
World J Gastroenterol. 21:868–877. 2015. View Article : Google Scholar : PubMed/NCBI
|
|
32
|
Ruggero D: Revisiting the nucleolus: From
marker to dynamic integrator of cancer signaling. Sci Signal.
5:pe382012. View Article : Google Scholar : PubMed/NCBI
|