Introduction
Pancreatic cancer is one of the most aggressive
malignancies with a dismal prognosis, and the 5-year overall
survival rate is 8% (1). Even
after radical surgery, the prognosis of pancreatic cancer remains
poor owing to the high rate of local recurrence and/or distant
metastasis, with an estimated median survival after surgery of only
16.8 months (2). Recently,
survival benefit from neoadjuvant therapy (NAT) in patients with
pancreatic cancer has been reported, and surgical resection after
NAT is the current standard treatment for patients with resectable
or borderline resectable pancreatic cancer (2–4).
Therefore, histological biomarker research in pancreatic cancer
after NAT is important for understanding treatment resistance and
for predicting prognosis.
Histological tumor necrosis (HTN) is a potential
predictor of a poor prognosis. In particular, we previously
reported that the size of HTN is strongly correlated with
postoperative prognosis in resectable pancreatic cancer without NAT
(5–7). Moreover, the hypoxic microenvironment
of the tumor, represented by overexpression of carbonic anhydrase 9
(CA-9), was found to be closely linked with the formation of HTN in
pancreatic cancer patients without NAT (7). On the other hand, the utility of
these physiological tumor conditions as prognostic factors and
their alteration during NAT have not been investigated in human
pancreatic cancer tissue. Comparison of physiological tumor
conditions in pancreatic cancer with or without NAT may allow us to
determine physiological alterations during NAT and may provide
basic information to establish new treatment strategies targeting
them. Thus, the aim of this study was to investigate the prognostic
potential of HTN after NAT, and to measure the alterations in tumor
hypoxia after NAT in pancreatic cancer.
Patients and methods
Patients
From January 2011 to December 2018, 339 patients
underwent pancreatectomy for pancreatic cancer at the National
Cancer Hospital East, Kishiwa, Japan. Of the 339 patients, 32 were
excluded for recurrent pancreatic cancer in the remnant pancreas
(n=18) or inconsistent patient information (n=14). The remaining
307 patients were investigated in this study. According to the
clinical practice guidelines for pancreatic cancer from the Japan
Pancreas Society (8), single-agent
S-1 was given as standard adjuvant chemotherapy except for patients
who received systemic chemotherapy due to early recurrence or who
refused standard adjuvant chemotherapy. This retrospective study
was approved by the National Cancer Ethics Review Board (reference
2017-328).
Radiologic criteria for
resectability
The staging and resectability of the pancreatic
cancer cases were assessed with contrast-enhanced computed
tomography imaging, magnetic resonance imaging, and ultrasound. The
patient data were reviewed by hepato-biliary-pancreatic surgeons,
medical oncologists, and radiologists during a conference to
determine tumor staging and resectability. Local tumor extent was
categorized as potentially resectable, borderline resectable, or
locally advanced. The criteria for borderline resectable disease
were defined based on the General Rules for the Study of Pancreatic
Cancer edited by the Japan Pancreatic Society (9) as follows: a) contact with the celiac
artery <180° without deformity or narrowing; b) any contact with
the common hepatic artery without contact with the celiac artery or
proper hepatic artery; c) contact with the superior mesenteric
artery <180° without deformity or narrowing; and/or d) contact
with the portal-superior mesenteric vein ≥180° without caudal
extensions over the level of the inferior end of the duodenum. Any
tumors with vascular contact exceeding any of the above borderline
resectable criteria were determined to be locally advanced
disease.
In accordance with the treatment algorithm based on
the General Rules of Pancreatic Cancer edited by the Japan
Pancreatic Society (9), patients
with diagnosed resectable disease underwent upfront surgery (UFS),
whereas patients who had diagnosed borderline resectable disease
received NAT followed by radical surgery. If patients satisfied the
eligibility criteria of clinical trials (10–12),
they participated in these clinical trials of NAT for resectable
and borderline resectable pancreatic cancer.
NAT
During the study period, neoadjuvant strategies
included systemic induction chemotherapy or locoregional
chemoradiation. Neoadjuvant systemic chemotherapy regimens included
gemcitabine/nab-paclitaxel, gemcitabine/S-1, and single-agent S-1.
Chemoradiation used S-1 with concurrent radiation therapy (RT) with
a total dosage of 50.4 Gy in 28 fractions. If upon restaging after
completion of NAT, the patient was surgically fit and the extent of
the disease remained potentially resectable or borderline
resectable without distant metastasis, operative exploration was
indicated.
Histological analysis of surgical
specimens
Histological characteristics, such as tumor area,
tumor grade, tumor size, lymph node metastasis, microvascular
invasion, neural invasion, and HTN, were compared between the UFS
and NAT groups. Moreover, morphological features of HTN, such as
necrotic area, necrotic area/tumor area, perimeter, circularity,
number of necroses, number of ruptured cancer glands, neutrophil
infiltration, and collagen bundles, were compared between the two
groups to evaluate the alterations after NAT in pancreatic
cancer.
All tumor tissues were fixed in 10% formalin neutral
buffer solution for two days at 20°C, sliced at 4- to 7-mm
intervals, and all slices with tumor were submitted for microscopic
examination. Then, 4-µm-thick sections were stained with
hematoxylin (30011; FUJIFILM Wako Pure Chemical Corp.) for 3 min
and eosin (0.5%, 32012; FUJIFILM Wako Pure Chemical Corp.) for 5
min at room temperature, and all hematoxylin and eosin
(H&E)-stained slides from the largest slice with tumor that was
determined during the histologic assessment were digitally scanned
in each case. The H&E sections were scanned using the
NanoZoomer 2.0 system (Hamamatsu Photonics), and morphological and
histological analysis was performed by a single investigator (MJ,
with more than 23 years of experience examining pancreatic
histology) without any radiological or clinical information.
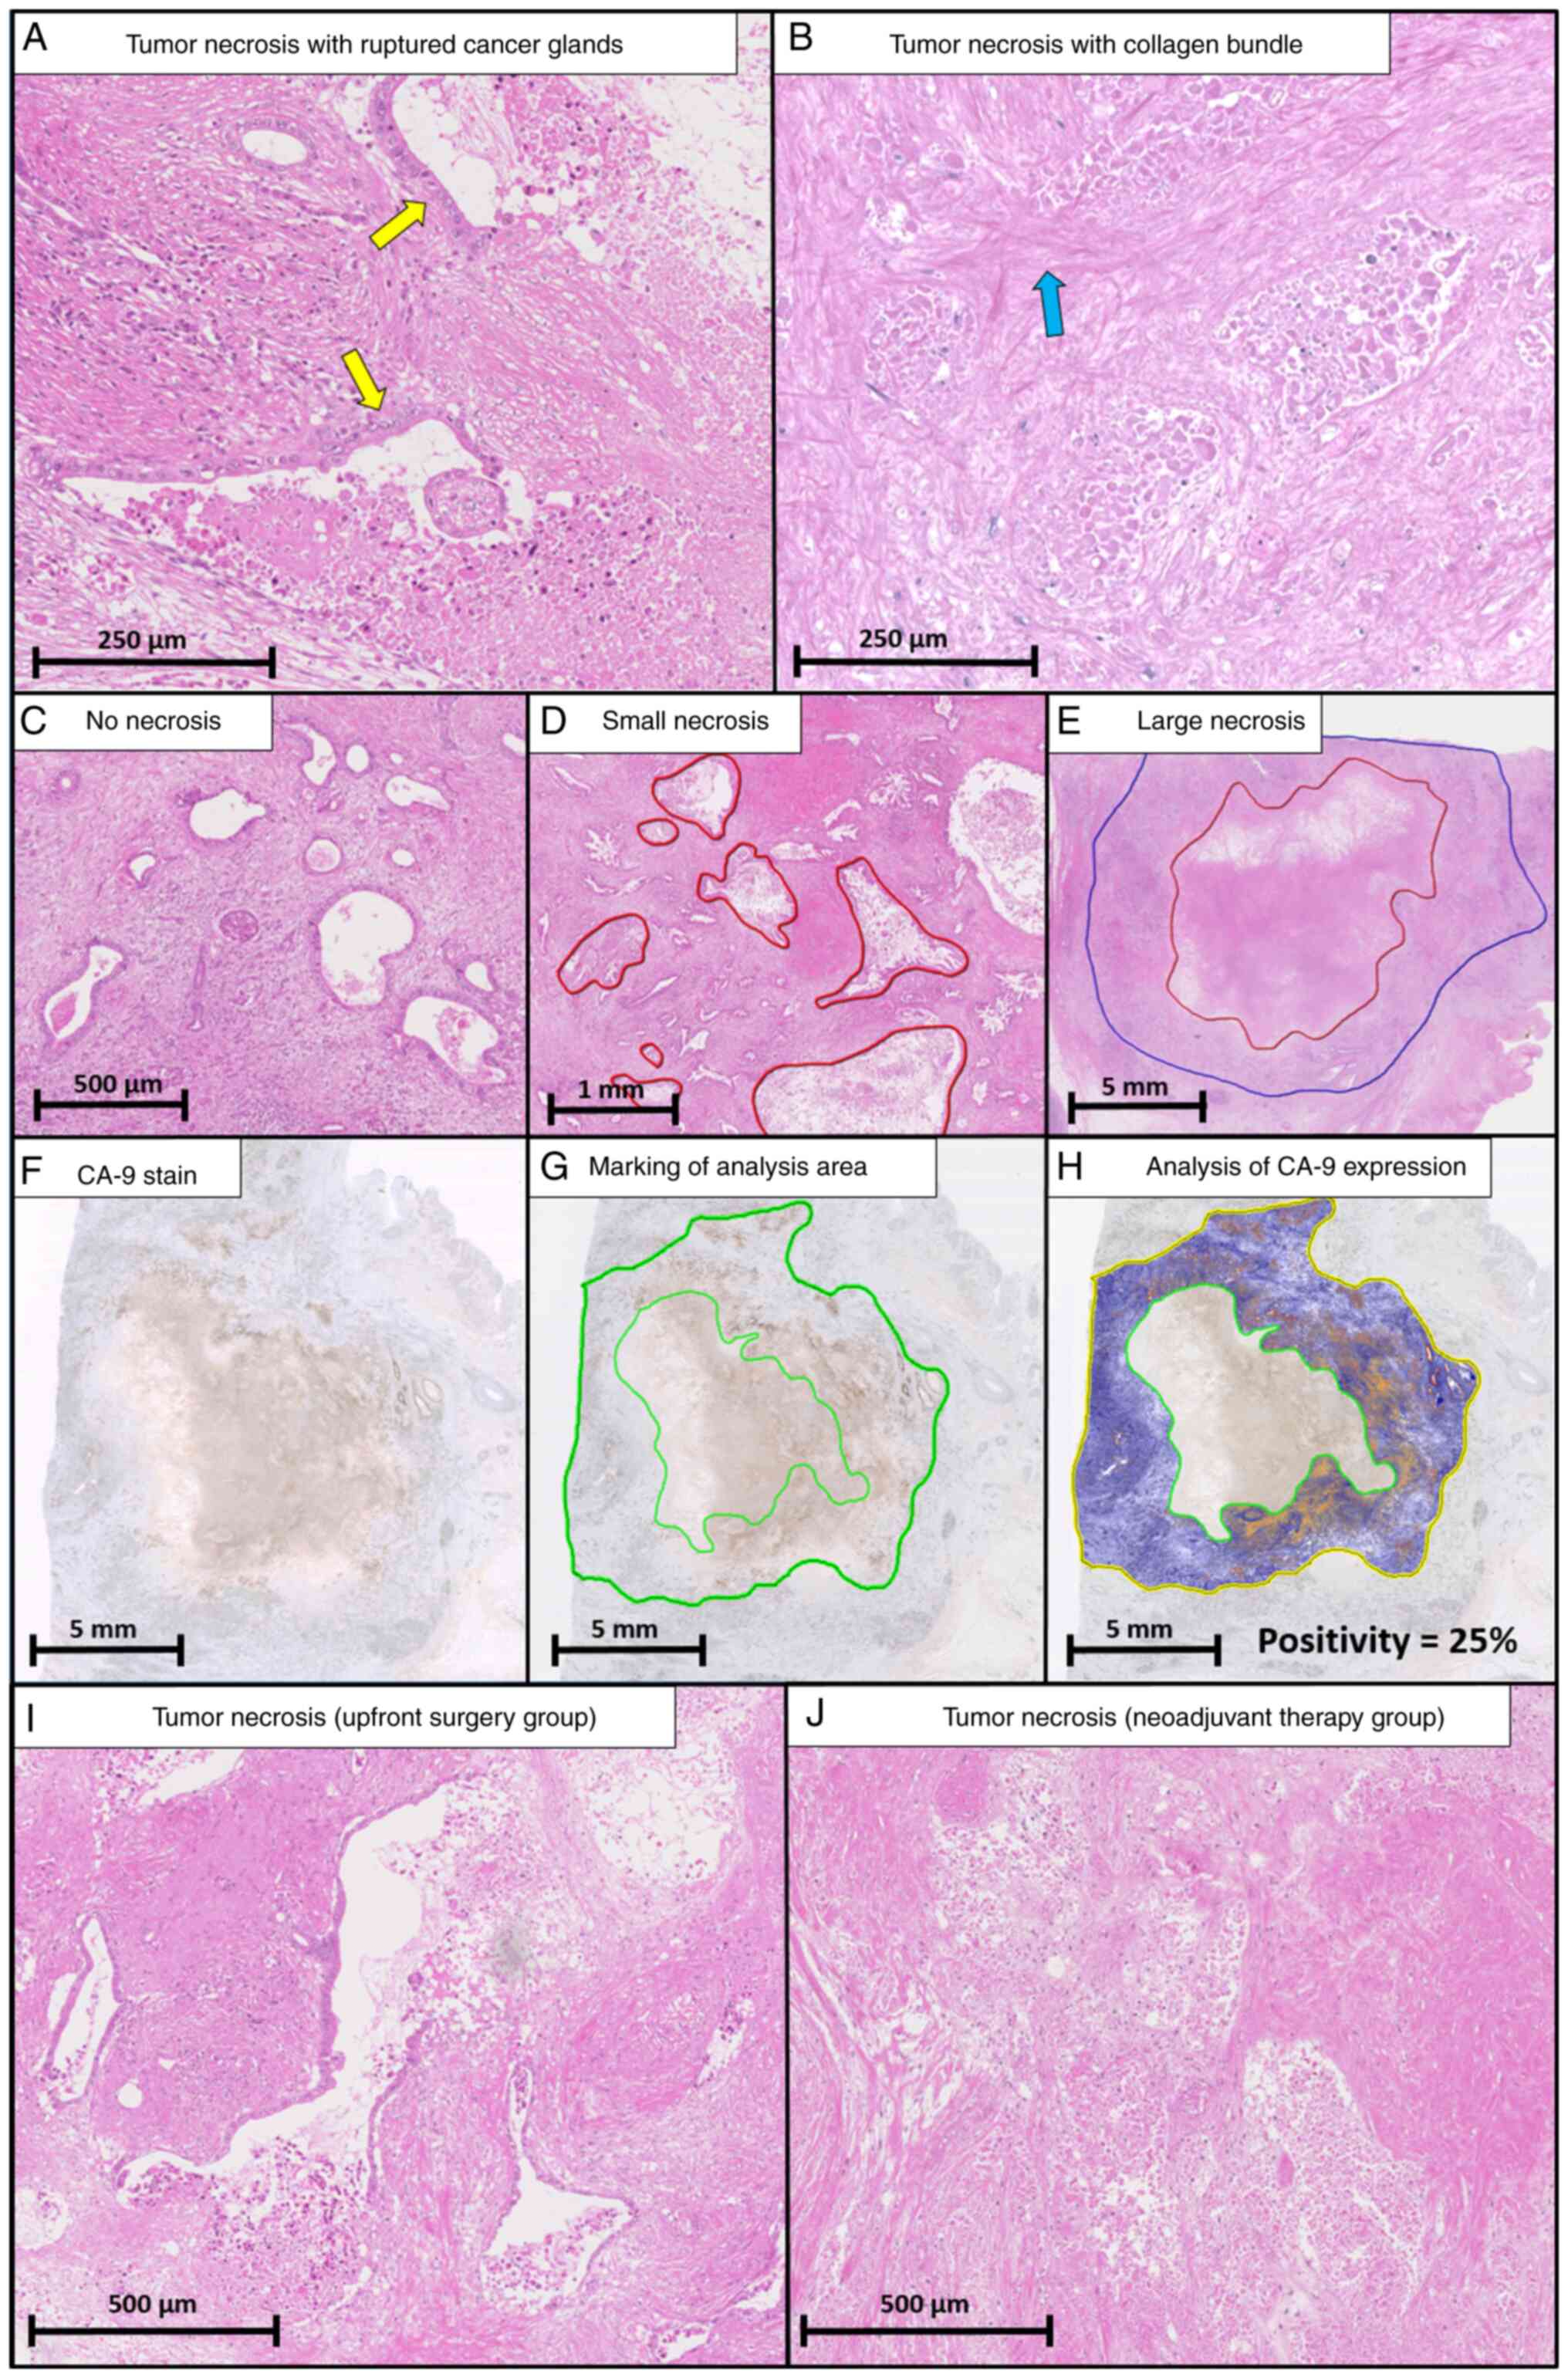
The definition of HTN was based on previous reports
(5–7). HTN was assessed only as lesions
including preserved cell outlines without nuclei. Both confluent
cell death in an invasive area (visible at an objective lens
magnification of ×4) and smaller areas of necrosis were regarded as
necrotic. Death of many confluent cells in an invasive area
included ruptured cancer glands (Fig.
1A) and collagen bundles (Fig.
1B). Intraluminal necrosis that did not extend to the stroma
was not regarded as necrosis (Fig.
1C). The investigator could determine the borderline between
HTN and other tissues for assessing the size of HTN, referencing
confluent cell death, ruptured cancer glands, and collagen bundles,
while blind to clinical information. After determination of the HTN
regions, the ruler function in NanoZoomer 2.0 was used to evaluate
the size of HTN (Fig. S1, red
line). When multiple regions of HTN were present, the largest area
of HTN was selected as representative of that case. However, tumor
necrosis after neoadjuvant therapy was more confusing, because the
area of tumor cells may vanish completely after therapy. Therefore,
lesions including preserved cell outlines without nuclei were
considered to be indicative of tumor necrosis. The size of HTN was
measured and classified into small (maximum diameter <5 mm,
Fig. 1D) and large necrosis
(maximum diameter >5 mm, Fig.
1E) to investigate the size-dependent features of HTN. The
cut-off value (5 mm) of this size classification was calculated in
our previous report (5). The
circularity of HTN was calculated as follows: 4 π × (area of
necrosis)/(perimeter of necrosis)2. Measurement of the
tumor area was based on our previous reports (5,13).
The pathological stage of patients was defined according to the TNM
stage in the 8th Union for International Cancer Control staging
system (14).
Histological features associated with neoadjuvant
therapeutic effects were assessed using the College of American
Pathologists (CAP) regression grading system and Evans grading
system (15,16). The CAP grading system was assessed
as follows: Grade 0, no viable cancer cells; grade 1, single cells
or rare small groups of cancer cells; grade 2, residual tumor with
evident tumor regression; and grade 3, extensive residual tumor
with no evident tumor regression (15). The Evans grading system was
assessed as follows: grade 1, <10% to no tumor cells destroyed;
grade 2a, 10 to 50% of tumor cells destroyed; grade 2b, 51 to 90%
of tumor cells destroyed; grade 3, few (<10%) tumor cells
present; and grade 4, no viable tumor cells (16).
Immunohistochemical analysis of
surgical specimens
Hypoxic microenvironment status, represented by
CA-9, was compared between UFS and NAT groups to evaluate the
alterations in physiological tumor conditions after NAT in
pancreatic cancer.
Immunohistochemistry was performed on 10% formalin
neutral buffer solution-fixed, paraffin-embedded tissue sections by
Ventana autostainer model Discover XT (Ventana Medical System. A
polyclonal goat antibody against human CA-9 antibody (1:300,
sc-365900; Santa Cruz Biotechnology, Inc.) was used. In brief,
tissue sections were incubated in citrate buffer for 4 min at 72°C
to retrieve antigenicity, followed by incubation with the primary
antibody. The bound primary antibody was incubated with the
anti-goat secondary antibody at 37°C for 8 min and visualized using
ultraView Universal DAB Detection Kit (760–500; Roche Diagnostics).
The CA-9 sections were scanned using the NanoZoomer 2.0 system
(Fig. 1F). The tumor regions
without necrosis were encircled to evaluate the hypoxic tumor
microenvironment status (Fig. 1G)
and quantified using morphometric analysis from a color-detecting
algorithm. CA-9 positivity was calculated as the percentage of
CA-9-positive pixels out of the entire pixel count using
morphometric analysis with the positive pixel count algorithm
(Aperio ImageScope, version 12.4; Leica Biosystems) (Fig. 1H) (17).
Statistical analysis
Categorical variables were evaluated using the
Chi-squared test and are presented as numbers and percentages,
whereas continuous variables were evaluated using the Mann-Whitney
U test and are presented as medians and ranges. Relapse-free
survival (RFS) and disease-specific survival (DSS) rates were
calculated with the Kaplan-Meier method, and differences were
compared with the log-rank test. RFS and DSS were defined as the
interval from the date of starting first treatment (UFS or NAT) to
the date of recurrence or disease-specific death due to pancreatic
cancer, respectively, or the date censored at the last follow-up.
The observation period was until the end of September 2019, and the
median duration was 24.5 months [95% confidence interval (CI),
20.3-31.1]. Univariate and multivariate analyses of prognostic
factors were performed using a Cox proportional hazards model. The
factors that were found to be significant on univariate analyses in
the UFS group were included in the multivariate analysis, the
results of which are presented as risk ratios (RRs) and 95% CIs.
However, multivariate analyses of prognostic factors in the NAT
group were not performed due to the small sample size. All P-values
were based on two-sided statistical tests, and the significance
level was set at 0.05. Statistical analyses were performed using
JMP (version 12.0.10; SAS Institute).
Results
Clinical and histological
characteristics of the patients
Of the 307 patients who were reviewed, 44 (14%)
received NAT followed by radical surgery (NAT group), and 263 (86%)
underwent UFS (UFS group). Table I
shows a comparison of the clinical and histological variables
between the NAT group and UFS group at baseline. Of the clinical
characteristics, patient mean age was significantly higher in the
UFS group than that in the NAT group (70 vs. 67 years, P=0.009),
and the frequency of borderline resectable pancreatic cancer was
significantly lower in the UFS group than in the NAT group (1 vs.
66%, P<0.001). As for the histological characteristics, the
frequencies of lymph node metastasis (65 vs. 34%, P<0.001),
lymphatic invasion (74 vs. 52%, P<0.001), venous invasion (92
vs. 80%, P=0.014), and neural invasion (95 vs. 86%, P=0.039) were
significantly lower in the NAT group than in the UFS group. Of
note, in comparison with the UFS group, the frequency of HTN (51
vs. 34%, P=0.043) was significantly lower in the NAT group. On the
other hand, the frequency of large histological necrosis was
comparable in the UFS and NAT groups.
 | Table I.Comparison of the clinicopathological
characteristics between the UFS group and the NAT group. |
Table I.
Comparison of the clinicopathological
characteristics between the UFS group and the NAT group.
| Clinical
characteristic | UFS group
(n=263) | NAT group (n=44) | P-value |
|---|
| Age (years) | 70 (43–87) | 67 (38–78) | 0.009 |
| Sex, n (%) |
|
|
|
| Male | 159 (61) | 28 (64) | 0.689 |
| Body mass
index (kg/m2) | 21.4 (15.6-38.8) | 22.3 (16.6-28.3) | 0.183 |
| Tumor location, n
(%) |
|
|
|
|
Head | 171 (65) | 28 (64) | 0.679 |
| Body
and tail | 88 (33) | 16 (36) |
|
| Whole
pancreas | 4 (2) | 0 (0) |
|
| Clinical tumor size
(before NAT), n (%) |
|
|
|
| <20
mm | 127 (48) | 18 (41) | 0.571 |
| ≥20,
<40 mm | 129 (49) | 24 (55) |
|
| ≥40
mm | 7 (3) | 2 (5) |
|
| Local tumor extent,
n (%) |
|
|
|
|
Potentially resectable | 260 (99) | 15 (34) |
<0.001 |
|
Borderline resectable | 3 (1) | 29 (66) |
|
| NAT, n (%) |
|
|
|
| S-1 +
radiation | - | 23 (52) | - |
| GEM +
nabPTX | - | 10 (23) |
|
| GEM +
S-1 | - | 10 (23) |
|
| S-1
monotherapy | - | 1 (2) |
|
| Histological
characteristics |
|
|
|
| Tumor
area (mm2) | 105 [10-513] | 117 [4-309] | 0.501 |
| Tumor grade, n
(%) |
|
|
|
| Grade
1 | 44 (17) | 13 (30) | 0.120 |
| Grade
2 | 196 (75) | 27 (61) |
|
| Grade
3 | 23 (9) | 4 (9) |
|
| Pathological tumor
size, n (%) |
|
|
|
| <20
mm | 75 (29) | 12 (27) | 0.226 |
| ≥20,
<40 mm | 162 (62) | 31 (71) |
|
| ≥40
mm | 26 (10) | 1 (2) |
|
| Lymph node
metastasis, n (%) |
|
|
|
|
Absence | 91 (35) | 29 (66) |
<0.001 |
|
Presence | 172 (65) | 15 (34) |
|
| Lymphatic invasion,
n (%) |
|
|
|
|
Absence | 68 (26) | 21 (48) |
<0.001 |
|
Presence | 195 (74) | 23 (52) |
|
| Venous invasion, n
(%) |
|
|
|
|
Absence | 22 (8) | 9 (20) | 0.014 |
|
Presence | 241 (92) | 35 (80) |
|
| Neural invasion, n
(%) |
|
|
|
|
Absence | 14 (5) | 6 (14) | 0.039 |
|
Presence | 249 (95) | 38 (86) |
|
| Histological
necrosis, n (%) |
|
|
|
|
Absence | 130 (49) | 29 (66) | 0.043 |
|
Presence | 133 (51) | 15 (34) |
|
| Histological large
necrosis, n (%) |
|
|
|
|
Absence | 210 (80) | 33 (75) | 0.464 |
|
Presence | 53 (20) | 11 (25) |
|
Histological findings of necrosis
Comparison of HTN between the NAT and UFS groups is
shown in Table II. In the NAT
group, the number of ruptured cancer glands was significantly lower
(P=0.017), and the rate of collagen bundles was significantly
higher (P=0.030) than in the UFS group. No differences in
morphological variables, such as necrotic area, necrotic area/tumor
area, perimeter, or circularity, were seen between the two groups.
Representative areas of HTN in the NAT and UFS groups are shown in
Fig. 1I and J.
| Table II.Comparison of histological tumor
necrosis in patients with or without neoadjuvant therapy. |
Table II.
Comparison of histological tumor
necrosis in patients with or without neoadjuvant therapy.
|
| Histological
necrosis | Histological large
necrosis |
|---|
|
|
|
|
|---|
|
| UFS group
(n=133) | NAT group
(n=5) | P-value | UFS group
(n=53) | NAT group
(n=11) | P-value |
|---|
| Necrotic area
(mm2) | 10.3
[0.5-182.7] | 46.4 (1.3-105) | 0.139 | 68.6
[12.4-182.7] | 54.4
(16.8-105.0) | 0.428 |
| Necrotic area/tumor
area (%) | 9 (1–82) | 25 (1–56) | 0.167 | 38 (4–82) | 28 (16–56) | 0.359 |
| Perimeter (mm) | 11.8
[2.8-65.4] | 33.6
(3.5-46.9) | 0.107 | 32.5
(16.6-65.4) | 37.3
(17.7-46.9) | 0.972 |
| Circularity | 0.66
[0.24-0.95] | 0.58
(0.35-0.79) | 0.117 | 0.62
(0.30-0.87) | 0.51
(0.35-0.79) | 0.251 |
| Number of
necroses | 2 (1–22) | 3 (1–8) | 0.481 | 3 (1–9) | 2 (1–5) | 0.416 |
| Number of ruptured
cancer glands | 5 (0–36) | 2 (0–11) | 0.017 | 15 (0–36) | 2 (0–11) |
<0.001 |
| Neutrophil
infiltration, n (%) |
|
|
|
|
|
|
|
Presence | 37 (28) | 3 (20) | 0.518 | 16 (30) | 2 (18) | 0.420 |
|
Absence | 96 (72) | 12 (80) |
| 37 (70) | 9 (82) |
|
| Collagen bundles, n
(%) |
|
|
|
|
|
|
|
Presence | 50 (38) | 10 (67) | 0.030 | 41 (77) | 10 (91) | 0.309 |
|
Absence | 83 (62) | 5 (33) |
| 12 (23) | 1 (9) |
|
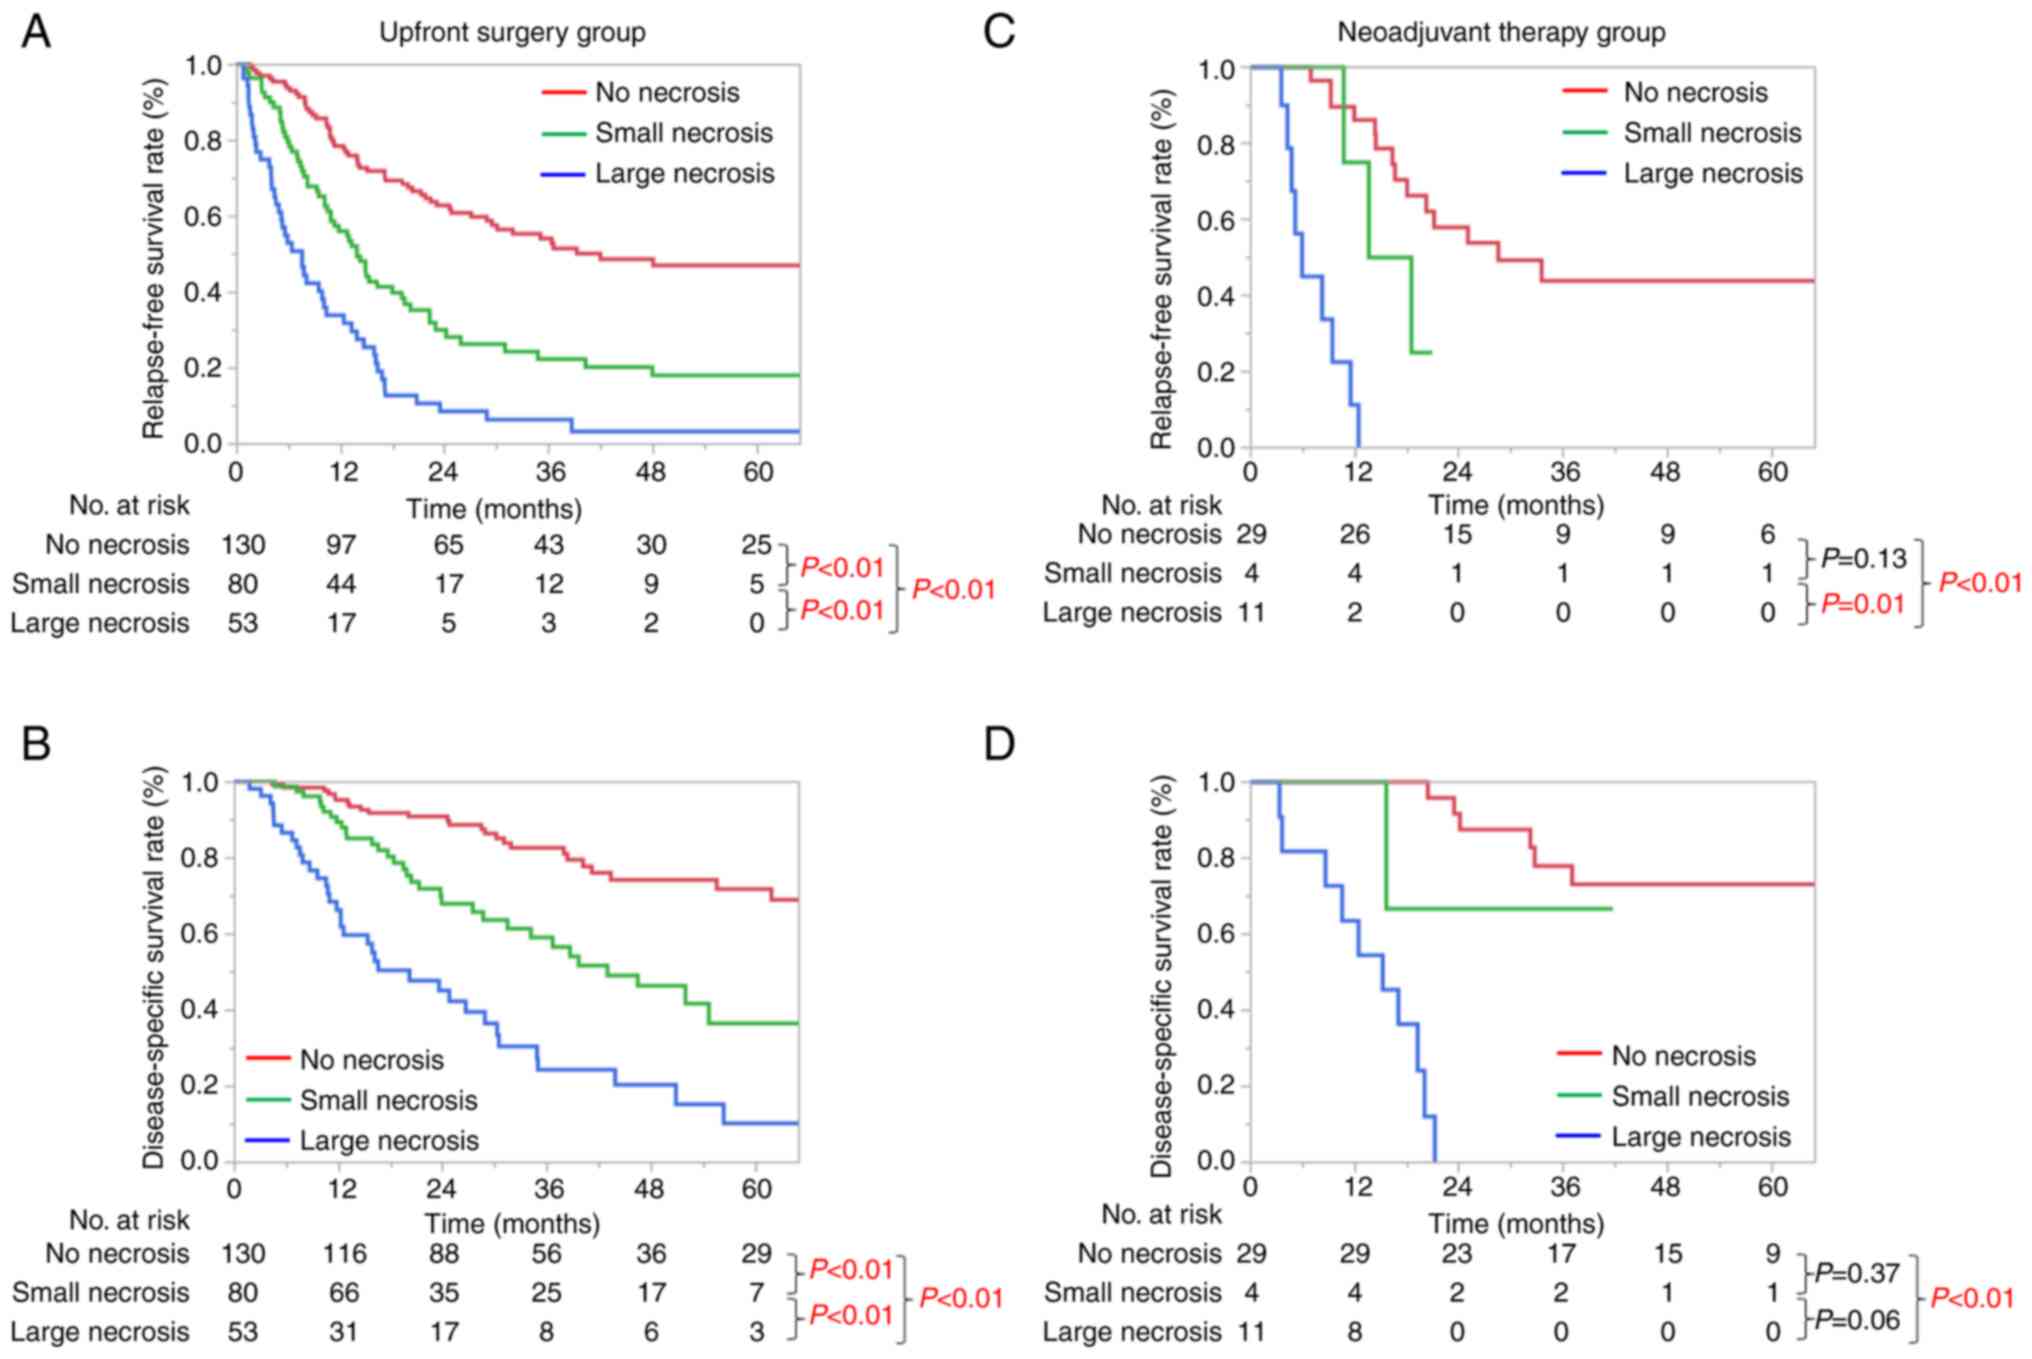
Prognostic significance according to
the size of necrosis
The prognostic significance of the size of necrosis
is shown in Fig. 2. The median
relapse-free survival (RFS) and disease-specific survival (DSS) in
the UFS group of 263 patients were 17.2 and 56.4 months,
respectively. For both RFS and DSS, significant size-dependent
deterioration of the clinical prognosis was seen in the UFS group
(Fig. 2A and B). The median RFS
and DSS in the NAT group of 44 patients were 18.5 and 66.1 months,
respectively. Kaplan-Meier curves of RFS and DSS were significantly
different between no necrosis and large necrosis in the NAT group
(P<0.01, Fig. 2C and D).
Risk analysis of prognostic factors in
the NAT group
Univariate risk analyses of prognostic factors
associated with DSS in the NAT group are shown in Table III. On univariate analyses, HTN
was the only significant risk factor for DSS (RR, 11.94; 95% CI,
4.13-37.57; P<0.001), and large histological necrosis was a
robust factor related to a poor prognosis (RR, 39.25; 95% CI,
9.54-267.97; P<0.001). Univariate risk analyses of prognostic
factors associated with RFS in the NAT group are shown in Table IV. HTN was the only significant
risk factor for RFS (RR, 6.40; 95% CI, 2.68-15.62; P<0.001), and
large histological necrosis was a robust factor related to a poor
prognosis (RR, 17.35; 95% CI, 5.71-58.92; P<0.001).
| Table III.Univariate risk analyses of
prognostic factors associated with DSS in the NAT group (n=44). |
Table III.
Univariate risk analyses of
prognostic factors associated with DSS in the NAT group (n=44).
|
|
|
| Univariate
analysisa |
|---|
|
|
|
|
|
|---|
| Variable | n | Median DSS
(months) | RR (95% CI) | P-value |
|---|
| Age (years) |
|
|
|
|
|
≥75 | 6 | NR | 0.41
(0.02-1.98) | 0.316 |
|
<75 | 38 | 66.1 |
|
|
| Sex |
|
|
|
|
|
Male | 28 | 66.1 | 1.10
(0.43-3.18) | 0.841 |
|
Female | 16 | NR |
|
|
| Body mass index
(kg/m2) |
|
|
|
|
|
≥25 | 8 | NR | 0.95
(0.34-3.37) | 0.924 |
|
<25 | 36 | 66.1 |
|
|
| Local tumor
extent |
|
|
|
|
|
Potentially resectable | 15 | 37.0 | 1.25
(0.48-3.18) | 0.639 |
|
Borderline resectable | 29 | 66.1 |
|
|
| Tumor location |
|
|
|
|
|
Head | 28 | 66.1 | 0.63
(0.24-1.61) | 0.324 |
| Body
and tail | 16 | 34.6 |
|
|
| Clinical tumor size
(mm) |
|
|
|
|
|
≥20 | 24 | 32.2 | 2.66
(0.99-8.34) | 0.053 |
|
<20 | 20 | NR |
|
|
| CA-9 before NAT
(IU/ml) |
|
|
|
|
|
≥37 | 28 | 66.1 | 1.05
(0.39-2.68) | 0.916 |
|
<37 | 16 | NR |
|
|
| Neoadjuvant
therapy |
|
|
|
|
|
NAC+RT | 23 | 66.1 | 0.77
(0.30-1.98) | 0.578 |
|
NAC | 21 | 32.7 |
|
|
| Pathological tumor
size (mm) |
|
|
|
|
|
≥20 | 32 | 66.1 | 1.55
(0.55-5.49) | 0.425 |
|
<20 | 12 | NR |
|
|
| Lymph node
metastasis |
|
|
|
|
|
Positive | 15 | 32.7 | 2.06
(0.78-5.24) | 0.139 |
|
Negative | 29 | NR |
|
|
| Lymphatic
invasion |
|
|
|
|
|
Positive | 23 | 32.2 | 1.38
(0.54-3.62) | 0.496 |
|
Negative | 21 | 66.1 |
|
|
| Vascular
invasion |
|
|
|
|
|
Positive | 35 | 32.1 | 1.86
(0.61-8.08) | 0.299 |
|
Negative | 9 | 66.1 |
|
|
| Perineural
invasion |
|
|
|
|
|
Positive | 38 | 66.1 | 1.98
(0.56-12.61) | 0.324 |
|
Negative | 6 | NR |
|
|
| CAP criteria |
|
|
|
|
| Grade
1, 2 | 20 | NR | 0.40
(0.15-1.05) | 0.063 |
| Grade
3 | 24 | 32.2 |
|
|
| Evans criteria |
|
|
|
|
| Grade
1 | 15 | NR | 0.80
(0.25-2.12) | 0.659 |
| Grade
2, 3 | 29 | 66.1 |
|
|
| Histological
necrosis |
|
|
|
|
|
Positive | 15 | 17.0 | 11.94
(4.13-37.57) |
<0.001 |
|
Negative | 29 | NR |
|
|
| Histological large
necrosis |
|
|
|
|
|
Positive | 11 | 15.2 | 39.25
(9.54-267.97) |
<0.001 |
|
Negative | 33 | NR |
|
|
| Table IV.Univariate risk analyses of
prognostic factors associated with RFS in the NAT group (n=44). |
Table IV.
Univariate risk analyses of
prognostic factors associated with RFS in the NAT group (n=44).
|
|
|
| Univariate
analysisa |
|---|
| Variable | n | Median RFS
(months) | RR (95% CI) | P-value |
|---|
| Age (years) |
|
|
|
|
|
≥75 | 6 | 19.6 | 0.70
(0.17-2.02) | 0.543 |
|
<75 | 38 | 16.6 |
|
|
| Sex |
|
|
|
|
|
Male | 28 | 16.6 | 2.32
(0.98-6.38) | 0.056 |
|
Female | 16 | NR |
|
|
| Body mass index
(kg/m2) |
|
|
|
|
|
≥25 | 8 | 16.6 | 1.19
(0.40-2.92) | 0.736 |
|
<25 | 36 | 20.2 |
|
|
| Local tumor
extent |
|
|
|
|
|
Potentially resectable | 15 | 14.4 | 1.11
(0.48-2.43) | 0.794 |
|
Borderline resectable | 29 | 18.5 |
|
|
| Tumor location |
|
|
|
|
|
Head | 28 | 18.5 | 0.93
(0.43-2.13) | 0.860 |
| Body
and tail | 16 | 16.6 |
|
|
| Clinical tumor size
(mm) |
|
|
|
|
|
≥20 | 24 | 13.6 | 1.64
(0.76-3.68) | 0.209 |
|
<20 | 20 | 21.1 |
|
|
| CA-9 before NAT
(IU/ml) |
|
|
|
|
|
≥37 | 28 | 18.5 | 1.22
(0.56-2.88) | 0.625 |
|
<37 | 16 | 21.1 |
|
|
| Neoadjuvant
therapy |
|
|
|
|
|
NAC+RT | 23 | 18.5 | 0.93
(0.42-2.02) | 0.849 |
|
NAC | 21 | 16.3 |
|
|
| Pathological tumor
size (mm) |
|
|
|
|
|
≥20 | 32 | 16.6 | 1.94
(0.78-5.83) | 0.157 |
|
<20 | 12 | 28.5 |
|
|
| Lymph node
metastasis |
|
|
|
|
|
Positive | 15 | 16.3 | 1.74
(0.77-3.80) | 0.175 |
|
Negative | 29 | 20.2 |
|
|
| Lymphatic
invasion |
|
|
|
|
|
Positive | 23 | 16.3 | 1.05
(0.48-2.28) | 0.912 |
|
Negative | 21 | 18.5 |
|
|
| Vascular
invasion |
|
|
|
|
|
Positive | 35 | 16.6 | 1.13
(0.44-2.59) | 0.779 |
|
Negative | 9 | 20.2 |
|
|
| Perineural
invasion |
|
|
|
|
|
Positive | 38 | 18.0 | 2.93
(0.86-18.40) | 0.093 |
|
Negative | 6 | NR |
|
|
| CAP criteria |
|
|
|
|
| Grade
1, 2 | 20 | 21.1 | 0.56
(0.25-1.25) | 0.156 |
| Grade
3 | 24 | 14.4 |
|
|
| Evans criteria |
|
|
|
|
| Grade
1 | 15 | 21.1 | 0.87
(0.40-2.53) | 0.866 |
| Grade
2, 3 | 29 | 18.0 |
|
|
| Histological
necrosis |
|
|
|
|
|
Positive | 15 | 9.4 | 6.40
(2.68-15.62) | <0.001 |
|
Negative | 29 | 28.5 |
|
|
| Histological large
necrosis |
|
|
|
|
|
Positive | 11 | 5.9 | 17.35
(5.71-58.92) | <0.001 |
|
Negative | 33 | 25.0 |
|
|
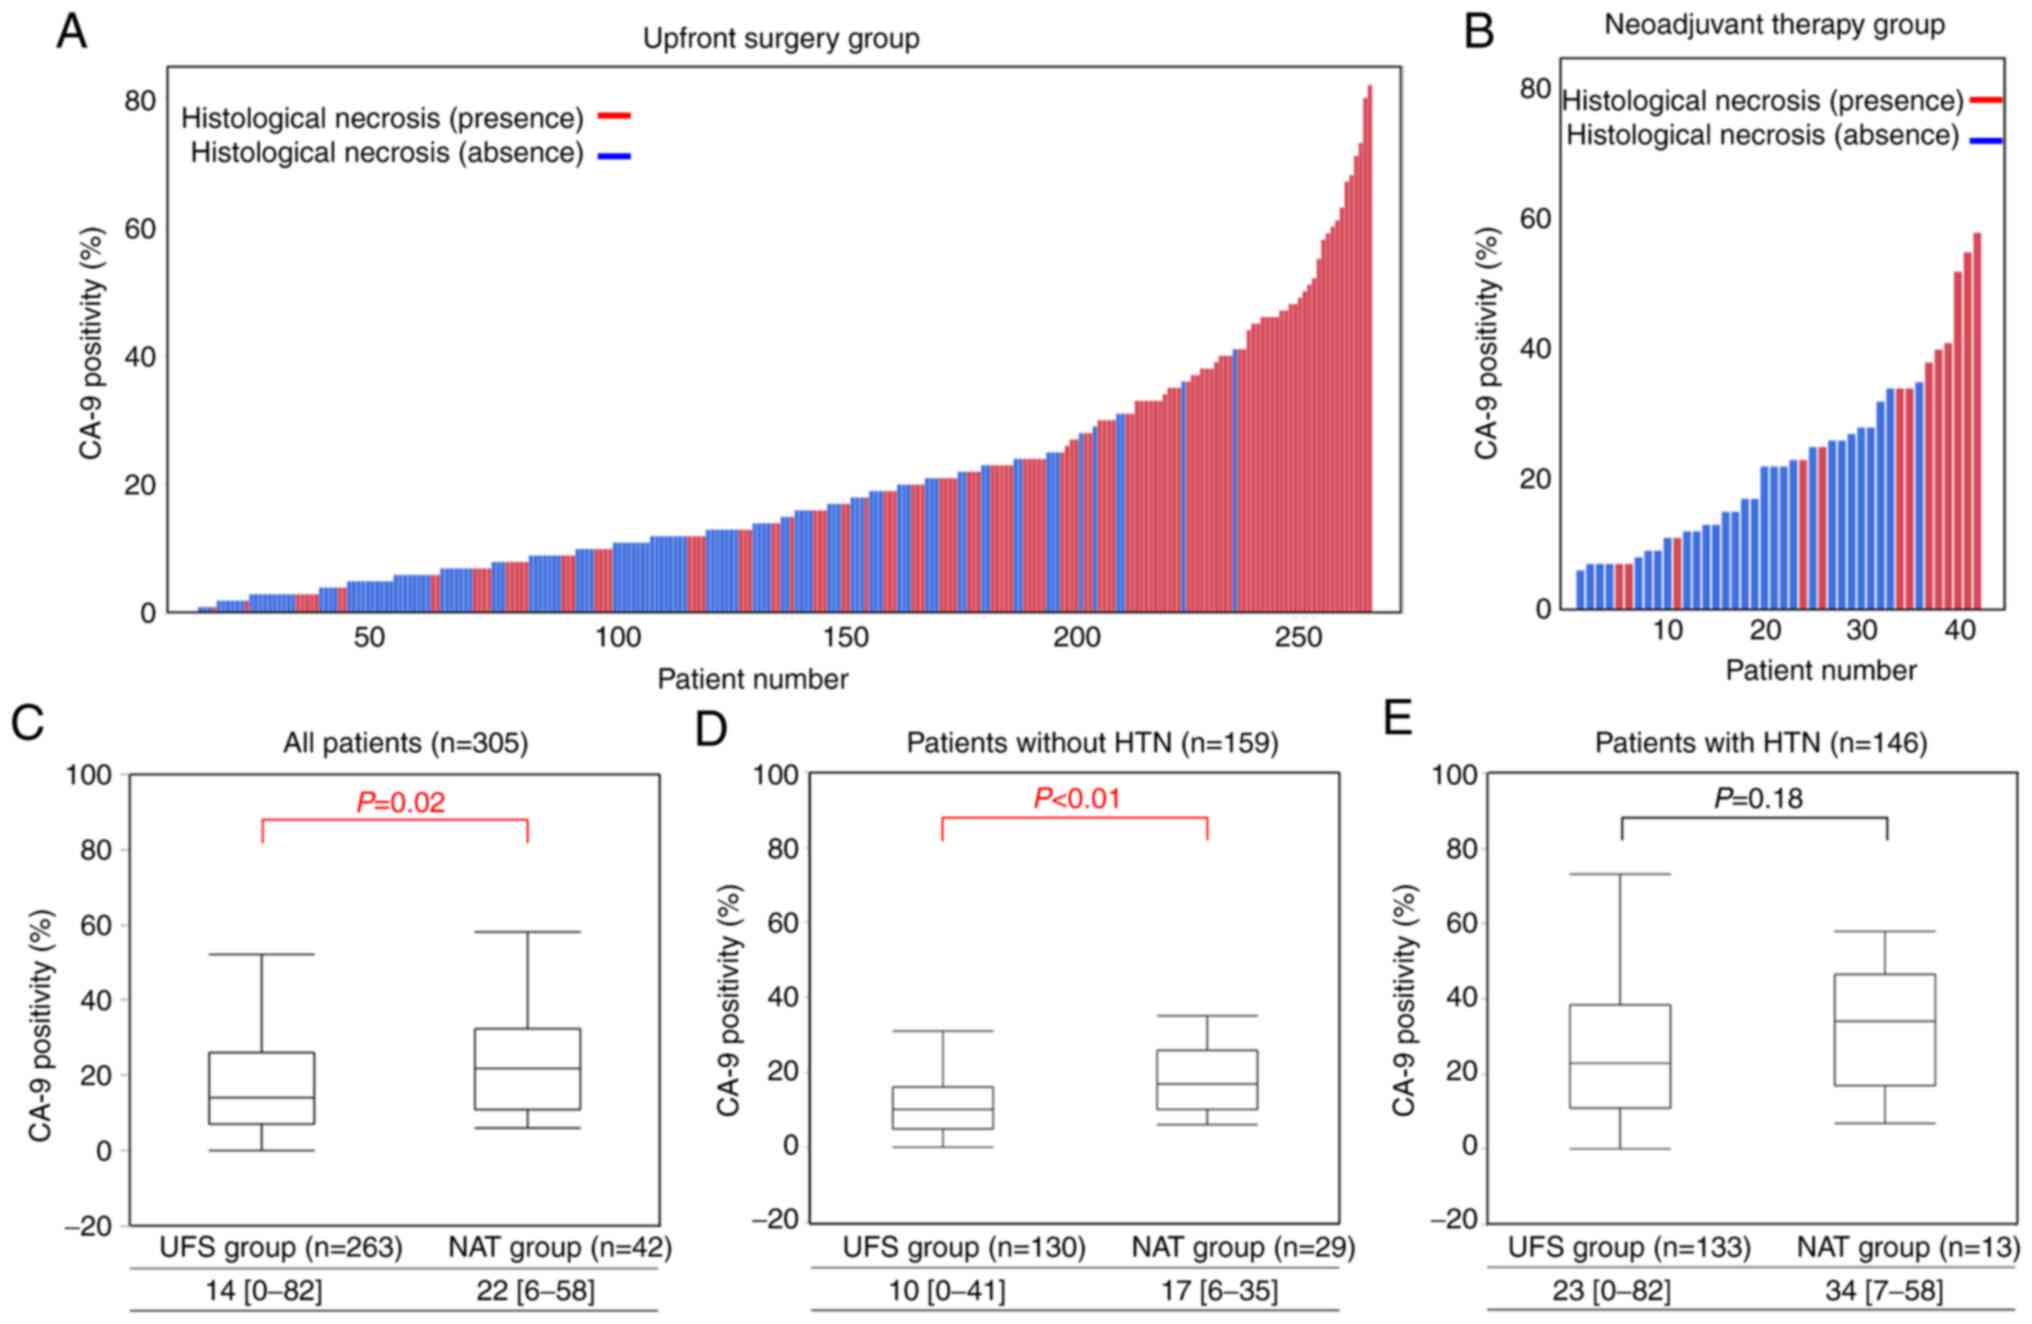
Correlation between CA-9 positivity
and HTN
Of the 307 patients who were reviewed,
paraffin-embedded tissue sections of two patients in the NAT group
were not available. Thus, immunohistochemical analyses of CA-9 were
performed in 305 patients. Histograms of CA-9 positivity for each
patient in the UFS and NAT groups are shown in Fig. 3A and B, and the correlation between
CA-9 positivity and HTN is able to be visualized in both the UFS
and NAT groups. The median CA-9 positivity was higher in cases with
than without HTN in the UFS group (23 vs. 10%, P<0.01), and a
similar result was obtained in the NAT group (34 vs. 17%,
P<0.01, Table SI). Moreover,
predominant distribution of CA-9-positive tumor cells was
frequently observed around HTN (Fig.
1G and H).
Comparisons of distributions with box plots of CA-9
positivity between the UFS and NAT groups are shown in Fig. 3C-E. Overall, the NAT group showed
more prominent CA-9 positivity than the UFS group (22 vs. 14%,
P=0.02, Fig. 3C). In patients
without HTN, median CA-9 positivity was very low in the UFS group,
whereas it was upregulated in the NAT Group (17% vs. 10%,
P<0.01, Fig. 3D). On the other
hand, in patients with HTN, median CA-9 positivity was high even in
the UFS Group (23%) and was not upregulated in the NAT group (34%)
(P=0.18, Fig. 3E). We hypothesized
that CA-9 positivity is increased after NAT in all patients.
However, baseline CA-9 expression in the UFS group was already
correlated with HTN, and it was not significantly upregulated by
NAT in patients with HTN.
Discussion
In the present study, first, the histological
features of pancreatic cancer were compared between the upfront
surgery (UFS) and neoadjuvant therapy (NAT) groups to estimate the
morphological alteration of histological tumor necrosis (HTN) after
NAT. The factors associated with a poor prognosis, such as lymph
node metastasis, lymphatic invasion, venous invasion, neural
invasion, and HTN, were significantly less frequent in the NAT
group. Next, the risk factors for relapse-free survival (RFS) and
disease-specific survival (DSS) were investigated, and it was found
that HTN was a prognostic factor in the NAT group. Finally, the
correlation between HTN and the hypoxic tumor microenvironment
represented by CA-9 expression was investigated, and higher CA-9
positivity was found in cases with HTN in both the UFS and NAT
groups.
The present study demonstrated drastic histological
alterations after NAT. The frequency of HTN, lymph node metastasis,
lymphatic invasion, venous invasion, and neural invasion in the NAT
group was lower than that in the UFS group. Some reasons are as
follows. First, NAT may reduce lymph node metastasis, vascular
invasion, and HTN. A previous study reported that lymph node
metastasis was significantly decreased after NAT, and some of these
histological responses contribute to survival benefit in patients
with pancreatic cancer (18).
Second, the present study was designed to include only patients who
underwent radical surgery; therefore, some patients who failed to
complete NAT because of disease progression were not included.
Patients who failed to complete NAT might have factors associated
with a poor prognosis, such as HTN, lymph node metastasis,
lymphatic invasion, venous invasion, and neural invasion. Thus,
there might be a potential bias in the treatment choice of whether
to perform UFS or NAT after radical surgery.
Many prognostic factors in pancreatic cancer without
NAT were reported, and these prognostic factors were re-evaluated
in patients with NAT in the present study (13,19–22).
The present results suggest that some of the robust prognostic
factors in the UFS group do not hold in the NAT group. For example,
in the UFS group, lymph node metastasis and HTN were independent
predictors of DSS and RFS on multivariate risk analyses (Tables SII and SIII). However, lymph node metastasis was
not associated with DSS and RFS in the NAT group in the present
study (Tables III and IV). In this way, prognostic factors in
the UFS group might be changed after NAT and interfere with the
prediction of clinical outcomes in the NAT group. Similar problems
in tumors originating from other organs were reported in a previous
study (19), and risk
stratification of pancreatic cancer in patients with NAT should be
distinctively established in the future. In the case of HTN, we
previously reported that HTN was strongly associated with a poor
prognosis in patients without NAT (5), and its utility was successfully
extended for the NAT group in the present study.
Resistance to chemotherapy and/or radiotherapy was
strongly associated with a hypoxic tumor microenvironment. Previous
studies reported that a gemcitabine-induced hypoxic tumor
microenvironment is associated with chemo-resistance (23,24).
Thus, various therapeutic agents have been proposed to target the
hypoxic tumor microenvironment in pancreatic cancer (25–27).
Pathologically, Hiraoka et al reported that a hypoxic tumor
microenvironment is closely associated with HTN in patients without
NAT (7), and the present study
also confirmed the significant correlations between HTN and CA-9
expression in both the UFS and NAT groups. In addition, CA-9
expression in cancer cells was upregulated after NAT in the entire
patient cohort. Therefore, tumor hypoxia may also be increased by
preoperative treatment. Further, CA-9 expression was higher in
patients with HTN than in those without HTN in the UFS group, and
it was not significantly upregulated after NAT in the subgroup
analysis of patients with HTN. These results suggest that the
hypoxic tumor microenvironment was already formed around HTN in
pancreatic cancer before NAT, and the hypoxic microenvironment
cannot be improved by NAT. Summarizing the above results, tumor
hypoxia is increased in pancreatic cancer with HTN. Particularly in
cases without HTN, NAT increases tumor hypoxia. These results are
consistent with previous reports and may support the development of
treatments using concomitant hypoxia-alleviating therapy and
conventional chemotherapy.
We previously reported that HTN can be detected as
poorly enhanced areas (PEAs) on preoperative computed tomography,
and the presence of PEAs was found to be associated with a poor
prognosis of resectable pancreatic cancer in the UFS group
(5). In addition to the potential
prediction of patient prognosis, PEAs may represent tumor hypoxia
and subsequent resistance to NAT without the need for histological
examination. Sugimoto et al reported that only 42% of the
patients planned for NAT followed by surgery were able to undergo
subsequent surgical resection, mainly due to disease progression
during NAT (3). Therefore, use of
PEAs to survey tumor physiological conditions and drug resistance
in pancreatic cancer, as well as predict drug resistance before
NAT, should be investigated.
The main limitation of the present work is that it
was a single-institute, retrospective study with a relatively small
number of patients undergoing NAT. In particular, it was difficult
to demonstrate a significant difference in the Kaplan-Meier curves
among the three groups according to the size of necrosis because
only 4 patients with small necrosis were included. Thus, the
results should be validated in a larger-scale study. Another
limitation of this study is that it was difficult to evaluate the
histological change associated with NAT and surgery. Tumor necrosis
is sometimes associated with therapy and sometimes not, but it is
difficult to distinguish the original HTN from the HTN that
occurred as the result of therapy. Moreover, autolysis, which is
caused by ischemia with surgical procedures, potentially affects
the histological assessment of tumor necrosis. This was a
retrospective study, and there was no precise protocol for
management of fresh surgical samples. The impact of NAT and
surgical procedures on histological changes in pancreatic cancer
would be the next subject to examine in future studies. The last
limitation of this study is related to the mechanism of HTN
generation. As far as we know, the basic mechanisms of HTN
generation in pancreatic cancer are still unclear. Further basic
investigation is needed to establish novel treatments targeting HTN
and the hypoxic microenvironment.
In conclusion, HTN is a robust prognostic marker in
pancreatic cancer patients after NAT. Furthermore, the results
suggest a close association between HTN and tumor hypoxia and may
support the concomitant use of hypoxia-alleviating therapy before
or together with NAT. Clinical detection of HTN is a potential
biomarker of prognosis and therapeutic response in pancreatic
cancer patients.
Supplementary Material
Supporting Data
Supporting Data
Acknowledgements
The authors would like to thank all participating
patients and their families who made this study possible.
Funding
Funding: This research did not receive any specific grant from
funding agencies in the public, commercial, or not-for-profit
sectors.
Availability of data and materials
The datasets generated and/or analyzed during the
present study are available from the corresponding author upon
reasonable request.
Authors' contributions
MKudo designed the study and wrote the initial draft
of the manuscript. MKudo contributed to analysis and interpretation
of the data and assisted in the preparation of the manuscript. GI,
NG, MKonishi, ST, SK, MS, JDM, HC, and MKojima contributed to data
collection and interpretation and critically reviewed the
manuscript. All authors approved the final version of the
manuscript and agree to be accountable for all aspects of the work
in ensuring that questions related to the accuracy or integrity of
any part of the work (in addition to the data provided) are
appropriately investigated and resolved.
Ethics approval and consent to
participate
Patient tissue samples were collected between 2011
and 2019 at the Department of Pathology, National Cancer Center
Hospital East, Kashiwa, Japan. This study protocol conformed to the
ethical guidelines of the 1975 Declaration of Helsinki and was
approved by the Institutional Review Board of the National Cancer
Center, Japan (reference 2017-328), and informed consent was
obtained from all patients.
Patient consent for publication
Not applicable.
Competing interests
John D. Martin is an employee of NanoCarrier Co.,
Ltd. The other authors have no competing interests.
Glossary
Abbreviations
Abbreviations:
|
CA-9
|
carbonic anhydrase 9
|
|
CI
|
confidence interval
|
|
DSS
|
disease-specific survival
|
|
HTN
|
histological tumor necrosis
|
|
NAT
|
neoadjuvant therapy
|
|
PEAs
|
poorly enhanced areas
|
|
RFS
|
relapse-free survival
|
|
RR
|
risk ratio
|
|
UFS
|
upfront surgery
|
References
|
1
|
Siegel RL, Miller KD and Jemal A: Cancer
statistics, 2018. CA Cancer J Clin. 68:7–30. 2018. View Article : Google Scholar : PubMed/NCBI
|
|
2
|
Zhan HX, Xu JW, Wu D, Wu ZY, Wang L, Hu SY
and Zhang GY: Neoadjuvant therapy in pancreatic cancer: A
systematic review and meta-analysis of prospective studies. Cancer
Med. 6:1201–1219. 2017. View Article : Google Scholar : PubMed/NCBI
|
|
3
|
Sugimoto M, Takahashi N, Farnell MB, Smyrk
TC, Truty MJ, Nagorney DM, Smoot RL, Chari ST, Carter RE and
Kendrick ML: Survival benefit of neoadjuvant therapy in patients
with non-metastatic pancreatic ductal adenocarcinoma: A propensity
matching and intention-to-treat analysis. J Surg Oncol.
120:976–984. 2019. View Article : Google Scholar
|
|
4
|
Unno M, Hata T and Motoi F: Long-term
outcome following neoadjuvant therapy for resectable and borderline
resectable pancreatic cancer compared to upfront surgery: A
meta-analysis of comparative studies by intention-to-treat
analysis. Surg Today. 49:295–299. 2019. View Article : Google Scholar : PubMed/NCBI
|
|
5
|
Kudo M, Kobayashi T, Gotohda N, Konishi M,
Takahashi S, Kobayashi S, Sugimoto M, Okubo S, Martin J, Cabral H,
et al: Clinical utility of histological and radiological
evaluations of tumor necrosis for predicting prognosis in
pancreatic cancer. Pancreas. 49:634–641. 2020. View Article : Google Scholar : PubMed/NCBI
|
|
6
|
Mitsunaga S, Hasebe T, Iwasaki M,
Kinoshita T, Ochiai A and Shimizu N: Important prognostic
histological parameters for patients with invasive ductal carcinoma
of the pancreas. Cancer Sci. 96:858–865. 2005. View Article : Google Scholar
|
|
7
|
Hiraoka N, Ino Y, Sekine S, Tsuda H,
Shimada K, Kosuge T, Zavada J, Yoshida M, Yamada K, Koyama T and
Kanai Y: Tumour necrosis is a postoperative prognostic marker for
pancreatic cancer patients with a high interobserver
reproducibility in histological evaluation. Br J Cancer.
103:1057–1065. 2010. View Article : Google Scholar : PubMed/NCBI
|
|
8
|
Okusaka T, Nakamura M, Yoshida M, Kitano
M, Uesaka K, Ito Y, Furuse J, Hanada K and Okazaki K: Clinical
practice guidelines for pancreatic cancer 2019 from the Japan
Pancreas Society: A synopsis. Pancreas. 49:326–335. 2020.
View Article : Google Scholar : PubMed/NCBI
|
|
9
|
Takahashi S: How to treat borderline
resectable pancreatic cancer: Current challenges and future
directions. Jpn J Clin Oncol. 48:205–213. 2018. View Article : Google Scholar
|
|
10
|
Motoi F, Kosuge T, Ueno H, Yamaue H, Satoi
S, Sho M, Honda G, Matsumoto I, Wada K, Furuse J, et al: Randomized
phase II/III trial of neoadjuvant chemotherapy with gemcitabine and
S-1 versus upfront surgery for resectable pancreatic cancer
(Prep-02/JSAP05). Jpn J Clin Oncol. 49:190–194. 2019. View Article : Google Scholar
|
|
11
|
Takahashi S, Ohno I, Ikeda M, Kobayashi T,
Akimoto T, Kojima M, Konishi M and Uesaka K: Neoadjuvant S-1 with
concurrent radiotherapy followed by surgery for borderline
resectable pancreatic cancer: Study protocol for an open-label,
multicentre, prospective phase II trial (JASPAC05). BMJ Open.
7:e0184452017.PubMed/NCBI
|
|
12
|
Takahashi S, Ohno I, Ikeda M, Konishi M,
Kobayashi T, Akimoto T, Kojima M, Morinaga S, Toyama H, Shimizu Y,
et al: Neoadjuvant S-1 with concurrent radiotherapy followed by
surgery for borderline resectable pancreatic cancer: A phase II
open-label multicenter prospective trial (JASPAC05). Ann Surg. Oct
15–2020.(Epub ahead of print). doi: 10.1097/SLA.0000000000004535.
View Article : Google Scholar
|
|
13
|
Okubo S, Kojima M, Matsuda Y, Hioki M,
Shimizu Y, Toyama H, Morinaga S, Gotohda N, Uesaka K, Ishii G, et
al: Area of residual tumor (ART) can predict prognosis after post
neoadjuvant therapy resection for pancreatic ductal adenocarcinoma.
Sci Rep. 9:171452019. View Article : Google Scholar : PubMed/NCBI
|
|
14
|
Brierley JD, Gospodarowicz MK and
Wittekind C: TNM Classification of Malignant Tumours. John Wiley
and Sons; 2017
|
|
15
|
N Kalimuthu S, Serra S, Dhani N,
Hafezi-Bakhtiari S, Szentgyorgyi E, Vajpeyi R and Chetty R:
Regression grading in neoadjuvant treated pancreatic cancer: An
interobserver study. J Clin Pathol. 70:237–243. 2017. View Article : Google Scholar
|
|
16
|
Evans DB, Rich TA, Byrd DR, Cleary KR,
Connelly JH, Levin B, Charnsangavej C, Fenoglio CJ and Ames FC:
Preoperative chemoradiation and pancreaticoduodenectomy for
adenocarcinoma of the pancreas. Arch Surg. 127:1335–1339. 1992.
View Article : Google Scholar : PubMed/NCBI
|
|
17
|
Aperio Positive Pixel Count Algorithm.
Journal. 2020.
|
|
18
|
Mirkin KA, Greenleaf EK, Hollenbeak CS and
Wong J: Correlation of clinical and pathological staging and
response to neoadjuvant therapy in resected pancreatic cancer. Int
J Surg. 52:221–228. 2018. View Article : Google Scholar : PubMed/NCBI
|
|
19
|
Sakuyama N, Kojima M, Kawano S, Matsuda Y,
Mino-Kenudson M, Ochiai A and Ito M: Area of residual tumor is a
robust prognostic marker for patients with rectal cancer undergoing
preoperative therapy. Cancer Sci. 109:871–878. 2018. View Article : Google Scholar
|
|
20
|
Kawai M, Hirono S, Okada KI, Miyazawa M,
Shimizu A, Kitahata Y, Kobayashi R, Ueno M, Hayami S, Tanioka K and
Yamaue H: Low lymphocyte monocyte ratio after neoadjuvant therapy
predicts poor survival after pancreatectomy in patients with
borderline resectable pancreatic cancer. Surgery. 165:1151–1160.
2019. View Article : Google Scholar : PubMed/NCBI
|
|
21
|
Lei MZ, Li XX, Zhang Y, Li JT, Zhang F,
Wang YP, Yin M, Qu J and Lei QY: Acetylation promotes BCAT2
degradation to suppress BCAA catabolism and pancreatic cancer
growth. Signal Transduct Target Ther. 5:702020. View Article : Google Scholar : PubMed/NCBI
|
|
22
|
Zheng Y, Wu C, Yang J, Zhao Y, Jia H, Xue
M, Xu D, Yang F, Fu D, Wang C, et al: Insulin-like growth factor
1-induced enolase 2 deacetylation by HDAC3 promotes metastasis of
pancreatic cancer. Signal Transduct Target Ther. 5:532020.
View Article : Google Scholar : PubMed/NCBI
|
|
23
|
Arora S, Bhardwaj A, Singh S, Srivastava
SK, McClellan S, Nirodi CS, Piazza GA, Grizzle WE, Owen LB and
Singh AP: An undesired effect of chemotherapy: Gemcitabine promotes
pancreatic cancer cell invasiveness through reactive oxygen
species-dependent, nuclear factor κB- and hypoxia-inducible factor
1α-mediated up-regulation of CXCR4. J Biol Chem. 288:21197–21207.
2013. View Article : Google Scholar : PubMed/NCBI
|
|
24
|
Däster S, Amatruda N, Calabrese D, Ivanek
R, Turrini E, Droeser RA, Zajac P, Fimognari C, Spagnoli GC, Iezzi
G, et al: Induction of hypoxia and necrosis in multicellular tumor
spheroids is associated with resistance to chemotherapy treatment.
Oncotarget. 8:1725–1736. 2017. View Article : Google Scholar
|
|
25
|
Hoang NT, Kadonosono T, Kuchimaru T and
Kizaka-Kondoh S: Hypoxia-inducible factor-targeting prodrug TOP3
combined with gemcitabine or TS-1 improves pancreatic cancer
survival in an orthotopic model. Cancer Sci. 107:1151–1158. 2016.
View Article : Google Scholar
|
|
26
|
Shannon AM, Bouchier-Hayes DJ, Condron CM
and Toomey D: Tumour hypoxia, chemotherapeutic resistance and
hypoxia-related therapies. Cancer Treat Rev. 29:297–307. 2003.
View Article : Google Scholar : PubMed/NCBI
|
|
27
|
Chauhan VP, Martin JD, Liu H, Lacorre DA,
Jain SR, Kozin SV, Stylianopoulos T, Mousa AS, Han X,
Adstamongkonkul P, et al: Angiotensin inhibition enhances drug
delivery and potentiates chemotherapy by decompressing tumour blood
vessels. Nat Commun. 4:25162013. View Article : Google Scholar : PubMed/NCBI
|