Introduction
Breast cancer (BC) is the most frequent malignant
tumor in women worldwide since 2020 and is characterized by occult
disease, easy metastasis and recurrence, and a poor prognosis
(1,2). With respect to the prognostic
evaluation of BC, estimating the size of the primary tumor,
involvement of local lymph nodes and occurrence of distant
metastases is crucial (3).
However, BC is a highly heterogeneous tumor histologically
(4), and patients diagnosed in the
same disease stage and receiving the same treatment usually show
very different clinical responses and survival times (5). Recently, endocrine therapy has
emerged as a breakthrough in BC treatment; however, the existence
of different tumor types, such as triple-negative BC, limits the
efficacy and promotion of immunotherapy (6). Therefore, the search for new
therapeutic agents and therapeutic targets is urgent.
With the development of molecular biology, the
expression and significance of related tumor markers in cancer are
gradually being recognized. The study of tumor markers in BC
tissues is increasing (7,8). c-Myc promoter binding protein 1
(MBP-1) targets and regulates the expression of various cell
proliferation-, apoptosis-, and oncology-related genes (9). A previous study demonstrated that
MBP1 suppressed the proliferation and metastasis of gastric cancer
cells via COX-2 (10). In
addition, MBP1 overexpression inhibited the proliferation of
various cancer cells, including breast cancer cells (11,12).
In vivo studies have shown that MBP-1 inhibited BC
proliferation and metastasis in immunocompetent mice (13). Human BC cells infected with the
overexpression MBP1 lentivirus inhibited tumor proliferation in
nude mice (14). Clinical studies
have also confirmed that MBP1 is a potential prognostic marker for
invasive ductal carcinoma (15,16).
A study suggest that low MBP1 expression in BC was associated with
a poor patient prognosis (17);
however, the potential mechanisms are unclear.
The present study aimed to investigate the roles and
underlying mechanisms of MBP-1 on BC proliferation in vivo
and in vitro and provide insights for future studies and
clinical application.
Materials and methods
Patients and clinical samples
A total of 50 pairs of BC and adjacent normal (N)
tissues were collected from Hubei Cancer Hospital (Wuhan, China)
between December 2019 and May 2020. The patients with BC were aged
between 55 and 65 years, and received no drug therapy before tumor
removal. Immediately following surgery, all the tissues were frozen
in liquid nitrogen and maintained at −80°C until further analysis.
All the clinical samples were collected with written informed
consent from the patients, and the protocol was approved by the
Ethics Committee of Hubei Cancer Hospital (approval no.
2021-IEC213).
Cell culture
The breast MCF10A epithelial cell line, the BC cell
lines (MDA231, MCF7, MDA468 and BT474) and 293T cell line were
purchased from BeNa Culture Collection (Beijing, China). The cell
lines were free from mycoplasma contamination. The MDA231, MCF7,
MDA468 and BT474 cell lines were cultured in DMEM supplemented with
10% FBS and 100 U/ml penicillin and streptomycin (all from Gibco;
Thermo Fisher Scientific, Inc.). The MCF10A cell line was
maintained in RPMI-1640 medium (Gibco; Thermo Fisher Scientific,
Inc.) supplemented with 10% FBS (Gibco; Thermo Fisher Scientific,
Inc.) and 1% penicillin and streptomycin (ScienCell Research
Laboratories, Inc.). The cell lines were maintained at 37°C in a
humidified atmosphere with 5% CO2. In addition, hypoxia
treatment comprised 94% N2, 5% CO2 and 1%
O2 at 37°C for different durations under hypoxic
conditions. Hypoxia was simulated by culturing cells with
CoCl2 (Sigma-Aldrich) at a final concentration of 100
µM.
Transfection and infection
The short hairpin (sh)RNAs targeting MBP1 and the
corresponding negative control (NC) shRNA were constructed by
TSINGKE (Tianjin, China) and were transfected with
Lipofectamine® 2000 (Invitrogen; Thermo Fisher
Scientific, Inc.) at a final concentration of 50 ng and 37°C for 48
h. Transient transfection was confirmed using reverse
transcription-quantitative PCR (RT-qPCR) and western blot analysis.
The following shRNA MBP1sequences were used: MBP1 sense,
5′-GCUGCUUACUGUAACUGUAUC-3′ and antisense,
5′-UACAGUUACAGUAAGCAGCUG-3′; NC shRNA sense,
5′-AAAAATTCAAGACUUGGAGCU-3′ and antisense,
5′-UCUUGTTUUUUUAGCUCCAAG-3′. MBP1 lentivirus (Lv-MBP1) and empty
control vector (Lv-NC) were constructed by Shanghai GeneChem Co.,
Ltd., according to the shRNA sequences of MBP1 based on 3rd
generation system. Recombinant lentiviruses were amplified (Plasmid
transfection concentration: 20 µg/1×107 cells) in 293T
cells and purified by centrifugation and subsequent analysis. The
recombinant lentiviruses were stably infected into the BC cell
lines (MCF7 and MDA231) at a multiplicity of 2 and 37°C for 48 h.
Cells were used for subsequent experiments after 3 days of
puromycin selection at a final concentration of 2 µg/ml. All the
experiments were repeated independently at least three times.
Cell Counting Kit (CCK)-8
The BC cells were counted using the CCK-8 assay
according to the manufacturer's instructions to determine the
proliferative ability of the cells. The BC cells were seeded in
96-well plates and incubated at 37°C for 24 h. Next, CCK-8 solution
(10 µl) was added to each well and the cells were incubated for 2
h. Finally, the absorbance at 450 nm was analyzed. The experiment
was replicated independently three times.
Colony formation assay
Colony formation assays were performed as previously
described (18). All the colony
formation assays were conducted in triplicate.
RNA isolation and RT-qPCR
RT-qPCR was performed as previously described
(18). The following primers were
used: MBP1 forward, 5′-GGCGGTGACAGACTCCAAG-3′ and reverse,
5′-GAAGCTCGTCGGACTCTGAG-3′; β-catenin forward,
5′-AAAGCGGCTGTTAGTCACTGG-3′ and reverse,
5′-CGAGTCATTGCATACTGTCCAT-3′; and β-actin forward
5′-CCAAGGCCAACCGCGAGAAGATGAC-3′ and reverse
5′-AGGGTACATGGTGGTGCCGCCAGAC-3′. The experiments were performed in
triplicate using a Bio-Rad CFX96 thermocycler (Bio-Rad
Laboratories, Inc.), and the relative expression values were
calculated using the 2−∆∆Cq method (19).
Western blot analysis and
immunohistochemistry (IHC)
Western blot analysis was performed as previously
described (18). Briefly, protein
lysate from MCF7 and MDA231 cells was extracted using RIPA buffer
(Sigma-Aldrich; Merck KGaA) containing 1% PMSF and phosphatase
inhibitors. The protein concentration of each sample was determined
by a BCA protein assay kit (Beyotime, Shanghai, China). Denatured
protein samples (10 µg/lane) were separated by 8% SDS-PAGE and
trans-printed onto nitrocellulose filter (NC) membranes. The NC
membranes were blocked with 5% non-fat dried milk in Tris-buffered
saline (pH 7.4) containing 0.1% Tween-20 (TBST) for 1 h at room
temperature, and subsequently reacted with the specific primary
antibody in TBST at 4°C overnight. The membranes were washed for
three times in TBST, 10 min each, and were incubated with a
HRP-conjugated affinipure goat anti-rabbit IgG (H + L)
(Proteintech, SA00001-2, Wuhan, China, 1:4,000 dilution) for 1 h at
room temperature. Signal detection was developed using an enhanced
chemiluminescence reaction (Meilunbio, Dalian, China).
IHC was performed as previously described (18). Briefly, the obtained tissue was
incubated in 10% neutral formalin for 72 h at room temperature,
paraffin-embedded tumor tissues were serially sectioned at
5-µm-thick sections. Serial tissue sections were antigen retrieved
using 10 mM Sodium Citrate at 98°C for 20 min and were washed twice
with 100% ethanol and 95% ethanol for 10 min each. Then, tissue
sections were deparaffinized, blocked using 0.01 M citric acid
buffer (pH 6.0) at 95°C for 15 min and incubated overnight at 4°C
with primary antibodies followed by incubation for HRP-conjugated
AffiniPure Goat Anti-Rabbit IgG (Proteintech, SA00001-2, Wuhan,
China, 1:5,000 dilution) for 1 h at room temperature. Then nuclei
were counterstained using hematoxylin for 2 min at room
temperature. The sections were then examined using a light
microscope. The IHC results were scored by two independent
observers according to both the percentage of positively stained
cells (0, 1-25% staining; 1, 26-50% staining; 2, 51-75% staining;
3, 76-100% staining) and the staining intensity (scored from 0 to
3), and the final immunoreactivity score (IRS, range 0-9) was
obtained by multiplying the two scores. The expression levels were
classified as low if the score was less than 5 and as high if the
score was 5 or higher.
The following antibodies were used: MBP1 (cat. no.
24207-1-AP; 1:1,000 dilution for western blot, 1:200 dilution for
IHC), β-catenin (cat. no. 17565-1-AP; 1:1,000 dilution for western
blot), HIF-1α (20960-1-AP; 1:1,000 dilution for western blot) and
GAPDH (cat. no. 10494-1-AP; 1:2,000 dilution for western blot) (all
from ProteinTech Group, Inc.). All the experiments were repeated
independently at least three times.
Xenograft assay
The MCF7 cells (3×10⁶/mouse; >3/group)
were transfected with Lv-MBP1 or Lv-NC and subcutaneously injected
into the right flank of male BALB/c nude mice (6 weeks old; weight,
~15 g; 10 in total). All the nude mice were kept in a specific
pathogen-free environment with controllable light (12-h light/dark
cycle), temperature 18-29°C and relative humidity (40-70%) with
food and water available ad libitum. The mice were monitored
weekly, and the tumor volume was assessed; the long diameter of the
tumor did not exceed 2 cm. The following formula was used to
calculate the tumor volume: Volume (V)=LxW2 × π/6, where
L is the long diameter of the tumor and W is the short diameter of
the tumor. Approximately 3 weeks after injection, the xenograft
tumors had grown to a suitable size and met ethical requirements,
according to institutional ethical guidelines. Then, the mice (9
mice) were anaesthetized with isoflurane (induction dose, 3-4% and
maintenance dose, 1-1.5%) and sacrificed by humane cervical
dislocation. Death was determined by respiratory arrest and the
absence of chest fluctuations. The weights of the tumors were then
recorded. Notably, one mouse was not included due to insufficient
cell number during subcutaneous injection. The mouse experiments
and handling of the animals were performed according to the
Institutional and Animal Care and Use Committee of Hubei Cancer
Hospital (approval no. 2019252A) and the NIH Guide for the Care and
Use of Laboratory Animals.
Co-immunoprecipitation (Co-IP)
Co-IP assay was performed using Co-IP kit (Abs955,
Absin, Shanghai, China) according to the manufacturer's protocol.
Briefly, MCF7 or MDA231 cells were homogenized in IP lysis buffer
(20 mM Tris-HCl pH 7.5, 0.5% NP-40, 250 mM NaCl, 3 mM EDTA, 3 mM
EGTA, 1 mM DTT, 1 mM cocktail, 1 mM phosphoSTOP, 1 mM NEM, 1 mM
NAM). A total of 500 µg extracts were incubated with indicated
primary antibody or IgG as negative control for 4 h and protein
A/G-Sepharose beads for 2 h at 4°C. The following antibodies were
used: MBP1 (cat. no. 24207-1-AP; 1:200 dilution) and HIF-1α (cat.
no. 20960-1-AP; 1:200 dilution) (both from ProteinTech Group,
Inc.).
Luciferase assay
The β-catenin promoter region (2-kb sequence
upstream of the transcription initiation site) and mutant (MUT)
promoter were constructed into pGL3-based vectors. The BC cells
were transfected with MBP1-sh and Lv-MBP1 along with pGL3 β-catenin
using Lipofectamine® 2000 (Invitrogen; Thermo Fisher
Scientific, Inc.) at a final concentration of 50 ng. Firefly
luciferase activity was measured 48 h after transfection using the
Dual-Luciferase Reporter Assay System (Promega Corporation) and
normalized to Renilla luciferase activity. The reporter
plasmids were constructed by TSINGKE (Tianjin, China). All the
experiments were repeated at least three times independently.
Statistical analysis
All statistical analyses were performed using SPSS
v22.0 (IBM Corp.) software, and the figures were produced using
GraphPad Prism v6.0 (GraphPad Software, Inc.). The data were
presented as the mean ± SD, and differences between groups were
analyzed using either an unpaired Student's t-test or one-way ANOVA
followed by Tukey's post hoc test for experimental results. The
median value of RT-qPCR results was used as a cutoff value for
further analysis. Survival analysis was performed using the
Kaplan-Meier method and log-rank test. Univariate analyses were
performed using a χ2 test. Online website
(kmplot.com/analysis/) and data from TCGA were used for survival
analysis. The Human Protein Atlas (proteinatlas.org) was used for
analysis of MBP1 protein expression. P<0.05 was considered to
indicate a statistically significant difference.
Results
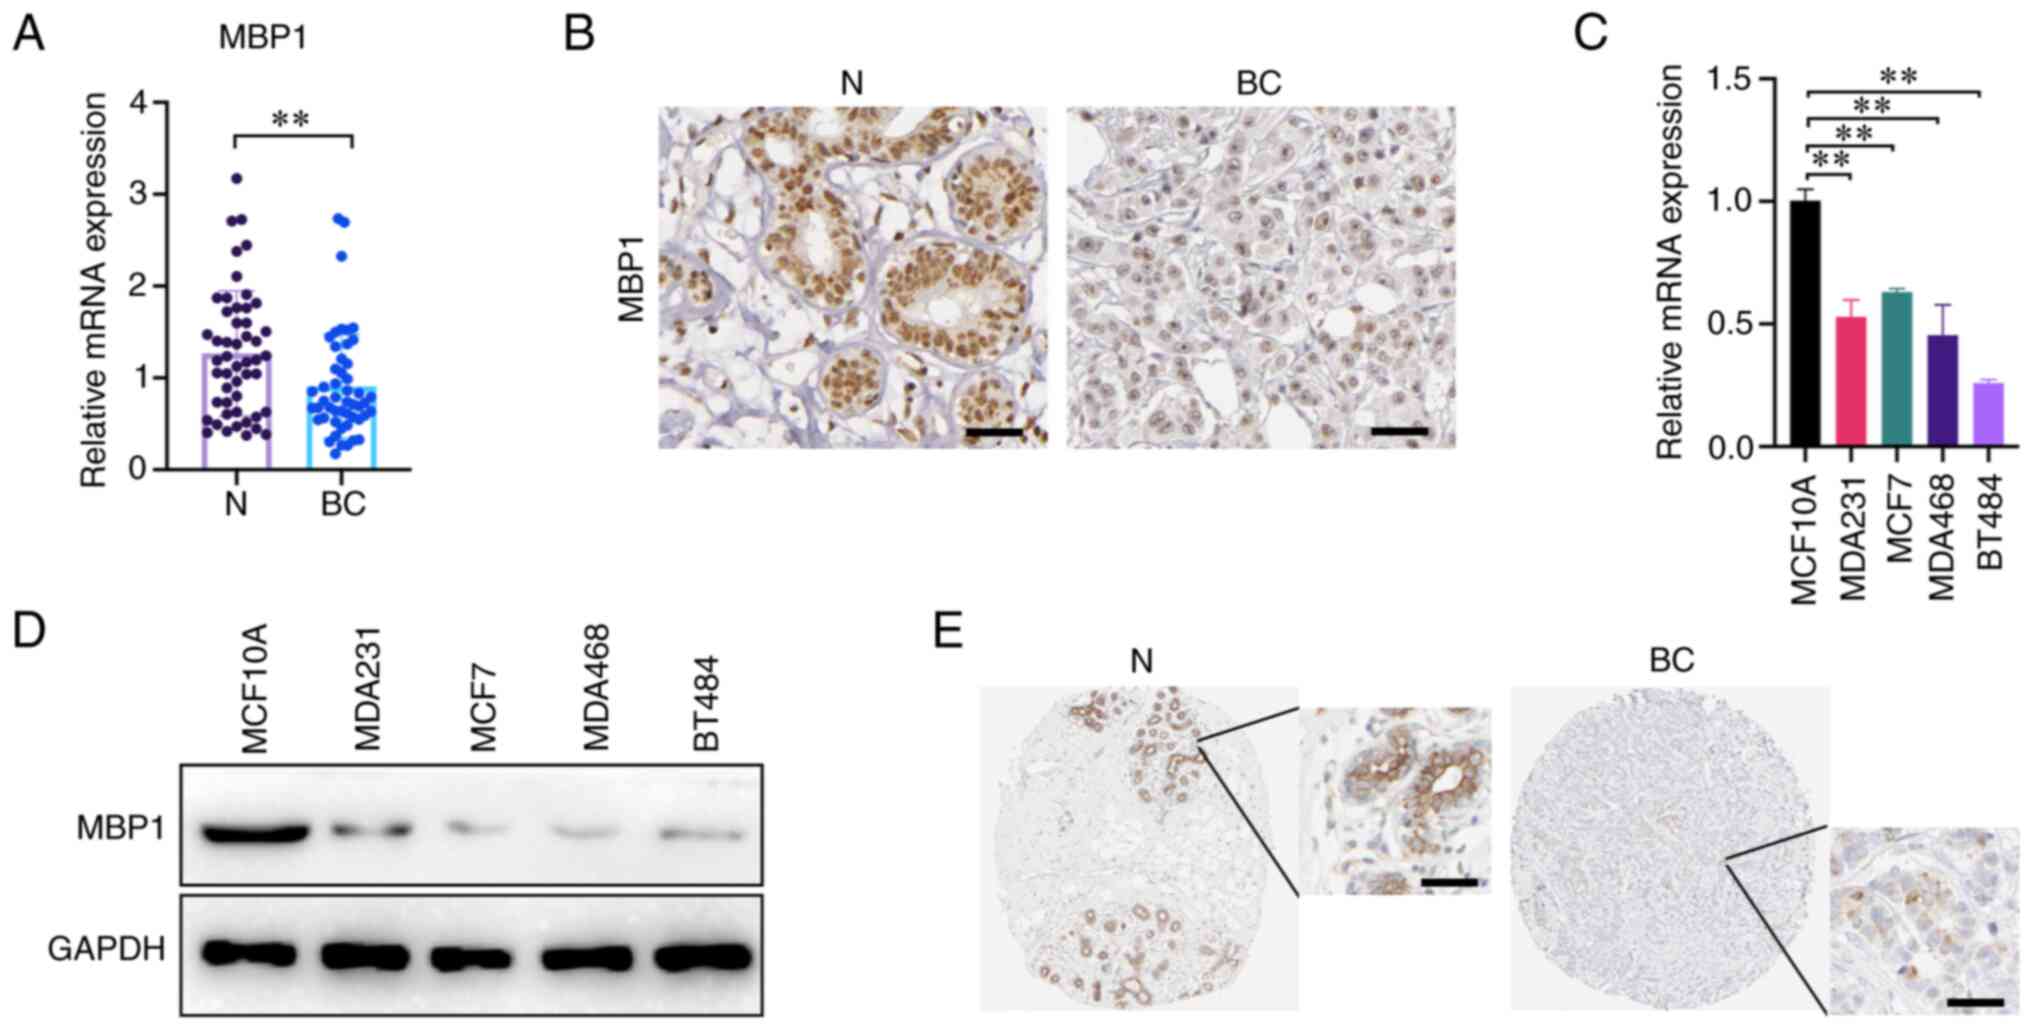
MBP1 is expressed at low levels in BC
tissues compared with that in adjacent tissue
To analyze the expression patterns of MBP1 in BC,
RT-qPCR was used to detect the mRNA expression level of MBP1 and
the results, from 50 clinical samples, indicated that the mRNA
expression levels of MBP1 were significantly reduced in BC tissues
compared with that in paired N tissues (Fig. 1A). The protein expression level of
MBP1 was detected using IHC and there was lower expression in BC
tissues compared with that in paired N tissues (Fig. 1B). To further verify the expression
results of MBP1 in clinical samples, RT-qPCR and western blot
analysis was used to determine the mRNA and protein expression
levels of MBP1 in the human breast epithelial cell line MCF10A and
four BC cell lines (MDA231, MCF7, MDA468 and BT474), respectively.
The mRNA and protein expression level of MBP1 in the four BC cell
lines was lower compared with that in the normal human breast
epithelial cell lines (Fig. 1C and
D). Lastly, online analysis from Human Protein Atlas
(proteinatlas.org) online database revealed that MBP1 protein
expression in BC was low compared with that in normal breast
epithelial cells (Fig. 1E). These
results uniformly demonstrate that MBP1 expression was reduced in
BC; therefore, MBP1 may be a tumor suppressor in BC.
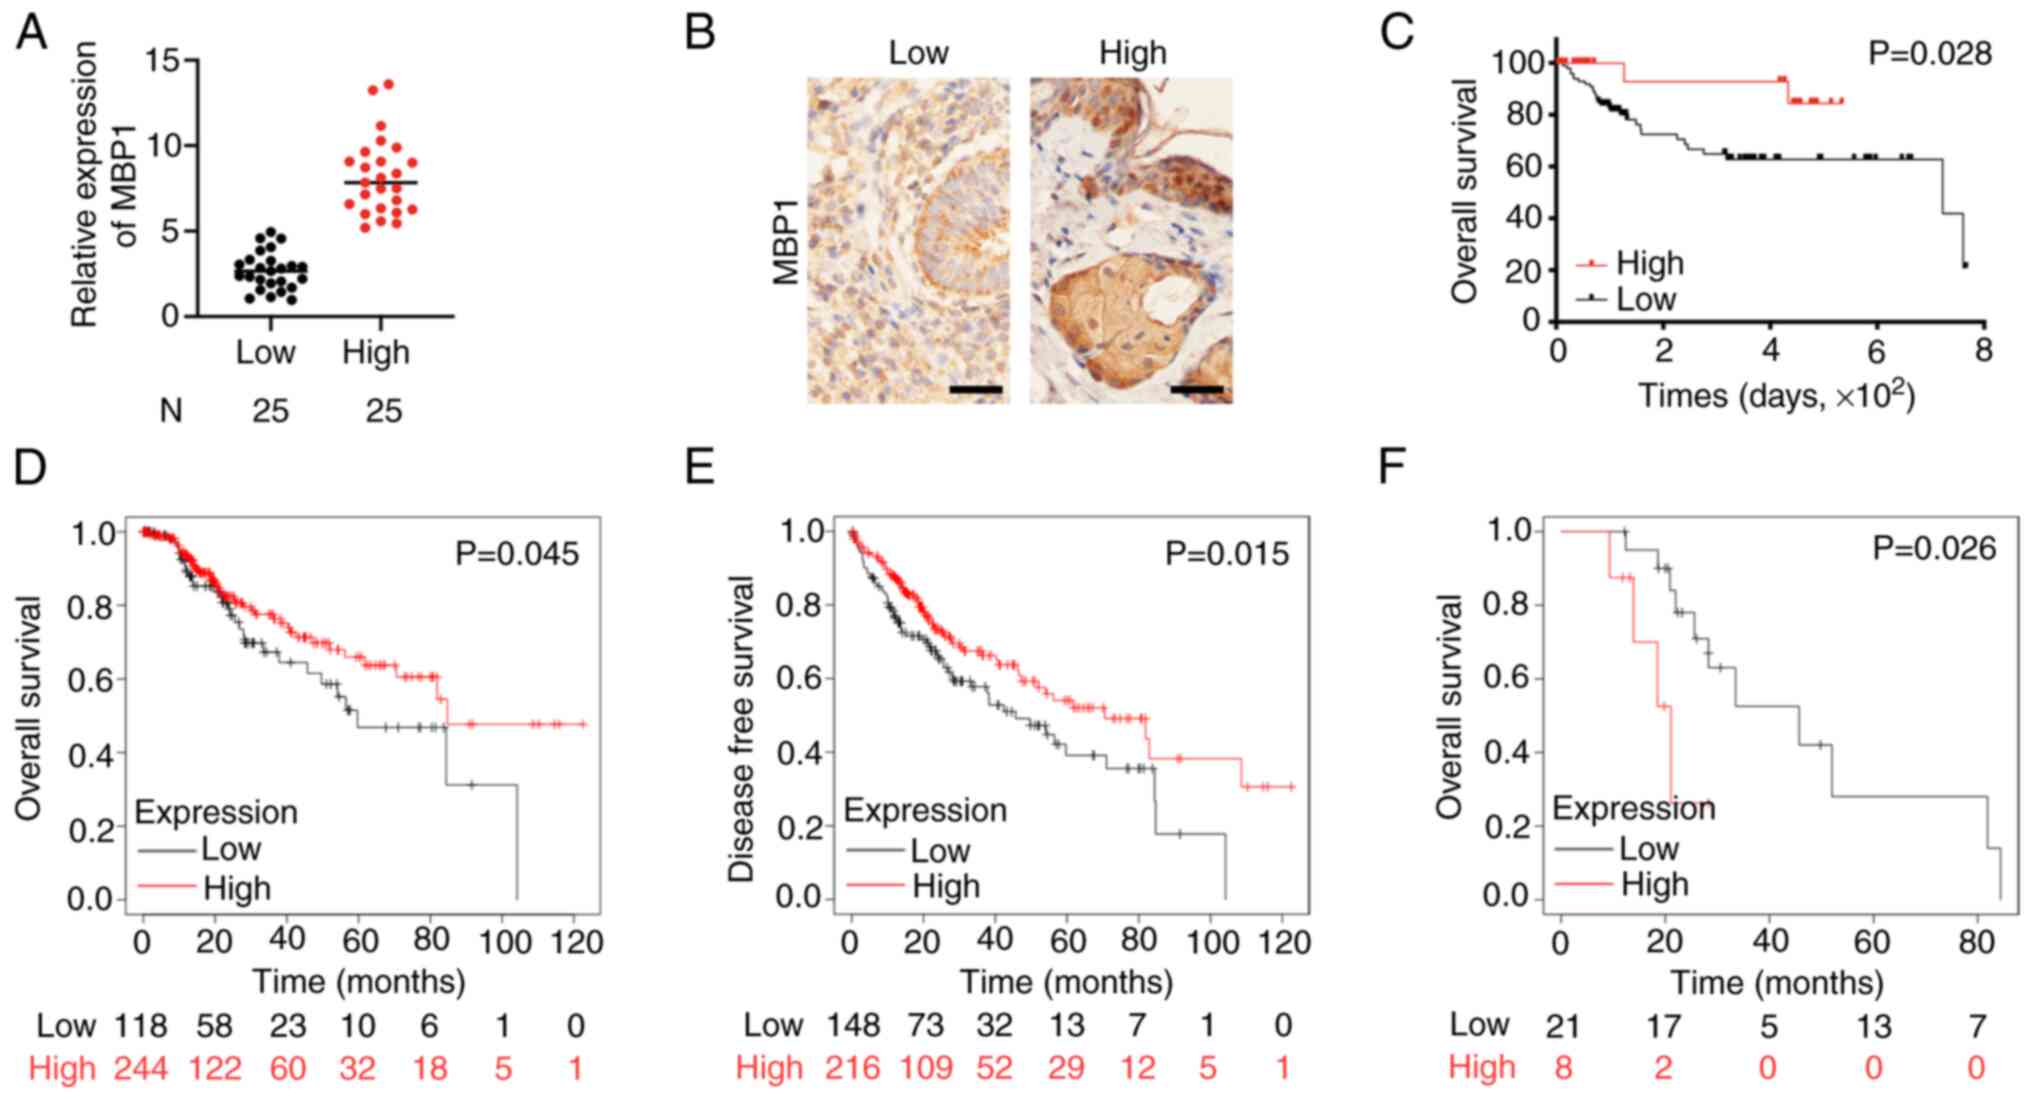
Low expression of MBP1 in BC is
associated with a poor prognosis
Subsequently, the clinical relevance of MBP1
expression in patients with BC was analyzed. The MBP1 expression
levels were divided into low and high expression groups according
to the RT-qPCR and IHC results (Fig.
2A and B). The association between MBP1 expression levels and
clinicopathological features was assessed in patients with BC
(Table I). Univariate analysis
showed that low MBP1 expression was positively associated with poor
patient outcomes, including tumor size (P=0.003), histological
grade (P=0.006), TNM stage (P=0.004), tumor stage (P=0.025), lymph
node metastasis status (P=0.013), and metastasis status
(P<0.001). Analysis of prognosis using Kaplan-Meier survival
curves revealed that patients in the MBP1 high expression group had
improved prognosis (P=0.028) (Fig.
2C). Further analysis of TCGA data (kmplot.com/analysis/)
showed that the overall survival (OS) and disease-free survival
(DFS) times were also improved in patients in the high MBP1
expression group (Fig. 2D and E).
In addition, based on TCGA data, the prognosis of MBP1 was improved
when endocrine therapy was administered to patients in the low MBP1
expression group (Fig. 2F).
Therefore, MBP1 may be used as a clinical molecular indicator for
endocrine therapy.
 | Table I.Clinical significance of MBP1 in
patients with breast cancer. |
Table I.
Clinical significance of MBP1 in
patients with breast cancer.
|
|
| MBP1 expression |
|
|---|
|
|
|
|
|
|---|
| Variable | Number | High | Low | P-value |
|---|
| Age, years |
|
|
|
|
|
<60 | 24 | 12 | 12 | 0.786 |
|
>60 | 26 | 14 | 12 |
|
| Tumor size, cm |
|
|
|
|
|
<2 | 28 | 18 | 10 | 0.003 |
|
>2 | 22 | 5 | 17 |
|
| Histological
grade |
|
|
|
|
|
High/moderate | 30 | 16 | 14 | 0.006 |
|
Low | 20 | 3 | 17 |
|
| TNM stage |
|
|
|
|
|
I/II | 28 | 19 | 9 | 0.004 |
|
III/IV | 22 | 6 | 16 |
|
| T |
|
|
|
|
|
I/II | 29 | 19 | 10 | 0.025 |
|
III/IV | 21 | 7 | 14 |
|
| N |
|
|
|
|
|
I/II | 17 | 13 | 4 | 0.013 |
|
III/IV | 33 | 13 | 20 |
|
| M |
|
|
|
|
| No | 19 | 13 | 6 | <0.001 |
|
Yes | 31 | 6 | 25 |
|
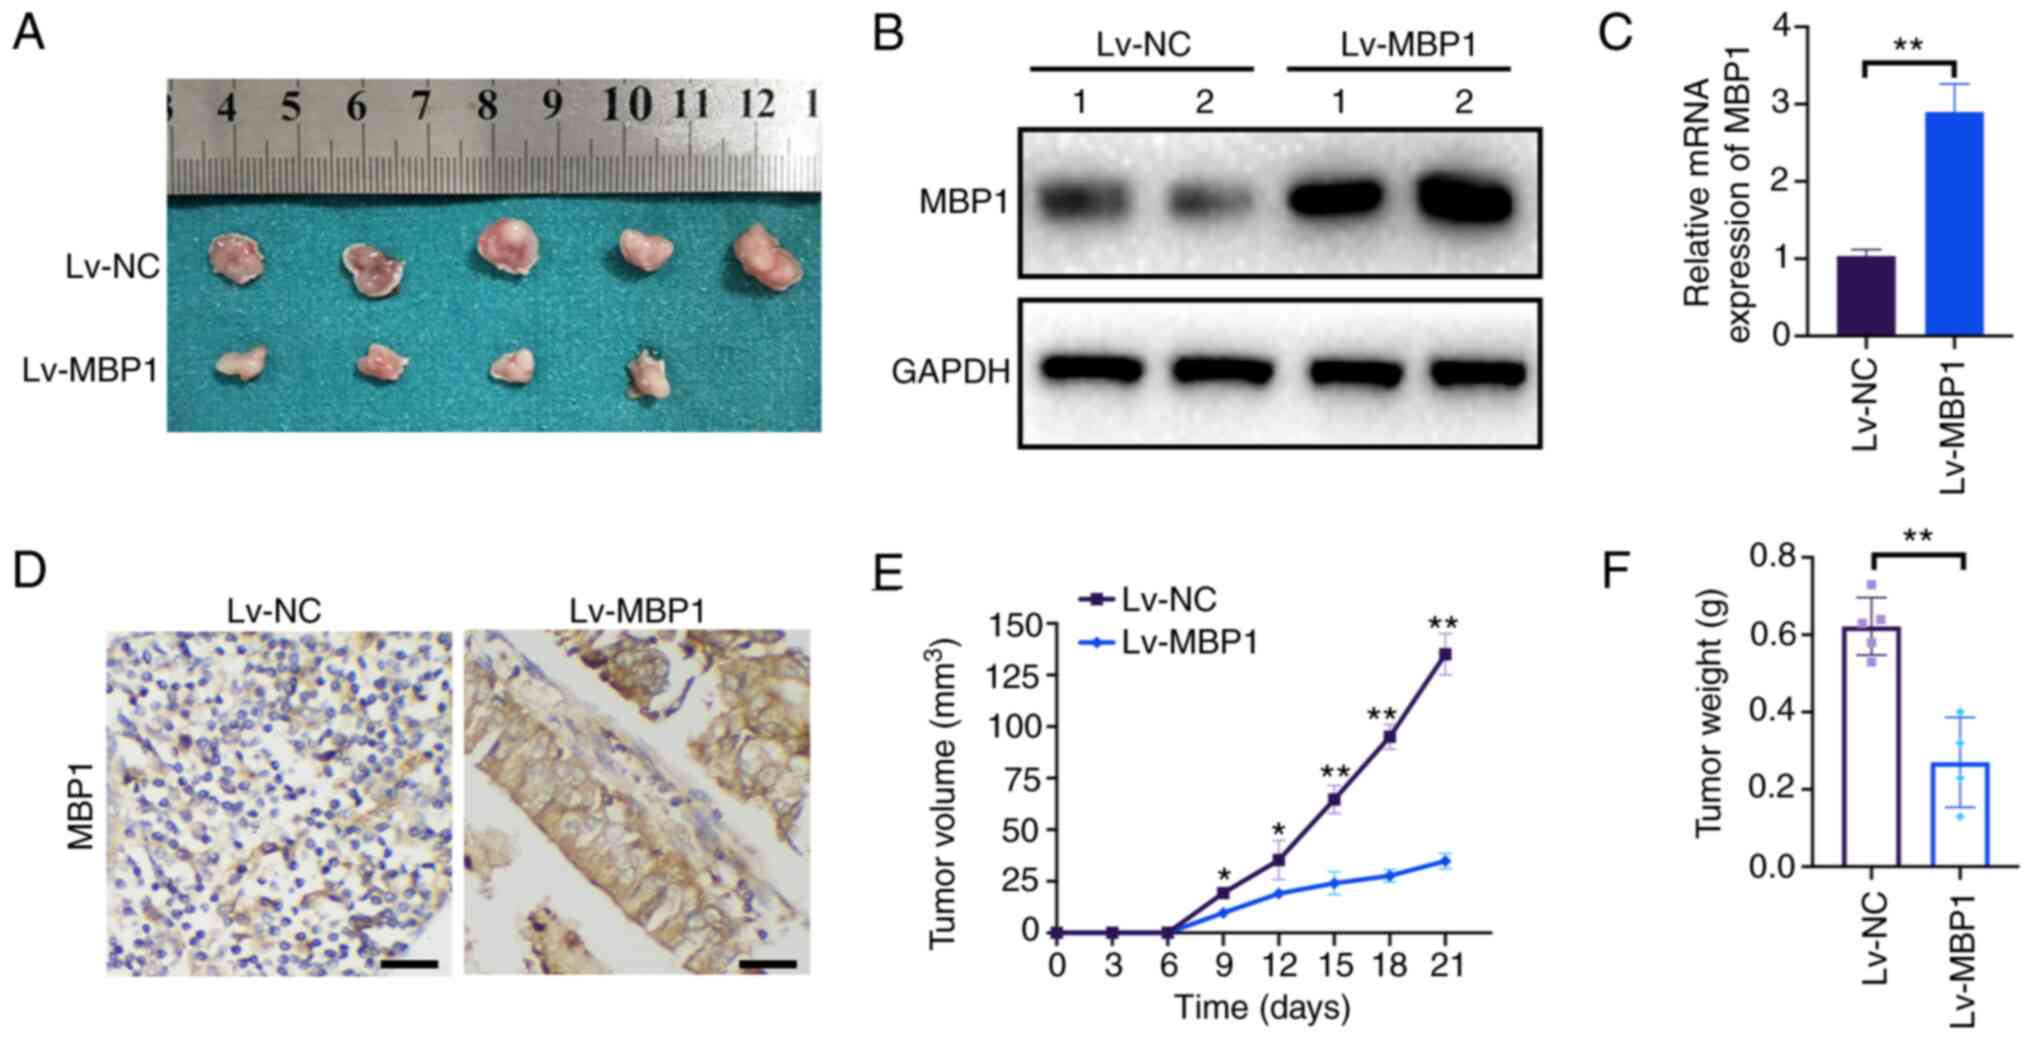
MBP1 inhibits BC growth in vivo
To further elucidate the role of MBP1 in BC tumor
growth in vivo, MCF7 cells stably transfected with Lv-NC or
Lv-MBP1 were injected into nude mice as xenografts (Fig. 3A). Western blot analysis indicated
that MBP1 protein expression was high in the Lv-MBP1 group
(Fig. 3B). Furthermore, MBP1 was
also highly expressed from IHC and RT-qPCR (Fig. 3C and D). Notably, there was a
significant reduction in tumor growth and final tumor weight in
xenografts from mice in the Lv-MBP1 overexpression group (Fig. 3E and F). These results indicated
that high MBP1 expression inhibits the proliferation of BC cells
in vivo.
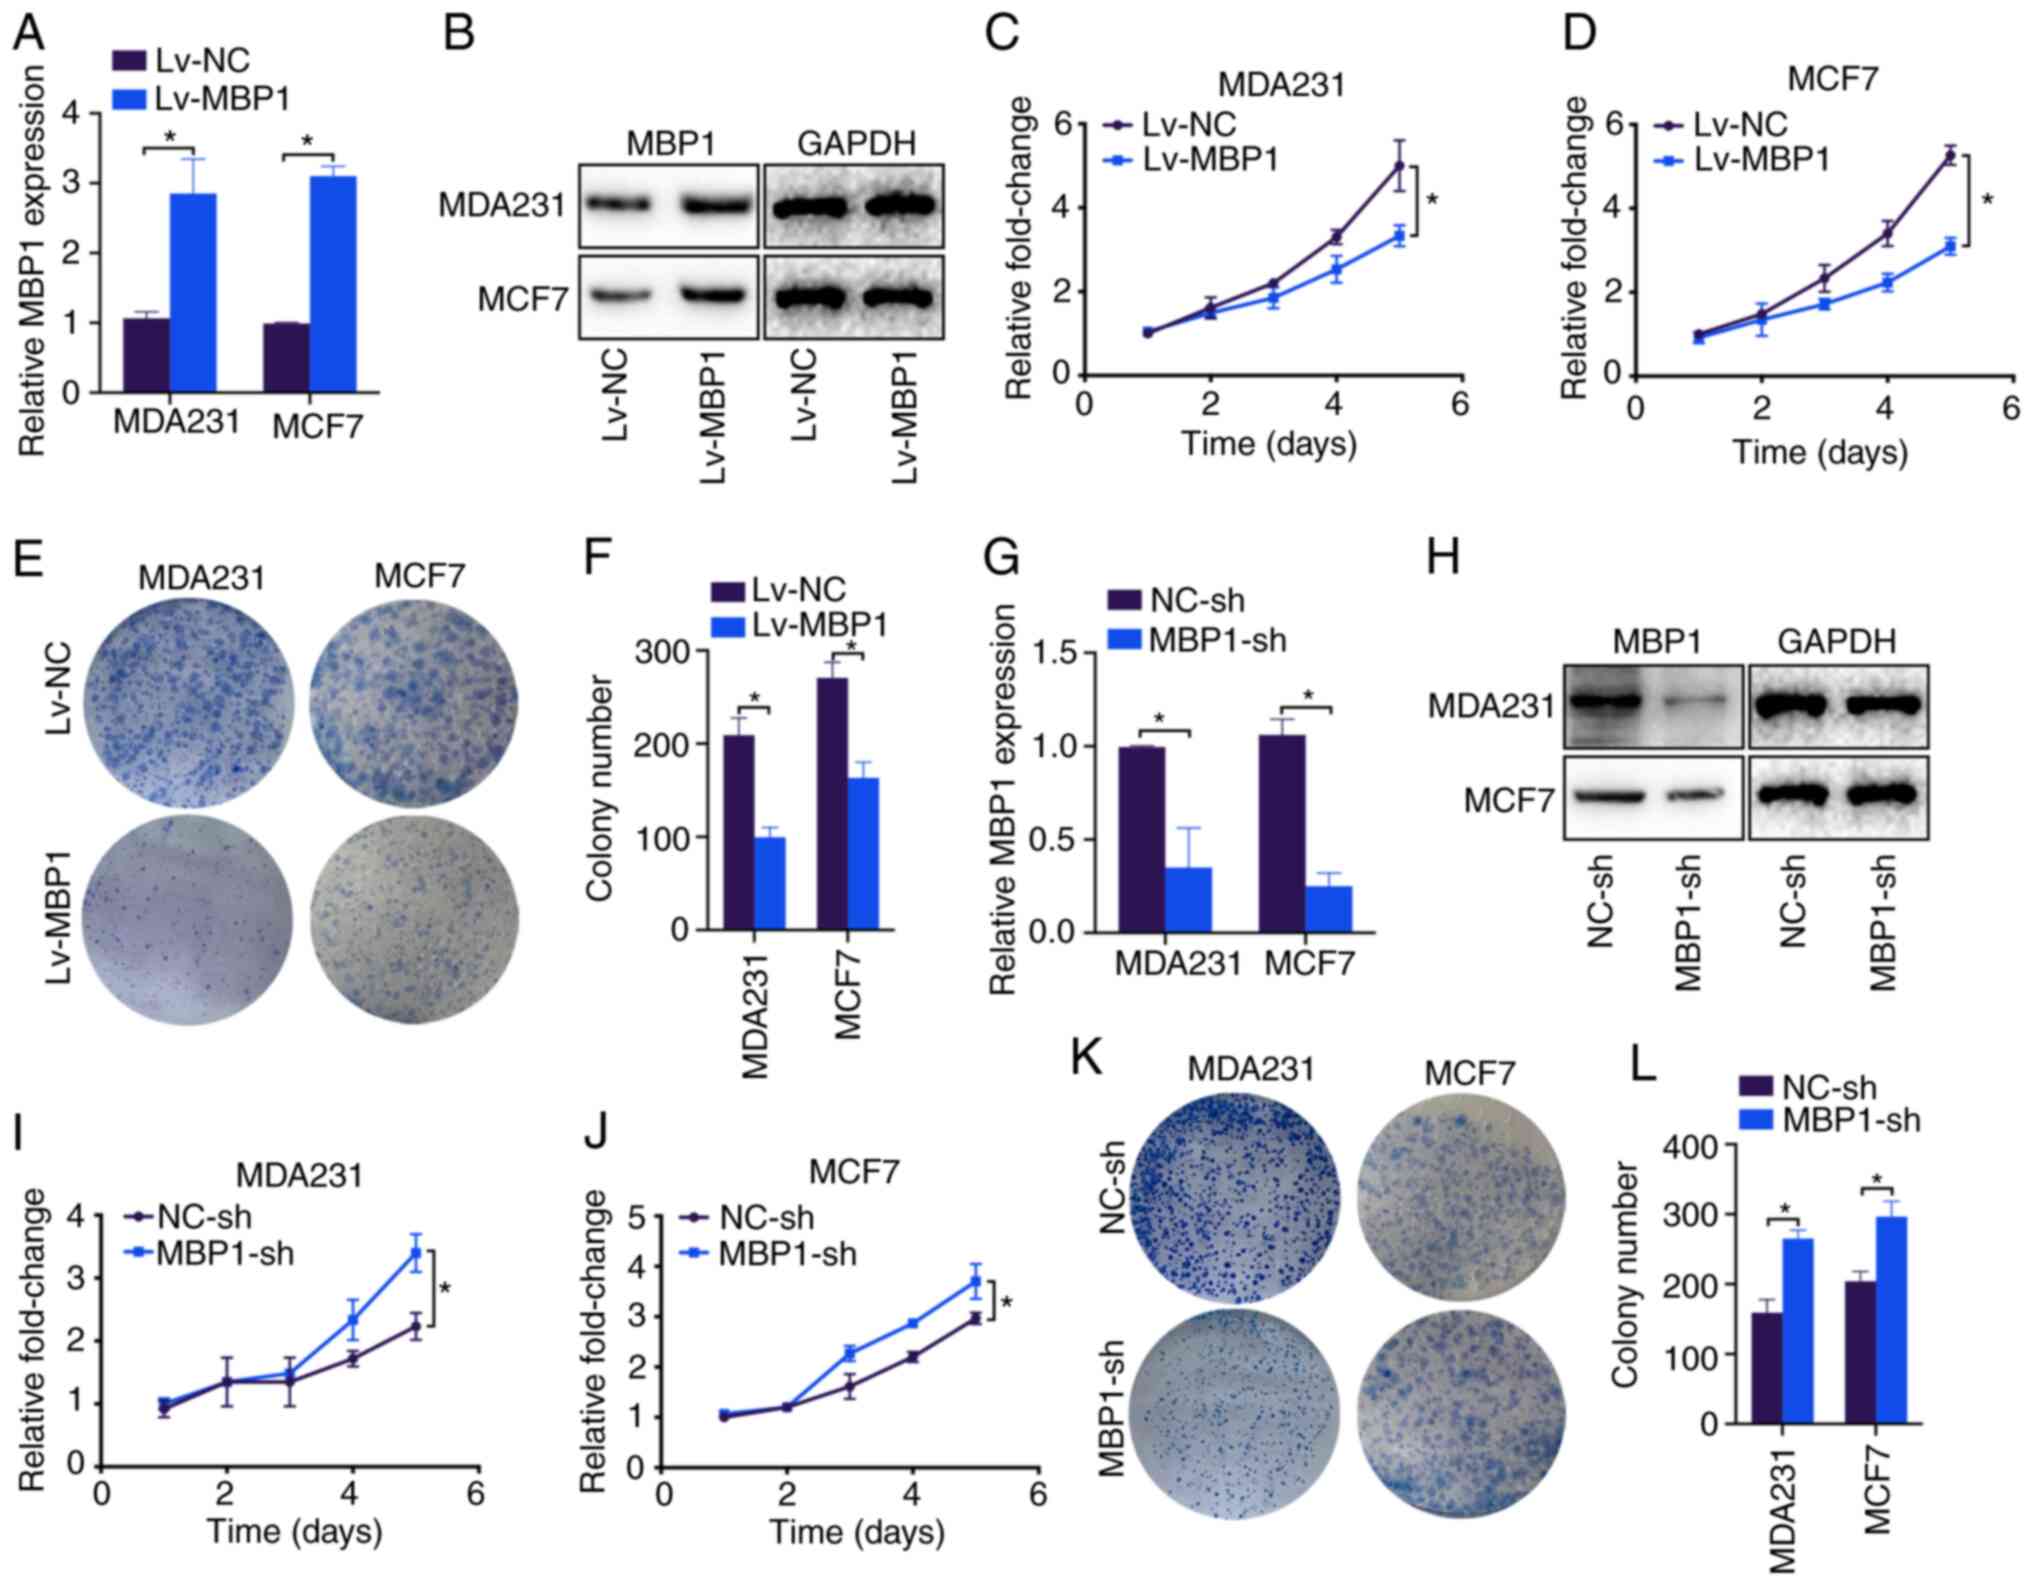
MBP1 regulates the proliferation of BC
cells
To investigate the possible mechanisms by which MBP1
inhibits the proliferation of BC, it was investigated whether MBP1
inhibited the proliferation of the BC cells. RT-qPCR and western
blot analysis showed that Lv-MBP1 transfection notably increased
the mRNA and protein expression level of MBP1 in the MDA231 and
MCF7 cell lines compared with that in cells transfected with Lv-NC,
respectively (Fig. 4A and B).
Furthermore, the CCK-8 assay revealed that the MDA231 and MCF7
cells transfected with Lv-MBP1 had significantly inhibited
proliferation compared with that in cells transfected with Lv-NC
(Fig. 4C and D). In addition, the
results from the colony formation assay revealed significantly
inhibited colony formation in the MDA231 and MCF7 cell lines
transfected with Lv-MBP1 compared with that in cells transfected
with Lv-NC (Fig. 4E and F). By
contrast, the MBP1-sh plasmid notably decreased MBP1 mRNA and
protein expression levels in the MDA231 and MCF7 cell lines
(Fig. 4G and H). Furthermore,
MBP1-sh transfection significantly increased proliferation in the
MDA231 and MCF7 cells (Fig. 4I and
J), and low MBP1 expression increased colony formation in the
MDA231 and MCF7 cells (Fig. 4K and
L). Therefore, MBP1 may be a gene that inhibits the
proliferation of BC cells.
MBP1 represses β-catenin
transcription
β-catenin is a key molecule of the Wnt signaling
pathway and a key marker to promote tumor proliferation (20). Therefore, it was investigated
whether MBP1 regulated β-catenin expression. Lv-MBP1 overexpression
in the MDA231 cell line notably decreased the mRNA and protein
levels of β-catenin (Fig. 5A and
B). Similar results were found in the MCF-7 cell line (Fig. 5C and D). By contrast, knockdown of
MBP1 in the MDA231 and MCF7 cell lines upregulated β-catenin mRNA
and protein expression levels (Fig.
5E-H). Lastly, two potential MBP1 binding sites were predicted
on the β-catenin promoter. Sites were mutated, and a
dual-luciferase assay revealed that MBP1 lost its inhibitory effect
on the promoter of β-catenin after the sequence was mutated at site
1 (Fig. 5J). Further investigation
into the effect of β-catenin on the relative luciferase activity of
MBP1-sh and Lv-MBP1 demonstrated that MBP1 knockdown inhibited
β-catenin activity (Fig. 5K) and
that MBP1 overexpression promoted β-catenin activity (Fig. 5L). Thus, the results indicated that
MBP1 inhibits the transcription of β-catenin in BC cell lines.
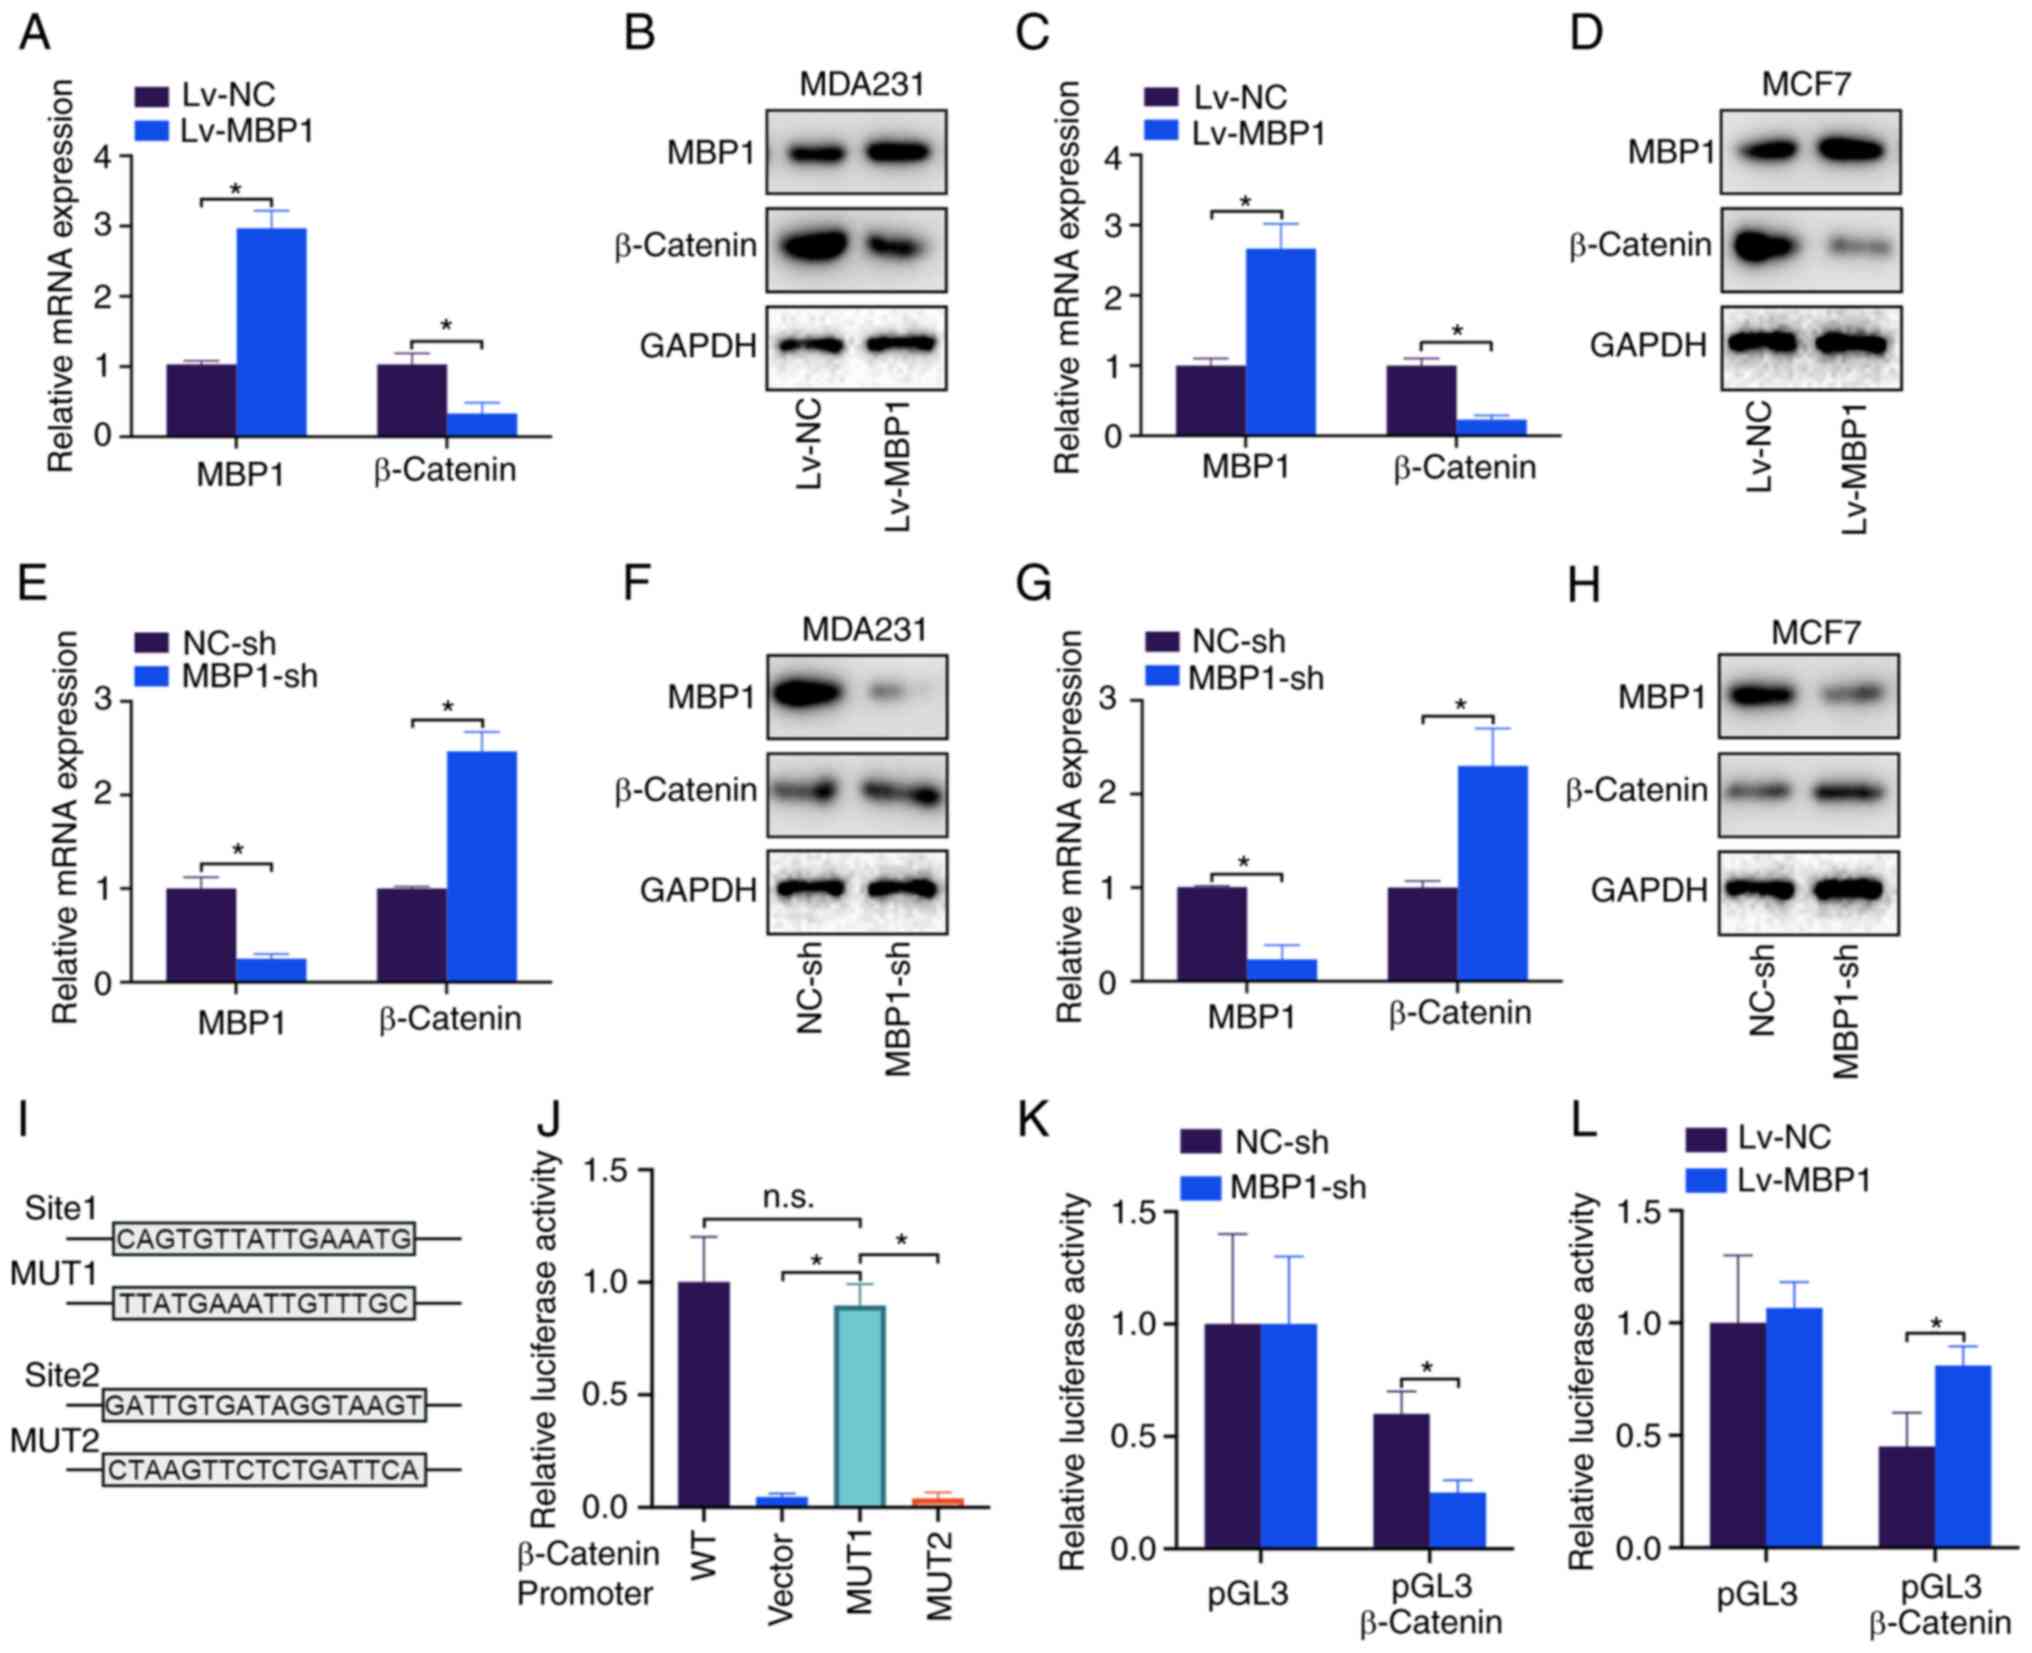 | Figure 5.MBP1 suppresses β-catenin
transcription. MBP1 and β-catenin mRNA and protein expression
levels were detected using (A) RT-qPCR and (B) western blot
analysis, respectively following transfection with Lv-MBP1 and
Lv-NC in the MDA231 cell line. MBP1 and β-catenin were detected
using (C) RT-qPCR and (D) western blot analysis following
transfection with Lv-MBP1 and Lv-NC in the MCF-7 cell line. MBP1
and β-catenin mRNA and protein expression levels were detected
using (E) RT-qPCR and (F) western blot analysis, respectively,
following transfection with MBP1-sh and NC-sh in the MDA231 cell
line. MBP1 and β-catenin mRNA and protein expression levels were
detected using (G) RT-qPCR and (H) western blot analysis following
transfection with MBP1-sh and NC-sh in the MCF-7 cell line. (I)
Potential binding sites between MBP1 and the β-catenin promter, and
the 2 MUT sequences. (J) The luciferase activity of the MDA231
cells following cotransfection with β-catenin WT, MUT or empty
vector. MDA231 cells were cotransfected with (K) MBP1-sh and NC-sh,
and (L) LV-MBP1 and LV-NC. Luciferase activity was detected after
transfection for 48 h. All the data are presented as the mean ± SD
from three independent experiments. *P<0.05. WT, wild type; MUT,
mutant; MBP-1, c-Myc promoter binding protein 1; NC, negative
control; Lv-MBP1, MBP1 overexpression vector; sh, short hairpin;
reverse transcription-quantitative PCR; n.s., not significant. |
MBP1 is regulated by HIF-1α under
hypoxic conditions
Hypoxia promotes tumor development via various
mechanisms (21). Therefore, it
was investigated whether MBP1 is a hypoxia-responsive factor.
Notably, the HIF-1α and β-catenin protein expression levels were
increased, while MBP1 protein expression level was decreased in the
MDA231 and MCF7 cell lines using western blot analysis following 24
h under hypoxic conditions (1% O2) (Fig. 6A and B). Similarly, after treatment
with the chemoattractant CoCl2 for 24 h, the HIF-1α and
β-catenin protein expression levels were increased, while the
protein expression levels of MBP1 was decreased in the MDA231 and
MCF7 cell lines (Fig. 6C and D).
Furthermore, RT-qPCR revealed no significant difference in the mRNA
expression level of MBP1, whereas there were significant
differences in the mRNA expression level of β-catenin, under
hypoxic (1% O2) or CoCL2 conditions in the
MDA231 and MCF7 cell lines (Fig. 6E
and F), indicating that HIF-1α may not regulate MBP1 expression
at the mRNA level, but at the protein level. Thus, Co-IP analysis
was performed, using MBP1 and HIF-1α antibodies, to confirm whether
MBP1 binds to HIF-1α. MBP1 and HIF-1α could bind to each other
(Fig. 6G and H).
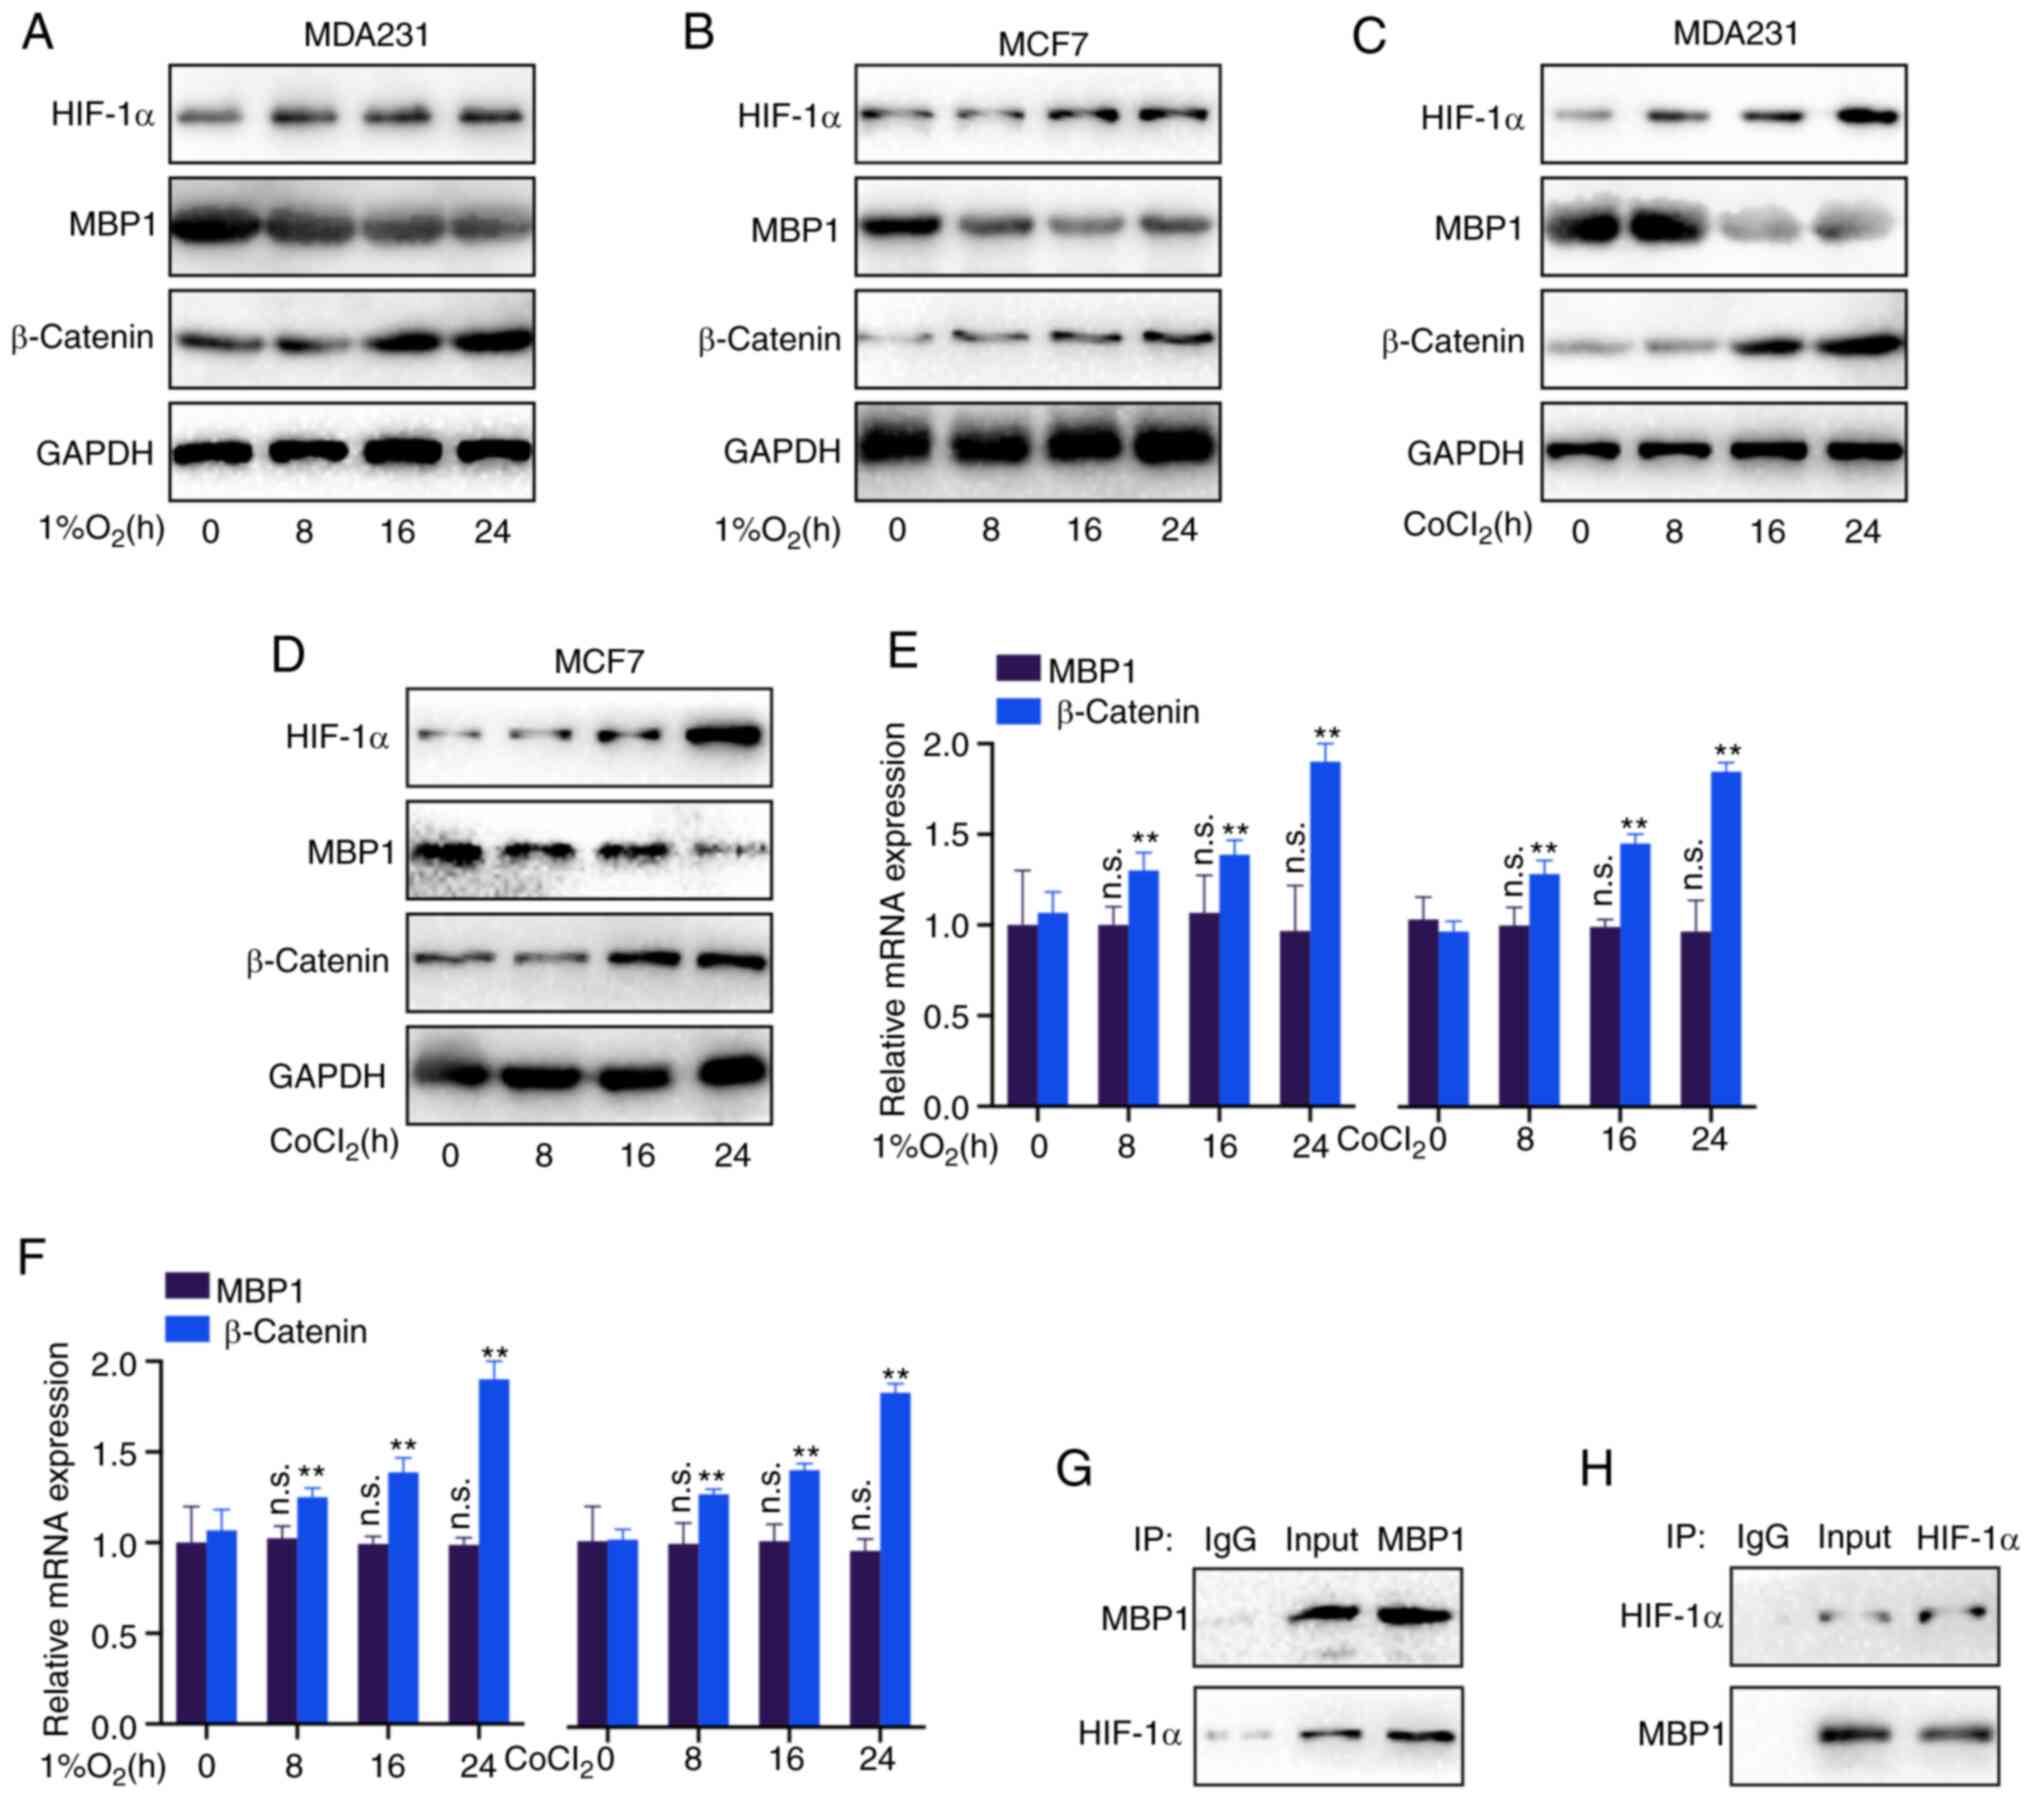 | Figure 6.MBP1 is regulated by HIF-1α under
hypoxic conditions. (A) MDA231 and (B) MCF7 cells were cultured
under hypoxic conditions (1% O2) for 24 h, then the
protein expression levels of HIF-1α, MBP1 and β-catenin were
analyzed using western blot analysis. (C) MDA231 and (D) MCF7 cells
were cultured in CoCl2 for 24 h, then the protein
expression levels of HIF-1α, MBP1 and β-catenin were detected using
western blot analysis. (E) MDA231 and (F) MCF7 cells were cultured
under hypoxic conditions (1% O2) or CoCl2 for
24 h, then the mRNA expression levels of MBP1 and β-catenin were
detected using reverse transcription-quantitative PCR. Whole cell
lysates of the MDA231 cell line were immunoprecipitated with (G)
anti-MBP1 or IgG, or (H) anti-HIF-1α or IgG, then subjected to
western blot analysis for MBP1 and HIF-1α. All the data are
presented as the mean ± SD from three independent experiments.
**P<0.01. MBP-1, c-Myc promoter binding protein 1; HIF-1α,
hypoxia-inducible factor 1α; n.s., not significant. |
Discussion
MBP1 is a tumor suppressor commonly expressed in
mammalian cells (9); however, only
a few reports have investigated its expression regulation in BC.
Studies have revealed the potential roles of MBP1 in the
development of BC (13,14). In addition, MBP1 could play a
decisive role in various critical biological processes, such as
proliferation and metastasis of BC (14,15).
Further understanding of the molecular mechanisms of MBP1 may be
key to the treatment of BC. In the present study, MBP1 was
identified as a tumor suppressor using gene expression pattern
analysis. Furthermore, analysis of clinical samples revealed that
low MBP1 expression in BC was negatively associated with advanced
TNM staging, lymph node metastasis and tumor metastasis. MBP1 could
also be used as a clinical marker for BC endocrine therapy.
However, the prognosis in patients with low MBP1 expression was
improved following endocrine therapy; therefore, this finding
warrants further investigation to clarify the underlying mechanism.
The proliferation of the BC cells was significantly increased
following knockdown of MBP1 expression and MBP1 overexpression
significantly inhibited the proliferation of BC cells. In
vivo, it was found that MBP1 overexpression inhibited the
growth of BC tumors. Therefore, these data indicate that the
reduction in MBP1 expression plays a critical role in the
proliferation and progression of BC.
To further investigate the potential mechanisms, the
downstream targets of MBP1 were analyzed. β-catenin is a key factor
that promotes tumor growth and an important marker of tumor
malignant behavior (22,23). The regulatory effect of MBP1 on the
mRNA and protein expression of β-catenin was initially analyzed,
and MBP1 overexpression in the MCF7 and MDA231 cell lines
significantly reduced the mRNA and protein expression levels of
β-catenin. By contrast, MBP1 knockdown increased the mRNA and
protein expression levels of β-catenin, confirming that β-catenin
was a potential downstream target of MBP1. MBP1 usually functions
as a transcription factor to regulate the transcription level of
downstream genes, such as COX-2, miR-29b (10,24,25).
Therefore, we initially hypothesized that MBP1 regulates the mRNA
expression level of β-catenin via transcription. As expected, the
results from the dual-luciferase assays showed that MBP1
overexpression significantly increased the activity of the
β-catenin promoter. In summary, the results showed that MBP1
reduces the expression of β-catenin by inhibiting the promoter
activity of β-catenin.
In addition, research has found an association
between hyponuclear genes and hypoxia regulation, suggesting that
HIF-1α is the main direct regulator (26), while its regulatory mechanisms
require further investigation. The BC cells were incubated under
hypoxia (1% O2) and the chemoattractant CoCL2
for 24 h. The protein expression levels of HIF-1α and β-catenin
were notably upregulated; however, only the protein expression
levels of MBP1, not the mRNA levels, were significantly upregulated
in the MCF7 and MDA231 cell lines. These results suggest the
potential regulatory role of HIF-1α and MBP1 on β-catenin. To
further investigate the specific mechanism, CoIP and western blot
analysis was performed. As expected, MBP1 could directly bind to
HIF-1α, a classic hypoxia response element (26). RT-qPCR showed that the mRNA
expression levels of MBP1 were not affected by hypoxia, confirming
that MBP1 expression may be post-transcriptionally regulated by
HIF-1α. A previous study have shown that HIF-1α binds to SAG and
transactivates its expression, promoting VHL-mediated HIF-1α
ubiquitination and degradation (27). A limitation to the present study is
that the E3-associated enzyme or specific mechanism that mediates
MBP1 degradation was not investigated.
The present study has some limitations. Due to the
limited number of clinical samples, IHC or RT-qPCR was not
performed to analyze the association between expression of MBP1 and
β-catenin or MBP1 and HIF-1α. In addition, RNA sequencing was not
performed in BC cell lines with different levels of MBP1
expression; therefore, pathway analysis on downstream targets of
MBP1 could not be identified, which will be performed in future
studies.
In conclusion, the results indicated that MBP1 could
serve as a new biomarker and target to predict the prognosis and
clinical treatment of BC.
Acknowledgements
Not applicable.
Funding
Funding: No funding was received.
Availability of data and materials
The datasets used and/or analyzed during the current
study are available in TCGA Genome Data Analysis Center of the
Broad Institute (kmplot.com/analysis/). All other datasets used
and/or analyzed during the present study are available from the
corresponding author upon reasonable request.
Authors' contributions
GW conceived and designed the study. YZ participated
in the study design and performed bioinformatics analysis. XL, PZ
and GP provided their advice during the research process. YZ and XL
performed data analysis and wrote the manuscript. YZ, PZ and GP
performed cytology experiments. All the authors reviewed and edited
the manuscript. All authors have read and approved the final
version of the manuscript. All authors confirm the authenticity of
all the raw data.
Ethics approval and consent to
participate
All the clinical samples were collected with written
informed consent from the patients, and this protocol was approved
by the Ethics Committee of Hubei Cancer Hospital (Wuhan, China).
The mouse experiments and handling of the animals were performed
according to the Institutional and Animal Care and Use Committee of
Hubei Cancer Hospital and the NIH Guide for the Care and Use of
Laboratory Animals.
Patient consent for publication
Not applicable.
Competing interests
The authors declare that they have no competing
interests.
References
|
1
|
Ferlay J, Colombet M, Soerjomataram I,
Dyba T, Randi G, Bettio M, Gavin A, Visser O and Bray F: Cancer
incidence and mortality patterns in Europe: Estimates for 40
countries and 25 major cancers in 2018. Eur J Cancer. 103:356–387.
2018. View Article : Google Scholar : PubMed/NCBI
|
|
2
|
Siegel RL, Miller KD and Jemal A: Cancer
statistics, 2020. CA Cancer J Clin. 70:7–30. 2020. View Article : Google Scholar : PubMed/NCBI
|
|
3
|
Li J, Chen Z, Su K and Zeng J:
Clinicopathological classification and traditional prognostic
indicators of breast cancer. Int J Clin Exp Pathol. 8:8500–8505.
2015.PubMed/NCBI
|
|
4
|
Nagini S: Breast cancer: Current molecular
therapeutic targets and new players. Anticancer Agents Med Chem.
17:152–163. 2017. View Article : Google Scholar : PubMed/NCBI
|
|
5
|
Chiappa C, Rovera F, Rausei S, Del Ferraro
S, Fachinetti A, Lavazza M, Marchionini V, Arlant V, Tanda ML,
Piantanida E, et al: Breast cancer and thyroid diseases: Analysis
of 867 consecutive cases. J Endocrinol Invest. 40:179–184. 2017.
View Article : Google Scholar : PubMed/NCBI
|
|
6
|
Hammerl D, Smid M, Timmermans AM, Sleijfer
S, Martens JWM and Debets R: Breast cancer genomics and
immuno-oncological markers to guide immune therapies. Semin Cancer
Biol. 52:178–188. 2018. View Article : Google Scholar : PubMed/NCBI
|
|
7
|
Bates JP, Derakhshandeh R, Jones L and
Webb TJ: Mechanisms of immune evasion in breast cancer. BMC Cancer.
18:5562018. View Article : Google Scholar : PubMed/NCBI
|
|
8
|
Pérez-González O, Cuéllar-Guzmán LF, Soliz
J and Cata JP: Impact of regional anesthesia on recurrence,
metastasis, and immune response in breast cancer surgery: A
systematic review of the literature. Reg Anesth Pain Med.
42:751–756. 2017. View Article : Google Scholar : PubMed/NCBI
|
|
9
|
Liu Z, Zhang A, Zheng L, Johnathan AF,
Zhang J and Zhang G: The biological significance and regulatory
mechanism of c-Myc Binding Protein 1 (MBP-1). Int J Mol Sci.
19:38682018. View Article : Google Scholar : PubMed/NCBI
|
|
10
|
Hsu KW, Hsieh RH, Wu CW, Chi CW, Lee YH,
Kuo ML, Wu KJ and Yeh TS: MBP-1 suppresses growth and metastasis of
gastric cancer cells through COX-2. Mol Biol Cell. 20:5127–37.
2009. View Article : Google Scholar : PubMed/NCBI
|
|
11
|
Cancemi P, Buttacavoli M, Roz E and Feo S:
Expression of Alpha-Enolase (ENO1), Myc Promoter-Binding Protein-1
(MBP-1) and Matrix Metalloproteinases (MMP-2 and MMP-9) Reflect the
Nature and Aggressiveness of Breast Tumors. Int J Mol Sci.
20:39522019. View Article : Google Scholar : PubMed/NCBI
|
|
12
|
Fan X, Solomon H, Schwarz K, Kew MC, Ray
RB and Di Bisceglie AM: Expression of c-myc promoter binding
protein (MBP-1), a novel eukaryotic repressor gene, in cirrhosis
and human hepatocellular carcinoma. Dig Dis Sci. 46:563–566. 2001.
View Article : Google Scholar : PubMed/NCBI
|
|
13
|
Kanda T, Raychoudhuri A, Steele R, Sagartz
JE, West C and Ray RB: MBP-1 inhibits breast cancer growth and
metastasis in immunocompetent mice. Cancer Res. 69:9354–9359. 2009.
View Article : Google Scholar : PubMed/NCBI
|
|
14
|
Ray RB, Steele R, Seftor E and Hendrix M:
Human breast carcinoma cells transfected with the gene encoding a
c-myc promoter-binding protein (MBP-1) inhibits tumors in nude
mice. Cancer Res. 55:3747–3751. 1995.PubMed/NCBI
|
|
15
|
Lo Presti M, Ferro A, Contino F,
Mazzarella C, Sbacchi S, Roz E, Lupo C, Perconti G, Giallongo A,
Migliorini P, et al: Myc promoter-binding protein-1 (MBP-1) is a
novel potential prognostic marker in invasive ductal breast
carcinoma. PLoS One. 5:e129612010. View Article : Google Scholar : PubMed/NCBI
|
|
16
|
Ray RB and Steele R: Separate domains of
MBP-1 involved in c-myc promoter binding and growth suppressive
activity. Gene. 186:175–80. 1997. View Article : Google Scholar : PubMed/NCBI
|
|
17
|
Ray R, Sheikh S, Fontana J and Miller D:
Human breast-carcinoma cells show correlation in expression of
C-myc oncogene and the C-myc binding-protein (mbp-1). Int J Oncol.
5:1433–1436. 1994.PubMed/NCBI
|
|
18
|
Zhuang Y, Li X, Zhan P, Pi G and Wen G:
MMP11 promotes the proliferation and progression of breast cancer
through stabilizing Smad2 protein. Oncol Rep. 45:162021. View Article : Google Scholar : PubMed/NCBI
|
|
19
|
Livak KJ and Schmittgen TD: Analysis of
relative gene expression data using real-time quantitative PCR and
the 2 (−Delta Delta C(T)) method. Methods. 25:402–408. 2001.
View Article : Google Scholar : PubMed/NCBI
|
|
20
|
Huang P, Yan R, Zhang X, Wang L, Ke X and
Qu Y: Activating Wnt/β-catenin signaling pathway for disease
therapy: Challenges and opportunities. Pharmacol Ther. 196:79–90.
2019. View Article : Google Scholar : PubMed/NCBI
|
|
21
|
Macklin PS, McAuliffe J, Pugh CW and
Yamamoto A: Hypoxia and HIF pathway in cancer and the placenta.
Placenta. 56:8–13. 2017. View Article : Google Scholar : PubMed/NCBI
|
|
22
|
Katoh M: Multi-layered prevention and
treatment of chronic inflammation, organ fibrosis and cancer
associated with canonical WNT/β-catenin signaling activation
(Review). Int J Mol Med. 42:713–725. 2018.PubMed/NCBI
|
|
23
|
Krishnamurthy N and Kurzrock R: Targeting
the Wnt/beta-catenin pathway in cancer: Update on effectors and
inhibitors. Cancer Treat Rev. 62:50–60. 2018. View Article : Google Scholar : PubMed/NCBI
|
|
24
|
Steele R, Mott JL and Ray RB: MBP-1
upregulates miR-29b that represses Mcl-1, collagens, and
matrix-metalloproteinase-2 in prostate cancer cells. Genes Cancer.
1:381–387. 2010. View Article : Google Scholar : PubMed/NCBI
|
|
25
|
Hsu KW, Wang AM, Ping YH, Huang KH, Huang
TT, Lee HC, Lo SS, Chi CW and Yeh TS: Downregulation of tumor
suppressor MBP-1 by microRNA-363 in gastric carcinogenesis.
Carcinogenesis. 35:208–217. 2014. View Article : Google Scholar : PubMed/NCBI
|
|
26
|
Jing X, Yang F, Shao C, Wei K, Xie M, Shen
H and Shu Y: Role of hypoxia in cancer therapy by regulating the
tumor microenvironment. Mol Cancer. 18:1572019. View Article : Google Scholar : PubMed/NCBI
|
|
27
|
Tan M, Gu Q, He H, Pamarthy D, Semenza GL
and Sun Y: SAG/ROC2/RBX2 is a HIF-1 target gene that promotes HIF-1
alpha ubiquitination and degradation. Oncogene. 27:1404–1411. 2008.
View Article : Google Scholar : PubMed/NCBI
|