Introduction
Adipose tissue (AT) is an active endocrine organ
with a number of secretory products and is also a part of the
innate immune system. The phenotype of AT is modified in diseases
such as obesity, metabolic syndrome and cancer (1,2).
Notably, AT is the most abundant tissue surrounding breast cancer
cells, and the importance of the microenvironment during
tumorigenesis, for example via its effects on proliferation,
invasion and chemoresistance, has been realized (3). Even though autocrine signals regulate
tumor behavior, effects exerted by adjacent stromal cells also
serve a role in this modulation. These signals could be soluble
secreted factors, extracellular matrix components and also
cell-cell contact. This signaling involves a constant crosstalk
between normal and transformed cells (4).
It has been demonstrated that mammary AT (MAT)
adjacent to breast tumors serves as a source of pro-inflammatory
cytokines and chemokines, such as interleukin-6 (IL-6), tumor
necrosis factor (TNF) and monocyte chemoattractant protein 1 (MCP1,
also known as CCL2) (5). One of the
key transcription factors that leads to the expression of
inflammation-associated molecules is NF-κB (6). However, there is still a lack of
knowledge regarding how adipocytes induce this pro-inflammatory
profile.
Positive and negative coregulators are master genes
that respectively enhance or suppress the transcription of several
genes by binding transcription factors. Nuclear coactivator
3/receptor associated-coactivator 3 (NCoA3, also known as RAC3) is
a NF-κB coactivator and is a member of the p160 family of steroid
receptor coactivators. Our previous studies demonstrated that NCoA3
expression levels are upregulated in response to inflammatory
injury (7) and are downregulated
during adipocyte differentiation (8). Notably, NCoA3 is highly expressed in
several types of human cancer, including breast cancer (9,10). In
addition, NCoA3 overexpression has been reported to serve an
anti-apoptotic, anti-autophagic and pro-proliferative role
(11–13). Moreover, NCoA3 expression levels are
correlated with higher chemoresistance (14). However, to the best of our
knowledge, its levels in the AT adjacent to breast cancer remain
uncharacterized.
The present study aimed to evaluate whether NCoA3
levels in AT were modulated by breast cancer cells, and the role of
this coactivator in this context. The results obtained in this work
bring new insights into the behavior of breast cancer-associated
adipocytes and how these cells contribute to tumor-promoting
inflammation.
Materials and methods
Cell culture and reagents
The murine pre-adipocyte cell line, 3T3-L1 [American
Type Culture Collection (ATCC)® CL-173™]; the
non-tumorigenic mammary epithelial cell line, MCF10A (ATCC
CRL-10317™); and the human breast cancer cell lines, T-47D (ATCC
HTB133™), MCF7 (ATCC HTB22™) and MDA-MB-231 (ATCC CRMHTB26™), were
purchased from ATCC. The 3T3-L1 cell line was grown in Dulbecco's
modified Eagle's medium (DMEM; Thermo Fisher Scientific, Inc);
MCF10A cells were grown in DMEM/F12 (1:1) containing hydrocortisone
(0.5 µg/ml; Sigma-Aldrich; Merck KGaA), epidermal growth factor (20
ng/ml; Sigma-Aldrich; Merck KGaA) and insulin (10 µg/ml;
Sigma-Aldrich; Merck KGaA); and MDA-MB-231, MCF7 and T-47D cell
lines were grown in DMEM/F12 (1:1). All media were supplemented
with 10% fetal bovine serum (FBS; Gibco; Thermo Fisher Scientific,
Inc.), penicillin (100 U/ml) and streptomycin (100 mg/ml). Cells
were maintained at 37°C in a humidified atmosphere containing 5%
CO2. Mycoplasma testing was performed for the cell lines
used.
Conditioned medium (CM) from breast cell lines
(BrCM) was collected after 24 h of cell culture in serum-free
medium and cell debris was removed by centrifugation at 800 RCF for
5 min at room temperature. BrCM aliquots were conserved at −20°C
prior to adipocyte stimulation. Before adipocyte stimulation,
3T3-L1 cells were plated and differentiated using induction
differentiation medium (1 µg/ml insulin, 1 µM dexamethasone, 0.5 mM
isobutylmethylxanthine and 0.1 mM indomethacin; Sigma-Aldrich;
Merck KGaA), as described previously (8). Insulin (1 µg/ml) was added every 3
days until 1 week was completed. After 3T3-L1 cell differentiation,
medium was replaced with BrCM or fresh free-serum medium (basal
condition) for 24 h, and then protein or RNA extraction was
performed. To study the role of NF-κB activation, 3T3-L1-derived
adipocytes were pre-incubated with NF-κB inhibitor sulfasalazine
(SSZ; 0.2 mM; Santa Cruz Biotechnology, Inc.) for 30 min before
stimulation. 3T3-L1 adipocyte CM was collected after being
cultivated in fresh DMEM/F12 serum-free medium for 24 h for the dot
blot assay.
Plasmid construction and
transfection
The murine short hairpin (sh)RNA for NCoA3 (shNCoA3;
5′-CAGTCGCCATCTTCCTATCAGAACAGCAG-3′) and the scrambled sequence
(control; 5′-GCCTAAGTCCCTCCTATGCAGACGTAACA-3′) were prepared using
the pGFP-V-RS shRNA vector system (OriGene Technologies, Inc.)
according to the manufacturer's protocol, as previously reported
(8). Briefly, 3T3-L1 cells were
transfected with 0.5 µg shRNAs using Lipofectamine® 2000
(Invitrogen; Thermo Fisher Scientific, Inc.). After 5 h of
incubation at 37°C in a humidified atmosphere, the transfection
medium was replaced with culture medium and 3 days after
transfection, the cells were incubated in medium containing 0.5
µg/ml puromycin (Thermo Fisher Scientific, Inc.) as a selection
agent. After 14 days of selection, protein and mRNA expression
levels were analyzed by reverse transcription-quantitative PCR
(RT-qPCR) and western blotting, as reported in a previous study
(8).
Patients and tissue specimens
MAT specimens (n=36 patients) were obtained from the
Institute of Medical Research Alfredo Lanari, School of Medicine,
University of Buenos Aires (Ciudad Autónoma de Buenos Aires,
Argentina). All samples corresponded to MAT around breast tumors
(n=32) or non-malignant mammary lesions (n=4) obtained during tumor
extirpation or exploratory biopsies (0.5-2 cm away from the
invasive front or lesion), respectively. Eligible patients were
postmenopausal women aged ≥45 years with a diagnosis of breast
cancer undergoing surgery. Non-tumoral MAT samples were obtained
from patients who did not present with breast cancer at the time of
surgery and had not been previously diagnosed with breast cancer.
According to pathological examination, the molecular status of
breast tumors was determined by immunohistochemistry (IHC)
following the guidelines of the Allred score (15) [estrogen receptor (ER), progesterone
receptor and human epidermal growth factor 2]. Staging was
performed according to the National Comprehensive Cancer Network
(Guidelines Version 4.2017, Breast Cancer Staging) (16). Meanwhile, patients with
non-malignant lesions (mastopathy, mastitis or usual epithelial
hyperplasia) were monitored for ≥6 years and, to date, none have
presented with tumors. All patients were aged 53–94 years (median,
75 years). According to NCoA3 mRNA expression, samples were
classified as ‘low’ or ‘high’; the cut-off value was the mean of
NCoA3 level obtained by RT-qPCR in non-malignant mammary
lesions.
All procedures were performed in accordance with
ethical standards, including National Laws and The 1964 Declaration
of Helsinki and its later amendments, and were approved by the
Institutional Research Ethic Committee of Institute of Medical
Research Alfredo Lanari (approval no. #312). Written informed
consent was obtained from all patients.
For the collection of CM, human MAT explants (0.5 g)
were incubated in PBS containing 5 mg/ml bovine serum albumin (3
ml/g of tissue; Sigma-Aldrich; Merck KGaA) for 30 min, and
centrifuged for 30 sec at 400 × g at room temperature in order to
reduce contamination with blood cells, soluble factors and tissue
containing insufficient adipocytes to float (17). Subsequently, explants were
cultivated in fresh DMEM/F12 serum-free medium for 24 h and CM was
collected for the dot blot assay.
Animals
Animal experimental protocols performed in the
present study were approved by the National University of Quilmes
Institutional Animal Care and Use Committee (Quilmes, Argentina),
in accordance with the National Institutes of Health guide and the
ARRIVE guides for the care and use of laboratory animals (18).
A total of 15 adult female C57-BL/6J mice, (6–8
months-old; weight, 25–30 g) were divided into three groups (n=5
per group), were housed in the animal facility of the National
University of Quilmes, were given ad libitum access to food
and water, under a 12-h light/dark cycle, with room temperature set
at 20±2°C. To isolate the mammary glands, animals were sacrificed
by 5% isoflurane inhalation (Piramal Healthcare) using gas
anesthesia equipment (SurgiVet) and cervical dislocation. The
mammary glands (#2-4) were surgically removed and explants were
cultivated.
Murine explants (0.2 g) of MAT were prepared in the
same manner as human explants. Subsequently, explants were
stimulated with BrCM or fresh serum-free medium (basal condition)
and incubated at 37°C in humidified atmosphere for 24 h and
processed for RNA extraction or IHC. For the collection of CM,
explants were cultivated in fresh DMEM/F12 serum-free medium for 24
h, the obtained CM was centrifuged at 800 RCF for 5 min at room
temperature and the dot blot assay was performed.
Western blot analysis
Western blotting was performed as previously
described (14). For experiments
where NCoA3 expression was determined, 3T3-L1-derived adipocytes
were stimulated with BrCM, or not, and were then harvested and
treated with RIPA lysis buffer (50 mM Hepes, 250 mM NaCl, 1 mM EDTA
and 1% NP-40, pH 7.4; Sigma-Aldrich; Merck KGaA) plus protease
inhibitors (1 mM PMSF, 5 µg/ml Pepstatin A and 1 mM DTT;
Sigma-Aldrich; Merck KGaA). To validate the knockdown efficiency of
shNCoA3, protein extracts were obtained from 3T3-L1
undifferentiated cells, as aforementioned. The protein
concentrations were quantified using the Bradford assay (Bio-Rad
Laboratories, Inc.).
In both cases, samples (100 µg total proteins) were
separated by SDS-PAGE on 7% gels and transferred to PVDF membranes,
which were blocked with 10% skim milk for 1 h at room temperature.
The membranes were then incubated with rabbit polyclonal anti-NCoA3
(1:4,000; cat. no. sc-25742) or mouse monoclonal anti-tubulin
(1:5,000; cat. no. sc-58666) antibodies (Santa Cruz Biotechnology,
Inc.) overnight at 4°C in TBS-0.02%Tween containing 0.5% bovine
serum albumin (Sigma-Aldrich; Merck KGaA). Subsequently, washed
membranes were incubated for 1h at room temperature with
HRP-conjugated secondary antibodies (1:5,000; cat. nos. PI-1000 and
PI-2000; Vector Laboratories, Inc.). Proteins were then detected
using luminol reagent (Santa Cruz Biotechnology, Inc.). When bands
were detected in all experimental conditions, densitometry units
for each band were obtained using ImageJ software v1.52a (National
Institutes of Health) and were normalized to anti-tubulin
densitometry values.
IHC and immunofluorescence
staining
Human and murine blocks were fixed in 4%
formaldehyde for 24 h at room temperature. Tissue blocks were then
embedded in paraffin, sectioned (3 µm), then deparaffinized in
xylene and rehydrated for IHC staining (14). Antigen retrieval was performed using
sodium citrate for 25 min at 100°C in a water bath. The sections
were then incubated in H2O2 (3%) for 10 min,
blocked in horse serum (cat. no. PK-6200; Vector Laboratories,
Inc.) for 60 min at room temperature and incubated with rabbit
anti-NCoA3 (1:250; cat. no. sc-25742) or mouse anti-phosphorylated
(p)-p65 (Ser536; 1:500; cat. no. sc-136548) antibodies (Santa Cruz
Biotechnology, Inc.) at 4°C overnight. Following incubation with a
universal biotinylated secondary antibody for 60 min at room
temperature (1:250; cat. no. PK-6200; Vector Laboratories, Inc.),
the specimens were incubated with H2O2-diaminobenzidine until the
desired staining intensity was observed. The sections were
counterstained with hematoxylin, dehydrated, mounted and observed
under a light Olympus BX51 microscope (Olympus Corporation). The
area of positive staining was calculated using ImageJ software with
the plugin ColourDeconvolution2 (19).
MAT paraffin-embedded sections obtained from
patients were prepared as aforementioned and stained with pure
hematoxylin for 3 min at room temperature. Crown-like structures
(CLS) were identified as adipocytes with at least two infiltrating
immune cells (with macrophage morphology) around the cell using
light microscopy; the number of CLS per field was manually
counted.
For immunofluorescence assays, 3T3-L1-derived
adipocytes were seeded in 24-well plates on 12-mm glass coverslips.
After 24 h of culturing, the cells were stimulated with BrCM or
serum-free medium (basal condition) for 1 h at 37°C in a humidified
atmosphere, and were then fixed with 3% formaldehyde and 0.02%
glutaraldehyde for 15 min. The cells were incubated with a primary
antibody against p-p65 at the aforementioned dilution for 2 h at
room temperature. Subsequently, the cells were washed and incubated
with a TRITC-labeled secondary antibody (1:250; cat. no.
#115-025-003; Jackson ImmunoResearch Laboratories, Inc.) for 1 h at
room temperature, washed with PBS, counterstained with Hoechst
33342 (Santa Cruz -Biotechnology, Inc.) and mounted on glass slides
with PBS/Glycerol 1:1 solution. Cells were analyzed using an
Olympus BX51 fluorescence microscope (Olympus Corporation). Images
were captured using a digital camera in 10 randomly-chosen fields;
≥10 cells/field were analyzed with ImageJ software. The experiment
was performed in triplicate.
RT-qPCR
Total RNA was isolated from human and murine MAT
using TRIzol® (Invitrogen; Thermo Fisher Scientific,
Inc.), according to the manufacturer's protocol and adapted for AT.
Briefly, ~0.5 g tissue was homogenized using a Tissumizer
homogenizer (Teledyne Tekmar Company) with 1 ml TRIzol reagent. The
extracts were centrifuged at 12,000 × g for 10 min at 4°C, after
which the top layer of excess lipid was removed and the solution
containing RNA was transferred to a fresh tube (20). For RNA extraction from 3T3-L1
adipocytes, the standard TRIzol protocol was used (8).
RT was carried out using SuperScript II kit (Thermo
Fisher Scientific, Inc.) according to the manufacturer's
instructions. qPCR was performed using Homo sapiens (hs) and
Mus musculus (mm) sequence-specific primers for: hs NCoA3,
forward (F) 5′-AAGTGAAGAGGGATCTGGA-3′, reverse (R)
5′-CAGATGACTACCATTTGAGG-3′; hs cyclophilin A (CyA), F
5′-ATGCTGGACCCAACACAAAT-3′, R 5′-TCTTTCACTTTGCCAAACACC-3′; mm
NCoA3, F 5′-ACATGGTGCATATGAACAGC-3′, R
5′-GATGTCAGCAGTATTTCTGATCG-3′; mm MCP1, F 5′-CGGCTGGAGCATCCACGT-3′,
R 5′-TGGGGTCAGCACAGACCT-3′; mm CyA, F 5′-CCACCGTGTTCTTCGACATC-3′, R
5′-GCTCGAAAGTTTTCTGCTGT-3′.
For gene expression quantitative analysis, CyA mRNA
expression was used as a reference gene for normalization.
According to the literature, CyA has been confirmed as an
appropriate housekeeping gene (21). In our previous study, CyA expression
was constitutively high, and there was no variation between
conditions in both human and murine models (8). The 2−ΔΔCq method was used
to quantify mRNA expression (8,22).
Dot blot assay
CM from adipocytes and AT was spotted onto
nitrocellulose membrane with Bio-Dot Microfiltration Apparatus
(Bio-Rad Laboratories, Inc.). The membranes were blocked in 10%
skim milk for 1 h at room temperature, incubated with mouse
monoclonal anti-TNF (1:5,000; cat. no. sc-133192; Santa Cruz
Biotechnology, Inc.) or mouse monoclonal anti-human MCP1 (1:1,000,
cat. no. sc-32771; Santa Cruz Biotechnology, Inc.) overnight at
4°C, and then incubated for 1 h at room temperature with
HRP-conjugated secondary antibodies at the aforementioned dilution.
Proteins were visualized by autoradiography using luminol reagent
(Santa Cruz Biotechnology, Inc.). The densitometry values for each
band were determined using ImageJ and their intensity was
normalized to the amount of total proteins in the conditioned
medium quantified by Bradford reaction. All samples were performed
in triplicate for mice explants and 3T3-L1 adipocytes. For patient
explants, each patient was considered an independent sample.
Analysis of gene expression values
from data repositories
In order to compare the expression levels of NCoA3
and different adipokines between MAT surrounding normal mammary
gland or breast cancer tissue, values retrieved from the
E-MTAB-8638 dataset (18 MAT samples) using the A-MEXP-2072 platform
(Illumina HumanHT12 V4.0; Illumina, Inc.) were obtained from the
EBI databank, ArrayExpress (https://www.ebi.ac.uk/arrayexpress/experiments/E-MTAB-8638/)
(23) were analyzed. Quantile
normalized expression values were retrieved. Heatmap generation was
performed using the heatmap function in limma R package (24). Cytokine expression was studied in
samples from The Cancer Genome Atlas (TCGA) (https://www.cancer.gov/about-nci/organization/ccg/research/structural-genomics/tcga);
TCGA Breast Cancer dataset containing 394 breast tumor samples was
analyzed using UCSC Xena platform (https://xenabrowser.net/heatmap/).
Statistical analysis
All the data are presented as the mean ± SEM of at
least three independent experiments in 3T3-L1 adipocytes or murine
MAT; in patients, each tissue sample was considered an independent
sample. For two group comparison, the significant differences
between means were determined using unpaired Student's t-test. For
multiple comparisons, when data were normally distributed, one-way
ANOVA and Tukey's post-hoc tests were performed, otherwise the
non-parametric Kruskal-Wallis test and Dunn's multiple comparison
post-hoc test were performed. Differences in a given variable
between groups of patient samples were assessed using Welch's
t-test and Mantel-Haenszel's test was performed to assess the
distribution of patients. For bioinformatics analysis, Student's
t-test for paired samples was performed. Pearson's r correlation
coefficient was calculated to assess correlation. Two-tailed
P<0.05 was considered to indicate a statistically significant
difference.
Results
NCoA3 levels in adipocytes are
modulated by secreted factors from certain breast tumor cell
lines
AT is considered relevant in the study of tumor
development (3,25–27);
however, it remains unknown as to which molecules are involved in
the changes that tumor-associated adipocytes undergo. Among the
transcription factors studied in these cells, NF-κB is known to
exert several effects on the tumor microenvironment (28).
The present study first investigated NF-κB
activation in BrCM-stimulated 3T3-L1 adipocytes, using
immunodetection of the phosphorylated form of the NF-κB subunit p65
(p-p65) (29). It was revealed that
BrCM from all breast cancer cell lines enhanced the presence of
p-p65 in the nucleus when compared with that in cells under basal
conditions and non-tumoral MCF10A BrCM (Fig. 1A-C). The average maximum
fluorescence intensity for each experimental condition was
calculated, as it is inaccurate to average the profiles given the
differences in size and rounded shape of the adipocytes. The
fluorescence profiles shown in Fig.
1B are representative of the cell population in each condition
observed in Fig. 1A.
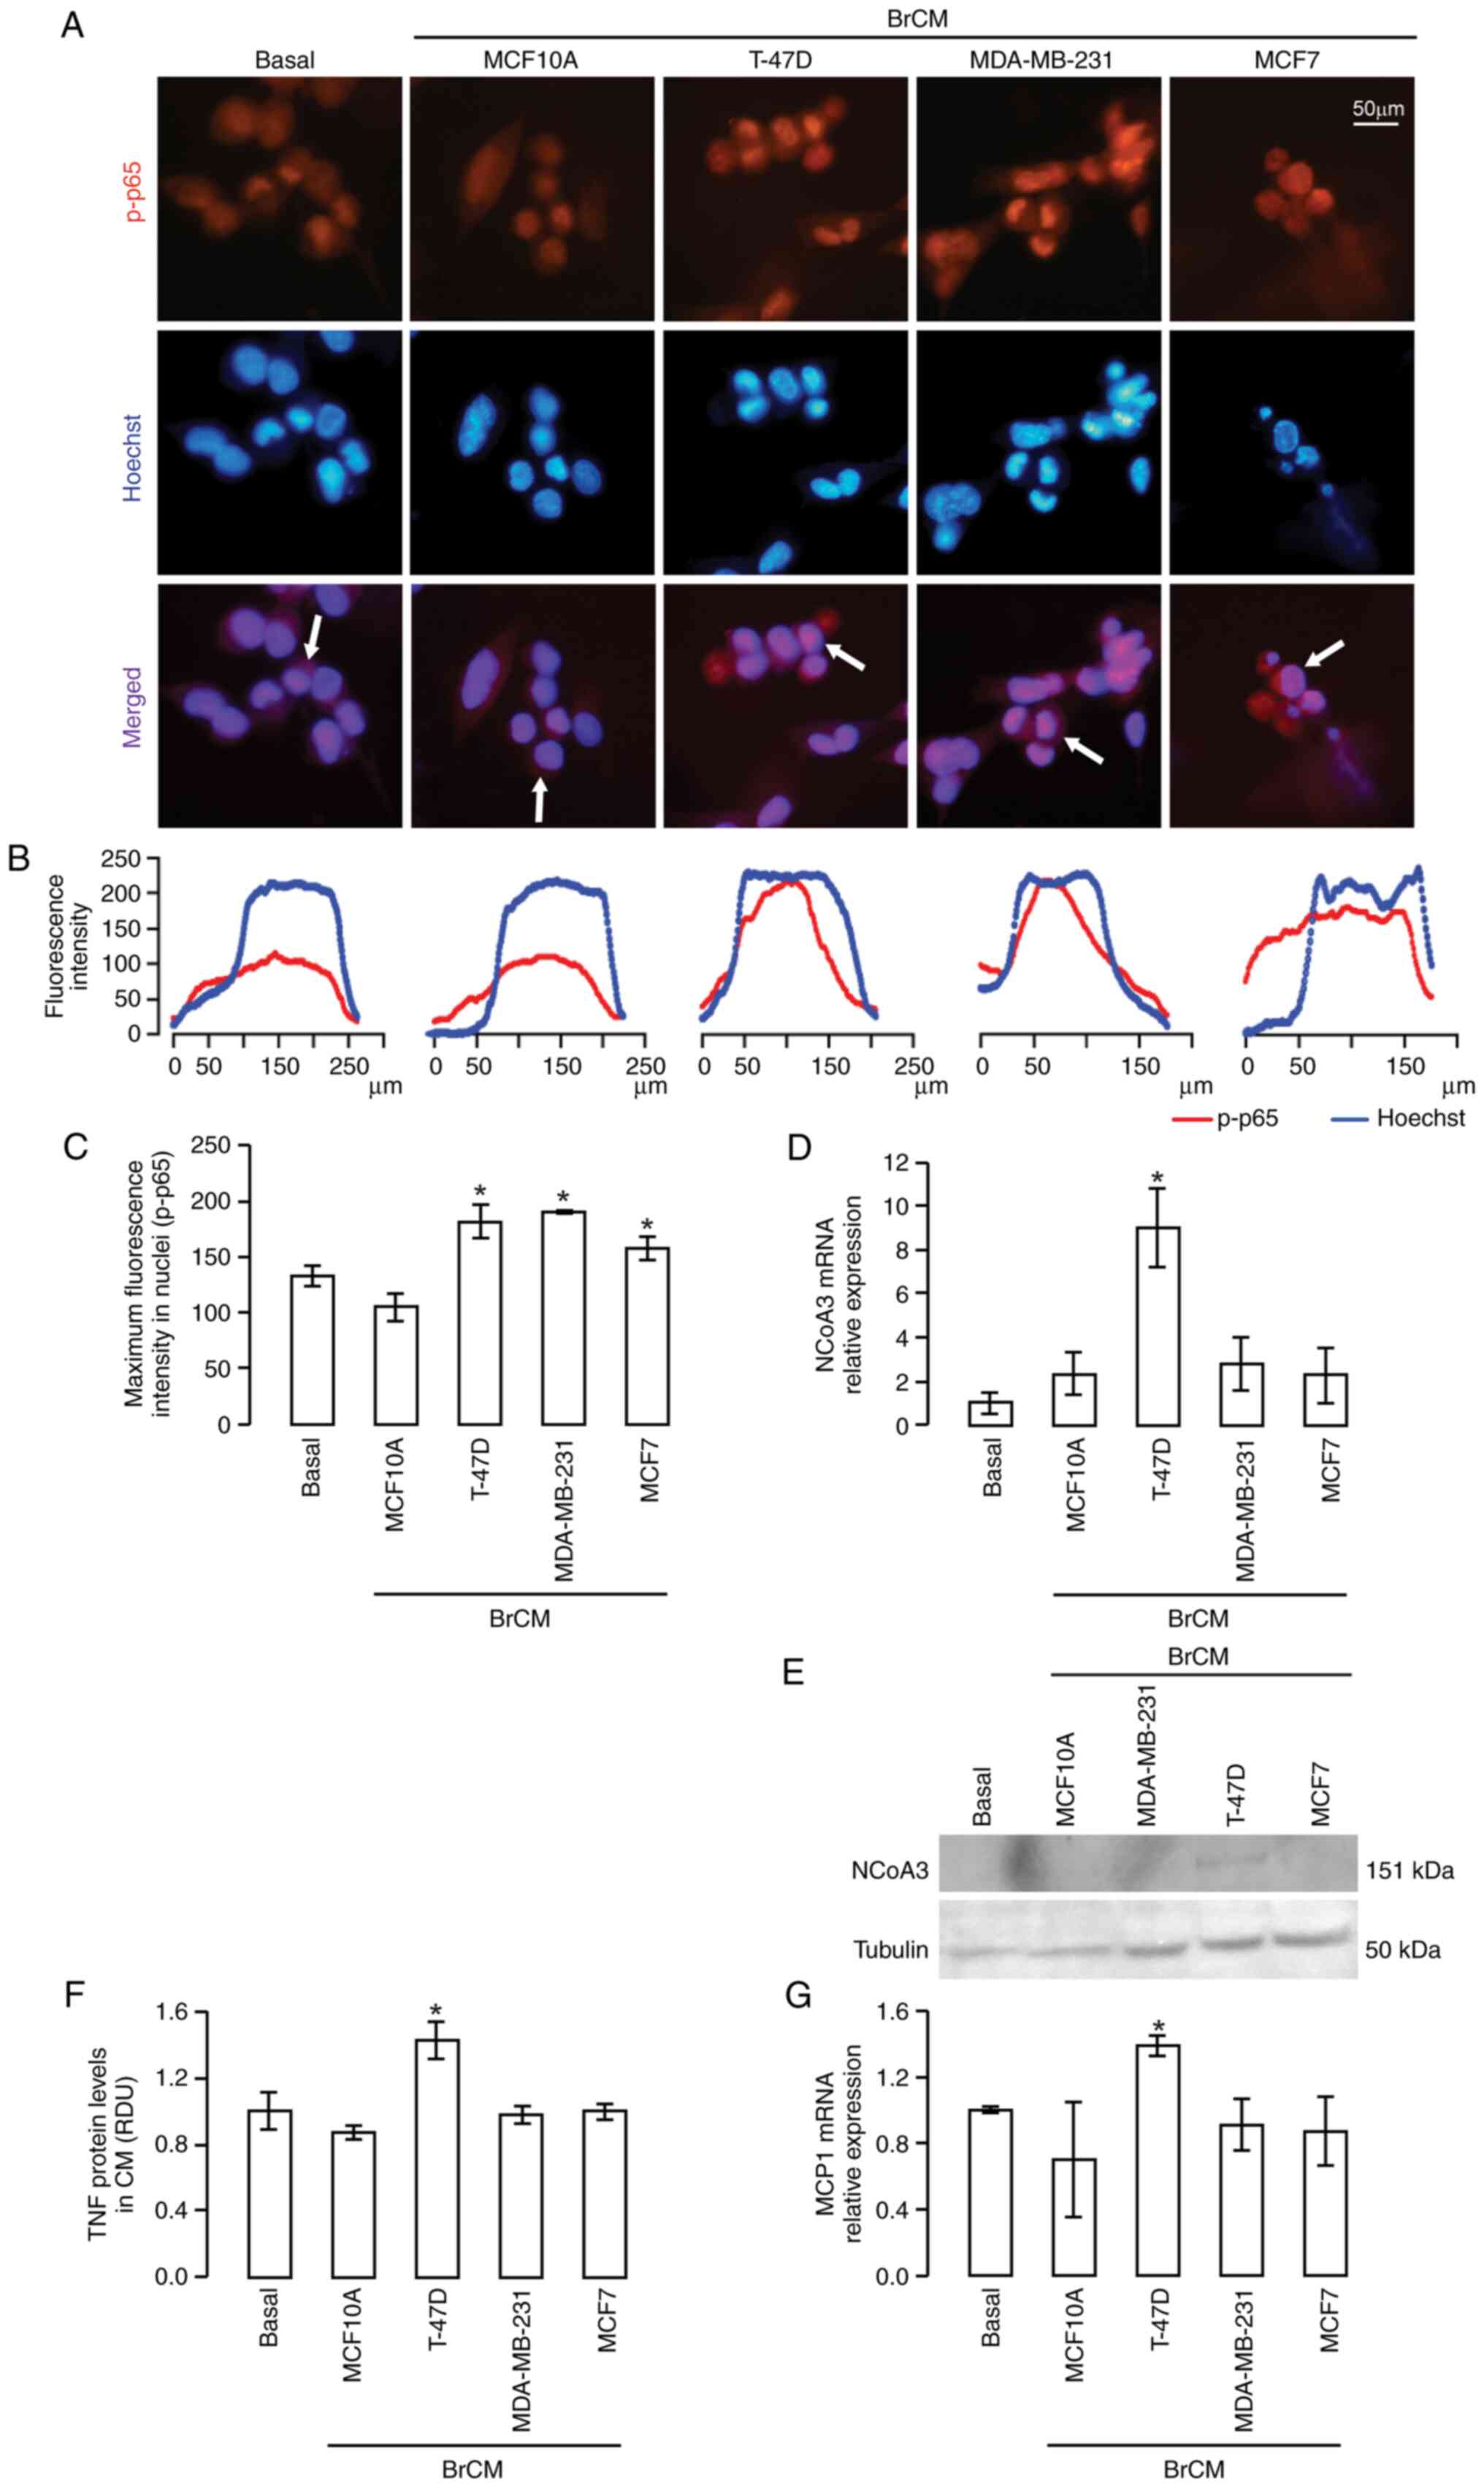 | Figure 1.NCoA3 expression in 3T3-L1 adipocytes
stimulated with BrCM. p-p65 was detected by immunofluorescence. (A)
Representative microphotographs are shown; upper panels, p-p65
staining (red); middle panels, Hoechst staining (blue); lower
panels, merged. (B) Plots showing the fluorescence intensity
profile of the indicated cells in (A) (white arrows). (C) Maximum
fluorescence intensity quantification was performed in ≥10
individual cell profiles in 10 fields for each condition.
*P<0.05 vs. basal or MCF10A, one-way ANOVA and Tukey's post hoc
test. (D) NCoA3 expression was evaluated in 3T3-L1 adipocytes by
RT-qPCR. *P<0.05 vs. basal or MCF10A. (E) NCoA3 and tubulin
protein expression levels were assessed by western blotting in
extracts from 3T3-L1 adipocytes stimulated with or without BrCM.
(F) TNF secretion was studied by dot blot assay. (G) mRNA
expression levels of MCP1 were determined by RT-qPCR and normalized
to CyA. *P<0.05 vs. MCF10A, one-way ANOVA and Tukey's post hoc
test. Data are presented as the mean ± SEM. BrCM, conditioned
medium from breast cell lines; CyA, cyclophilin A; MCP1, monocyte
chemoattractant protein 1; NCoA3, nuclear receptor coactivator 3;
p-p, phosphorylated; RDU, relative densitometry units; RT-qPCR,
reverse transcription-quantitative PCR; TNF, tumor necrosis
factor. |
Since our previous studies demonstrated that NCoA3
is a NF-κB transcriptional coactivator, which is overexpressed in
several types of cancer and is associated with pro-tumoral effects
mediated by NF-κB (11,13,14,30),
the present study evaluated whether NCoA3 levels in 3T3-L1
adipocytes were modulated upon BrCM treatment. Notably, it was
observed that only BrCM from the T-47D cell line induced a marked
increase in the mRNA and protein expression levels of NCoA3
(Fig. 1D and E).
Subsequently, the levels of TNF and MCP1 were
detected, which are both regulated by NF-κB, involved in
pro-inflammatory processes and have been reported to be secreted by
adipocytes adjacent to tumors (6,26,31).
Notably, only T-47D BrCM was capable of inducing a significant
increase in the expression of both molecules (Figs. 1F and G, and S1A).
These findings indicated that signals released by
tumor cells have the ability to regulate the activation of the
transcription factor NF-κB. However, NCoA3 expression in adipocytes
seems to depend on the phenotypic characteristics of the breast
cancer cell line. Notably, only when NCoA3 levels were upregulated,
were the expression levels of TNF and MCP1 significantly
increased.
NCoA3 knockdown or NF-κB inhibition in
3T3-L1 adipocytes reverses pro-inflammatory adipokine
expression
The aforementioned results revealed a relationship
between the expression levels of NCoA3 and inflammatory markers. In
order to further study this association, 3T3-L1-derived adipocytes
transfected with shNCoA3 or control plasmid under T-47D BrCM
stimulation were assessed. RT-qPCR and western blot analysis were
performed to validate the knockdown efficiency (Fig. 2A).
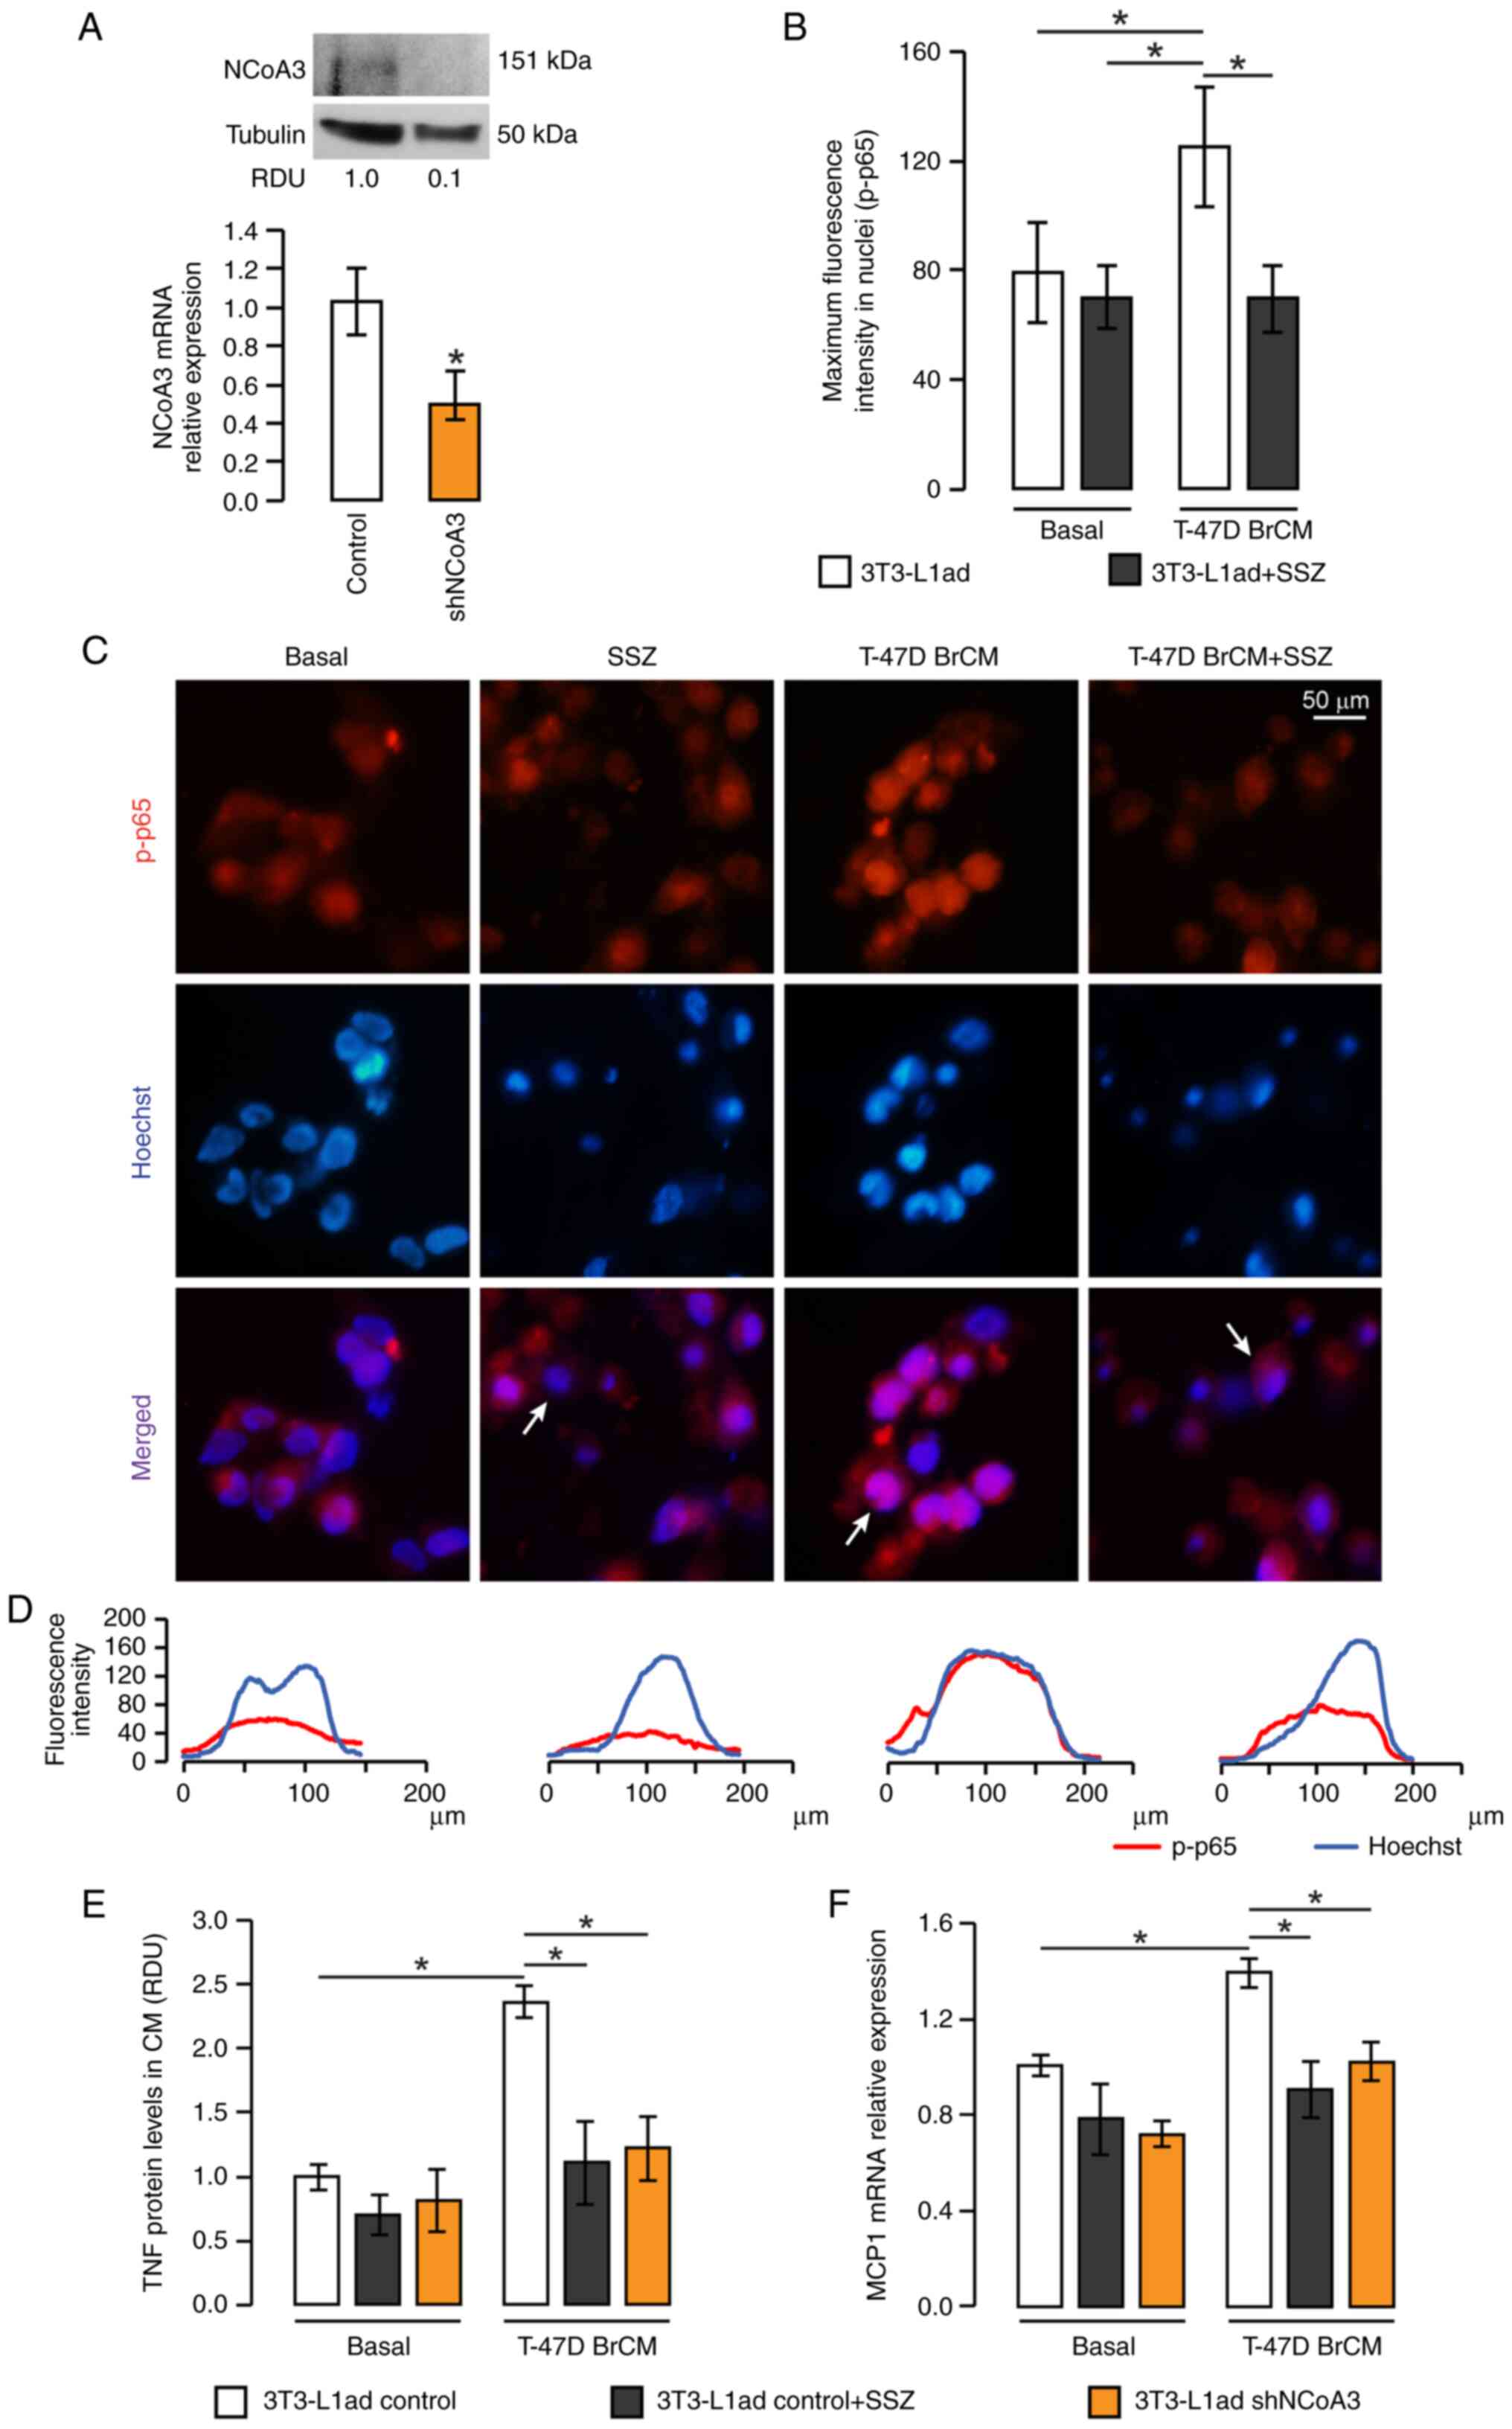 | Figure 2.NCoA3 knockdown inhibits the
expression of pro-inflammatory markers. (A) Knockdown efficiency of
shNCoA3 in 3T3-L1 cells. NCoA3 mRNA expression was determined by
RT-qPCR and was normalized to CyA mRNA expression, and NCoA3
protein expression was determined by western blotting. *P<0.05
vs. control, unpaired Student's t-test. RDU corresponds to the
densitometry unit with respect to tubulin expression. p-p65
location was studied by immunofluorescence in 3T3-L1 adipocytes
stimulated with BrCM from T-47D tumoral cells or with serum-free
medium (basal) in the presence or absence of SSZ (0.2 mM). (B)
Maximum fluorescence intensity quantification for each condition.
*P<0.05, two-way ANOVA and Tukey's post hoc test (C)
Representative microphotographs are shown. (D) Plots show the
fluorescence intensity profile of the indicated cells in (C) (white
arrows). Control or shNCoA3-transfected 3T3-L1 adipocytes were
incubated with T-47D BrCM or serum-free medium in the presence or
absence of SSZ. (E) TNF secretion was studied by dot blot assay,
and membranes were incubated with anti-TNF antibody. (F) mRNA MCP1
expression was determined by RT-qPCR and normalized to CyA mRNA.
*P<0.05, two-way ANOVA and Tukey's post hoc test. Data are
presented as the mean ± SEM. BrCM, conditioned medium from breast
cell lines; CyA, cyclophilin A; MCP1, monocyte chemoattractant
protein 1; NCoA3, nuclear receptor coactivator 3; p-p,
phosphorylated; RDU, relative densitometry units; RT-qPCR, reverse
transcription-quantitative PCR; sh, short hairpin; SSZ,
sulfasalazine; TNF, tumor necrosis factor. |
In order to confirm the role of NF-κB activation in
the upregulation of TNF and MCP1 induced by T-47D BrCM, 3T3-L1
adipocytes were pre-incubated with SSZ before stimulation with
T-47D BrCM. As shown in Fig. 2B-D,
pretreatment with SSZ inhibited T-47D BrCM-induced p65
phosphorylation. In agreement with this result, the expression
levels of TNF and MCP1 were diminished in the presence of SSZ,
confirming that the expression of these genes in adipocytes is
regulated by NF-κB (Figs. 2E and F,
and S1B). Notably, NCoA3 knockdown
also reversed the effects induced by BrCM from T-47D cells on TNF
and MCP1 expression, in the same way as NF-κB inhibition (Figs. 2E and F, and S1B).
These results indicated that NCoA3 expression may be
required to regulate NF-κB-dependent inflammatory mediators, such
as TNF and MCP1. As NF-κB is a key transcription factor of a number
of pro-inflammatory genes, the role of NCoA3 in their expression
should be considered. In response to T-47D BrCM, the levels of TNF
and MCP1 were increased in adipocytes; this is relevant since both
molecules are associated with inflammation.
NCoA3 expression levels in MAT are
modulated by T-47D BrCM
The characteristics of AT depend on its location;
notably, MAT shows totally distinctive features compared with
visceral and subcutaneous AT (32).
Accordingly, the present study analyzed murine MAT following BrCM
treatment. Taking into account the results obtained in 3T3-L1
adipocytes, T-47D and MDA-MB-231 BrCM were used, as T-47D BrCM was
able to upregulate NCoA3 expression, whereas MDA-MB-231 BrCM was
not. Since MCF7 cells lack a secretory pro-inflammatory profile, CM
from this cell line was excluded from these experiments (33).
The results revealed that murine MAT exhibited a
significant increase in the mRNA expression levels of NCoA3
following stimulation with T-47D BrCM (Fig. 3A), which is consistent with the
results obtained in 3T3-L1 adipocytes. In addition, similar results
were obtained regarding the protein expression levels of NCoA3
measured by IHC staining, and the protein localization was mainly
nuclear (Fig. 3B and C).
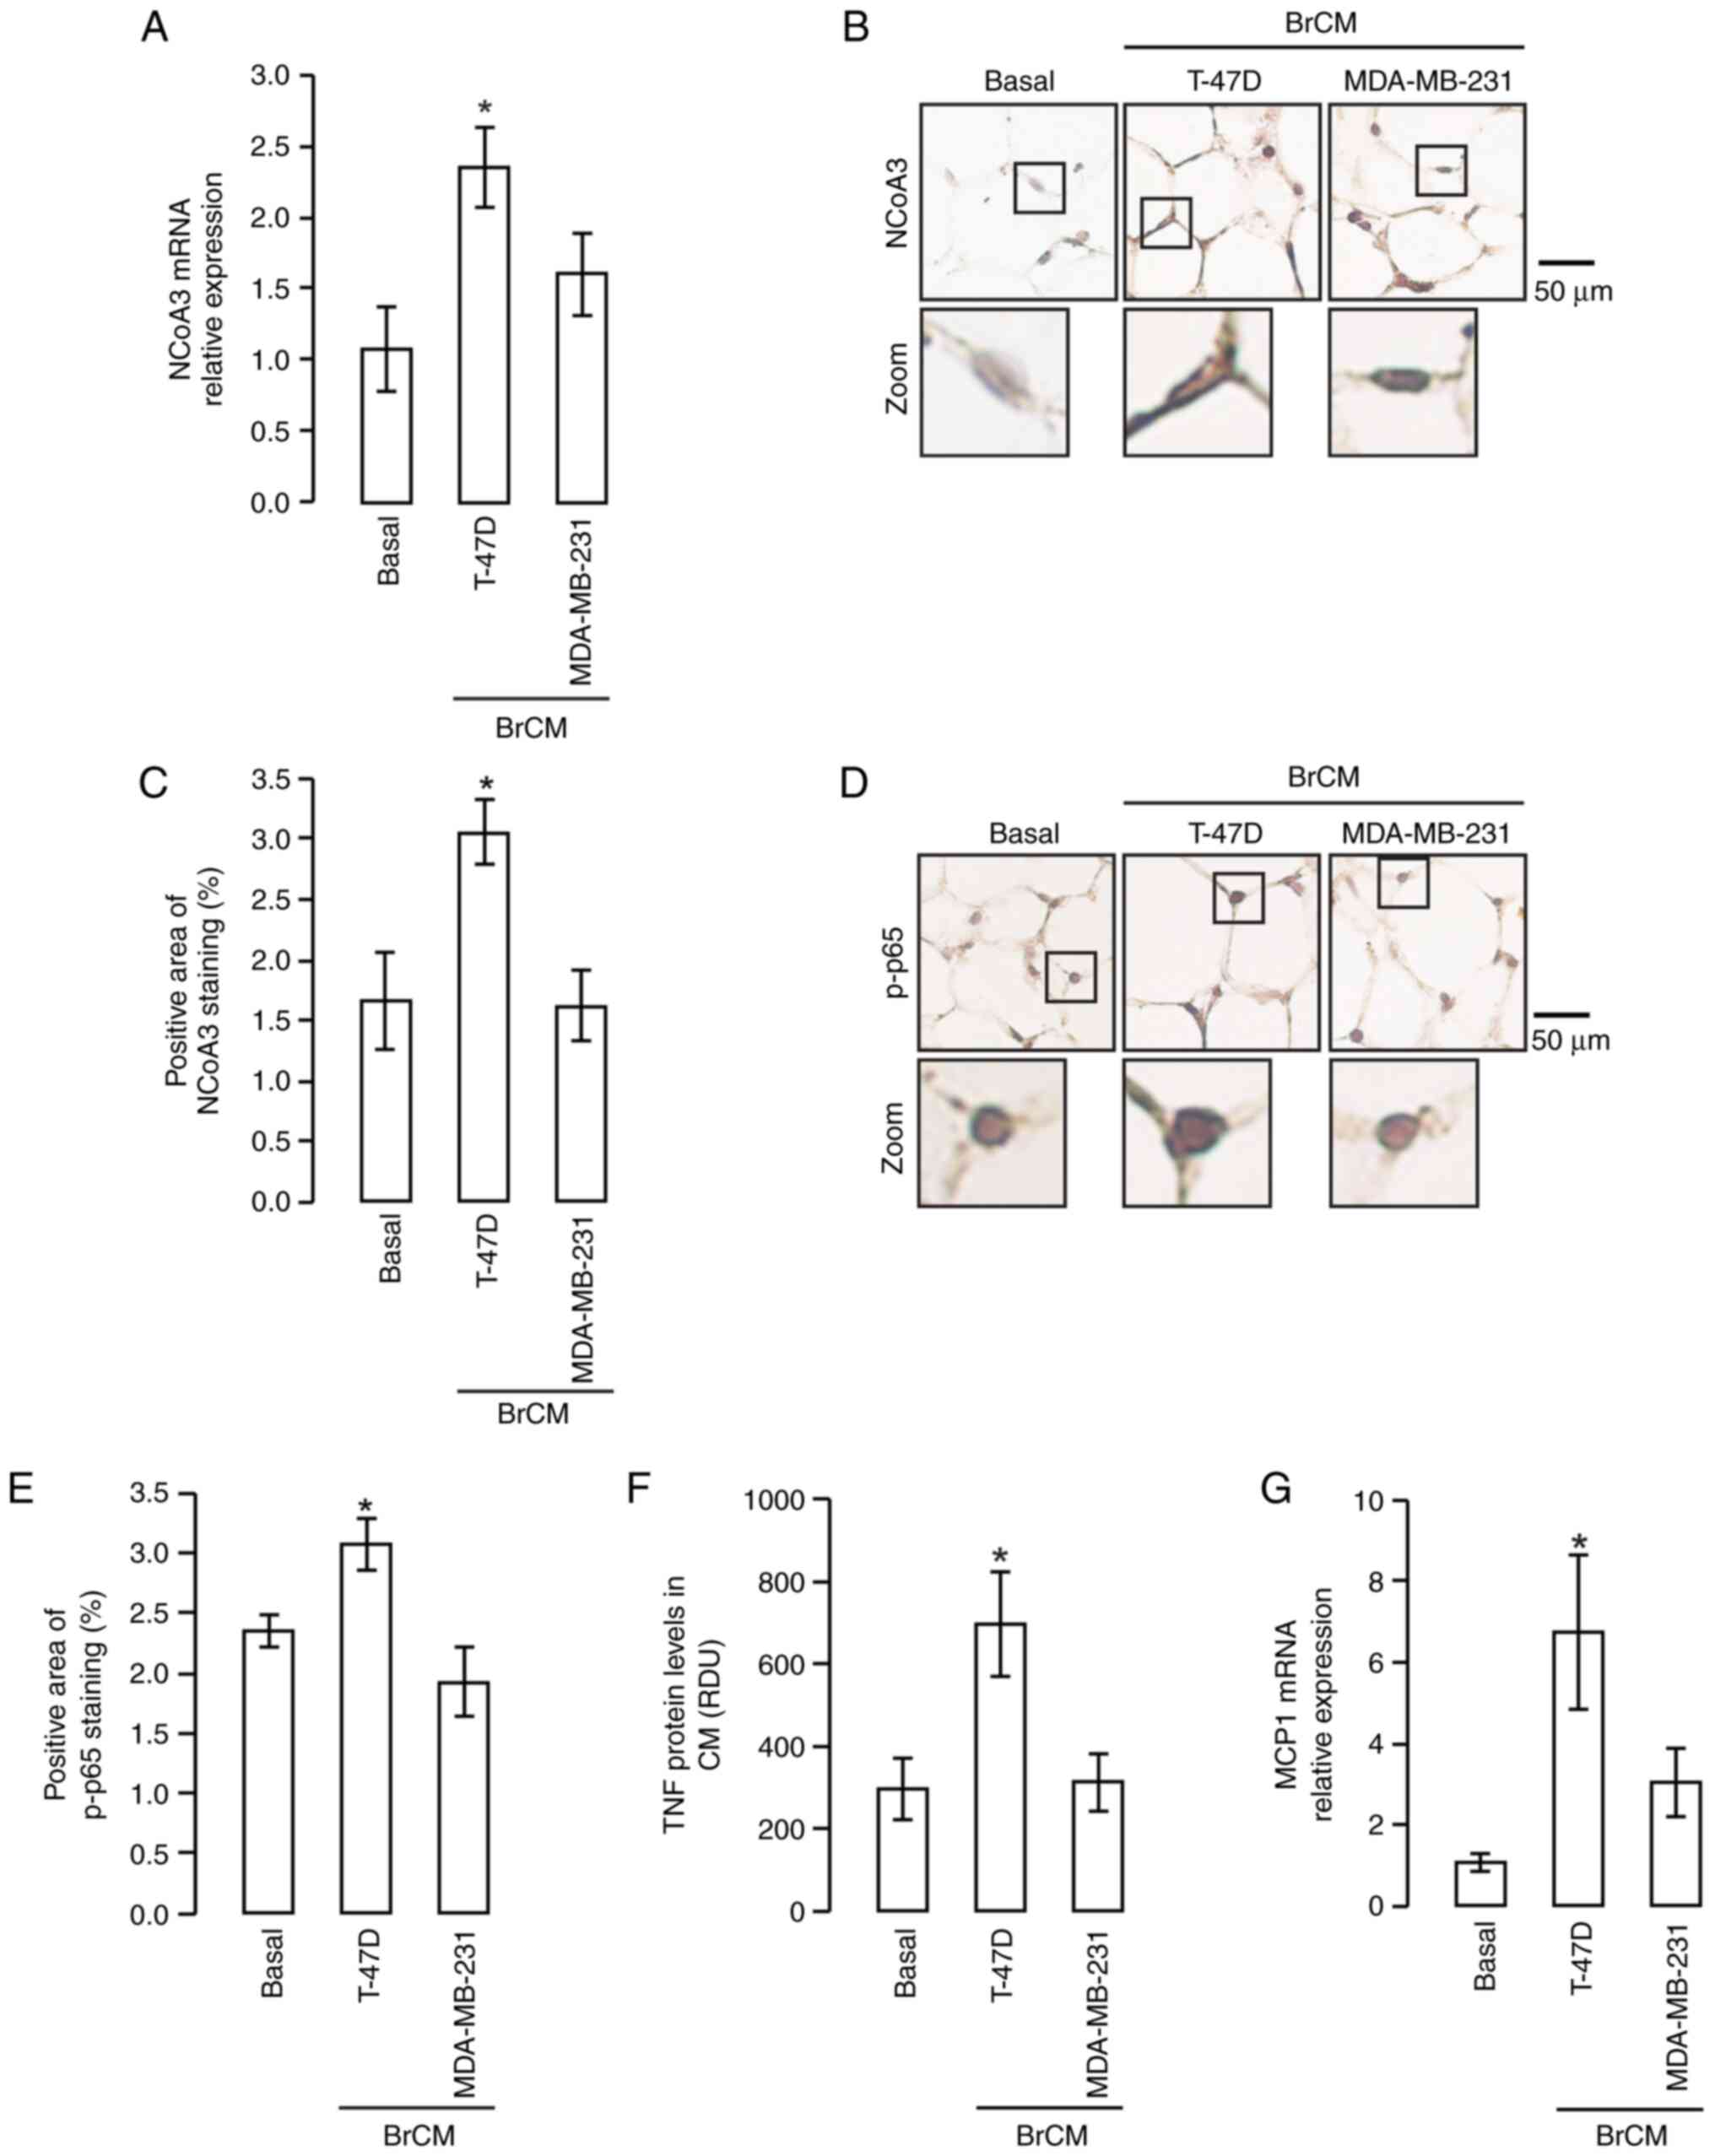 | Figure 3.NCoA3 expression in MAT stimulated
with BrCM NCoA3 expression levels were detected in murine MAT
cultured with or without BrCM from T-47D or MDA-MB-231 cell lines.
(A) NCoA3 mRNA expression was analyzed by RT-qPCR. *P<0.05 vs.
basal, one-way ANOVA and Tukey's post hoc test. Immunostaining of
NCoA3 protein was performed. (B) Representative microphotographs
(magnification, ×400) are shown, lower panels are amplifications of
the black boxes in the upper panels. (C) Semi-quantification of
positive NCoA3 staining area. Immunostaining of p-p65 protein was
performed in murine MAT cultured with or without BrCM from T-47D or
MDA-MB-231 cell lines. *P<0.05 vs. basal, one-way ANOVA and
Tukey's post hoc test. (D) Representative microphotographs
(magnification, ×400) are shown, lower panels are amplifications of
the black boxes in the upper panels. (E) Semi-quantification of
positive p-p65 staining area. *P<0.05 vs. basal, one-way ANOVA
and Tukey's post hoc test. (F) TNF secretion was studied by dot
blot assay in CM from murine MAT after being incubated with BrCM
for 24 h followed by incubation in serum-free medium for another 24
h. *P<0.05 vs. basal, one-way ANOVA and Tukey's post hoc test.
(G) MCP1 expression was analyzed by RT-qPCR in murine explants
cultured in the presence or absence of BrCM. *P<0.05 vs. basal,
one-way ANOVA and Tukey's post hoc test. Data are presented as the
mean ± SEM. BrCM, conditioned medium from breast cell lines; CyA,
cyclophilin A; MAT, mammary adipose tissue; MCP1, monocyte
chemoattractant protein 1; NCoA3, nuclear receptor coactivator 3;
p-p, phosphorylated; RDU, relative densitometry units; RT-qPCR,
reverse transcription-quantitative PCR; TNF, tumor necrosis
factor. |
The present study also analyzed NF-κB activation; it
was observed that murine MAT stimulated with T-47D BrCM exhibited
enhanced staining of p-p65 determined by IHC analysis, as compared
with in MAT under basal conditions and that stimulated with
MDA-MB-231 BrCM (Fig. 3D and E).
These findings demonstrated that the transcription factor NF-κB was
induced by T-47D-secreted molecules.
Alongside the increase in NF-κB activation and NCoA3
expression, it was revealed that T-47D BrCM increased the levels of
TNF secreted by MAT (Figs. 3F and
S1C). Subsequently, MCP1
expression was detected and it was observed that, as with TNF, only
the BrCM from T-47D cells induced MCP1 expression in murine MAT
(Fig. 3G).
In conclusion, these results mimic what was observed
in 3T3-L1 adipocytes and suggested that breast cancer cells take
advantage of adipocyte plasticity, stimulating them in different
ways. Furthermore, in MAT when NCoA3 is upregulated,
pro-inflammatory molecules are also increased.
NCoA3 expression is associated with a
pro-inflammatory profile in tumors in MAT from patients with breast
cancer
Hybrid human/mouse models have been widely used to
study the interaction between tumors and AT (34,35).
However, it is important to study whether the phenomena observed in
these models actually occur in patients. Therefore, MAT samples
were collected from patients with breast cancer or mammary
non-tumoral -lesions. Adjacent to breast tumors, a total of 59% of
MAT samples exhibited high NCoA3 mRNA expression levels, as
determined by RT-qPCR (Table I;
Fig. 4A). In addition, similar
findings were determined regarding the protein expression levels of
NCoA3, which were detected by IHC staining, and as in mice, the
subcellular location of NCoA3 was nuclear (Fig. 4B and C).
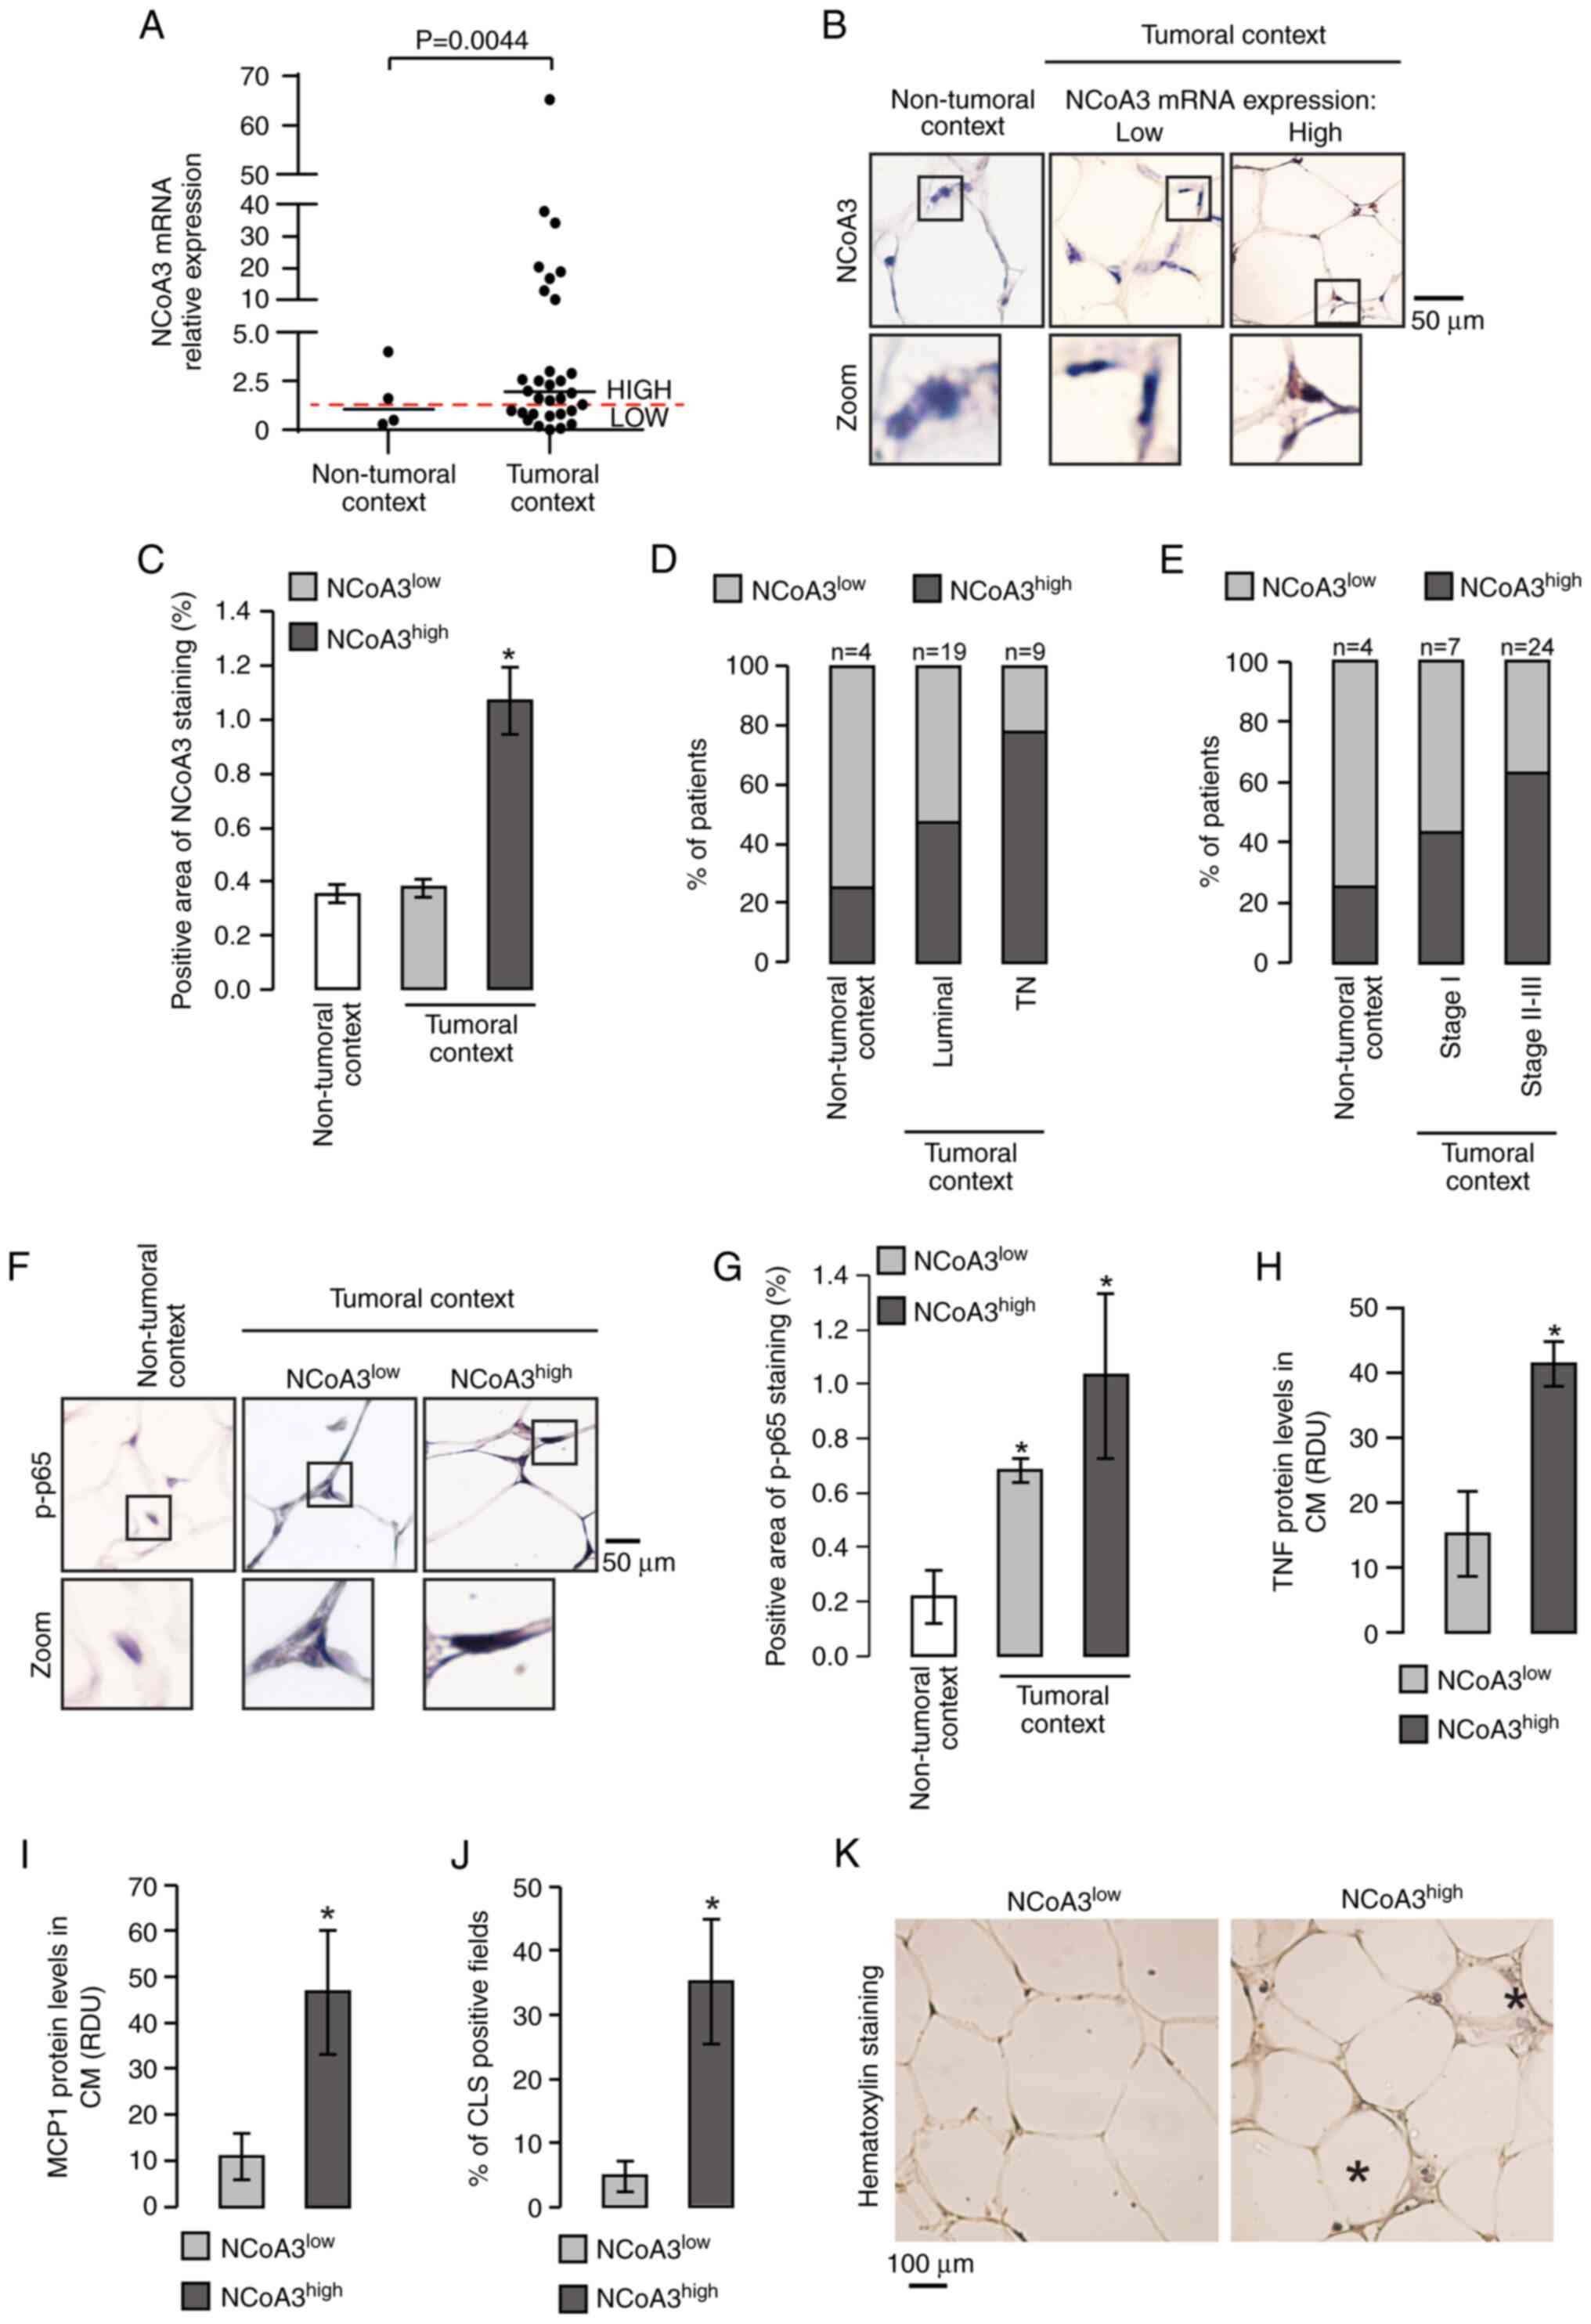 | Figure 4.Association between NCoA3 levels and
NF-κB activation in MAT from the tumor microenvironment: (A) NCoA3
mRNA expression levels were measured by reverse
transcription-quantitative PCR in MAT from patients with
non-tumoral or tumoral lesions. Horizontal lines indicate the
median of NCoA3 expression and each dot corresponds to one patient.
P<0.005, Welch's test. The red dotted line corresponds to the
average of NCoA3 levels obtained in MAT from a non-tumoral context.
Immunostaining of NCoA3 protein was performed in AT adjacent to
mammary glands with non-tumoral lesions or breast cancer. (B)
Representative microphotographs (magnification, ×400) are shown,
lower panels are amplifications of the black boxes in the upper
panels. (C) Graph corresponds to positive NCoA3 staining area. Data
are presented as the mean ± SEM. *P<0.05 vs. NCoA3low
in tumoral context and non-tumoral context, one-way ANOVA and
Tukey's post hoc test. Bar graphs show the distribution of patients
(expressed as a percentage) with high or low NCoA3 expression in
the AT adjacent to their breast tumors classified by (D) molecular
status (TN and luminal: Estrogen receptor-positive and/or
progesterone receptor-positive) and (E) breast cancer stage.
P<0.05, Mantel-Haenszel's test. p-p65 was detected by
immunohistochemistry in MAT adjacent to breast tumors or
non-tumoral lesions. (F) Representative microphotographs are shown;
lower panels are amplifications of the black boxes in the upper
panels. (G) Graph shows positive p-p65 staining area. Data are
presented as the mean ± SEM. *P<0.05 vs. non-tumoral context,
one-way ANOVA and Tukey's post hoc test. (H) TNF and (I) MCP1
secretion was determined by dot blot assay in the CM from MAT
explants obtained from patients with breast cancer. Data are
presented as the mean ± SEM. *P<0.05 vs. low NCoA3 expression,
unpaired Student's t-test. (J) Analysis of CLS in
hematoxylin-stained MAT from patients with breast cancer expressing
low or high NCoA3, bars indicate the percentage of fields
containing at least one CLS per patient sample. Data are presented
as the mean ± SEM. *P<0.05 vs. low NCoA3 expression, unpaired
Student's t-test. (K) Representative microphotographs are shown,
asterisks indicate CLS. CLS, crown-like structures; H&E,
hematoxylin and eosin; MAT, mammary adipose tissue; MCP1, monocyte
chemoattractant protein 1; NCoA3, nuclear receptor coactivator 3;
p-p, phosphorylated; RDU, relative densitometry units; TN, triple
negative; TNF, tumor necrosis factor. |
 | Table I.Association between NCoA3 expression
in mammary adipose tissue and clinicopathological features of
breast cancer. |
Table I.
Association between NCoA3 expression
in mammary adipose tissue and clinicopathological features of
breast cancer.
|
|
| NCoA3 expression
(RT-qPCR) |
|---|
| Variable | Number of
patients |
|
|---|
| Low (%) | High (%) |
|---|
| Sample type |
|
|
|
|
Non-tumoral lesion | 4 | 3 (75) | 1 (25) |
|
Malignant breast cancer | 32 | 13 (41) | 19 (59) |
| Clinical stage |
|
|
|
| I | 7 | 4 (57) | 3 (43) |
|
II–III | 24 | 9 (37) | 15 (63) |
| Molecular
status |
|
|
|
|
Luminal | 19 | 10 (53) | 9 (47) |
| Triple
negative | 9 | 2 (22) | 7 (78) |
The association between NCoA3 expression in MAT
surrounding tumors and molecular tumor markers or clinical stage
was also assessed. Regarding molecular tumor markers, when AT
samples adjacent to lesions were classified into low or high NCoA3
expression, the distribution of patients significantly differed
between the groups. Surrounding AT presented high NCoA3 expression
in 25% of patients with non-tumoral lesions, in 47% of patients
with luminal tumors and 78% of patients with triple negative (TN)
tumors (Fig. 4D). According to
clinical stages, differences were also detected in the distribution
of patients between groups. AT adjacent to lesions presented high
NCoA3 expression in 43% of patients with stage I cancer and in 63%
of patients with stages II–III cancer, in comparison to 25%
observed in patients with non-tumoral lesions (Fig. 4E).
Furthermore, human MAT in the tumoral context showed
an increase in the nuclear staining of p-p65, which was independent
of NCoA3 expression levels (Fig. 4F and
G). However, MAT expressing high levels of NCoA3 secreted more
TNF (Figs. 4H and S1D).
The measurement of MCP1 levels revealed a positive
association with NCoA3 expression levels (Figs. 4I and S1E). MCP1 is a chemokine responsible for
recruiting macrophages, and during local white AT inflammation, the
presence of dead adipocytes surrounded by macrophages, which form
CLS, have been observed (27).
Therefore, the present study analyzed the number of CLS in
hematoxylin-stained sections. An increased percentage of CLS was
observed per field in MAT expressing high levels of NCoA3 (Fig. 4J and K).
The present study aimed to validate the results
obtained in the cohort of patients with breast cancer; therefore,
the records from the E-MTAB-8638 dataset were analyzed (23). In accordance with the results of the
present study, a significant increase in NCoA3 mRNA expression was
detected in MAT adjacent to human breast tumors compared with that
in distant MAT (Fig. 5A). Notably,
high expression levels of NCoA3 were associated with increased
expression of several inflammatory molecules in adMAT, including
TNF and CCL2 (Fig. 5B). There was
also a positive correlation between NCoA3 expression and CD68, a
macrophage marker (Fig. 5C).
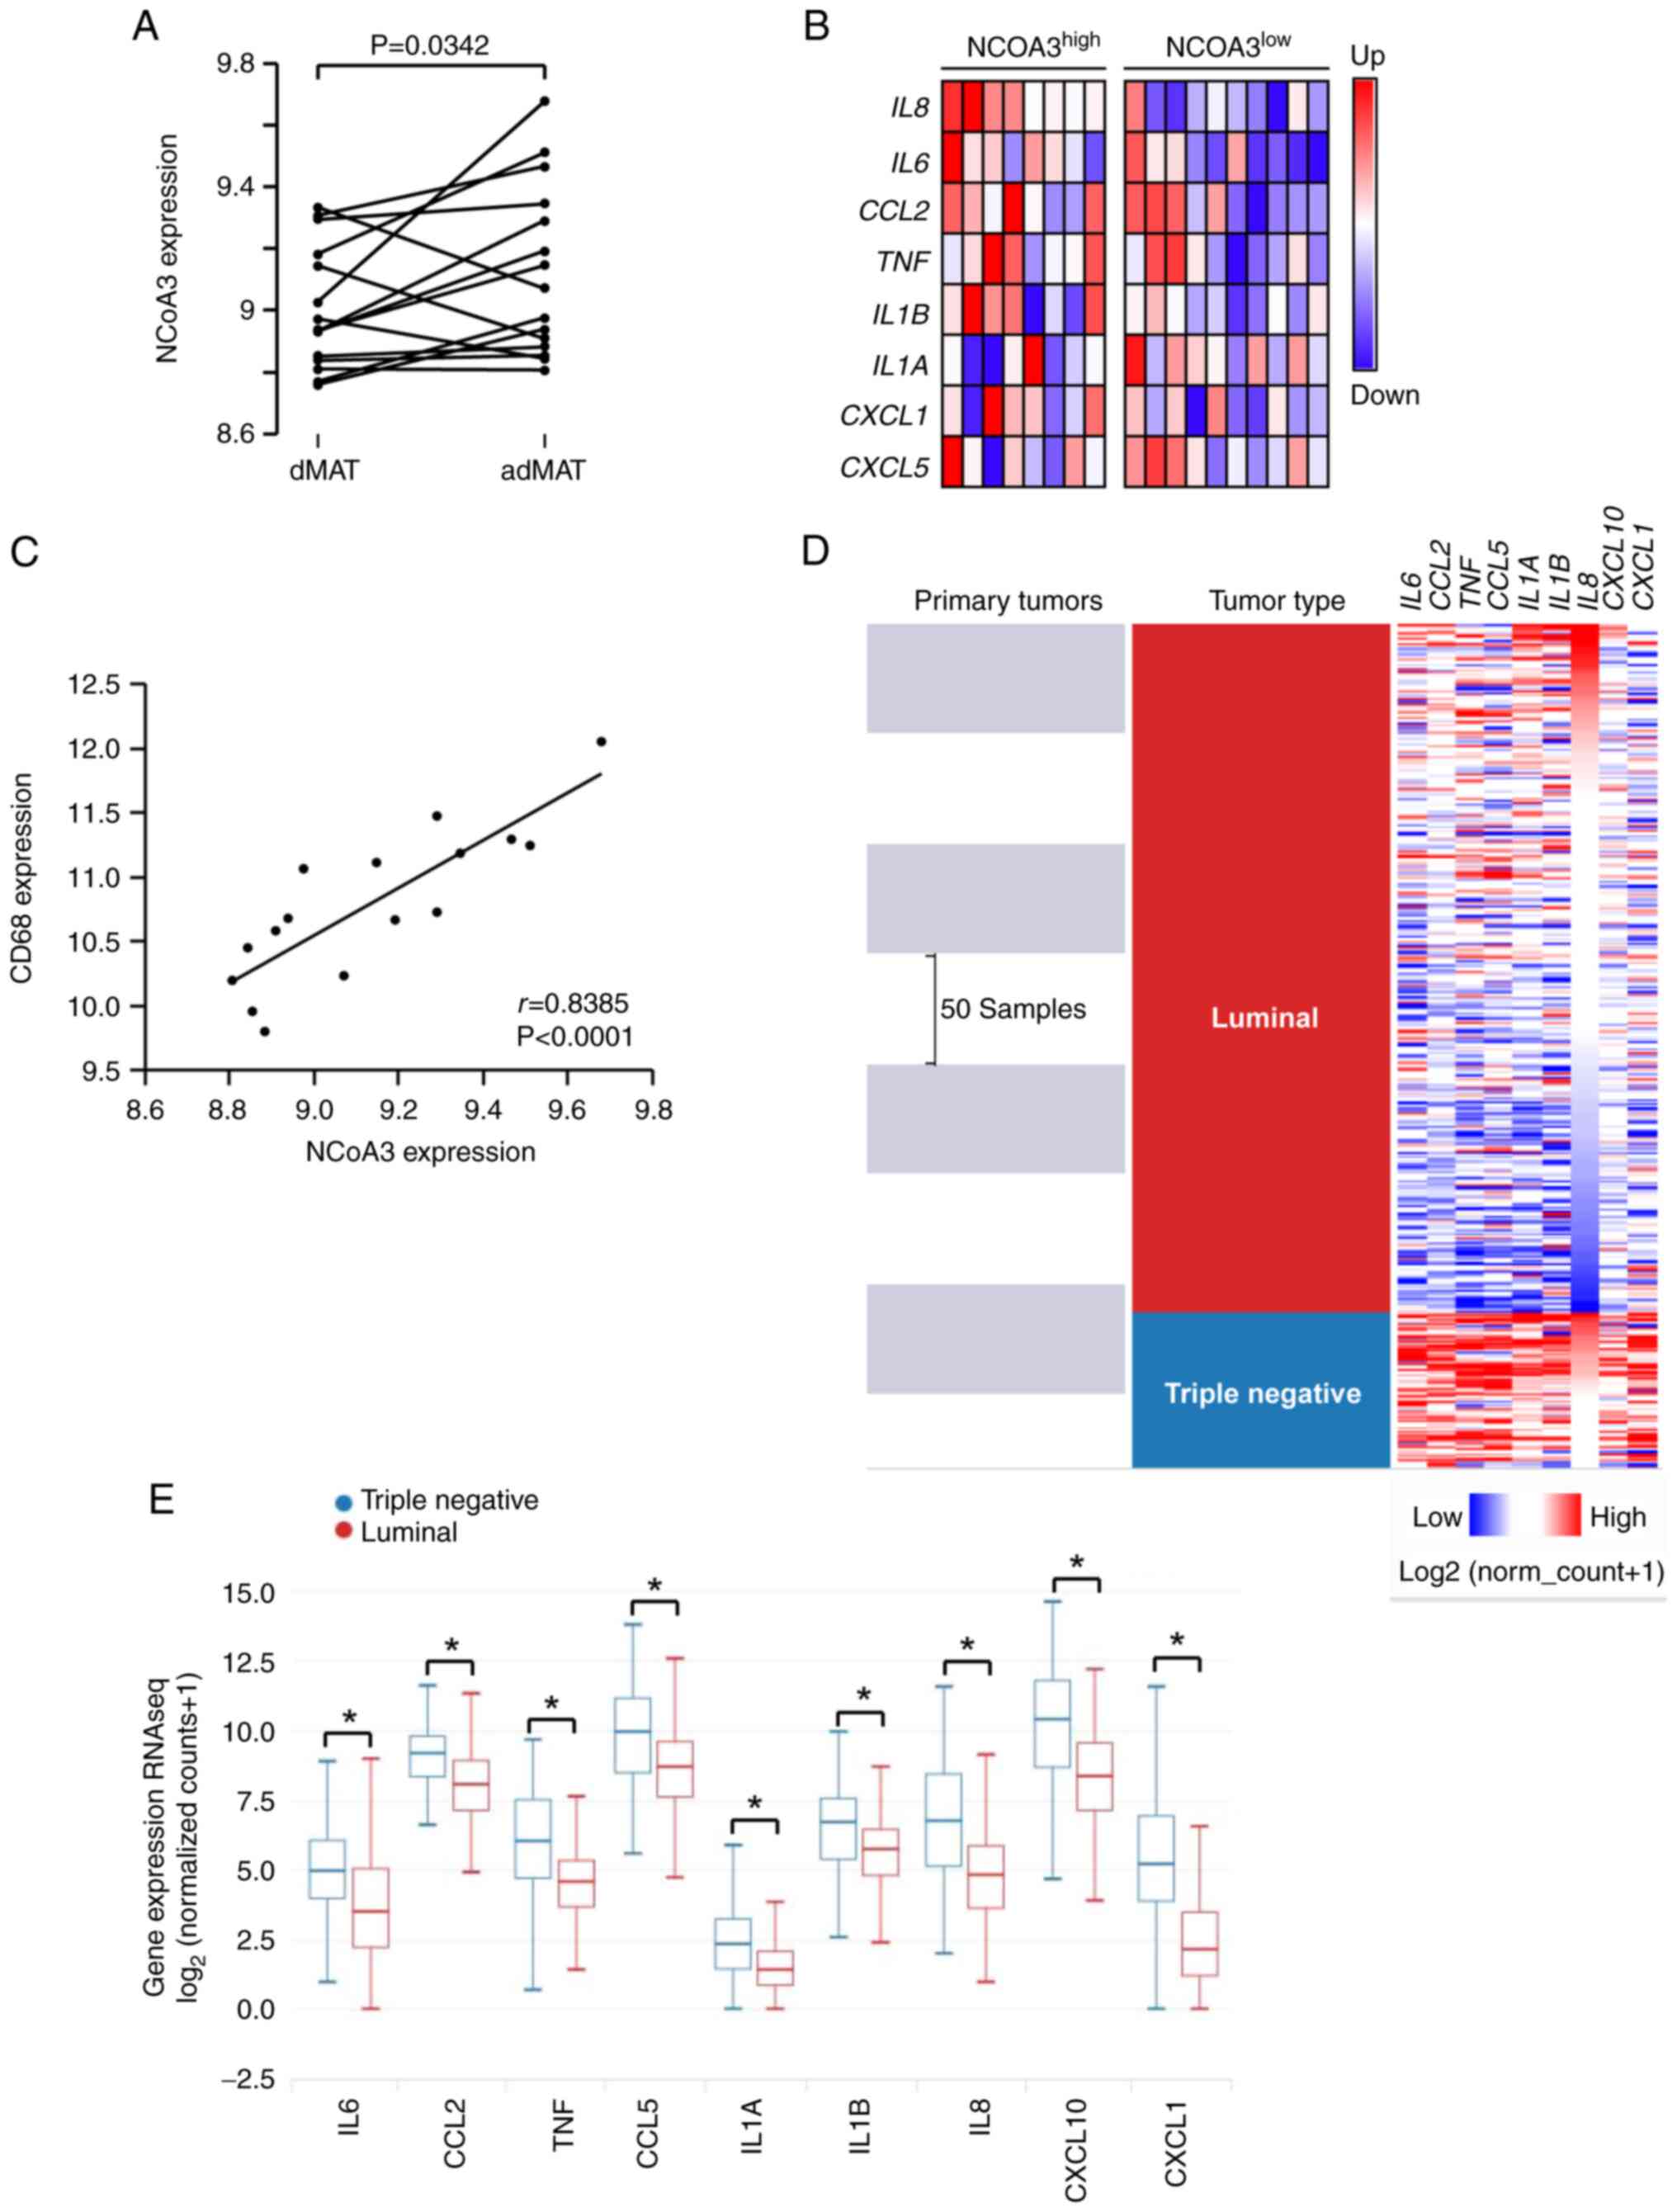 | Figure 5.Association between NCoA3 expression
and adipokines in MAT surrounding breast cancer. mRNA expression
data in adMAT (0.5-1 cm from tumors) and dMAT (>5 cm from
tumors) were retrieved from the E-MTAB-8638 dataset. (A) NCoA3 mRNA
expression levels in dMAT and adMAT from patients with breast
cancer. Each value obtained in each adMAT sample was paired with
the corresponding value in dMAT sample from the same patient.
P=0.0342 (n=16, paired Student's t-test). (B) Heatmap illustrates
the differences in expression of each pro-inflammatory biomarker in
adMAT regarding NCoA3 expression levels, each column represents one
patient (n=18). (C) Scatter plot shows the correlation between CD68
expression levels and NCoA3 expression levels in adMAT (n=16,
Pearson r=0.8385; P<0.001). Bioinformatics analysis was
performed using the Xena platform. (D) Human breast cancer primary
tumor samples (The Cancer Genome Atlas Breast Cancer) were
classified according to molecular features and their cytokine
profile was analyzed. Samples undetermined for the selected
variable were excluded (394 valid datapoints). Red represents
upregulated expression whereas blue corresponds to downregulated
expression. (E) Box plot of cytokine expression (IL6, CCL2, TNF,
CCL5, IL1A, IL1B, IL8, CXCL10 and CXCL1) in triple-negative and
luminal breast tumor samples. *P<0.00005, Welch's test. adMAT,
MAT adjacent to human breast tumors; dMAT, distant MAT; MAT,
mammary adipose tissue; NCoA3, nuclear receptor coactivator 3. |
Our previous study reported that NCoA3 expression is
positively modulated by inflammation (7); therefore, the profile of inflammatory
cytokines in breast tumors was evaluated according to their
molecular characteristics. A bioinformatics analysis of 394 human
breast cancer samples from TCGA was performed using the USCS Xena
platform (36). It was revealed
that most of the TN tumors presented a pro-inflammatory profile,
whereas a small subgroup of luminal tumors exhibited these features
(Fig. 5D). However, the statistical
analysis showed significant differences in cytokine expression
between the luminal and TN breast cancer groups (Fig. 5E). In addition, when tumors were
classified by clinical stage, there were no differences between
patients with stage I cancer and those with cancer in more advanced
stages (II–III) (data not shown).
Consistent with the results obtained in murine MAT
and 3T3-L1 adipocytes, the patients that exhibited upregulation of
NCoA3 expression in cancer-associated AT also presented active
nuclear NF-κB, and high levels of TNF and MCP1. Notably, CLS were
identified in AT expressing high NCoA3 levels, which is a strong
indicator of AT inflammation. Furthermore, most TN tumors exhibited
NCoA3 upregulation in adjacent AT (7/9 patients). Moreover, this
type of tumor was revealed to express pro-inflammatory cytokines,
which could be involved in NCoA3 modulation.
Discussion
It has been demonstrated that stromal cells and
their secreted factors can exert different and diverse effects on
tumor development, influencing proliferation, invasion and
metastasis (25). Experiments
performed with CM revealed that secreted proteins from adipocytes
have effects more pronounced on breast cancer proliferation than
factors released by other cell types (27). However, it is unknown which
transcription factors and cofactors regulate adipokine expression
in the tumor microenvironment.
In breast cancer, constitutive activation of the
transcription factor NF-κB is associated with poor prognosis and
chemoresistance, as well as with hormone-independent breast cancer
progression (37). Since NF-κB has
an important role in breast cancer development, the present study
assessed the implication of this transcription factor in several
models. The results revealed that adipocytes in a tumoral context
had greater NF-κB activation, even though this is not enough to
modulate the expression of the studied target genes. This
transcription factor depends on the presence of cofactors, such as
NCoA3 (30). To the best of our
knowledge, the present study demonstrated for the first time that
NCoA3 expression in breast tumor-associated adipocytes was
upregulated by certain types of tumors. This result was confirmed
by the data obtained in all of the models, including MAT adjacent
to human breast tumors, murine MAT, cell line-derived adipocytes
stimulated with BrCM and bioinformatics analysis of public
datasets.
Previous studies have described a role for NCoA3 in
AT under normal physiological conditions (38,39)
and our previous study demonstrated that NCoA3 levels diminished
during adipogenesis (8), revealing
the importance of this coactivator in adipocyte behavior.
In breast cancer, it has been reported that the
NCoA3 gene is amplified in 5–10% of human tumors and its protein is
overexpressed in 60% of tumors (9,40). In
the breast cancer context, the present results showed that 59% of
MAT adjacent to tumors exhibited upregulation of NCoA3, suggesting
that the expression of this coactivator gives a growth advantage to
mammary tumors and the surrounding AT.
In breast tumors, the association between tumor
NCoA3 expression levels and breast cancer molecular markers is
contradictory, however, patients with breast cancer expressing high
levels of tumoral NCoA3 have shown poor prognosis and
chemoresistance (41–44). Despite the size of the present
cohort, which represents a limitation of the present study, the
percentage of patients expressing high levels of NCoA3 in AT
increased in groups with worse prognosis (TN tumors and advanced
stages). In general, TN tumors exhibit an inflammatory phenotype
that, taking into account our previous results, could lead to the
modulation of NCoA3 levels in AT (7).
In the present hybrid models, it was observed that
T-47D BrCM upregulated NCoA3 expression in adipocytes more so than
BrCM from non-tumoral MCF10A cells, and also tumoral MDA-MB-231 and
MCF7 cell lines. The differential expression of NCoA3 in adipocytes
could be due to differences in tumoral secretomes. Notably, it has
been evidenced that these mammary tumor cell lines secrete distinct
cytokine patterns; for example, T-47D cells release more
pro-inflammatory cytokines, including TNF, than MDA-MB-231, MCF7
and MCF10A cell lines (33).
Moreover, our previous study reported that TNF is able to induce
NCoA3 expression via NF-κB activation (7) and this could explain high expression
of this coactivator in adipocytes stimulated by T-47D BrCM.
However, due to the heterogeneity of BrCM, other molecules should
not be excluded. Furthermore, elucidation of the pathways leading
to the regulation of NCoA3 expression is the aim of our future
studies.
Luminal A cell lines show differences in biological
behavior and protein expression. In this regard, proteomic data
have suggested that T-47D cells express a higher number of proteins
than MCF7 cells (33,45,46).
According to their biological functions, proteins expressed in
T-47D cells are involved in cell proliferation stimulation,
anti-apoptosis mechanisms and tumorigenesis, and only a few
biological processes are shared by both cell lines (33,45,46).
Notably, our previous study demonstrated that the pro-inflammatory
cytokine TNF, via NF-κB, ER and NCoA3 complex, can stimulate T-47D
cell proliferation, but this effect was not observed in MCF7 cells
(13), demonstrating that this
tumoral cell line takes advantage of inflammation. Furthermore, the
MCF7 cell line has been shown to be sensitive to TNF-induced cell
death (47).
Although the present study used BrCM from human cell
lines to stimulate murine adipocytes and the cross-reaction should
not be guaranteed, the capability of human molecules to bind and
stimulate signaling cascades in mice has been reported by other
groups (34,35,48).
In the present results obtained from patient
samples, it was observed that TN tumors exhibited NCoA3
upregulation in AT. However, the TN tumor cell line (MDA-MB-231)
used in the in vitro study did not elicit this effect, which
could be explained by its non-proinflammatory profile (33). Furthermore, there was a small
subgroup of patients with TN breast cancer from TCGA database that
showed non-proinflammatory features. In addition, several patients
with luminal tumors expressed high levels of pro-inflammatory
cytokines, revealing that this inflammatory phenotype does not
exclusively depend on the molecular markers. Notably, although one
of the non-tumoral samples was revealed to express high NCoA3
levels, it was from a patient diagnosed with mastitis, which by
clinical definition is characterized by localized inflammation.
These findings suggested the relevance of the inflammatory context
to NCoA3 expression.
NCoA3 enhances NF-κB activity (30) and this transcription factor is
activated by a wide range of stimuli, such as cytokines and
mitogens, and regulates the expression of these molecules and
others like adhesion molecules, metalloproteinases and apoptotic
genes (6). Two of the NF-κB target
genes that are crucial to the inflammatory process are TNF and
MCP1. Particularly, TNF exerts several effects not only on tumor
cells but also on other stromal cells, including adipocytes, in an
autocrine manner, whereas MCP1 is responsible for monocyte
infiltration and differentiation into macrophages (1,13,27,31,49).
Previous studies have shown that adipocytes can produce cytokines,
such as TNF and MCP1, in the inflammatory context (5,26).
Moreover, the present study revealed that fat cells in a tumoral
context not only expressed more NCoA3 but also presented high
levels of TNF and MCP1.
The dysregulated secretion of pro-inflammatory
cytokines and chemokines, such as TNF and MCP1, by adipocytes can
lead to recruitment of macrophages and the appearance of CLS
(5,49), as observed in the present study. CLS
are a hallmark of chronic AT inflammation, and increased numbers of
CLS in the breast have been associated with increased risk and poor
prognosis of patients with breast cancer in both obese individuals
and those with a normal body mass index (49). CLS formation has been shown to
enhance the expression of inflammatory cytokines/chemokines,
further activating macrophages for clearing apoptotic adipocytes,
generating a positive feedback.
Given the association between NCoA3 and the
inflammatory profile of breast cancer-associated AT, it would be of
great interest in the future to evaluate a panel of inflammatory
cytokines on the CM from samples obtained from responders and
non-responders to current treatments according to immune profile.
This analysis could be correlated with NCoA3 expression in order to
determine whether this coactivator influences antitumor immunity.
However, the informed consent of the patients for the present study
only involved the study of mammary AT and clinical history;
therefore, we were not able to obtain the corresponding tumor
samples for this approach.
The present study also demonstrated that NCoA3
silencing or NF-κB inhibition resulted in a similar reversal in
cytokine expression, suggesting that these molecules are
co-dependent in this process. These results are relevant
considering that the evaluated cytokines favor tumor progression
(13,50), and contribute to the comprehension
of the interaction between adipocytes and breast cancer.
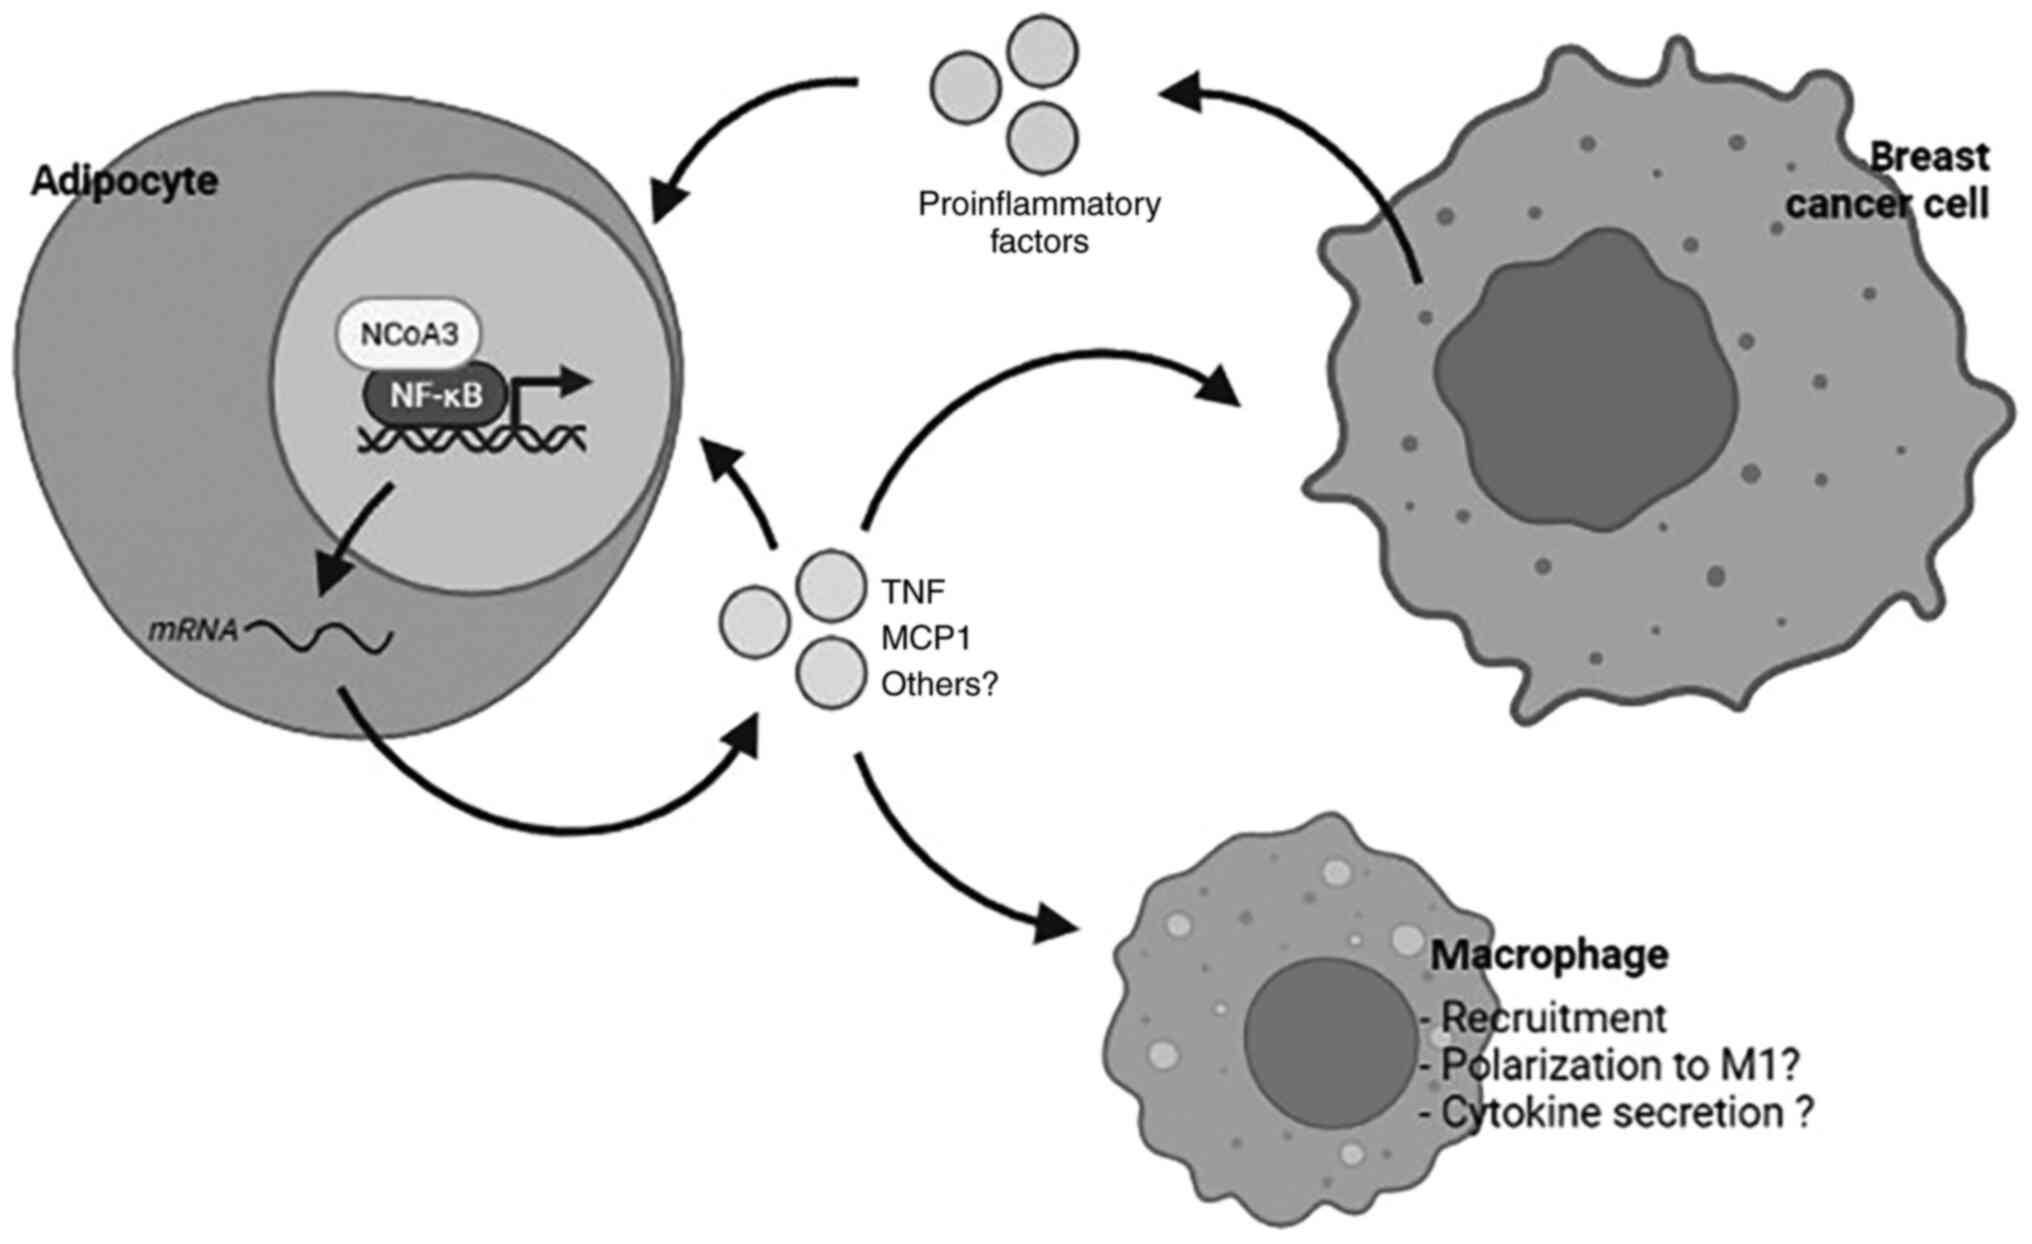
In conclusion, to the best of our knowledge, this is
the first time that the expression of NCoA3 has been reported to be
increased in MAT adjacent to breast cancer. It was hypothesized
that breast cancer-secreted factors may induce the activation of
NF-κB and upregulation of NCoA3 expression, which in turn could
induce the transcription of TNF and MCP1. Once these inflammatory
cytokines are released, they could have effects on adipocytes
themselves, breast cancer cells and also macrophages, propitiating
an inflammatory context that promotes tumor progression and worse
prognosis (Fig. 6).
As adipocytes are involved in the development and
progression of breast cancer, the modulation of NCoA3 levels in MAT
and its possible role in inflammatory processes related to cancer
deserve to be further investigated to improve future cancer
treatments.
Supplementary Material
Supporting Data
Acknowledgements
Not applicable.
Funding
This work was supported by grants from CONICET (grant no.
PIP11220200100991) and the National Agency for Scientific and
Technological Promotion, Argentina (ANPCyT, grant no. PICT
2017-1631).
Availability of data and materials
The datasets generated and/or analyzed during the
current study are available in the EBI databank, https://www.ebi.ac.uk/arrayexpress/experiments/E-MTAB-8638/.
The other datasets used and/or analyzed during the current study
are available from the corresponding author on reasonable
request.
Authors' contributions
MCL, FDR, IA, AGP and MSM were involved in
investigation, methodology, data curation and formal analysis. MCL
performed the experiments using the 3T3-L1 adipocyte model. MCL,
FDR, IA and NP were in charge of animal handling, and obtained
murine MAT and performed related experiments. MCL, AGP, MSM, MCSG,
LP, SB, PJA were involved in obtaining and processing human AT, and
performed the related experiments and corresponding validation.
AGP, MAC and MFR were in charge of data curation and validation.
MAC was involved in funding acquisition, supervision,
conceptualization, reviewing and editing. MFR was involved in
conceptualization, project administration, supervision and writing
the original draft. MAC and AGP confirm the authenticity of all the
raw data. All authors read and approved the final manuscript.
Ethics approval and consent to
participate
All procedures involving human participants were
approved by the Institutional Research Ethic Committee of Institute
of Medical Research Alfredo Lanari (approval no. #312), in
accordance with the ethical standards of the National Law No 25326
‘Protección de datos personales’, Res. 1480/11, Art 58 and 59 from
Commercial and Civil Code of Argentina The 1964 Declaration of
Helsinki and its later amendments, or comparable ethical standards.
Written informed consent was obtained from all individual
participants included in the study. Animal experimental protocols
performed in the present study were approved by the National
University of Quilmes Institutional Animal Care and Use Committee,
in accordance with the National Institutes of Health guide and the
ARRIVE guide for the care and use of laboratory animals.
Patient consent for publication
Participants provided written informed consent for
publication.
Competing interests
The authors declare that they have no competing
interests.
References
|
1
|
Hajer GR, van Haeften TW and Visseren FL:
Adipose tissue dysfunction in obesity, diabetes, and vascular
diseases. Eur Heart J. 29:2959–2971. 2008. View Article : Google Scholar : PubMed/NCBI
|
|
2
|
Nieman KM, Romero IL, Van Houten B and
Lengyel E: Adipose tissue and adipocytes support tumorigenesis and
metastasis. Biochim Biophys Acta. 1831:1533–1541. 2013. View Article : Google Scholar : PubMed/NCBI
|
|
3
|
Bochet L, Meulle A, Imbert S, Salles B,
Valet P and Muller C: Cancer-associated adipocytes promotes breast
tumor radioresistance. Biochem Biophys Res Commun. 411:102–106.
2011. View Article : Google Scholar : PubMed/NCBI
|
|
4
|
Hanahan D and Weinberg RA: Hallmarks of
cancer: The next generation. Cell. 144:646–674. 2011. View Article : Google Scholar : PubMed/NCBI
|
|
5
|
Berstein LM, Kovalevskij AY, Poroshina TE,
Kotov AV, Kovalenko IG, Tsyrlina EV, Leenman EE, Revskoy SY,
Semiglazov VF and Pozharisski KM: Signs of
proinflammatory/genotoxic switch (adipogenotoxicosis) in mammary
fat of breast cancer patients: Role of menopausal status, estrogens
and hyperglycemia. Int J Cancer. 121:514–519. 2007. View Article : Google Scholar : PubMed/NCBI
|
|
6
|
Ghosh S and Karin M: Missing pieces in the
NF-kappaB puzzle. Cell. 109 (Suppl):S81–S96. 2002. View Article : Google Scholar : PubMed/NCBI
|
|
7
|
Alvarado CV, Rubio MF, Fernandez Larrosa
PN, Panelo LC, Azurmendi PJ, Ruiz Grecco M, Martínez-Nöel GA and
Costas MA: The levels of RAC3 expression are up regulated by TNF in
the inflammatory response. FEBS Open Bio. 4:450–457. 2014.
View Article : Google Scholar : PubMed/NCBI
|
|
8
|
Lira MC, Rosa FD, Panelo LC, Costas MA and
Rubio MF: Role of RAC3 coactivator in the adipocyte
differentiation. Cell Death Discov. 5:202018.PubMed/NCBI
|
|
9
|
Anzick SL, Kononen J, Walker RL, Azorsa
DO, Tanner MM, Guan XY, Sauter G, Kallioniemi OP, Trent JM and
Meltzer PS: AIB1, a steroid receptor coactivator amplified in
breast and ovarian cancer. Science. 277:965–968. 1997. View Article : Google Scholar : PubMed/NCBI
|
|
10
|
Liao L, Kuang SQ, Yuan Y, Gonzalez SM,
O'Malley BW and Xu J: Molecular structure and biological function
of the cancer-amplified nuclear receptor coactivator SRC-3/AIB1. J
Steroid Biochem Mol Biol. 83:3–14. 2002. View Article : Google Scholar : PubMed/NCBI
|
|
11
|
Colo GP, Rubio MF, Nojek IM, Werbajh SE,
Echeverría PC, Alvarado CV, Nahmod VE, Galigniana MD and Costas MA:
The p160 nuclear receptor co-activator RAC3 exerts an
anti-apoptotic role through a cytoplasmatic action. Oncogene.
27:2430–2444. 2008. View Article : Google Scholar : PubMed/NCBI
|
|
12
|
Fernandez Larrosa PN, Alvarado CV, Rubio
MF, Ruiz Grecco M, Micenmacher S, Martinez-Noel GA, Panelo L and
Costas MA: Nuclear receptor coactivator RAC3 inhibits autophagy.
Cancer Sci. 103:2064–2071. 2012. View Article : Google Scholar : PubMed/NCBI
|
|
13
|
Rubio MF, Werbajh S, Cafferata EG,
Quaglino A, Coló GP, Nojek IM, Kordon EC, Nahmod VE and Costas MA:
TNF-alpha enhances estrogen-induced cell proliferation of
estrogen-dependent breast tumor cells through a complex containing
nuclear factor-kappa B. Oncogene. 25:1367–1377. 2006. View Article : Google Scholar : PubMed/NCBI
|
|
14
|
Rubio MF, Lira MC, Rosa FD, Sambresqui AD,
Salazar Guemes MC and Costas MA: RAC3 influences the
chemoresistance of colon cancer cells through autophagy and
apoptosis inhibition. Cancer Cell Int. 17:1112017. View Article : Google Scholar : PubMed/NCBI
|
|
15
|
Yunokawa M, Yoshida H, Watanabe R, Noguchi
E, Shimomura A, Shimoi T, Yonemori K, Shimizu C, Fujiwara Y and
Tamura K: Allred score is a promising predictor of prognosis and
medroxyprogesterone acetate efficacy in patients with endometrial
cancer. Cancer Chemother Pharmacol. 80:127–134. 2017. View Article : Google Scholar : PubMed/NCBI
|
|
16
|
Gradishar WJ, Anderson BO, Balassanian R,
Blair SL, Burstein HJ, Cyr A, Elias AD, Farrar WB, Forero A,
Giordano SH, et al: Breast Cancer, Version 4.2017, NCCN Clinical
Practice Guidelines in Oncology. J Natl Compr Canc Netw.
16:310–320. 2018. View Article : Google Scholar : PubMed/NCBI
|
|
17
|
Fain JN, Tagele BM, Cheema P, Madan AK and
Tichansky DS: Release of 12 adipokines by adipose tissue, nonfat
cells, and fat cells from obese women. Obesity (Silver Spring).
18:890–896. 2009. View Article : Google Scholar : PubMed/NCBI
|
|
18
|
Percie du Sert N, Ahluwalia A, Alam S,
Avey MT, Baker M, Browne WJ, Clark A, Cuthill IC, Dirnagl U,
Emerson M, et al: Reporting animal research: Explanation and
elaboration for the ARRIVE guidelines 2.0. PLoS Biol.
18:e30004112020. View Article : Google Scholar : PubMed/NCBI
|
|
19
|
Ruifrok AC and Johnston DA: Quantification
of histochemical staining by color deconvolution. Anal Quant Cytol
Histol. 23:291–299. 2001.PubMed/NCBI
|
|
20
|
Fain JN, Buehrer B, Bahouth SW, Tichansky
DS and Madan AK: Comparison of messenger RNA distribution for 60
proteins in fat cells vs the nonfat cells of human omental adipose
tissue. Metabolism. 57:1005–1015. 2008. View Article : Google Scholar : PubMed/NCBI
|
|
21
|
Zhong H and Simons JW: Direct comparison
of GAPDH, beta-actin, cyclophilin, and 28S rRNA as internal
standards for quantifying RNA levels under hypoxia. Biochem Biophys
Res Commun. 259:523–526. 1999. View Article : Google Scholar : PubMed/NCBI
|
|
22
|
Livak KJ and Schmittgen TD: Analysis of
relative gene expression data using real-time quantitative PCR and
the 2(−Delta Delta C(T)) method. Methods. 25:402–408. 2001.
View Article : Google Scholar : PubMed/NCBI
|
|
23
|
Miran I, Scherer D, Ostyn P, Mazouni C,
Drusch F, Bernard M, Louvet E, Adam J, Mathieu MC, Haffa M, et al:
Adipose tissue properties in tumor-bearing breasts. Front Oncol.
10:15062020. View Article : Google Scholar : PubMed/NCBI
|
|
24
|
Ritchie ME, Phipson B, Wu D, Hu Y, Law CW,
Shi W and Smyth GK: limma powers differential expression analyses
for RNA-sequencing and microarray studies. Nucleic Acids Res.
43:e472015. View Article : Google Scholar : PubMed/NCBI
|
|
25
|
Dirat B, Bochet L, Dabek M, Daviaud D,
Dauvillier S, Majed B, Wang YY, Meulle A, Salles B, Le Gonidec S,
et al: Cancer-associated adipocytes exhibit an activated phenotype
and contribute to breast cancer invasion. Cancer Res. 71:2455–2465.
2011. View Article : Google Scholar : PubMed/NCBI
|
|
26
|
Hauner H: Secretory factors from human
adipose tissue and their functional role. Proc Nutr Soc.
64:163–169. 2005. View Article : Google Scholar : PubMed/NCBI
|
|
27
|
Iyengar P, Combs TP, Shah SJ, Gouon-Evans
V, Pollard JW, Albanese C, Flanagan L, Tenniswood MP, Guha C,
Lisanti MP, et al: Adipocyte-secreted factors synergistically
promote mammary tumorigenesis through induction of anti-apoptotic
transcriptional programs and proto-oncogene stabilization.
Oncogene. 22:6408–6423. 2003. View Article : Google Scholar : PubMed/NCBI
|
|
28
|
Zamboni M, Di Francesco V, Garbin U,
Fratta Pasini A, Mazzali G, Stranieri C, Zoico E, Fantin F, Bosello
O and Cominacini L: Adiponectin gene expression and adipocyte
NF-kappaB transcriptional activity in elderly overweight and obese
women: inter-relationships with fat distribution, hs-CRP, leptin
and insulin resistance. Int J Obes (Lond). 31:1104–1109. 2007.
View Article : Google Scholar : PubMed/NCBI
|
|
29
|
Sasaki CY, Barberi TJ, Ghosh P and Longo
DL: Phosphorylation of RelA/p65 on serine 536 defines an
I{kappa}B{alpha}-independent NF-{kappa}B pathway. J Biol Chem.
280:34538–34547. 2005. View Article : Google Scholar : PubMed/NCBI
|
|
30
|
Werbajh S, Nojek I, Lanz R and Costas MA:
RAC-3 is a NF-kappa B coactivator. FEBS Lett. 485:195–199. 2000.
View Article : Google Scholar : PubMed/NCBI
|
|
31
|
Fain JN and Madan AK: Regulation of
monocyte chemoattractant protein 1 (MCP-1) release by explants of
human visceral adipose tissue. Int J Obes (Lond). 29:1299–1307.
2005. View Article : Google Scholar : PubMed/NCBI
|
|
32
|
Choi J, Cha YJ and Koo JS: Adipocyte
biology in breast cancer: From silent bystander to active
facilitator. Prog Lipid Res. 69:11–20. 2018. View Article : Google Scholar : PubMed/NCBI
|
|
33
|
Chen K, Satlof L, Stoffels G, Kothapalli
U, Ziluck N, Lema M, Poretsky L and Avtanski D: Cytokine secretion
in breast cancer cells-MILLIPLEX assay data. Data Brief.
28:1047982020. View Article : Google Scholar : PubMed/NCBI
|
|
34
|
Luis C, Duarte F, Faria I, Jarak I,
Oliveira PF, Alves MG, Soares R and Fernandes R: Warburg Effect
Inversion: Adiposity shifts central primary metabolism in MCF-7
breast cancer cells. Life Sci. 223:38–46. 2019. View Article : Google Scholar : PubMed/NCBI
|
|
35
|
Nickel A, Blucher C, Kadri OA, Schwagarus
N, Müller S, Schaab M, Thiery J, Burkhardt R and Stadler SC:
Adipocytes induce distinct gene expression profiles in mammary
tumor cells and enhance inflammatory signaling in invasive breast
cancer cells. Sci Rep. 8:94822018. View Article : Google Scholar : PubMed/NCBI
|
|
36
|
Goldman MJ, Craft B, Hastie M, Repečka K,
McDade F, Kamath A, Banerjee A, Luo Y, Rogers D, Brooks AN, et al:
Visualizing and interpreting cancer genomics data via the Xena
platform. Nat Biotechnol. 38:675–678. 2020. View Article : Google Scholar : PubMed/NCBI
|
|
37
|
Biswas DK, Shi Q, Baily S, Strickland I,
Ghosh S, Pardee AB and Iglehart JD: NF-kappa B activation in human
breast cancer specimens and its role in cell proliferation and
apoptosis. Proc Natl Acad Sci USA. 101:10137–10142. 2004.
View Article : Google Scholar : PubMed/NCBI
|
|
38
|
Louet JF, Coste A, Amazit L, Tannour-Louet
M, Wu RC, Tsai SY, Tsai MJ, Auwerx J and O'Malley BW: Oncogenic
steroid receptor coactivator-3 is a key regulator of the white
adipogenic program. Proc Natl Acad Sci USA. 103:17868–17873. 2006.
View Article : Google Scholar : PubMed/NCBI
|
|
39
|
Wang Z, Qi C, Krones A, Woodring P, Zhu X,
Reddy JK, Evans RM, Rosenfeld MG and Hunter T: Critical roles of
the p160 transcriptional coactivators p/CIP and SRC-1 in energy
balance. Cell Metab. 3:111–122. 2006. View Article : Google Scholar : PubMed/NCBI
|
|
40
|
Torres-Arzayus MI, Font de Mora J, Yuan J,
Vazquez F, Bronson R, Rue M, Sellers WR and Brown M: High tumor
incidence and activation of the PI3K/AKT pathway in transgenic mice
define AIB1 as an oncogene. Cancer Cell. 6:263–274. 2004.
View Article : Google Scholar : PubMed/NCBI
|
|
41
|
Burandt E, Jens G, Holst F, Jänicke F,
Müller V, Quaas A, Choschzick M, Wilczak W, Terracciano L, Simon R,
et al: Prognostic relevance of AIB1 (NCoA3) amplification and
overexpression in breast cancer. Breast Cancer Res Treat.
137:745–753. 2013. View Article : Google Scholar : PubMed/NCBI
|
|
42
|
Iwase H, Omoto Y, Toyama T, Yamashita H,
Hara Y, Sugiura H and Zhang Z: Clinical significance of AIB1
expression in human breast cancer. Breast Cancer Res Treat.
80:339–345. 2003. View Article : Google Scholar : PubMed/NCBI
|
|
43
|
Lee K, Lee A, Song BJ and Kang CS:
Expression of AIB1 protein as a prognostic factor in breast cancer.
World J Surg Oncol. 9:1392011. View Article : Google Scholar : PubMed/NCBI
|
|
44
|
Weiner M, Skoog L, Fornander T,
Nordenskjold B, Sgroi DC and Stal O: Oestrogen receptor
co-activator AIB1 is a marker of tamoxifen benefit in
postmenopausal breast cancer. Ann Oncol. 24:1994–1999. 2013.
View Article : Google Scholar : PubMed/NCBI
|
|
45
|
Aka JA and Lin SX: Comparison of
functional proteomic analyses of human breast cancer cell lines
T47D and MCF7. PLoS One. 7:e315322012. View Article : Google Scholar : PubMed/NCBI
|
|
46
|
Calderon-Gonzalez KG, Valero Rustarazo ML,
Labra-Barrios ML, Bazán-Méndez CI, Tavera-Tapia A, Herrera-Aguirre
ME, Sánchez del Pino MM, Gallegos-Pérez JL, González-Márquez H,
Hernández-Hernández JM, et al: Determination of the protein
expression profiles of breast cancer cell lines by quantitative
proteomics using iTRAQ labelling and tandem mass spectrometry. J
Proteomics. 124:50–78. 2015. View Article : Google Scholar : PubMed/NCBI
|
|
47
|
Zyad A, Benard J, Tursz T, Clarke R and
Chouaib S: Resistance to TNF-alpha and adriamycin in the human
breast cancer MCF-7 cell line: Relationship to MDR1, MnSOD, and TNF
gene expression. Cancer Res. 54:825–831. 1994.PubMed/NCBI
|
|
48
|
Smith RA, Kirstein M, Fiers W and Baglioni
C: Species specificity of human and murine tumor necrosis factor. A
comparative study of tumor necrosis factor receptors. J Biol Chem.
261:14871–14874. 1986. View Article : Google Scholar : PubMed/NCBI
|
|
49
|
Iyengar NM, Morris PG, Zhou XK, Gucalp A,
Giri D, Harbus MD, Falcone DJ, Krasne MD, Vahdat LT, Subbaramaiah
K, et al: Menopause is a determinant of breast adipose
inflammation. Cancer Prev Res (Phila). 8:349–358. 2015. View Article : Google Scholar : PubMed/NCBI
|
|
50
|
Divella R, De Luca R, Abbate I, Naglieri E
and Daniele A: Obesity and cancer: the role of adipose tissue and
adipo-cytokines-induced chronic inflammation. J Cancer.
7:2346–2359. 2016. View Article : Google Scholar : PubMed/NCBI
|