Introduction
The occurrence and development of insulin resistance
(IS) are complex processes involving the mutual regulation of
numerous gene networks. Previous studies have indicated that
hepatitis C virus (HCV) infection promotes hepatic IS, which is
closely associated with the dysfunction of insulin receptor
substrate (IRS) pathways, which are important in the glucose
metabolism (1–3). Microarray data processing facilitates
the construction of cellular gene regulatory networks and clarifies
the possible interactions among genes. Further analysis of these
networks confirms that certain biological processes or signaling
pathways involve multiple genes and aids in the deduction of the
associations between biological molecules including action
consistency, metabolism direction and co-expression association
(4).
In the present study, the networks of 50 major
differentially expressed genes between Huh7 and HCV-Huh7 cells were
constructed using the Gene Regulatory Network Inference Tool
(GRNInfer) linear analysis software. The upstream and downstream
networks of each gene were confirmed and were extrapolated to
identify whether they are enhanced or inhibited. Additionally, the
function alterations of IRS1 and IRS2 at gene network level in Huh7
and HCV-Huh7 cells were projected using Molecule Annotation System
(MAS) version 3.0 online gene annotation and cluster software and
the Database for Annotation, Visualization, and Integrated
Discovery (DAVID). These networks were used to determine the
impacts of HCV infection on the metabolism of Huh7 cells and the
relevant signaling mechanisms.
Materials and methods
Data sources
The data used in the current study were obtained
from the Gene Expression Omnibus (GEO) expression database from the
National Center for Biotechnology Information (www.ncbi.nlm.nih.gov/geo/). The microarray serial
number used in the current study used is GSE20948 (www.ncbi.nlm.nih.gov/geo/query/acc.cgi?acc=GSE20948).
The array contains 14 groups of Huh7 cells and 14 groups of
HCV-Huh7 cells, each including 2 groups of cells extracted at 6 h,
3 groups at 12 h, 3 groups at 18 h, 3 groups at 24 h and 3 groups
at 48 h. The raw data were collected in the CEL format,
standardized and converted into a logarithm using Expression
Console 1.4.1, 64-bit software from Affymetrix, Inc. (Santa Clara,
CA, USA).
Significance analysis of gene
expression
Significance analysis of microarray (SAM) is a
t-test-based statistical analysis method used to determine
significant differences when using microarray data. The present
study used the SAM function of MultiExperiment Viewer sub-software
of TM4 (www.tm4.org/mev.html) to analyze the
alterations in gene functions and select the top 50 significantly
differentially expressed genes (Table
I).
 | Table ITop 50 significant genes identified
by significance analysis of microarray analysis. |
Table I
Top 50 significant genes identified
by significance analysis of microarray analysis.
| Gene ID | Gene name | Fold change |
|---|
| 201010_s_at | Thioredoxin
interacting protein | 21.518297 |
| 203438_at | Stanniocalcin
2 | 20.873947 |
| 210587_at | Inhibin, βE | 19.26132 |
| 201008_s_at | Thioredoxin
interacting protein | 15.231962 |
| 203439_s_at | Stanniocalcin
2 | 14.20261 |
| 201009_s_at |
Thioredoxin-interacting protein) | 13.7505045 |
| 238029_s_at | Solute carrier
family 16 (monocarboxylic acid transporters), member 14 | 11.429825 |
| 205047_s_at | Asparagine
synthetase (glutamine-hydrolyzing) | 11.315236 |
| 231202_at | Aldehyde
dehydrogenase 1 family, member L2 | 11.254294 |
| 225283_at | Arrestin domain
containing 4 | 10.549104 |
| 228653_at | Sterile α motif
domain containing 5 | 9.061874 |
| 202672_s_at | Activating
transcription factor 3 | 8.782885 |
| 201300_s_at | Prion protein | 7.5039783 |
| 212909_at | LY6/PLAUR domain
containing 1 | 7.415823 |
| 218332_at | Brain expressed
gene 1 | 7.3808937 |
| 203372_s_at | Suppressor of
cytokine signaling 2 | 7.347132 |
| 219195_at | Peroxisome
proliferator-activated receptor γ, coactivator 1α | 6.9846096 |
| 212810_s_at | Solute carrier
family 1 (glutamate/neutral amino acid transporter), member 4 | 6.877748 |
| 210426_x_at | RAR-related orphan
receptor A | 6.6006436 |
| 209183_s_at | Chromosome 10 open
reading frame 10 | 6.530727 |
| 226682_at | RAR-related orphan
receptor α | 6.4361844 |
| 202393_s_at | Kruppel-like factor
10 | 6.4241524 |
| 214285_at | Fatty acid binding
protein 3, muscle and heart | 6.3771186 |
| 203882_at | Interferon
regulatory factor 9 | 6.129926 |
| 221523_s_at | Ras-related GTP
binding D | 6.011061 |
| 212295_s_at | Solute carrier
family 7 (cationic amino acid transporter, y + system), member
1 | 5.976633 |
| 1554008_at | Oncostatin M
receptor | 5.8743997 |
| 218851_s_at | SFT2 domain
containing 3 WD repeat domain 33 | 5.831587 |
| 223681_s_at | InaD-like
(Drosophila) | 5.778195 |
| 203373_at | Suppressor of
cytokine signaling 2 | 5.741121 |
| 209651_at | Transforming growth
factor β1 induced transcript 1 | 5.6655536 |
| 201063_at | Reticulocalbin
1 | 5.624495 |
| 1569433_at | Sterile α motif
domain containing 5 | 5.4978223 |
| 206382_s_at | Brain-derived
neurotrophic factor | 5.459223 |
| 221530_s_at | Basic
helix-loop-helix family, member e41 | 5.424661 |
| 228708_at | RAB27B, member RAS
oncogene family | 5.3274593 |
| 209185_s_at | Insulin receptor
substrate 2 | 5.273203 |
| 209610_s_at | Solute carrier
family 1 (glutamate/neutral amino acid transporter), member 4 | 5.230212 |
| 214755_at |
UDP-N-acteylglucosamine pyrophosphorylase
1-like 1 | 5.206161 |
| 202847_at | Phosphoenolpyruvate
carboxykinase 2 (mitochondrial) | 5.199079 |
| 227037_at | Phospholipase D
family, member 6) | 5.078215 |
| 225539_at | Zinc finger protein
295 | 5.0584846 |
| 210479_s_at | RAR-related orphan
receptor α | 5.0370793 |
| 212290_at | Solute carrier
family 7 (cationic amino acid transporter, y + system), member
1 | 5.0187483 |
| 228519_x_at | Cold inducible RNA
binding protein | 4.95052 |
| 219584_at | Phospholipase A1
member A | 4.935018 |
| 242979_at | Insulin receptor
substrate 1 | 4.919549 |
| 202949_s_at | Four and a half LIM
domains 2 | 4.856401 |
| 1568813_at | B3
domain-containing proteinLOC_Os12g40080-like | 4.792747 |
| 212811_x_at | Solute carrier
family 1 (glutamate/neutral amino acid transporter), member 4 | 4.7892227 |
Construction of gene regulatory
networks
The gene networks of the top 50 significantly
differentially expressed genes between Huh7 and HCV-Huh7 cells were
constructed using GRNInfer (digbio.missouri.edu/grninfer/) and GVedit version 2.38
(portableapps.com/node/38245) tools.
GRNInfer (5) is a linear
programming and decomposition algorithm for calculating gene
networks from microarray data. Gene regulation is frequently
non-linear; however, due to the complexity of biological structures
and lack of data, various gene regulatory networks available are
based on linear or additive models. From the perspective of dynamic
systems, linear equations may be used to elucidate the main
features of networks or functions. The following equation may
represent every possible network of a data set (5): J = (X′ − A) U^1
VT = YV = J + YVT. Where J =
(Jij) mxm = δ∫(χ)/δχ is an
nxm Jacobian matrix or connectivity matrix, X =
[χ(t1),…, χ(tm)], J and all
mxn matrices with
χ′i(tj) =
[χi(tj + 1) −
χi(tj)]/(tj +
1 − tj) for i = 1,…, n; j =
1,…m.X(t) = χ1(t),…,
χn(t)TERn,a =
(a1,…,an)TERn,
χi(t) is the expression level (mRNA concentrations)
of gene i at time intance t. y =
(yij) is an nxm matrix, where
yij is zero if ej=0. U
is a unitary mxn matrix of left eigenvectors, ^ =
diag(e1,…,en) is a diagonal
nxm matrix containing n eigenvalues and
VT is the transpose of a unitary
nxm matrix of right eigenvectors (5). The parameters selected were λ=0.0 and
threshold=1×10⁻⁹.
DAVID cluster analysis
DAVID (david.ncifcrf.gov/) is a gene function clustering tool
using the bio-module as the center for large-scale genome analysis
(6,7). It combines Kappa statistics features
and the heuristic fuzzy clustering features and converts the model
centered on functional annotation terminology and gene functions
into a biological block pattern, extracting gene function
annotation data from different biological databases and enriching
common functional annotation of these databases.
MAS 3.0 analysis
MAS 3.0 (bioinfo.capitalbio.com/mas3/) is a free online
analysis platform for high-throughout microarray gene function
annotation and enrichment analysis. Its annotation system utilizes
the following databases: Genbank, European Molecular Biology
Laboratory, SwissPort, Gene Ontology (GO), Kyoto Encyclopedia of
Genes and Genomes (KEGG), BioCarta, GeneMAPP, mirBase, Eukaryotic
Promoter, Human Protein Reference Database, Membrane-Based
Interactome Database, Biomolecular Interaction Network Database,
Intact, TRANScription FACtor, UniGene, Single Nucleotide
Polymorphism Database, Online Mendelian Inheritance in Man,
InterPro, Human Genome Organisation, Mouse Genome Informatics and
the Rat Genome Database, in order to provide functional annotations
of genes, mRNAs, proteins, GO, metabolic pathways, regulatory
genes, diseases, small interfering RNAs and tissue factors. The MAS
3.0 system provides flexible and interactive enrichment features.
Using enrichment analysis with the pathway as the index as an
example, the system can provide the index by input symbol, index by
pathway and gene correlation as the three possible enrichment
paths. The index by pathway system provides the pathway enrichment
results of the three databases KEGG, GeneMAPP and BioCarta and
presents the results in data table and gene-pathway network graph
forms.
Results
Construction of IRS1 and IRS2 networks in
Huh7 and HCV-Huh7 cells
From the 50 significantly differentially expressed
genes in Huh7 and HCV-Huh7 cells, IRS1 (fold change, 4.919549) and
IRS2 (fold change, 5.273203) alone belong to the IRS family.
Therefore, they were used as the target genes for further analysis.
The networks of IRS1 and IRS2 in Huh7 and HCV-Huh7 cells were
constructed. The networks indicate that in Huh7 cells, IRS1 is
activated by Kruppel-like factor 10 (KLF10), IRS2, and four and a
half LIM domains 2 (FHL2), and inhibited by solute carrier family 7
(cationic amino acid transporter, y + system), member 1 (SLC7A1),
and IRS1 did not regulate any genes itself. IRS2 is activated by
thioredoxin interacting protein (TXNIP), KLF10, activating
transcription factor 3 (ATF3) and IRS2, and inhibited by
reticulocalbin 1 (RCN1), FHL2, suppressor of cytokine signaling 2
(SOCS2), stanniocalcin 2 (STC2), inhibin β E (INHBE) and SLC7A1,
while IRS2 activated oncostatin M receptor, TXNIP, RCN1, prion
protein, B3 domain-containing proteinLOC_Os12g40080-like
(LOC100128809), KLF10, ATF3, phosphoenolpyruvate carboxykinase 2,
FHL2, SOCS2, STC2, interferon regulatory factor 9 (IRF9),
asparagine synthetase (glutamine-hydrolyzing) (ASNS), brain-derived
neurotrophic factor, chromosome 10 open reading frame 10
(C10orf10), IRS2, solute carrier family 1 (glutamate/neutral amino
acid transporter), member 4 (SLC1A4), transforming growth factor β1
induced transcript 1 (TGFB1I1), RAR-related orphan receptor A
(RORA), SLC7A1, SLC1A4, LY6/PLAUR domain containing 1,
LOC100134073, fatty acid binding protein 3, WD repeat domain 33,
PPARG coactivator 1 α (PPARGC1A), phospholipase A1 member A
(PLA1A), Ras-related GTP binding D, basic helix-loop-helix family
member e41 (BHLHE41), InaD-like (Drosophila), arrestin
domain containing 4, zinc finger protein 295 (ZNF295), RORA,
phospholipase D family member 6 (PLD6), sterile α motif domain
containing 5 (SAMD5), RAB27B member RAS oncogene family, solute
carrier family 16 member 14 (SLC16A14) and IRS1, and inhibited
SAMD5, INHBE and UDP-N-acetylglucosamine pyrophosphorylase 1 like
1. In HCV-Huh7 cells, IRS1 was activated by ATF3 and ASNS, and
inhibited by INHBE and RCN1, and IRS1 did not regulate any genes.
IRS2 was activated by ATF3, STC2, ASNS and SLC7A1, and inhibited by
TXNIP, RCN1, IRS2 and INHBE. IRS2 activated SOCS2, C10orf10 and
SLC16A14, however inhibited KLF10, IRS2, SLC7A1, PLA1A and ZNF295.
The the network of IRS1 and IRS2 in Huh7 and HCV-Huh7 cells is
presented in Fig. 1.
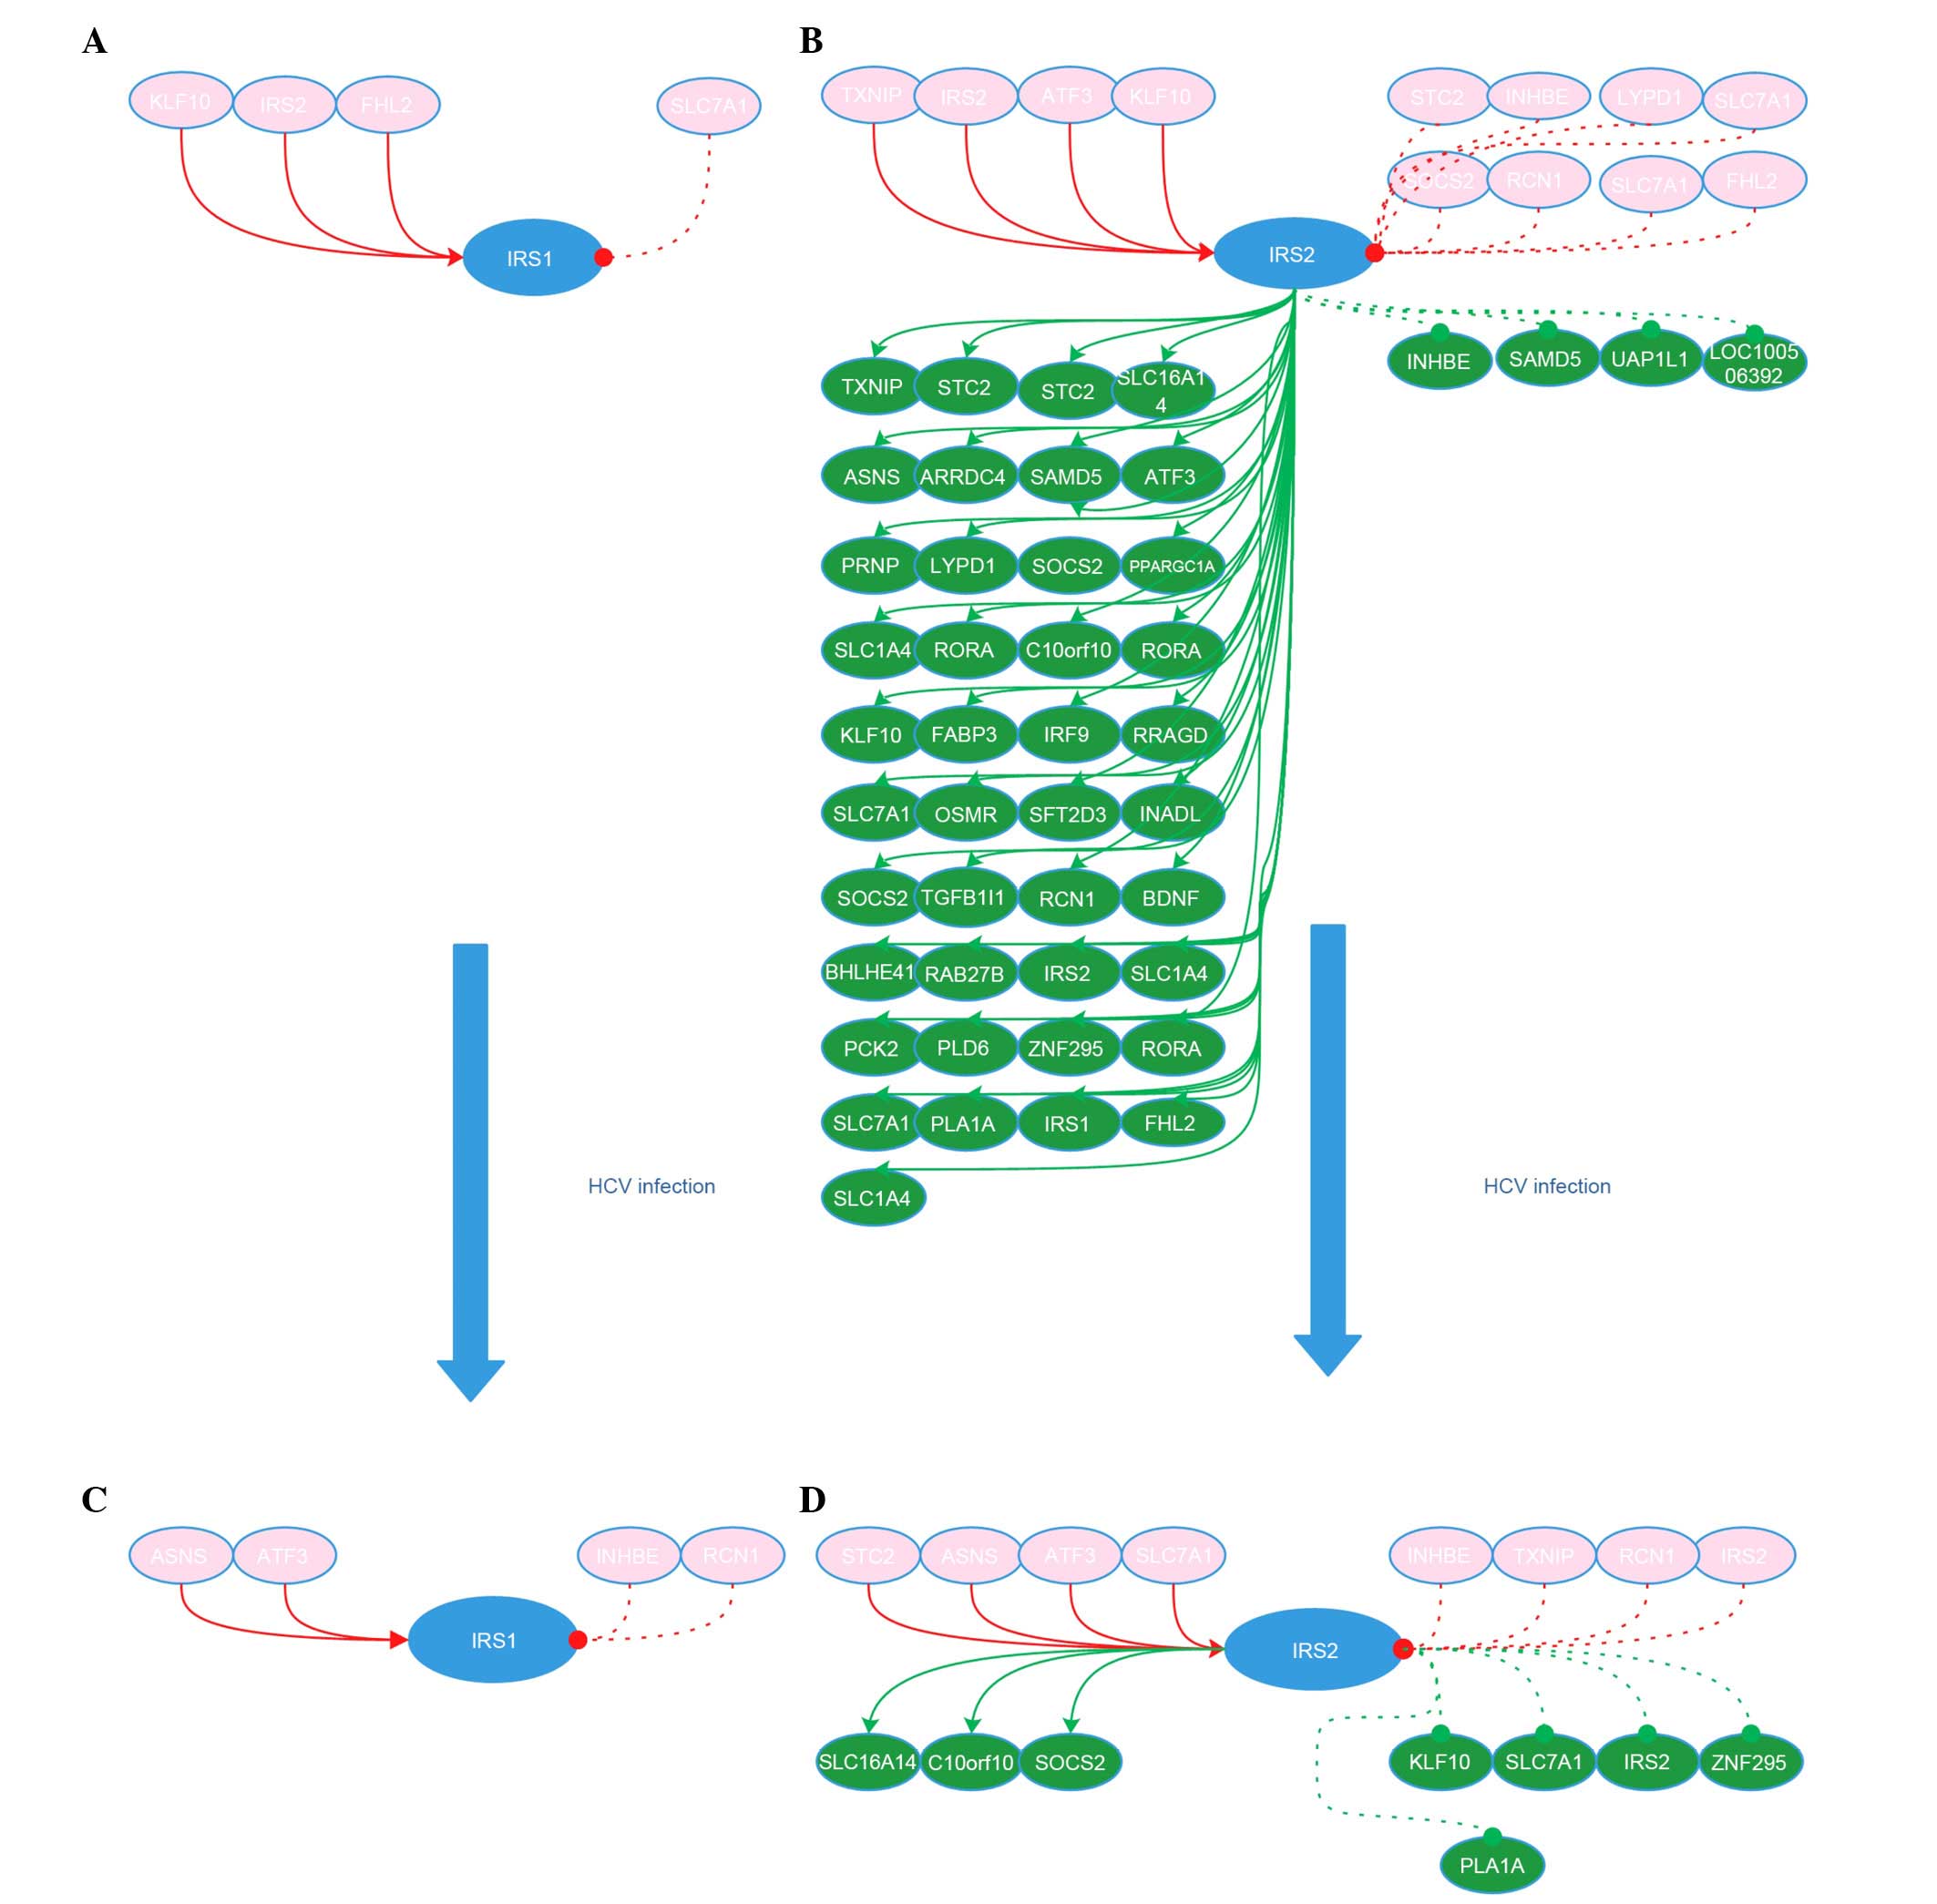 | Figure 1IRS1 and IRS2 network in Huh7 and
HCV-infected Huh7 cells. (A) IRS1 network in Huh7 cells. (B) IRS2
network in Huh7 cells. (C) IRS1 network in HCV-Huh7 cell lines. (D)
IRS2 network in HCV-Huh7 cell lines. Red circle with gene name
indicates the genes upstream of IRS1 or IRS2. Green circle with
gene name indicates the genes downstream of IRS1 or IRS2. Solid red
line with red arrow indicates the activation of the gene in the
upstream of IRS1 or IRS2 to IRS1 or IRS2. Dashed red line with red
dot indicates the inactivation role of the gene upstream of IRS1 or
IRS2 to IRS1 or IRS2. Solid green line with green arrow indicates
the activation role of IRS1 or IRS2 to the gene downstream of IRS1
or IRS2. Dashed green line with green dot indicates the inhibitory
role of IRS1 or IRS2 to the gene downstream of IRS1 or IRS2. IRS,
insulin receptor substrate; HCV, hepatitis C virus; KLF10,
kruppel-like factor 10; STC2, stanniocalcin 2; INHBE, inhibin βE;
LYPD1, LY6/PLAUR domain containing 1; SOCS2, suppressor of cytokine
signaling 2; RCN1, EF-hand calcium binding domain; FHL2, four and a
half LIM domains 2; SLC16A14, solute carrier family 16
(monocarboxylic acid transporters), member 14; ASNS, asparagine
synthetase (glutamine-hydrolyzing); ARRDC4, arrestin domain
containing 4; SAMD5, sterile α motif domain containing 5; ATF3,
activating transcription factor 3; PRNP, prion protein; PPARGC1A,
peroxisome proliferator-activated receptor γ, coactivator 1α; OSMR,
oncostatin M receptor; SFT2D3 WDR33, SFT2 domain containing3 WD
repeat domain 33; INADL, InaD-like (Drosophila); TGFB1I1,
transforming growth factor β1 induced transcript 1; BDNF,
brain-derived neurotrophic factor; BHLHE41, basic helix-loop-helix
family, member e41; RAB27B, RAB27B member RAS oncogene family;
PCK2, phosphoenolpyruvate carboxykinase 2 (mitochondrial); PLD6,
phospholipase D family, member 6; ZNF295, zinc finger protein 295;
PLA1A, phospholipase A1 member A; SAMD5, sterile α motif domain
containing 5; UAP1L1, UDP-N-acteylglucosamine pyrophosphorylase
1-like 1; LOC100506392, B3 domain-containing
proteinLOC_Os12g40080-like. |
MAS 3.0 network analysis
The IRS1 and IRS2 sub-networks in Huh7 and HCV-Huh7
cells were then compared and the number of genes in each network
was statistically analyzed by inputting the genetic codes into MAS
3.0 software, the enriched pathways and the GO networks. In Huh7
cells, 4 genes were upstream of IRS1, of which, 3 activate IRS1,
and 1 inhibits IRS1; the former are enriched in 14 GOs and 3
pathways, while the latter is enriched in 3 GOs, however zero
pathways. No gene was identified downstream of IRS1; therefore,
none were enriched in GO and pathways. In HCV-Huh7 cells, 4 genes
are upstream of IRS1, of which, 2 activate IRS1, and 2 inhibit
IRS1; the former are enriched in 7 GOs and 2 pathways, while the
latter are not enriched in any GOs or pathways. No gene was
identified downstream of IRS1 and subsequently, none were enriched
in any GO and pathways.
IRS2 sub-networks in Huh7 cells are more abundant
when compared with IRS1 sub-networks. In Huh7 cells, 13 genes are
upstream of IRS2. A total of 4 are functional enhancement genes and
are enriched in 3 pathways and 16 GO, 9 are suppressor genes and
are enriched in 5 pathways and 21 GOs. Notably, 45 genes are
downstream of IRS2. Among them, 41 are activated by IRS2 and
enriched in 15 pathways and 139 GOs and 3 are inhibited by IRS2 and
enriched in 2 pathways and 4 GOs. In HCV-Huh7 cells, 8 genes are
upstream of IRS2 and 8 genes are downstream of IRS2. Among the 8
upstream genes, 4 are functional enhancement genes and enriched in
2 pathways and 4 GOs; 4 are function suppressor genes and enriched
in 5 pathways and 10 GOs. From the 8 downstream genes, 3 are
activated by IRS2 and enriched in 3 pathways and 7 GOs and 5 are
inhibited by IRS2 and enriched in 4 pathways and 18 GOs. These
results indicated that compared with IRS1, IRS2 is more active in
Huh7 cells, particularly in its activated downstream genes and
their corresponding pathways and GOs. However, following HCV
infection, its activated downstream genes, their corresponding
pathways and GOs reduced from 43, 15 and 139 to 3, 3 and 7,
respectively.
Network gene function module
To verify the biological information obtained during
the MAS 3.0 analysis, the DAVID Gene Functional Classification Tool
software was used to enrich the functional modules of the
sub-networks of IRS1 and IRS2 in Huh7 and HCV-Huh7 cells. The
enrichment results indicated that there are no activation and
inhibition functional modules downstream and upstream of IRS1 in
Huh7 and HCV-Huh7 cells, and no activation and inhibition modules
downstream and upstream of IRS2 in Huh7 and HCV-Huh7 cells with the
exception of 3 activation functional modules being enriched in the
downstream of IRS2, cluster 1, cluster 2 and cluster 3. The
functions of cluster 1, include transcription factor, repressor,
DNA-binding region, basic motif, identical protein binding, DNA
binding, transcription regulation, transcription, transcription
regulator activity, regulation of transcription, DNA-dependent,
regulation of transcription, regulation of RNA metabolic process,
transcription factor activity, nucleus and DNA binding. The
functions of cluster 2, include activator, DNA binding, androgen
signaling pathway, steroid hormone receptor binding, intracellular
receptor-mediated signaling pathway, nuclear hormone receptor
binding, intracellular signaling cascade, transcription cofactor
activity, transcription coactivator activity, transcription factor
binding, transcription activator activity, androgen receptor
binding, hormone receptor binding, zinc-finger, regulation of
transcription from RNA polymerase II promoter, positive regulation
of macromolecule biosynthetic process, positive regulation of
cellular biosynthetic process, positive regulation of macromolecule
metabolic process, positive regulation of transcription
DNA-dependent, positive regulation of DNA metabolic process,
positive regulation of transcription, positive regulation of gene
expression, positive regulation of nucleobase, nucleoside,
nucleotide and nucleic acid metabolic process, positive regulation
of regulation of nitrogen compound metabolic process, transcription
regulation, transcription, phosphoprotein, zinc, transition metal
ion binding, metal-binding, zinc ion binding, metal ion binding,
cation binding, ion binding, transcription regulation activity,
regulation of transcription, DNA-dependent, regulation of RNA
metabolic, regulation of transcription. The functions of cluster 3,
include glycoprotein, glycosylation site: N-linker(GlcNAc), plasma
membrane, transport, topological domain, extracellular, topological
domain: Cytoplasmic, intrinsic to membrane, membrane, transmembrane
region, transmembrane and integral to membrane.
Network gene signaling pathways
To understand the signaling pathways affecting the
functions of IRS1 and IRS2 following HCV infection of Huh7 cells,
the networking genes in Huh7 and HCV-huh7 cells were further
analyzed using MAS 3.0 and enrichments of their index of
pathways.
Discussion
The liver is important for the regulation of glucose
metabolism due to the fact that it is a source of endogenous
glucose and a vital organ for the insulin metabolism (8,9).
Chronic HCV infection is a multi-dysfunctional disease associated
with insulin resistance, including associations with type 2
diabetes disorders (10–13). The pathophysiological and
pathogenesis alterations that HCV infection triggers include
insulin secretory defects, increased glycogen production and
insulin resistance among others. Patients with insulin resistance
require insulin to maintain their blood sugar at a normal level as
they cannot maintain a steady glucose state without intervention
(14,15). In addition, 24–50% patients with
HCV have type 2 diabetes, and the incidence of HCV-induced type 2
diabetes is 5-fold greater than that induced by other causes of
liver cirrhosis (16,17). In addition, epidemiological studies
have demonstrated that cirrhotic patients with HCV infection are
correlated with cases of type 2 diabetes (18–26).
However, novel evidence has indicated that the incidence of type 2
diabetes in non-cirrhotic HCV-infected patients is higher than that
in age-matched, non-cirrhotic hepatitis B virus-infected patients
or that of healthy controls (27),
suggesting that HCV-induced insulin resistance may begin at the
non-fibrosis stage of HCV-infected patients.
The exact pathogenesis of HCV-induced insulin
resistance remains unclear, however a number of hypotheses have
been suggested. Previous studies have indicated that HCV may
increase the expression of proinflammatory cytokine tumor necrosis
factor α (TNFα) and interleukin 6 (IL-6) (28), interfere with IRS1 tyrosine
phosphorylation, enhance the damage of insulin signaling pathways
and promote insulin resistance (29,30).
In addition, TNFα has a direct toxic effect on pancreatic β cells
in vitro, and may reduce insulin secretion, leading to
insulin resistance (31).
Additionally, HCV core gene transgenic mice are insulin-resistant
and exhibit with hepatic insulin dysfunction (29).
HCV core proteins may stimulate cytokine signal
transduction and enhance the ubiquitination of the IRS1 and IRS2
proteasomes, thus resulting in functional degradation (32,33).
The HCV non-structural protein 5A may increase the expression of
protein phosphatase 2A (PP2A), which dephosphorylates protein
kinase B (Akt) and subsequently reduces Akt activity (34). Defection of insulin signaling due
to IRS1 tyrosine kinase phosphorylation and phosphoinositide
3-kinase (PI3K) activation may promote insulin resistance (32,35,36),
leading to type 2 diabetes.
Therefore, the current study aimed to use
bioinformatics in order to deduce the possible roles of IRS1 and
IRS2 in Huh7 and HCV-Huh7 cells. In a previous study, the
construction and analysis of gene networks associated with ATF3
were investigated (37). The
results of the present study indicated that no gene is downstream
of IRS1 in Huh7 and HCV-Huh7 cells, and no corresponding GO or
pathway is enriched. However, 43 genes are downstream of IRS2, and
these genes are enriched in 139 GOs, 15 pathway, and 3 clusters in
Huh7 cells. Following HCV infection, only 3 genes are downstream of
IRS2, and are enriched in 7 GOs and 3 pathways, indicating that the
IRS2 downstream function is significantly redcued by HCV infection.
When comparing the downstream modules of IRS1 with the IRS2
sub-networks in Huh7 cells, the number of genes, pathways, GO and
functional modules downstream of IRS1 is zero. IRS1 function is
silenced, however IRS2 function is active.
Previous studies have indicated that insulin may
regulate glucose concentration and increase glycogen synthesis in
the liver by preventing gluconeogenesis and glycogen decomposition
(38,39). It performs these functions through
IRS1 and IRS2, which belong to the cytoplasmic adapter proteins
primarily connecting the IR and various of effector molecules,
leading to a cellular response to insulin. IRS2 is the major
protein of the IRS family distributed in the liver. Upon the
binding of insulin to the IR, the tyrosine residues in the proximal
membrane region of the β subunit of IR undergoes
autophosphorylation and binds to IRS2. The activated tyrosine
kinase of the insulin receptor (protein-tyrosine kinase, insulin
receptor tyrosine kinase) further phosphorylates IRS2 at multiple
tyrosine residues, providing binding sites for Src homology 2
domains of downstream proteins. The formed signaling protein
complexes further mediate signal transduction, thereby regulating
glucose metabolism, gene expression and cell division and
controlling cell growth, differentiation and metabolism (40). These studies are in agreement with
the observations presented in the current study. From the
constructed downstream molecular network of IRS1 and IRS2 (Fig. 1), it is suggested that in Huh7
cells, only 4 genes are upstream of IRS1, 3 of which are functional
enhancement genes and are enriched in 14 GOs and 3 pathways, and 1
is a suppressing gene enriched in 3 GOs, however zero pathways and
no genes were identified downstream of IRS1 in Huh7 cells. In
HCV-Huh7 cells, 4 genes are upstream of IRS1, 2 of which are
functional enhancement genes and enriched in 7 GOs and 2 pathways,
2 of which are suppressing genes and enriched in zero GOs and
pathways, with no genes downstream of IRS1. Compared with IRS1,
IRS2 exhibited more abundant gene networks in Huh7 cells. There are
13 genes upstream of IRS2, 4 of which are functional enhancement
genes and enriched in 3 GOs and 16 pathways, and 9 that are
suppressing genes and enriched in 5 GOs and 21 pathways. Notably,
there are 45 genes downstream of IRS2 in Huh7 cells, of which, 41
are functional enhancement genes and enriched in 15 GOs and 139
pathways, and 3 are suppressing genes and enriched in 2 GOs and 4
pathways. In HCV-Huh7 cells, there are 8 genes upstream of IRS2 and
8 genes downstream of IRS2. In the upstream genes, 4 are functional
enhancement genes and enriched in 2 GO and 7 pathways, and 4 are
suppressing genes and enriched in 5 GOs and 10 pathways. In the
downstream genes, 3 are functional enhancement genes and enriched
in 3 GOs and 7 pathways, and 5 are suppressing genes and enriched
in 4 GOs and 18 pathways. Therefore, IRS1 is suggested to be
functionally quiescent in Huh7 and HCV-Huh7 cells and IRS2 was
identified as more active in Huh7 cells with richer gene networks,
in particular in its functional enhancement genes. However, in
HCV-Huh7 cells, the number of network genes was significantly
reduced, although remained at a low level, suggesting that
following HCV infection, IRS may preserve certain IRS2-mediated
functions. Therefore, it is possible that IRS2 is the major
functional IRS in Huh7 cells and HCV infection greatly diminishes
its functions to a very low level, which is consistent with
previous studies. Previous studies have indicated that knockout
IRS2 in normally developed mice may induce diabetes, including
insulin resistance (41), while a
knockout of IRS1 induces growth retardation and insulin resistance,
however not diabetes (42,43). However, knockout of IRS1 and IRS2
may result in hyperinsulinemia and insulin resistance in the liver
(44). Previous reports on
patients with insulin resistance and hyperglycemia (45) and obese/diabetic mice (46) determined that their IRS1 and IRS2
levels were reduced. The expression of the HCV core protein may
reduce tyrosine phosphorylation of IRS1 and reduce IRS2 expression
in the liver; however, does not completely eradicate their
activity, allowing the remaining IRS to transduct weak signals to
their downstream molecules (47).
The constructed networks indicate that HCV infection
may lead to downstream dysfunction of IRS in Huh7 cells and
aberrant insulin metabolism. Modulation of IRS1 and IRS2 in Huh7
and HCV-Huh7 cells, which were enriched using the DAVID gene
functional classification tool, indicated that there are only 3
enriched functional modules downstream of IRS2 in Huh7 cells, and
no other functional modules for IRS2 and IRS1. Previous studies on
IRS2 have primarily focused on glucose metabolism (48–50).
The present study indicated that downstream signals of IRS2 are
involved in not only glucose metabolism, but additionally in DNA
transcription, metal-binding regulation, membrane function,
hormonal regulation function, signaling transduction,
macromolecular biosynthesis and regulation, signaling pathways
regulating function and extracellular and cytoplasmic domain
topology structure function. The IRS2 downstream modules are fully
blocked by HCV infection, which can directly interfere with insulin
signaling transduction, thereby leading to insulin resistance. The
genes associated with these functions include IRF9, BHLHE41, ATF3,
KLF10, RORA, TGFB1I1, ZNF295, PPARGC1A, FHL2, SLC16A14, SLC16A14,
PLD6 and SLC7A1 and should be considered in future studies.
Studies investigating HCV-induced insulin signaling
disorders are rare. It has been determined that the peroxisome
proliferator-activated receptors (PPARs) are associated with
nuclear factors, and in particular are capable of regulating
glucose homeostasis. In addition, the association between HCV
replication and expression of PPARs has drawn attention from
researchers. PPARs are ligand-activated transcription factors
belonging to the nuclear receptor superfamily (51) and require retinoic acid to maintain
receptor heterologous dimerization (52,53).
The PPAR family includes PPARα, PPARβ, PPARδ and PPARγ (51). These PPARs regulate cell
differentiation, growth and metabolism. PPARα/γ along with their
exclusive partner the retinoid X receptor are nuclear receptors
expressed predominantly in the liver (54). PPARα may upregulate glycerol
phosphate dehydrogenase, glycerol kinase and glycerol transport
proteins, all of which may synthesize glucose in a fasting state
(55). PPAR agonists activate
insulin signaling pathways in living tissues in a time-dependent
manner (56). Biopsy of patients
with chronic HCV indicated reduced PPAR-α mRNA levels (53,57).
A previous in vitro study determined that reduced expression
of PPARγ in Huh7 cells infected with HCV core protein 3 (58), suggesting that PPARs are involved
in HCV-induced insulin resistance.
HCV may also activate endoplasmic reticulum (ER)
stress (59). Increased ER stress
may inhibit insulin signaling by phosphorylating the c-Jun
N-terminal kinase (JNK) family and IRS1 (60). In addition, ER stress may activate
PP2A (61) and thus inhibit Akt
kinase and adenosine monophosphate kinase and regulate
gluconeogenesis (59).
HCV infection may activate extracellular
signal-regulated kinases 1/2 by its forkhead box O1 (FOXO1) site,
S253, through activation of p38 mitogen-activated protein kinase
(MAPK) phosphatase-3 (MKP-3) and PP2A, and further promote
gluconeogenesis. Interaction of MKP3 or PP2A with FOXO1 may lead to
dephosphorylation of FOXOl at the S253 site and its activation
(62,63). FOXOl mutations may result in
developments of metabolism disorders and organ failure. FOXOl
promotes glycogen production and inhibits lipogenesis by
upregulating phosphoenolpyruvate carboxykinase and
glucose-6-phosphatase, catalytic subunit expression (64–66).
Upon HCV infection, its core protein induces production of SOCS-3
and promotes degradation of IRS1 and IRS2 through ubiquitination
and degradation of the proteasome. Downregulation of IRS1 and IRS2
inhibits insulin signal transduction, leading to insulin resistance
(32,35,36).
A recent study identified that HCV infection may lower the
expression of phosphatase and tensin homolog deleted on chromosome
10 (PTEN), which in turn increases phosphorylation of IRS1 at
Ser307 and inhibits the PI3K/Akt signaling pathway, leading to
insulin resistance (67).
In summary, previous studies have determined that
PP2A, JNK, SOCS-3, PTEN and other signaling pathways are involved
in HCV-induced hepatic insulin resistance, including PP2A and
SOCS-3, which is consistent with the results of the current study
deduced from the network information. Fig. 2 compares the pathogenic mechanisms
underlying HCV infection-induced insulin resistance identified in
the present study with previous literature.
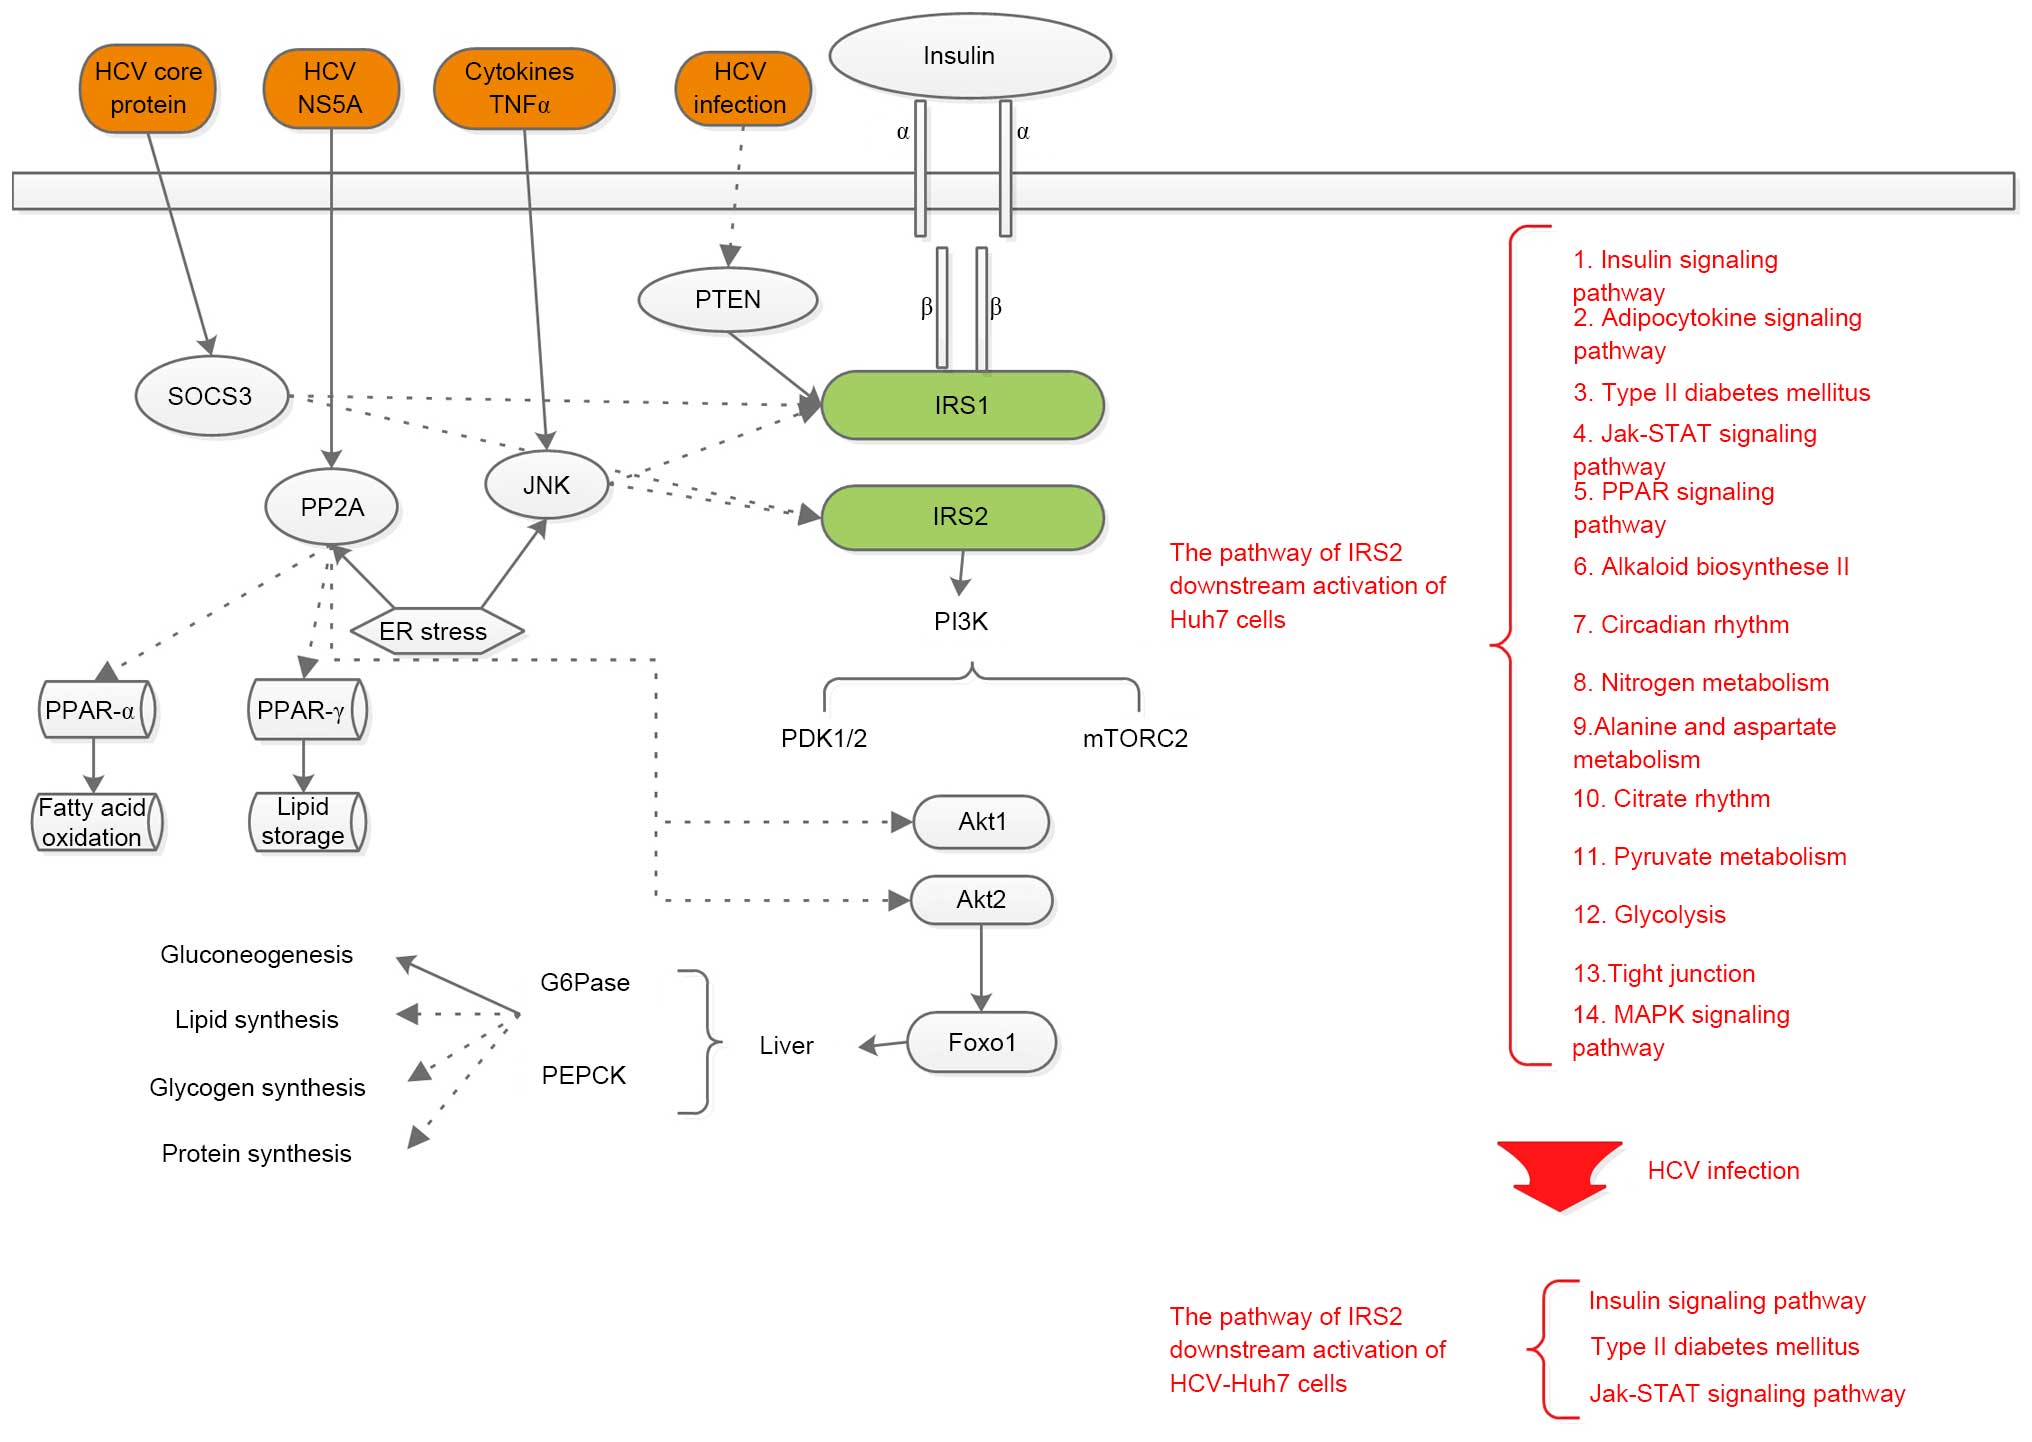 | Figure 2Comparison with the hypothesis of
previous literature and the present study. Solid lines with an
arrow indicate strengthening effects, dashed lines with an arrow
indicate inhibitory effects. Black text indicates the hypothesis of
previous literature, red text indicates the hypothesis of the
current study. HCV, hepatitis C virus; NS5A, non-structural protein
5A; TNFα, tumor necrosis factor α; PP2A, protein phosphatase 2A;
JNK, c-Jun N-terminal kinase; ER, endoplasmic reticulum; IRS1/2,
insulin receptor substrate 1/2; PI3K, phosphoinositide 3-kinase;
PDK1, 3-phosphoinositide-dependent kinase 1; mTOR, mammalian target
of rapamycin; Akt, protein kinase B; MAPK, p38 mitogen-activated
protein kinase; FOXO1, forkhead box O1; G6Pase-α,
glucose-6-phosphatase-α; PEPCK, phosphoenolpyruvate carboxykinase;
JAK, janus kinase; STAT, signal transducer and activator of
transcription; PTEN, phosphatase and tensin homolog deleted on
chromosome 10. |
Aytug et al (34) first reported that HCV infection may
impede the IRS1/PI3K signal pathway. However, the present study
indicated that IRS2 signaling is the major pathway responsible for
HCV infection-induced insulin resistance in Huh7 cells. The
enrichment results of the current study indicated that following
HCV infection of Huh7 cells, IRS2-activated signaling pathways are
reduced in terms of quantity and type, suggesting that IRS2 is
important in hepatic insulin resistance. In contrast, no
alterations in the IRS1 signaling pathway were observed, which is
not consistent with the results of Aytug et al (34). Previous studies have indicated that
chronic HCV infection-induced reduction of the responsiveness of
tissues to insulin and insulin resistance may be associated with
reduced IRS2 expression (32,68–71).
The results of the current study indicated that HCV
infection-induced insulin resistance in Huh7 cells is not
completely due to reduced expression of IRS1 or IRS2. HCV
infection-induced blockage of IRS2 downstream pathways may also be
an important factor. This blockage at non-fibrous HCV infection
period does not lead to reduced IRS1 and IRS2 expression. In
contrast, HCV infection may increase IRS1 and IRS2 expression in
Huh7 cells; however, the downstream activated signaling pathways of
IRS2 were severely disrupted in the current study. It is suggested
that the former is a feedback of the latter. HCV-induced low
insulin responsiveness and insulin resistance are potentially due
to HCV-induced reduced expression of IRS1 and IRS2, in addition to
HCV-induced direct blockage of downstream signaling of IRS2.
Clinical studies have demonstrated that serum IRS1 levels in 42
non-diabetic, HCV-infected patients were 2-fold of that of non-HCV
infected controls (34).
Previous studies on IRS2 have been predominantly
focused upon the glucose metabolism. DAVID functional modeling in
Huh7 cells determined 3 enriched functional modules downstream of
IRS2 activation, indicating that IRS2 may be widely involved in
transcriptional regulation, zinc finger transcription regulation,
nuclear regulation, membrane function, hormonal regulation in Huh7
cells. In addition, HCV infection fully blocks these functions of
IRS2, which may directly interfere with insulin signal transduction
and lead to insulin resistance. In addition to cellular network
modules, IRS1 and IRS2 signaling pathways were identified in Huh7
cells. No signaling pathways are activated by IRS1, while multiple
pathways are activated by IRS2, including insulin signaling
pathway, adipocytokine signaling pathway, type 2 diabetes mellitus,
Jak-signal transducer and activator of transcription (STAT)
signaling pathway, PPAR signaling pathway, alkaloid biosynthese II,
circadian rhythm, nitrogen metabolism, alanine and aspartate
metabolism, citrate rhythm, pyruvate metabolism, glycolysis, tight
junction, cytokine-cytokine receptor interaction and the MAPK
signaling pathway. Their corresponding enrichment numbers are 5, 4,
3, 3, 2, 1, 1, 1, 1, 1, 1, 1, 1, 1 and 1, respectively. Following
HCV infection, no signaling pathway was activated by IRS1, and only
3 signaling pathways were activated by IRS2, including the insulin
signaling pathway, type 2 diabetes mellitus and Jak-STAT signaling
pathway. Their corresponding enrichment numbers were reduced to 1,
1 and 1, respectively. It is possible that HCV infection-induced
blockage of insulin signaling in Huh7 cells is mediated by IRS2
because following HCV infection, the number and type of signaling
pathways activated by IRS2 were significantly reduced while those
of IRS1 underwent no changes. Thus, IRS2 may be important in
hepatic insulin resistance.
In conclusion, by comparing the gene networks
activated/inhibited by IRS1 and IRS2 in Huh7/HCV-Huh7 cells, the
present study determined that HCV may impact IRS1 and IRS2
signaling pathways in Huh7 cells, leading to blockage of IRS
pathways and thereby liver-derived insulin resistance. Such a
signaling blockage primarily affects downstream pathways of IRS2.
In addition, this blockage affects multiple aspects, including
metabolism, transcription regulation, zinc finger transcription
regulation, nuclear regulation, membrane function and hormone
regulation. Furthermore, in addition to the reported blockage of
the PPAR signaling pathway and cytokine-cytokine receptor
interaction, the bioinformatic analysis of the present study
indicated that HCV infection may also disturb multiple pathways
downstream of IRS2, which may lead to HCV-induced hepatic insulin
resistance. The following signaling pathways should also be
investigated: Insulin signaling pathway, adipocytokine signaling
pathway, type 2 diabetes mellitus, Jak-STAT signaling pathway, PPAR
signaling pathway, alkaloid biosynthese II, circadian rhythm,
nitrogen metabolism, alanine and aspartate metabolism, citrate
rhythm, pyruvate metabolism, glycolysis, tight junction including
the MAPK signaling pathway, and the following genes involved in
hepatic insulin resistance: IRF9, BHLHE41, ATF3, KLF10, RORA,
TGFB1I1, ZnF295, PPARGC1A, FHL2, SLC16A14, PLD6 and SLC7A1.
Overall, the present study constructed and analyzed IRS1 and IRS2
sub-networks in Huh7 and HCV-Huh7 cells aiming to gain insight into
the cellular mechanisms underlying HCV-induced insulin
resistance.
References
|
1
|
Serfaty L and Capeau J: Hepatitis C,
insulin resistance and diabetes: Clinical and pathogenic data.
Liver Int. 29(Suppl 2): 13–25. 2009. View Article : Google Scholar : PubMed/NCBI
|
|
2
|
Koike K and Moriya K: Metabolic aspects of
hepatitis C viral infection: Steatohepatitis resembling but
distinct from NASH. J Gastroenterol. 40:329–336. 2005. View Article : Google Scholar : PubMed/NCBI
|
|
3
|
Jian Wu Y, Shu Chen L and Gui Qiang W:
Effects of fatty liver and related factors on the efficacy of
combination antiviral therapy in patients with chronic hepatitis C.
Liver Int. 26:166–172. 2006. View Article : Google Scholar : PubMed/NCBI
|
|
4
|
Xiong J, Lu Y, Feng J, Yuan D, Tian M,
Chang Y, Fu C, Wang G, Zeng H and Miao W: Tetrahymena functional
genomics database (TetraFGD): An integrated resource for
Tetrahymena functional genomics. Database (Oxford).
12:bat0082013.
|
|
5
|
Wang Y, Joshi T, Zhang XS, Xu D and Chen
L: Inferring gene regulatory networks from multiple microarray
datasets. Bioinformatics. 22:2413–2420. 2006. View Article : Google Scholar : PubMed/NCBI
|
|
6
|
Huang DW, Sherman BT, Tan Q, Collins JR,
Alvord WG, Roayaei J, Stephens R, Baseler MW, Lane HC and Lempicki
RA: The DAVID Gene Functional Classification Tool: A novel
biological module-centric algorithm to functionally analyze large
gene lists. Genome Biol. 8:R1832007. View Article : Google Scholar : PubMed/NCBI
|
|
7
|
Dennis G Jr, Sherman BT, Hosack DA, Yang
J, Gao W, Lane HC and Lempicki RA: DAVID: Database for Annotation,
Visualization, and Integrated Discovery. Genome Biol. 4:32003.
View Article : Google Scholar
|
|
8
|
Kadowaki T: Insights into insulin
resistance and type 2 diabetes from knockout mouse models. J Clin
Invest. 106:459–465. 2000. View
Article : Google Scholar : PubMed/NCBI
|
|
9
|
Ueki K, Yamauchi T, Tamemoto H, Tobe K,
Yamamoto-Honda R, Kaburagi Y, Akanuma Y, Yazaki Y, Aizawa S, Nagai
R and Kadowaki T: Restored insulin-sensitivity in IRS-1-deficient
mice treated by adenovirus-mediated gene therapy. J Clin Invest.
105:1437–1445. 2000. View
Article : Google Scholar : PubMed/NCBI
|
|
10
|
Micallef JM, Kaldor JM and Dore GJ:
Spontaneous viral clearance following acute hepatitis C infection:
A systematic review of longitudinal studies. J Viral Hepat.
13:34–41. 2006. View Article : Google Scholar
|
|
11
|
Allison ME, Wreghitt T, Palmer CR and
Alexander GJ: Evidence for a link between hepatitis C virus
infection and diabetes mellitus in a cirrhotic population. J
Hepatol. 21:1135–1139. 1994. View Article : Google Scholar : PubMed/NCBI
|
|
12
|
Cavaghan MK, Ehrmann DA and Polonsky KS:
Interactions between insulin resistance and insulin secretion in
the development of glucose intolerance. J Clin Invest. 106:329–333.
PubMed/NCBI
|
|
13
|
Kahn BB: Type 2 diabetes: When insulin
secretion fails to compensate for insulin resistance. Cell.
92:593–596. 1998. View Article : Google Scholar : PubMed/NCBI
|
|
14
|
Campbell PJ, Mandarino LJ and Gerich JE:
Quantification of the relative impairment in actions of insulin on
hepatic glucose production and peripheral glucose uptake in
non-insulin-dependent diabetes mellitus. Metabolism. 37:15–21.
1988. View Article : Google Scholar : PubMed/NCBI
|
|
15
|
Romero-Gómez M, Del Mar Viloria M, Andrade
RJ, Salmerón J, Diago M, Fernández-Rodríguez CM, Corpas R, Cruz M,
Grande L, Vázquez L, et al: Insulin resistance impairs sustained
response rate to peginterferon plus ribavirin in chronic hepatitis
C patients. Gastroenterology. 128:636–641. 2005. View Article : Google Scholar : PubMed/NCBI
|
|
16
|
Romero-Gómez M: Insulin resistance and
hepatitis C. World J Gastroenterol. 12:7075–7080. 2006. View Article : Google Scholar : PubMed/NCBI
|
|
17
|
Arao M, Murase K, Kusakabe A, Yoshioka K,
Fukuzawa Y, Ishikawa T, Tagaya T, Yamanouchi K, Ichimiya H,
Sameshima Y and Kakumu S: Prevalence of diabetes mellitus in
Japanese patients infected chronically with hepatitis C virus. J
Gastroenterol. 38:355–360. 2003. View Article : Google Scholar : PubMed/NCBI
|
|
18
|
Mason AL, Lau JY, Hoang N, Qian K,
Alexander GJ, Xu L, Guo L, Jacob S, Regenstein FG, Zimmerman R, et
al: Association of diabetes mellitus and chronic hepatitis C virus
infection. Hepatology. 29:328–333. 1999. View Article : Google Scholar : PubMed/NCBI
|
|
19
|
Fraser GM, Harman I, Meller N, Niv Y and
Porath A: Diabetes mellitus is associated with chronic hepatitis C
but not chronic hepatitis B infection. Isr J Med Sci. 32:526–530.
1996.PubMed/NCBI
|
|
20
|
Caronia S, Taylor K, Pagliaro L, Carr C,
Palazzo U, Petrik J, O'Rahilly S, Shore S, Tom BD and Alexander GJ:
Further evidence for an association between non-insulin-dependent
diabetes mellitus and chronic hepatitis C virus infection.
Hepatology. 30:1059–1063. 1999. View Article : Google Scholar : PubMed/NCBI
|
|
21
|
Mehta SH, Brancati FL, Sulkowski MS,
Strathdee SA, Szklo M and Thomas DL: Prevalence of type 2 diabetes
mellitus among persons with hepatitis C virus infection in the
United States. Ann Intern Med. 133:592–599. 2000. View Article : Google Scholar : PubMed/NCBI
|
|
22
|
Grimbert S, Valensi P, Lévy-Marchal C,
Perret G, Richardet JP, Raffoux C, Trinchet JC and Beaugrand M:
High prevalence of diabetes mellitus in patients with chronic
hepatitis C. A case-control study. Gastroenterol Clin Biol.
20:544–548. 1996.PubMed/NCBI
|
|
23
|
Ozyilkan E, Erbaş T, Simşek H, Telatar F,
Kayhan B and Telatar H: Increased prevalence of hepatitis C virus
antibodies in patients with diabetes mellitus. J Intern Med.
235:283–284. 1994. View Article : Google Scholar : PubMed/NCBI
|
|
24
|
Simó R, Hernández C, Genescà J, Jardí R
and Mesa J: High prevalence of hepatitis C virus infection in
diabetic patients. Diabetes Care. 19:998–1000. 1996. View Article : Google Scholar : PubMed/NCBI
|
|
25
|
Zein NN, Abdulkarim AS, Wiesner RH, Egan
KS and Persing DH: Prevalence of diabetes mellitus in patients with
end-stage liver cirrhosis due to hepatitis C, alcohol, or
cholestatic disease. J Hepatol. 32:209–217. 2000. View Article : Google Scholar : PubMed/NCBI
|
|
26
|
Hui JM, Sud A, Farrell GC, Bandara P, Byth
K, Kench JG, McCaughan GW and George J: Insulin resistance is
associated with chronic hepatitis C virus infection and fibrosis
progression [corrected]. Gastroenterology. 125:1695–1704. 2003.
View Article : Google Scholar
|
|
27
|
Alexander GJ: An association between
hepatitis C virus infection and type 2 diabetes mellitus: What is
the connection? Ann Intern Med. 133:650–652. 2000. View Article : Google Scholar : PubMed/NCBI
|
|
28
|
Oliveira CP, Kappel CR, Siqueira ER, Lima
VM, Stefano JT, Michalczuk MT, Marini SS, Barbeiro HV, Soriano FG,
Carrilho FJ, et al: Effects of hepatitis C virus on cardiovascular
risk in infected patients: A comparative study. Int J Cardiol.
164:221–226. 2013. View Article : Google Scholar
|
|
29
|
Shintani Y, Fujie H, Miyoshi H, Tsutsumi
T, Tsukamoto K, Kimura S, Moriya K and Koike K: Hepatitis C virus
infection and diabetes: Direct involvement of the virus in the
development of insulin resistance. Gastroenterology. 126:840–848.
2004. View Article : Google Scholar : PubMed/NCBI
|
|
30
|
Zekri AR, Ashour MS, Hassan A, Alam El-Din
HM, El-Shehaby AM and Abu-Shady MA: Cytokine profile in Egyptian
hepatitis C virus genotype-4 in relation to liver disease
progression. World J Gastroenterol. 11:6624–6630. 2005. View Article : Google Scholar
|
|
31
|
Greenberg AS and McDaniel ML: Identifying
the links between obesity, insulin resistance and beta-cell
function: Potential role of adipocyte-derived cytokines in the
pathogenesis of type 2 diabetes. Eur J Clin Invest. 32(Suppl 3):
24–34. 2002. View Article : Google Scholar : PubMed/NCBI
|
|
32
|
Kawaguchi T, Yoshida T, Harada M, Hisamoto
T, Nagao Y, Ide T, Taniguchi E, Kumemura H, Hanada S, Maeyama M, et
al: Hepatitis C virus down-regulates insulin receptor substrates 1
and 2 through up-regulation of suppressor of cytokine signaling 3.
Am J Pathol. 165:1499–1508. 2004. View Article : Google Scholar : PubMed/NCBI
|
|
33
|
Kawaguchi T, Ide T, Taniguchi E, Hirano E,
Itou M, Sumie S, Nagao Y, Yanagimoto C, Hanada S and Koga H:
Clearance of HCV improves insulin resistance, beta-cell function,
and hepatic expression of insulin receptor substrate 1 and 2. Am J
Gastroenterol. 102:570–576. 2007. View Article : Google Scholar : PubMed/NCBI
|
|
34
|
Aytug S, Reich D, Sapiro LE, Bernstein D
and Begum N: Impaired IRS-1/PI3-kinase signaling in patients with
HCV: A mechanism for increased prevalence of type 2 diabetes.
Hepatology. 38:1384–1392. 2003. View Article : Google Scholar : PubMed/NCBI
|
|
35
|
Banerjee S, Saito K, Ait-Goughoulte M,
Meyer K, Ray RB and Ray R: Hepatitis C virus core protein
upregulates serine phosphorylation of insulin receptor substrate-1
and impairs the downstream akt/protein kinase B signaling pathway
for insulin resistance. J Virol. 82:2606–2612. 2008. View Article : Google Scholar :
|
|
36
|
Lecube A, Hernández C, Genescà J and Simó
R: Proinflammatory cytokines, insulin resistance, and insulin
secretion in chronic hepatitis C patients: A case-control study.
Diabetes Care. 29:1096–1101. 2006. View Article : Google Scholar : PubMed/NCBI
|
|
37
|
Liu J, Wang B, Wang W, Sun M, Li Y, Jia X,
Zhai S and Dang S: Computational networks of activating
transcription 3 gene in Huh7 cell lines and hepatitis C
virus-infected Huh7 cell lines. Mol Med Rep. 12:1239–1246.
2015.PubMed/NCBI
|
|
38
|
Brüning JC, Michael MD, Winnay JN, Hayashi
T, Hörsch D, Accili D, Goodyear LJ and Kahn CR: A muscle-specific
insulin receptor knockout exhibits features of the metabolic
syndrome of NIDDM without altering glucose tolerance. Mol Cell.
2:559–569. 1998. View Article : Google Scholar : PubMed/NCBI
|
|
39
|
Kulkarni RN, Brüning JC, Winnay JN, Postic
C, Magnuson MA and Kahn CR: Tissue-specific knockout of the insulin
receptor in pancreatic beta cells creates an insulin secretory
defect similar to that in type 2 diabetes. Cell. 96:329–339. 1999.
View Article : Google Scholar : PubMed/NCBI
|
|
40
|
Vassen L, Wegrzyn W and Klein-Hitpass L:
Human insulin receptor substrate-2: Gene organization and promoter
characterization. Diabetes. 48:1877–1880. 1999. View Article : Google Scholar : PubMed/NCBI
|
|
41
|
Withers DJ, Gutierrez JS, Towery H, Burks
DJ, Ren JM, Previs S, Zhang Y, Bernal D, Pons S, Shulman GI, et al:
Disruption of IRS-2 causes type 2 diabetes in mice. Nature.
391:900–904. 1998. View
Article : Google Scholar : PubMed/NCBI
|
|
42
|
Araki E, Lipes MA, Patti ME, Brüning JC,
Haag B III, Johnson RS and Kahn CR: Alternative pathway of insulin
signalling in mice with targeted disruption of the IRS-1 gene.
Nature. 372:186–190. 1994. View Article : Google Scholar : PubMed/NCBI
|
|
43
|
Tamemoto H, Kadowaki T, Tobe K, Yagi T,
Sakura H, Hayakawa T, Terauchi Y, Ueki K, Kaburagi Y, Satoh S, et
al: Insulin resistance and growth retardation in mice lacking
insulin receptor substrate-1. Nature. 372:182–186. 1994. View Article : Google Scholar : PubMed/NCBI
|
|
44
|
Taniguchi CM, Ueki K and Kahn R:
Complementary roles of IRS-1 and IRS-2 in the hepatic regulation of
metabolism. J Clin Invest. 115:718–727. 2005. View Article : Google Scholar : PubMed/NCBI
|
|
45
|
Anai M, Funaki M, Ogihara T, Terasaki J,
Inukai K, Katagiri H, Fukushima Y, Yazaki Y, Kikuchi M, Oka Y and
Asano T: Altered expression levels and impaired steps in the
pathway to phosphatidylinositol 3-kinase activation via insulin
receptor substrates 1 and 2 in Zucker fatty rats. Diabetes.
47:13–23. 1998. View Article : Google Scholar : PubMed/NCBI
|
|
46
|
Kerouz NJ, Hörsch D, Pons S and Kahn CR:
Differential regulation of insulin receptor substrates-1 and -2
(IRS-1 and IRS-2) and phosphatidylinositol 3-kinase isoforms in
liver and muscle of the obese diabetic (ob/ob) mouse. J Clin
Invest. 100:3164–3172. 1997. View Article : Google Scholar
|
|
47
|
Miyamoto H, Moriishi K, Moriya K, Murata
S, Tanaka K, Suzuki T, Miyamura T, Koike K and Matsuura Y:
Involvement of the PA28gamma-dependent pathway in insulin
resistance induced by hepatitis C virus core protein. J Virol.
81:1727–1735. 2007. View Article : Google Scholar
|
|
48
|
Tonelli J, Li W, Kishore P, Pajvani UB,
Kwon E, Weaver C, Scherer PE and Hawkins M: Mechanisms of early
insulin-sensitizing effects of thiazolidinediones in type 2
diabetes. Diabetes. 53:1621–1629. 2004. View Article : Google Scholar : PubMed/NCBI
|
|
49
|
Wu HS, Yu JH, Li YY, Yang YS, He QJ, Lou
YJ and Ji RY: Insulin-sensitizing effects of a novel alpha-methyl-
alpha -phenoxylpropionate derivative in vitro. Acta Pharmacol Sin.
28:417–422. 2007. View Article : Google Scholar : PubMed/NCBI
|
|
50
|
Mousavinasab F, Tähtinen T, Jokelainen J,
Koskela P, Vanhala M, Oikarinen J, Keinänen-Kiukaanniemi S and
Laakso M: Effect of the Pro12Ala polymorphism of the PPARg2 gene on
serum adiponectin changes: Endocrine. 27:307–309. 2005.
|
|
51
|
Yessoufou A and Wahli W: Multifaceted
roles of peroxisome proliferator-activated receptors (PPARs) at the
cellular and whole organism levels. Swiss Med Wkly.
140:w130712010.PubMed/NCBI
|
|
52
|
Bardot O, Aldridge TC, Latruffe N and
Green S: PPAR-RXR heterodimer activates a peroxisome proliferator
response element upstream of the bifunctional enzyme gene. Biochem
Biophys Res Commun. 192:37–45. 1993. View Article : Google Scholar : PubMed/NCBI
|
|
53
|
de Gottardi A, Pazienza V, Pugnale P,
Bruttin F, Rubbia-Brandt L, Juge-Aubry CE, Meier CA, Hadengue A and
Negro F: Peroxisome proliferator-activated receptor-alpha and
-gamma mRNA levels are reduced in chronic hepatitis C with
steatosis and genotype 3 infection. Aliment Pharmacol Ther.
23:107–114. 2006. View Article : Google Scholar : PubMed/NCBI
|
|
54
|
Eslam M, Khattab MA and Harrison SA:
Peroxisome proliferator-activated receptors and hepatitis C virus.
Therap Adv Gastroenterol. 4:419–431. 2011. View Article : Google Scholar : PubMed/NCBI
|
|
55
|
Patsouris D, Mandard S, Voshol PJ, Escher
P, Tan NS, Havekes LM, Koenig W, März W, Tafuri S, Wahli W, et al:
PPARalpha governs glycerol metabolism. J Clin Invest. 114:94–103.
2004. View Article : Google Scholar : PubMed/NCBI
|
|
56
|
Jiang G, Dallas-Yang Q, Li Z, Szalkowski
D, Liu F, Shen X, Wu M, Zhou G, Doebber T, Berger J, et al:
Potentiation of insulin signaling in tissues of Zucker obese rats
after acute and long-term treatment with PPARgamma agonists.
Diabetes. 51:2412–2419. 2002. View Article : Google Scholar : PubMed/NCBI
|
|
57
|
Dharancy S, Malapel M, Perlemuter G,
Roskams T, Cheng Y, Dubuquoy L, Podevin P, Conti F, Canva V,
Philippe D, et al: Impaired expression of the peroxisome
proliferator-activated receptor alpha during hepatitis C virus
infection. Gastroenterology. 128:334–342. 2005. View Article : Google Scholar : PubMed/NCBI
|
|
58
|
Clément S, Pascarella S and Negro F:
Hepatitis C virus infection: Molecular pathways to steatosis,
insulin resistance and oxidative stress. Viruses. 1:126–143. 2009.
View Article : Google Scholar : PubMed/NCBI
|
|
59
|
Ozcan U, Cao Q, Yilmaz E, Lee AH, Iwakoshi
NN, Ozdelen E, Tuncman G, Görgün C, Glimcher LH and Hotamisligil
GS: Endoplasmic reticulum stress links obesity, insulin action, and
type 2 diabetes. Science. 306:457–461. 2004. View Article : Google Scholar : PubMed/NCBI
|
|
60
|
Hotamisligil GS: Role of endoplasmic
reticulum stress and c-Jun NH2-terminal kinase pathways in
inflammation and origin of obesity and diabetes. Diabetes. 54(Suppl
2): S73–78. 2005. View Article : Google Scholar : PubMed/NCBI
|
|
61
|
Christen V, Treves S, Duong FH and Heim
MH: Activation of endoplasmic reticulum stress response by
hepatitis viruses up-regulates protein phosphatase 2A. Hepatology.
46:558–565. 2007. View Article : Google Scholar : PubMed/NCBI
|
|
62
|
Wu Z, Jiao P, Huang X, Feng B, Feng Y,
Yang S, Hwang P, Du J, Nie Y, Xiao G and Xu H: MAPK phosphatase-3
promotes hepatic gluconeogenesis through dephosphorylation of
forkhead box O1 in mice. J Clin Invest. 120:3901–3911. 2010.
View Article : Google Scholar : PubMed/NCBI
|
|
63
|
Yan L, Lavin VA, Moser LR, Cui Q, Kanies C
and Yang E: PP2A regulates the pro-apoptotic activity of FOXO1. J
Biol Chem. 283:7411–7420. 2008. View Article : Google Scholar : PubMed/NCBI
|
|
64
|
Deng X, Zhang W, O-Sullivan I, Williams
JB, Dong Q, Park EA, Raghow R, Unterman TG and Elam MB: FoxO1
inhibits sterol regulatory element-binding protein-1c (SREBP-1c)
gene expression via transcription factors Sp1 and SREBP-1c. J Biol
Chem. 287:20132–20143. 2012. View Article : Google Scholar : PubMed/NCBI
|
|
65
|
Zhang K, Li L, Qi Y, Zhu X, Gan B, DePinho
RA, Averitt T and Guo S: Hepatic suppression of Foxo1 and Foxo3
causes hypoglycemia and hyperlipidemia in mice. Endocrinology.
153:631–646. 2012. View Article : Google Scholar
|
|
66
|
Zhang W, Patil S, Chauhan B, Guo S, Powell
DR, Le J, Klotsas A, Matika R, Xiao X, Franks R, et al: FoxO1
regulates multiple metabolic pathways in the liver: effects on
gluconeogenic, glycolytic, and lipogenic gene expression. J Biol
Chem. 281:10105–10117. 2006. View Article : Google Scholar : PubMed/NCBI
|
|
67
|
Gao TT, Qin ZL, Ren H, Zhao P and Qi ZT:
Inhibition of IRS-1 by hepatitis C virus infection leads to insulin
resistance in a PTEN-dependent manner. Virol J. 12:122015.
View Article : Google Scholar : PubMed/NCBI
|
|
68
|
Persico M, Masarone M, La Mura V, Persico
E, Moschella F, Svelto M, Bruno S and Torella R: Clinical
expression of insulin resistance in hepatitis C and B virus-related
chronic hepatitis: Differences and similarities. World J
Gastroenterol. 15:462–466. 2009. View Article : Google Scholar : PubMed/NCBI
|
|
69
|
Eguchi Y, Mizuta T, Ishibashi E, Kitajima
Y, Oza N, Nakashita S, Hara M, Iwane S, Takahashi H, Akiyama T, et
al: Hepatitis C virus infection enhances insulin resistance induced
by visceral fat accumulation. Liver Int. 29:213–220. 2009.
View Article : Google Scholar
|
|
70
|
Squillace N, Lapadula G, Torti C, Orlando
G, Mandalia S, Nardini G, Beghetto B, Costarelli S and Guaraldi G:
Hepatitis C virus antibody-positive patients with HIV infection
have a high risk of insulin resistance: A cross-sectional study.
HIV Med. 9:151–159. 2008. View Article : Google Scholar
|
|
71
|
Moucari R, Asselah T, Cazals-Hatem D,
Voitot H, Boyer N, Ripault MP, Sobesky R, Martinot-Peignoux M,
Maylin S, Nicolas-Chanoine MH, et al: Insulin resistance in chronic
hepatitis C: Association with genotypes 1 and 4, serum HCV RNA
level, and liver fibrosis. Gastroenterology. 134:416–423. 2008.
View Article : Google Scholar : PubMed/NCBI
|


