Introduction
It is estimated that 317,000 people worldwide with
human hepatitis B virus (HBV) developed liver cirrhosis, and
300,000 patients with HBV developed hepatocellular carcinoma (HCC)
in 2013 (1,2). The pathogenic process of HBV has been
determined to be closely associated with deficient host immune
responses, involving the dysregulation of HBV-specific T cells, B
cells, infiltrating neutrophils, natural killer cells and other
lymphocytes (3–5). Clearance of hepatitis B infection is
directly performed by B cells by secretion of specific antibodies,
this function is primarily mediated by T follicular helper (Tfh)
cells. The dysfunction of Tfh and B cells has been associated with
the pathogenic process of various autoimmune diseases and tumors
(5–7).
Tfh cells have been established as the primary
helpers to promote the proliferation, differentiation, maturation
and antibody class switching of B cells in germinal centers (GCs)
or outside GCs. They are positive for certain surface markers,
including CD4, C-X-C motif chemokine receptor 5 (CXCR5), B-cell
CLL/lymphoma 6 (Bcl-6), interleukin (IL)-21, inducible T-cell
costimulator (ICOS) and programmed cell death-1 (PD-1). Previous
studies have suggested that as the two key molecules expressed on
Tfh cells, ICOS and PD-1 perform differential immune functions
(8–11). ICOS has always been regarded as a
marker for activity, whereas PD-1 and PD-ligand 1are usually highly
expressed on lymphocytes and tumor cells in an immune tolerance
microenvironment (12–14). Although the effect of PD-1 on
inducing immunosuppression has been previously investigated, the
features of PD-1+ Tfh cells during HBV infection remain
to be elucidated.
The activation of the intrahepatic cytokine network
has an important role in the pathogenesis of acute and chronic
liver inflammation. Expression levels of tumor necrosis factors
(15,16), interferons and interleukins
(17) were increased in response
to HBV infection and may lead to the development of HBV into HCC.
Prostaglandin E2 (PGE2) is one of the most abundant prostaglandins
in the body and an important causative cytokine of inflammation
that results from tissue damage or infection (18). PGE2 is usually produced by
epithelial cells and is highly expressed in lung cancer and other
malignancies (19). Additionally,
it may upregulate the activity of T-regulatory cells, which
primarily mediate the suppression of immune responses (20). However, whether PGE2 is capable of
direct regulation of PD-1+ Tfh cells in patients with
HBV remains to be elucidated.
The present study analyzed the distribution of
ICOS+, PD-1+ and total Tfh cells in patients
with HBV at different immune phases and investigated the possible
mechanism of HBV regulation of PD-1expressionin Tfh cells. The
current study determined that HBV-infected HepG2.2.1.5 may secret
more PGE2, which may contribute to the upregulation of PD-1
expression in Tfh cells. It is vital to determine the effect of HBV
on the distribution of Tfh-cell subsets and the underlying
regulatory mechanism in order to develop novel immunotherapy-based
approaches for future HBV treatment.
Materials and methods
Patients
A total of 46 patients with HBV and 15 healthy
controls (HC) were recruited from the First Hospital of Jilin
University between 2014 and 2015. HBV-infected subjects were
classified into three distinct groups according to their serum HBV
DNA load, alanine transaminase (ALT) level and detectable hepatitis
B viral protein (HBeAg). Patients with high copies of serum HBV
DNA, positive HBeAg and normal ALT level were confirmed as the
immune tolerance group (IT; n=13). Patients with low levels of
serum HBV DNA load, positive HBeAg and increased ALT levels were
defined as the immune activation group (IA; n=15); however,
patients with undetectable level of HBV DNA load, negative HBeAg
and normal ALT level were considered to be responders with surface
antigen of HBV (HBsAg) seroconversion (RP; n=18). Therefore, HBeAg
is a more specific marker indicating the immune state of HBV
infection compared with HBsAg, as HBsAg may be positive in both the
active and inactive phase (21–23).
HBV DNA levels in serum were quantified using a qPCR HBV diagnostic
kit (Roche Diagnostics, Basel, Switzerland). Serum ALT and AST
levels were determined by chemiluminescent microparticle
immunoassay using chemiluminescence immunoassay analyzer (Abbott
Laboratories, Lake Bluff, IL, USA).
Participants suffering systemic disorders were
excluded from the present study. Written informed consent was
obtained from the guardians on the behalf of all participants. The
present study was reviewed and approved by the Ethics Committee of
the First Hospital of Jilin University (Changchun, China). The
demographic and clinical characteristics of the patients enrolled
in the present study are presented in Table I.
 | Table I.Basic clinical characteristics of
patients enrolled in the present study. |
Table I.
Basic clinical characteristics of
patients enrolled in the present study.
| Parameter | IT n=13 | IA n=15 | RP n=18 | HC n=15 |
|---|
| Age (years) | 44 (32–52) | 39 (31–48) | 42 (32–50) | 40 (28–49) |
| Gender
(male/female) | 9/4 | 12/3 | 13/5 | 9/6 |
| HBV DNA copies
(log10) | 8.2
(6.6–10.3) | 5.3 (3.9–7.2) | LDL | LDL |
| ALT (U/l) | 33 (14–49) | 241
(54–1977) | 22 (17–34) | 11 (2–18) |
| AST (U/l) | 27 (13–42) | 126
(47–1031) | 24 (10–38) | 13 (7–29) |
Peripheral blood mononuclear cells
(PBMCs) isolation
PBMCs were harvested from each participant's
heparinized blood sample by density-gradient centrifugation using
Ficoll-Paque Plus (GE Healthcare Life Sciences, Chalfont, UK).
Fluorescein isothiocyanate (FITC) conjugated-anti-CD4 (cat. no.
555346), phycoerythrin (PE) conjugated-anti-ICOS (cat. no. 557802;
all at 1:100 dilution and obtained from BD Biosciences, Franklin
Lakes, NJ, USA), allophycocyanin (APC) conjugated-anti-CXCR5 (cat.
no. 356907) and peridinin chlorophyll (PerCP) conjugated-anti-PD-1
(cat. no. 329937; all at dilution 1:100 and obtained from
BioLegend, CA, USA) were used to label total Tfh cells
(CD4+CXCR5+), ICOS+ Tfh cells and
PD-1+ Tfh cells. The frequency of ICOS+,
PD-1+ and total Tfh cells were analyzed using a
FACSCalibur flow cytometer (BD Biosciences).
Cell culture
HepG2 and HepG2.2.1.5 liver cancer cells lines
obtained from Cell Bank of the Chinese Academy of Sciences
(Shanghai, China) were used in the present study. The HepG2.2.1.5
cell line was derived from HepG2 cells, which were transfected with
a plasmid containing HBV DNA as previously described (24). Tfh cells were sorted from PBMCs
using a FACSAriaII (BD Biosciences) and subsequently co-cultured
(2.5×10⁴/well) in a 0.4 µm pore size Transwell system
(Corning Inc., Corning, NY, USA) with HepG2 (5×10⁴/well)
and HepG2.2.1.5 (5×10⁴/well) cells. All cells were
maintained in Dulbecco's modified Eagle's medium supplemented with
10% fetal bovine serum (both from Gibco; Thermo Fisher Scientific,
Inc., Waltham, MA, USA) and 1% penicillin/streptomycin
(Sigma-Aldrich; Merck Millipore, Darmstadt, Germany) at 37°C with
5% CO2. A PGE2-specific inhibitor was used to block PGE2
activity, pranoprofen (6 µM; Selleck Chemicals, Houston, TX, USA)
was supplemented into the co-culture system for 6 h.
Plasmid construction
The pGenesil vector, containing human U6 promoter,
was obtained from GenePharma Co., Ltd. (Shanghai, China) and used
to generate a series of short hairpin RNA (shRNA) expression
vectors by inserting annealed oligonucleotides. The shRNA targeting
the HBV preC/Csequence and HBVs sequence was designed and
synthesized by GenePharma Co., Ltd. to inhibit the expression of
HBeAg and HBsAg in HBV.
Transfection
One day prior to the transfection, HepG2.2.1.5 cells
were trypsinized and ~1×10⁶ cells/well were seeded in a
6-well plate. Cells were transfected with shRNA-vectors, and a
transfection efficiency was directly observed using a fluorescence
microscope and an efficiency of ~75% was achieved using
Lipofectamine® 2000 (Invitrogen; Thermo Fisher
Scientific, Inc.) following the manufacturer's protocol.
HepG2.2.1.5 cells were harvested and co-cultured with Tfh cells 72
h after the transfection in order to analyze the influence of HBeAg
and HBsAg on PD-1 levels in Tfh cells.
Reverse transcription-quantitative
polymerase chain reaction (RT-qPCR)
Total RNA was isolated using TRIzol (Invitrogen;
Thermo Fisher Scientific, Inc.) according to the manufacturer's
protocol. Reverse transcription was performed using GoScript
Reverse Transcription system (Promega Corporation, Madison, WI,
USA) and Power SYBR-Green Master mix (Thermo Fisher Scientific,
Inc.) was used for the gene amplification. qPCR reaction conditions
were as follows: 95°C for 10 min, 40 cycles of 95°C for 15 sec,
60°C for 1 min. Relative gene expression was determined using the
2−ΔΔCq method (25)
with GAPDH used as the reference gene. The following primers were
used: PD-1 forward (F) 5′-AAGCTTATGTGGGTCCGGC-3′, reverse (R)
5′-GGATCCTCAAAGAGGCC-3′; and GAPDH F: 5′-GGTGGTCTCCTCTGACTTCAAC-3′,
R: 5′-GTGGTCGTTGAGGGCAATG-3′.
Western blotting
Cells were harvested 72 h after transfection and
lysed in RIPA buffer (Beyotime Institute of Biotechnology, Wuhan,
China). Protein concentration was tested using the bicinchoninic
acid protein assay kit (Thermo Fisher Scientific, Inc.). The cell
lysates were separated by 10% sodium dodecyl sulfate-polyacrylamide
gel electrophoresis and transferred to polyvinylidene difluoride
membranes (Merck Millipore). Membranes were blocked with 5% non-fat
dry milk for 30 min and incubated over night at 4°C with primary
antibodies against PD-1 (cat. no. ab52587; 1:1,000 dilution; Abcam,
Cambridge, UK), PGE2 (cat. no. PL0304928; 1:500 dilution; PL
Laboratories Inc., Vancouver, BC, Canada) and GAPDH (cat. no.
ab8245; 1:2,000 dilution; Abcam). The membranes were then incubated
with horseradish peroxidase-conjugated secondary antibody (cat. no.
sc-51625; 1:1,500 dilution; Santa Cruz Biotechnology, Inc., Dallas,
TX, USA) for 2 h at 37°C. The protein expression levels were
detected using the enhanced chemiluminescence detection system
(Beyotime Institute of Biotechnology) and normalized to GAPDH. All
experiments were repeated three times. Densitometry scores were
determined using Quantity One software, version 4.6.9 (Bio-Rad
Laboratories, Inc., Hercules, CA, USA).
ELISA
The concentration of PGE2in the supernatant of the
Tfh co-culture system with HepG2 or HepG2.2.1.5 was determined
using the corresponding ELISA kit according to the manufacturers'
protocol (cat. no. DPABH-29,498; Creative Diagnostics, Shirley, NY,
USA).
Statistical analysis
Data are expressed as the mean ± standard deviation.
Student's t-test was performed to analyze the results of the gene
expression profiling assays. The comparisons between two groups
were analyzed using the Mann-Whitney non-parametric test.
Correlations between variables were evaluated using the Spearman's
rank correlation test. All statistical analyses were performed by
the SPSS version 19.0 (IBM SPSS, Armonk, NY, USA). P<0.05 was
considered to indicate a statistically significant difference.
Results
Distribution of Tfh-cell subsets in
patients with HBV at different immune phases
In order to investigate the distribution of Tfh-cell
subsets in patients with HBV infection the present study detected
the frequencies of total Tfh, ICOS+ and PD-1+
Tfh cells in patients with HBV at different immune phases IT, IA
and RP. Following the collection of PBMCs from patients and HC
groups, anti-CD4-PE and anti-CXCR5-APC were used to label total Tfh
cells (CD4+CXCR5+), whereas anti-ICOS-FITC
and anti-PD-1-PerCP were used to distinguish ICOS+ Tfh
and PD-1+Tfh cells (Fig.
1A). As presented in Fig. 1B and
C, the frequency of total Tfh and ICOS+ Tfh cells
was lower in the IT, RP and HC groups compared with the IA group.
By contrast the percentage of PD-1+ Tfh cells was
significantly higher in the IA group compared with the IT group
(Fig. 1D); however, it was
significantly reduced in the RP group compared with the IT and IA
groups. The frequency of PD+ Tfh was higher in the HC
group when compared with the RP group. Additionally, the ratio of
PD-1+/total Tfh cells exhibited similar changes to those
observed in the PD-1+ Tfh cells, a higher frequency in
IA and IT groups compared with RP and HC groups, whereas the ratio
of ICOS+/total Tfh cells was not changed much in HBV
groups and HC (data not shown). The difference in PD-1+
Tfh cell frequency in patients at different immune stages indicated
that PD-1+ Tfh cells maybe closely associated with the
development of HBV infection. Therefore, the potential association
between PD-1+ Tfh cells and HBV-associated clinical
parameters was also evaluated. It was determined that the frequency
of PD-1+ Tfh cells was not associated with AST and ALT
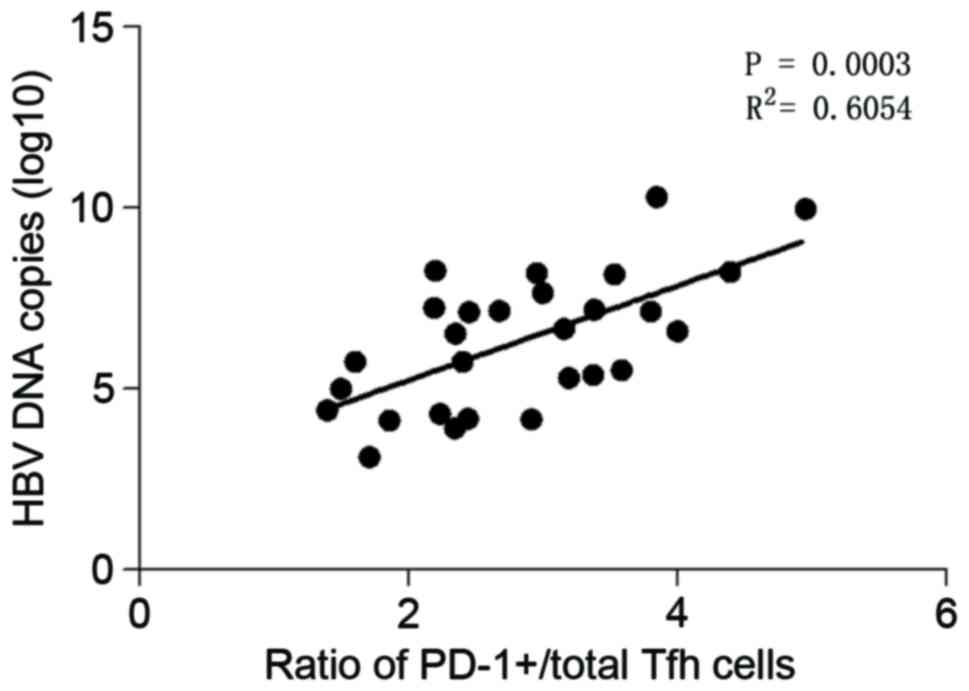
serum levels or HBV-DNA load (data not shown). Additionally, the
ratio of PD-1+/total Tfh cells was not associated with
AST or ALT serum levels (data not shown). However, the ratio of
PD-1+/total Tfh cells was positively correlated with the
load of HBV-DNA as presented in Fig.
2. These findings demonstrated that the ratio of
PD-1+/total Tfh cells may act as an indicator of HBV
duplication.
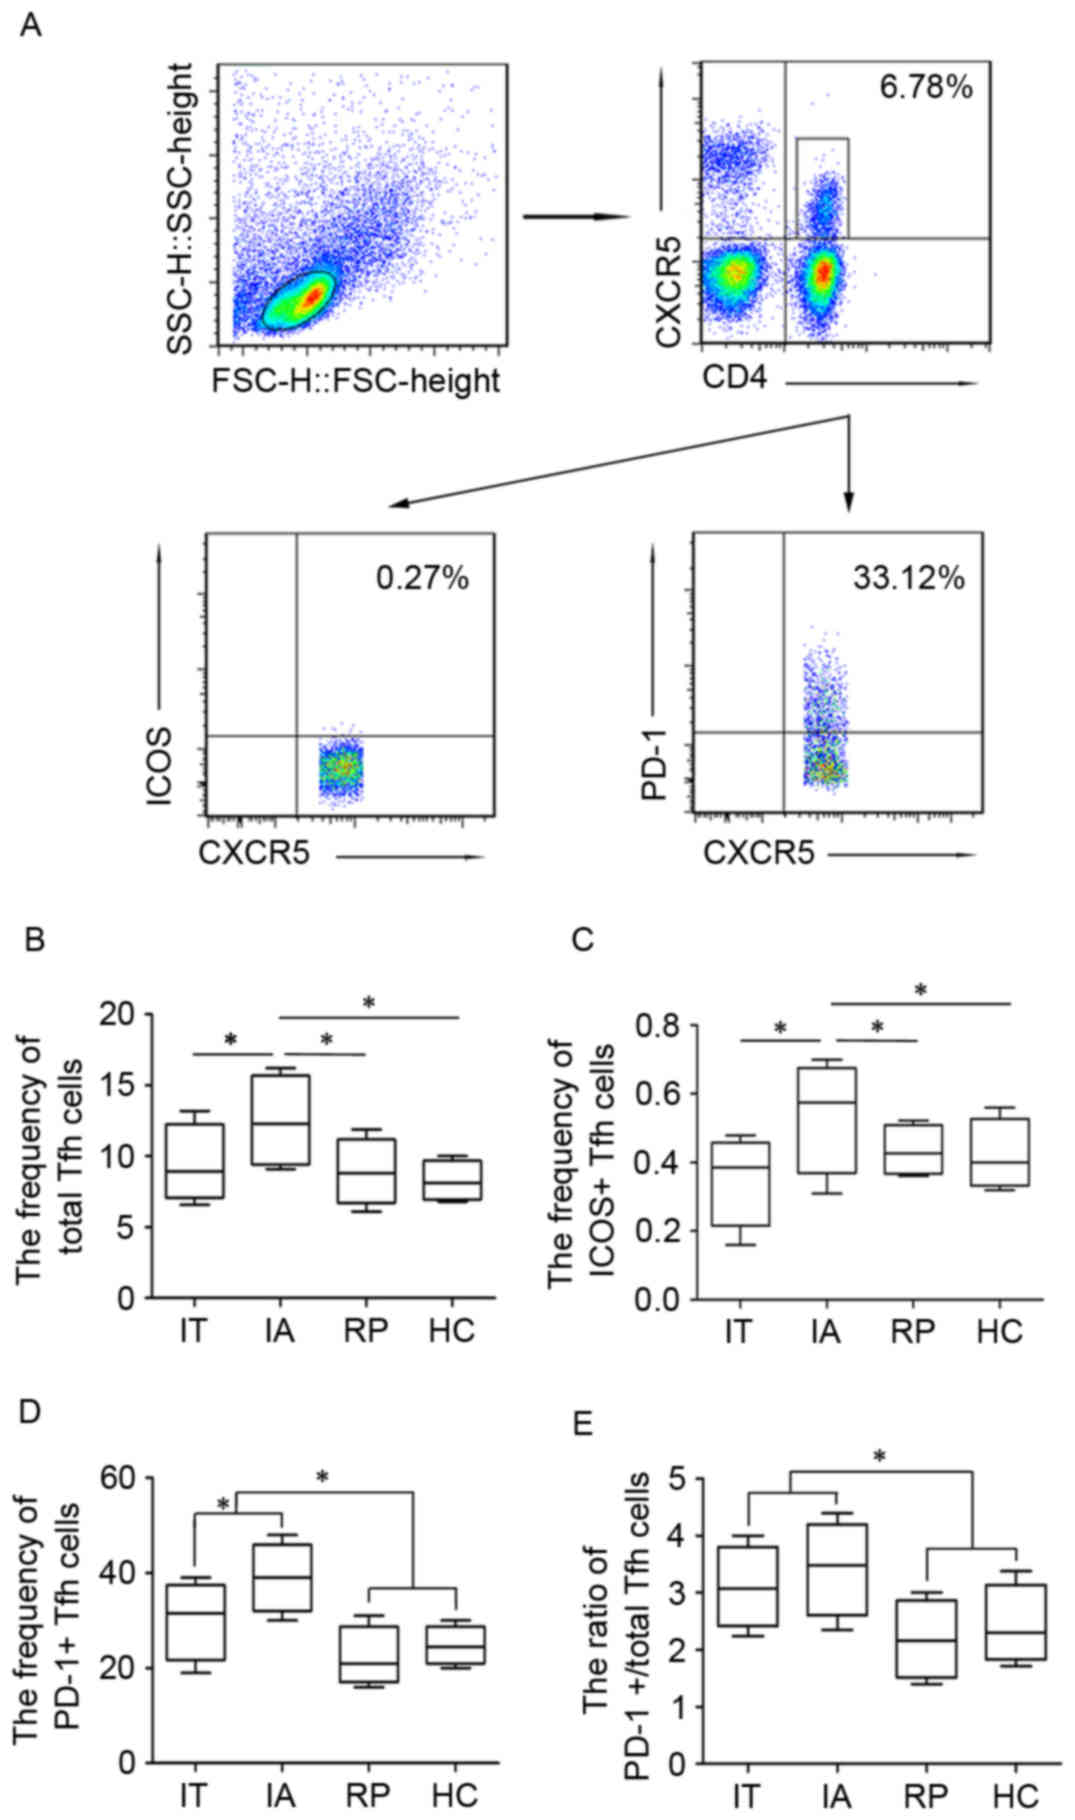 | Figure 1.Differential distribution of Tfh-cell
subsets in patients with HBV at different immune stages. Peripheral
blood Tfh (CD4+/CXCR5+) were isolated from
peripheral blood mononuclear cells and further divided into
ICOS+ Tfh and PD-1+ Tfh cells. (A) Gating
strategy of flow cytometry analysis and the representative
frequency for each group of Tfh cells. (B) Total Tfh cells, (C)
ICOS+ Tfh cells, (D) PD-1+ Tfh cells and (E)
ratio of PD-1+/total Tfh cells in patients with HBV at
different immune stages. Data are presented in a box and whisker
plot, where the lower and upper whiskers represent the 5th and 95th
percentiles respectively. The ends of the box represent the upper
and lower quantiles of the data, whereas the median is marked by a
line in the middle of the box. *P<0.05. Tfh, T follicular
helper; HBV, hepatitis B virus; SSC, side scatter; FCS, forward
scatter; CXCR5, C-X-C motif chemokine receptor 5; ICOS, inducible
T-cell costimulator; PD-1, programmed cell death 1; IT, immune
tolerance; IA, immune activation; HBsAg, surface antigen of HBV;
RP, responders with HBsAg seroconversion; HC, healthy controls. |
Effect of HBV on PD-1 expression in
Tfh cells
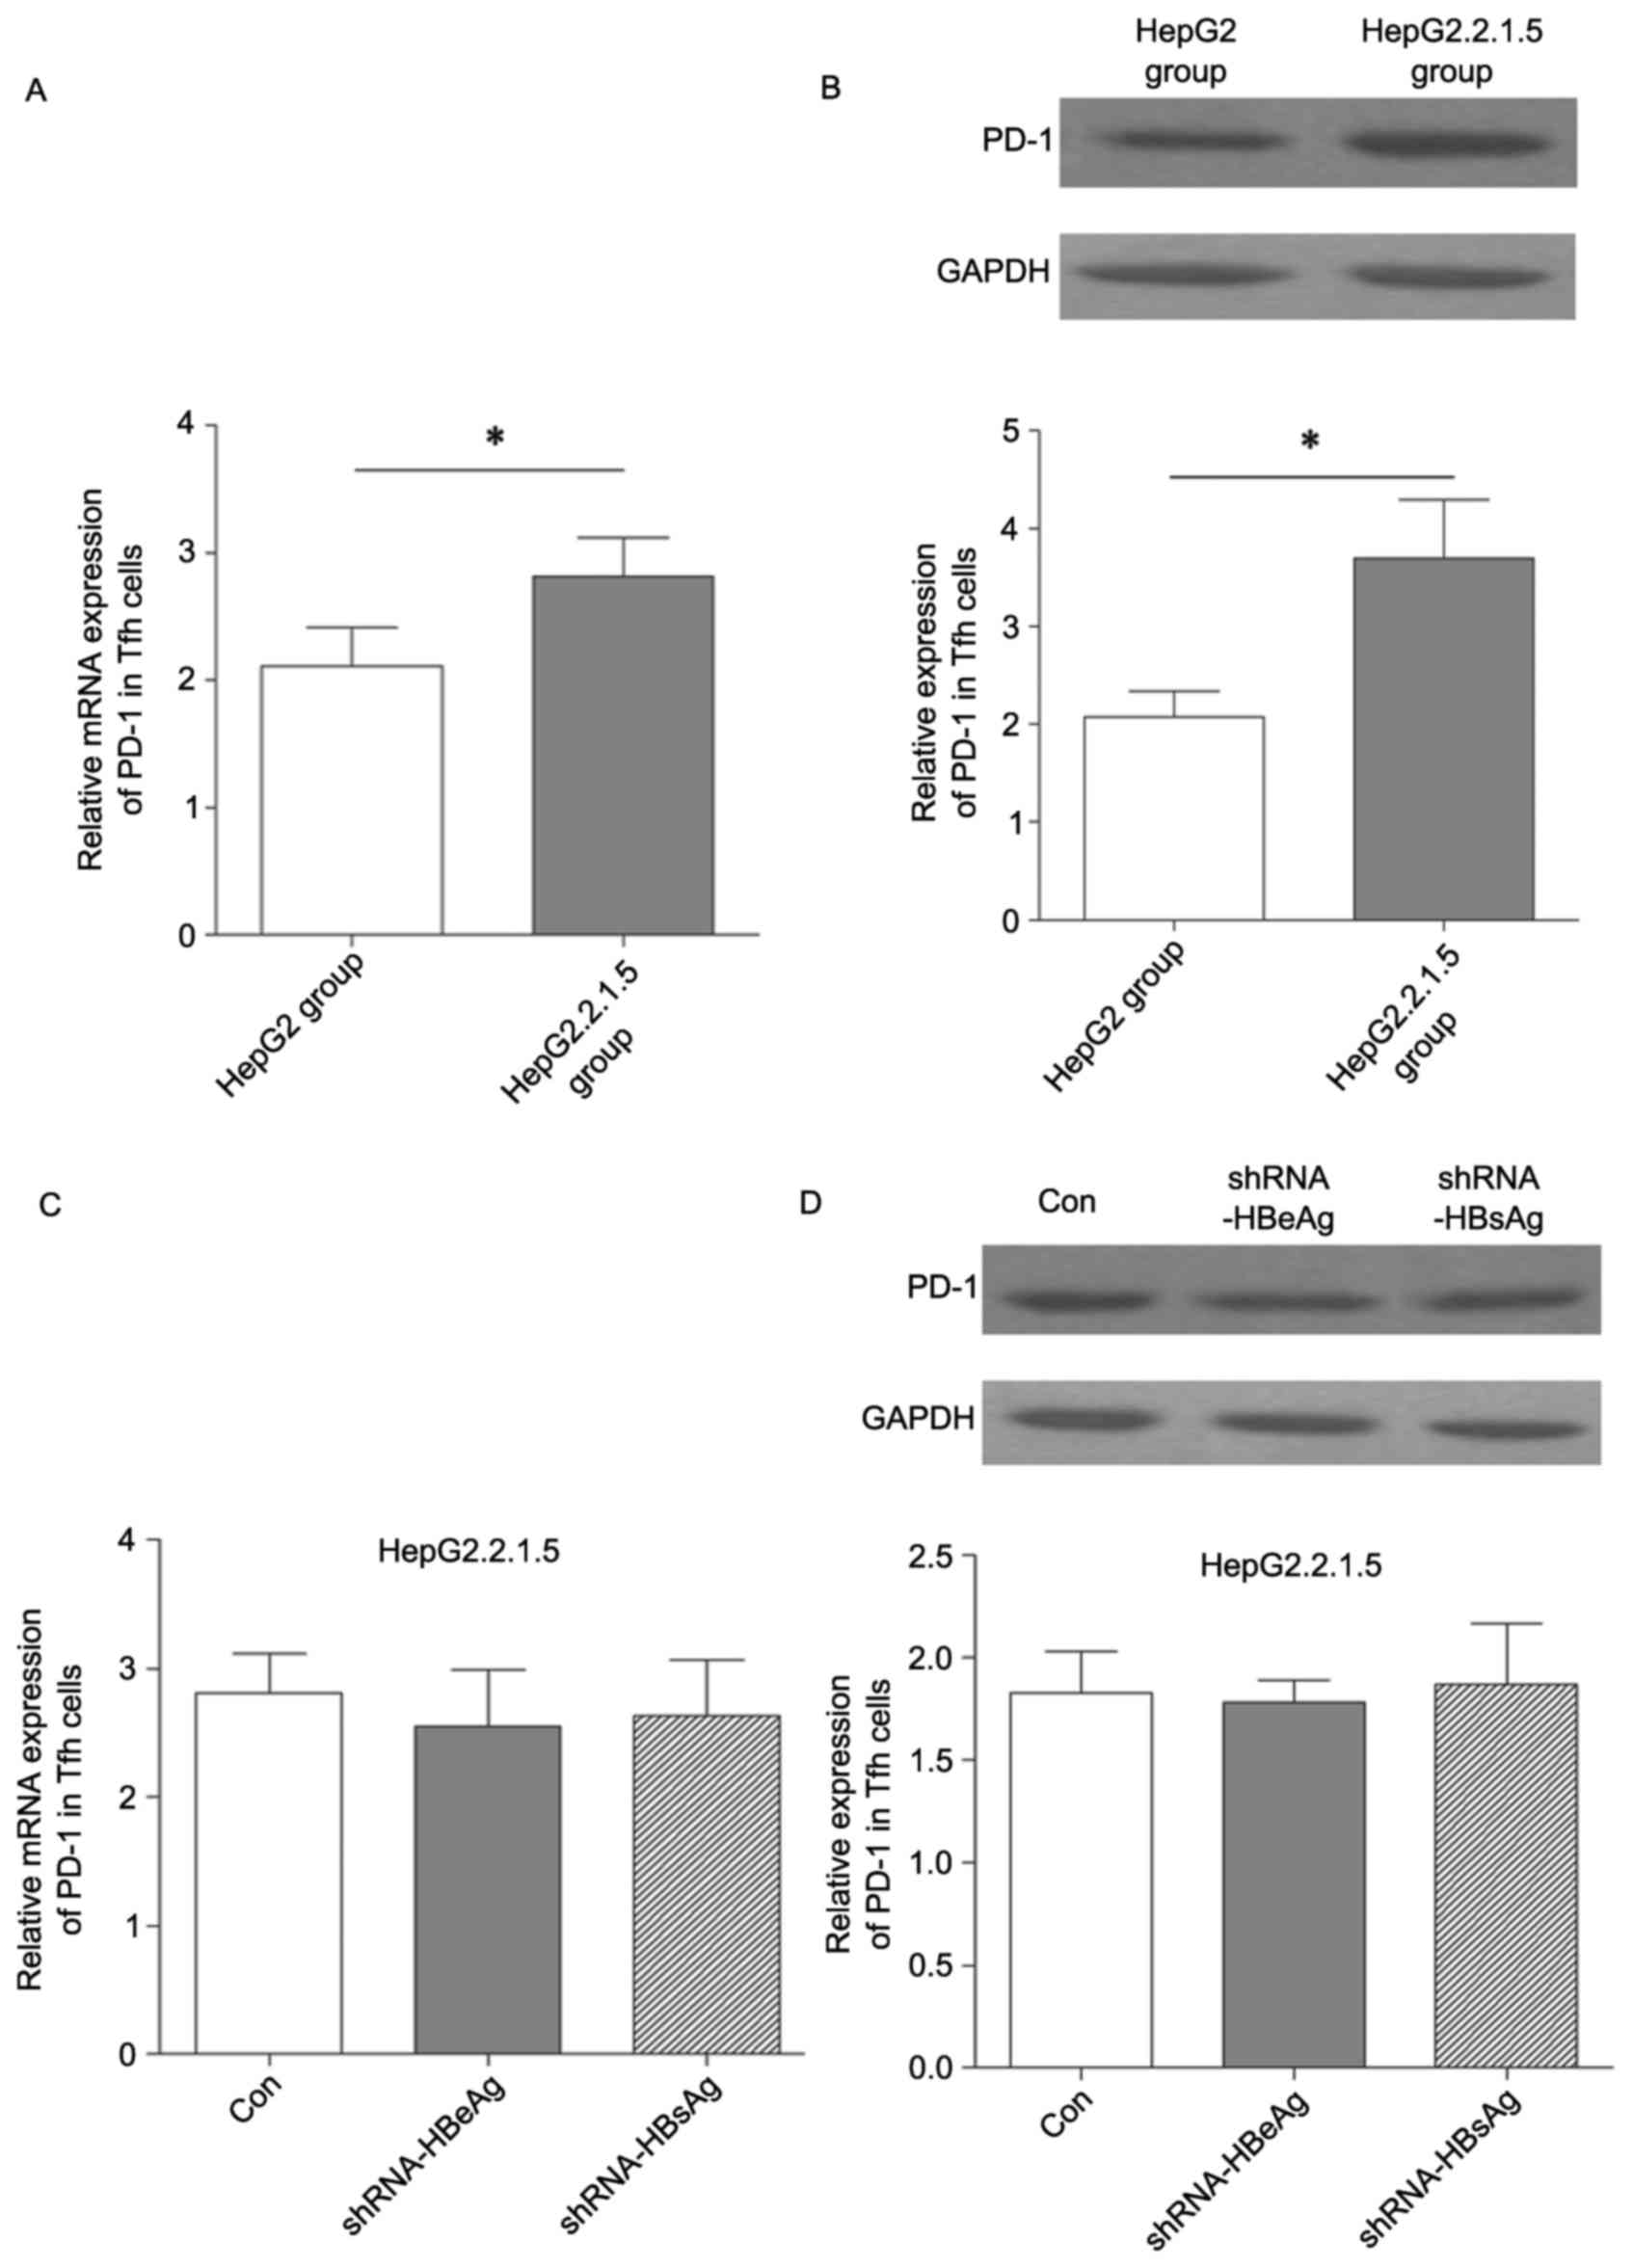
In order to investigate whether HBV may modulate
PD-1+ Tfh cells, the present study separated total Tfh
cells from PBMCs using flow cytometry and subsequently co-cultured
them with HepG2 and HepG2.2.1.5 cells. PD-1 mRNA and protein
expression levels in Tfh cells were detected using RT-qPCR and
western blotting. As presented in Fig.
3A and B, the expression level of PD-1 in Tfh cells was
significantly increased in the group co-cultured with HepG2.2.1.5
compared with the HepG2 group. In order to determine whether the
increased PD-1 expression level in Tfh cells was induced by HBV
secretion of HBeAg and HBsAg, shRNA vectors targeting HBeAg and
HBsAg were constructed in order to silence their mRNAs. However, no
significant difference in PD-1 expression level was identified
(Fig. 3C and D). These findings
implied that HBV modulation of PD-1 expression level in Tfh cells
was not directly mediated by the secretion of HBeAg and HBsAg.
PGE2 affects HBV regulation of PD-1
expression
PGE2 is an important inflammatory mediator, and has
been identified to be secreted by various types of cancer,
including lung and prostate cancer, and colorectal carcinoma
(18–20). Previous studies have demonstrated
that PGE2 was highly expressed in the liver tissues and peripheral
blood serum of patients with a chronic HBV infection (26,27).
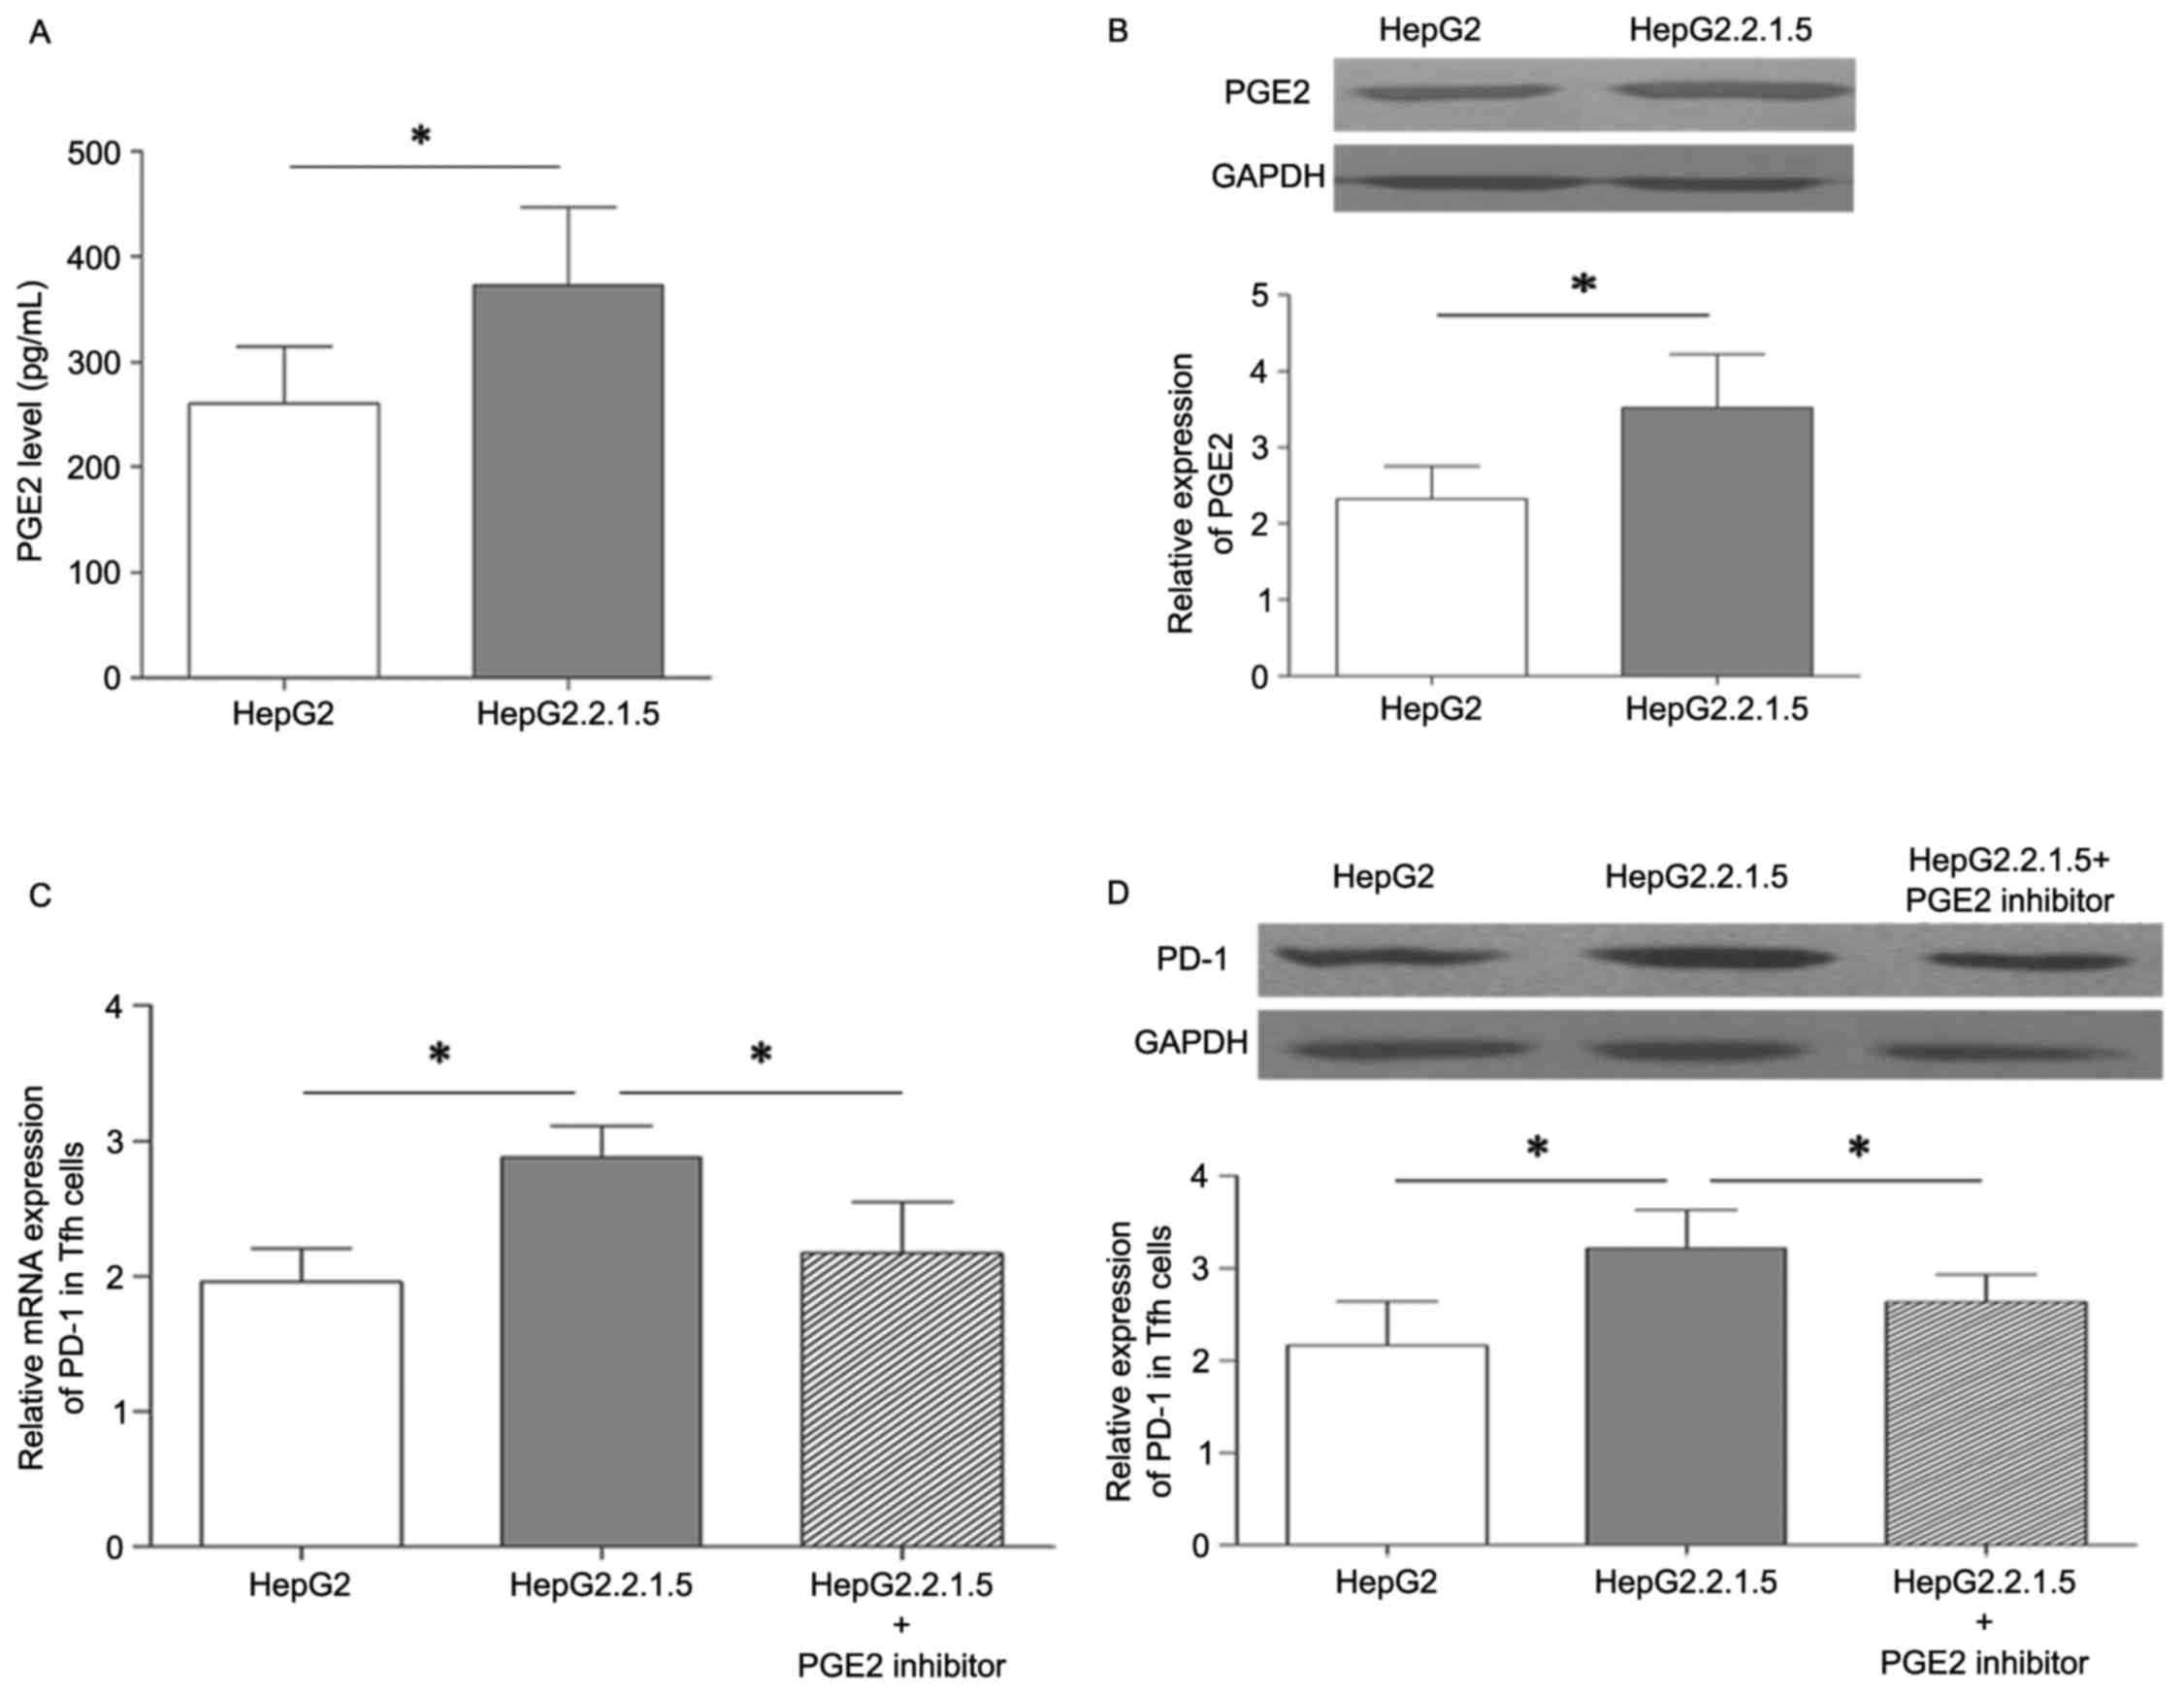
As the PD-1 expression level was higher in Tfh cells co-cultured
with HepG2.2.1.5 compared with HepG2, it was possible that HBV may
affect PD-1 expression by promoting an increase in PGE2 expression
level. As presented in Fig. 4A the
supernatant concentration of PGE2 was significantly higher in the
HepG2.2.1.5 group compared with the HepG2 group. PGE2 protein
expression was also increased in the HepG2.2.1.5 group compared
with the HepG2 group (Fig. 4B).
Subsequently, Tfh cells were co-cultured with HepG2.2.1.5, and a
PGE2 inhibitor group, which was treated with 6 µM pranoprofen for 6
h, to evaluate the effect of PGE2 expression on PD-1 levels in Tfh
cells. As presented in Fig. 4C and
D, the mRNA and protein expression of PD-1 in Tfh cells was
significantly reduced in the PGE2 inhibitor group. Therefore, HBV
may upregulate of PD-1 expression in Tfh cells by promoting
HepG2.2.1.5 tosecrete PGE2.
Discussion
The initiation of HCC is closely associated with
various etiological factors, including HBV and hepatitis C virus
infection, carcinogen/toxin exposure and other environmental or
genetic factors, such as excessive alcohol consumption, obesity and
metabolic syndrome (2–4). Chronic HBV infection is a major risk
factor for the development of HCC, which accounts for ~50% of all
HCC cases. The pathogenesis of HBV virus-induced HCC has been
previously reported to be primarily regulated by the chronic liver
inflammation during the HBV infection, particularly the dysfunction
of B and T cells (28,29). B cells are a major part of the
lymphocyte-mediated humoral immunity and are associated with
antibody production, directly contributing to the clearance of HBV.
Additionally, memory B cells may maintain the ability to quickly
activate the rapid humoral response upon antigen re-encounter
(30,31). The activation and functional
differentiation of B cells may also be primarily regulated by one
type of CD4+ T cells, the Tfh cells, which are located
in the GC of B cells GC, characterized by increased expression of
CXCR5, ICOS, PD-1, CD40-ligand and transcription factor Bcl-6, and
secretion of IL-21. Previous studies have reported that Tfh cells
may promote the formation of GCs, high-affinity long-living plasma
cells and memory B cells (32,33).
Previous studies have shown a high frequency of ICOS and
PD-1-expressing CD4+CXCR5+ Tfh cells in
patients with chronic HBV (34).
Therefore, the disturbance of Tfh distribution may contribute to
HBV development. Therefore, the present study initially analyzed
the distribution of ICOS+, PD-1+ and total
Tfh cells in patients with HBV at different immune phases. The
findings revealed that the frequencies of ICOS+ and
total Tfh cells were at a high level in IA; however, reduced
frequency was observed in the IT, RP and HC groups. The percentage
of PD-1+ Tfh cells was significantly higher in the IA
and IT groups compared with the RP and HC groups. The differential
distribution of ICOS+, PD-1+ and total Tfh
cells in HBV at different immune stages indicated that the
PD-1+ Tfh cells maybe more sensitive to the HBV-induced
immune system abnormalities. Therefore, the association between
PD-1+ Tfh cells and HBV-associated clinical features was
investigated further. However, it was determined that the ratio of
PD-1+/total Tfh cells, not the frequency of
PD-1+ Tfh cells was positively correlated with the load
of HBV DNA in patients with HBV at the IA and IT stages. Therefore,
this ratio may act as an indicator for HBV replication.
In order to determine the potential mechanism of HBV
modulation of PD-1 expression in Tfh cells, total Tfh cells were
co-cultured with HepG2 and HepG2.2.1.5 and PD-1 expression in Tfh
cells was significantly increased in the co-culture group with
HepG2.2.1.5 compared with the HepG2 co-culture group. In the
co-culture system, HBV may influence Tfh cells primarily through
the secretion of HBsAg and HBeAg; therefore, shRNA vectors
targeting HBeAg and HBsAg were transfected into HepG2.2.1.5.
Following the silencing of HBeAg and HBsAg, it was determined that
the PD-1 expression level in Tfh cells did not change
significantly. These findings implied that HBeAg and HBsAg secreted
by HepG2.2.1.5 were not directly responsible for the changes in
PD-1 expression in Tfh cells.
From the multiple cytokines and inflammatory factors
secreted by HBV-infected cells, PGE2 may be capable of efficiently
inducing immunological tolerance and maintain HBV-cell survival.
The expression level of PGE2 may be modulated by inducible nitric
oxide synthase, interleukins and Toll-like receptor signaling
pathways and COX-2 is an upstream regulator of PGE2. Zheng et
al (35) reported that HBx
promotedHepG2 cell proliferation by upregulation of COX-2
expression. Therefore, the present study considered HBV may also
affectPGE2 expression level. It was determined that the supernatant
concentration of PGE2 was higher in the HepG2.2.1.5 group compared
with the HepG2 group. Additionally, the expression of PGE2 at the
transcriptional and translational level was significantly increased
in the HepG2.2.1.5 group compared with the HepG2 group.
Subsequently, Tfh cells were co-cultured with HepG2.2.1.5 and PD-1
expression in Tfh cells was significantly reduced in the group
treated with the PGE2 inhibitor, pranoprofen. This indicated that
HBV increasingPD-1expression level in Tfh cells was primarily
mediated by improving the ability of HepG2.2.1.5 to secret PGE2 as
opposed to the secretion of HBeAg and HBsAg. However, whether the
upregulation of PGE2 may be modulated by HBx remains to be
elucidated.
In conclusion, the HBV-induced increase of PGE2
expression level in HepG2.2.1.5 contributed to the increased level
of PD-1 in Tfh cells, which may lead to immune tolerance mediated
by PD-1+ Tfh cells and the maintenance of chronic
infection status. Understanding the regulatory mechanism of HBV in
the modulation of different Tfh cell subsets is crucial for the
development of novel immunotherapy-based approaches towards
HBV.
Acknowledgements
The present study was supported by the Youth Found
of The First Hospital of Jilin University (grant no. JDYY520/5027)
and by the Natural Science Foundation of Guangdong Province (grant
no. 2015A030313264).
References
|
1
|
Basnayake SK and Easterbrook PJ: Wide
variation in estimates of global prevalence and burden of chronic
hepatitis B and C infection cited in published literature. J Viral
Hepat. 23:545–559. 2016. View Article : Google Scholar
|
|
2
|
GBD 2013 Mortality and Causes of Death
Collaborators, . Global, regional, and national age-sex specific
all-cause and cause-specific mortality for 240 causes of death,
1990–2013: A systematic analysis for the global burden of disease
study 2013. Lancet. 385:117–171. 2015. View Article : Google Scholar
|
|
3
|
Lok AS and McMahon BJ: Chronic hepatitis
B. Hepatology. 45:507–539. 2007. View Article : Google Scholar
|
|
4
|
Liu WP, Wang XP, Zheng W, Ping LY, Zhang
C, Wang GQ, Song YQ and Zhu J: Hepatitis B virus reactivation after
withdrawal of prophylactic antiviral therapy in patients with
diffuse large B cell lymphoma. Leuk Lymphoma. 56:1355–1362. 2016.
View Article : Google Scholar
|
|
5
|
Jia Y, Zeng Z, Li Y, Li Z, Jin L, Zhang Z,
Wang L and Wang FS: Impaired function of CD4+ T follicular helper
(Tfh) cells associated with hepatocellular carcinoma progression.
PLoS One. 10:e01174582015. View Article : Google Scholar :
|
|
6
|
Zgair AK, Ghafil JA and AI-Sayidi RH:
Direct role of antibody-secreting B cells in the severity of
chronic hepatitis B. J Med Virol. 87:407–416. 2015. View Article : Google Scholar
|
|
7
|
Zhao PW, Shi X, Li C, Ayana DA, Niu JQ,
Feng JY, Wang J and Jiang YF: IL-33 enhances humoral immunity
against chronic HBV infection through activating CD4(+)CXCR5(+) TFH
cells. J Interferon Cytokine Res. 35:454–463. 2015. View Article : Google Scholar :
|
|
8
|
Hu TT, Song XF, Lei Y, Hu HD, Ren H and Hu
P: Expansion of circulating TFH cells and their associated
molecules: Involvement in the immune landscape in patients with
chronic HBV infection. Virol J. 11:542014. View Article : Google Scholar :
|
|
9
|
Morita R, Schmitt N, Bentebibel SE,
Ranganathan R, Bourdery L, Zurawski G, Foucat E, Dullaers M, Oh S,
Sabzghabaei N, et al: Human blood CXCR5(+)CD4(+) T cells are
counterparts of T follicular cells and contain specific subsets
that differentially support antibody secretion. Immunity.
34:108–121. 2011. View Article : Google Scholar :
|
|
10
|
Crotty S: Follicular helper CD4 T cells
(TFH). Annu Rev Immunol. 29:621–663. 2011. View Article : Google Scholar
|
|
11
|
Tangye SG, Ma CS, Brink R and Deenick EK:
The good, the bad and the ugly-TFH cells in human health and
disease. Nat Rev Immunol. 13:412–426. 2013. View Article : Google Scholar
|
|
12
|
King C, Tangye SG and Mackay CR: T
follicular helper (TFH) cells in normal and dysregulated immune
responses. Annu Rev Immunol. 26:741–766. 2008. View Article : Google Scholar
|
|
13
|
Chakravarti N and Prieto VG: Predictive
factors of activity of anti-programmed death-1/programmed death
ligand-1 drugs: Immunohistochemistry analysis. Transl Lung Cancer
Res. 4:743–751. 2015.
|
|
14
|
Lee V and Le DT: Efficacy of PD-1 blockade
in tumors with MMR deficiency. Immunotherapy. 8:1–3. 2016.
View Article : Google Scholar
|
|
15
|
Radhakrishnan P, Chachadi V, Lin MF, Singh
R, Kannagi R and Cheng PW: TNFα enhances the motility and
invasiveness of prostatic cancer cells by stimulating the
expression of selective glycosyl- and sulfotransferase genes
involved in the synthesis of selectin ligands. Biochem Biophys Res
Commun. 409:436–441. 2011. View Article : Google Scholar :
|
|
16
|
Egberts JH, Cloosters V, Noack A,
Schniewind B, Thon L, Klose S, Kettler B, von Forstner C, Kneitz C,
Tepel J, et al: Anti-tumor necrosis factor therapy inhibits
pancreatic tumor growth and metastasis. Cancer Res. 68:1443–1450.
2008. View Article : Google Scholar
|
|
17
|
Stathopoulos GT, Kollintza A, Moschos C,
Psallidas I, Sherrill TP, Pitsinos EN, Vassiliou S, Karatza M,
Papiris SA, Graf D, et al: Tumor necrosis factor-alpha promotes
malignant pleural effusion. Cancer Res. 67:9825–9834. 2007.
View Article : Google Scholar
|
|
18
|
Mendez M and LaPointe MC: PGE2-induced
hypertrophy of cardiac myocytes involves EP4 receptor-dependent
activation of p42/44 MAPK and EGFR transactivation. Am J Phys Heart
Circ Physiol. 288:H2111–H2117. 2005. View Article : Google Scholar
|
|
19
|
Krysan K, Reckamp KL, Dalwadi H, Sharma S,
Rozengurt E, Dohadwala M and Dubinett SM: Prostaglandin E2
activates mitogen-activated protein kinase/Erk pathway signaling
and cell proliferation in non-small cell lung cancer cells in an
epidermal growth factor receptor-independent manner. Cancer Res.
65:6275–6281. 2005. View Article : Google Scholar
|
|
20
|
Xu F, Xu Z, Zhang R, Wu Z, Lim JH, Koga T,
Li JD and Shen H: Nontypeable Haemophilus influenzae induces COX-2
and PGE2 expression in lung epithelial cells via activation of p38
MAPK and NF-kappa B. Respir Res. 9:162008. View Article : Google Scholar :
|
|
21
|
Zhang Z, Chen D, Yao J, Zhang H, Jin L,
Shi M, Zhang H and Wang FS: Increased infiltration of intrahepatic
DC subsets closely correlate with viral control and liver injury in
immune active pediatric patients with chronic hepatitis B. Clin
Immunol. 122:173–180. 2007. View Article : Google Scholar
|
|
22
|
Lok AS and McMahon BJ: Chronic hepatitis
B. Hepatology. 45:507–539. 2007. View Article : Google Scholar
|
|
23
|
Pan CQ and Zhang JX: Natural history and
clinical consequences of hepatitis B Virus infection. Int J Med
Sci. 2:36–40. 2005. View Article : Google Scholar :
|
|
24
|
Lan P, Zhang C, Han Q, Zhang J and Tian Z:
Therapeutic recovery of hepatitis B virus (HBV)-induced
hepatocyte-intrinsic immune defect reverses systemic adaptive
immune tolerance. Hepatology. 58:73–85. 2013. View Article : Google Scholar
|
|
25
|
Livak KJ and Schmittgen TD: Analysis of
relative gene expression data using real-time quantitative PCR and
the 2(−Delta Delta C(T)) method. Methods. 25:402–408. 2001.
View Article : Google Scholar
|
|
26
|
Chen JH, Perry CJ, Tsui YC, Staron MM,
Parish IA, Dominguez CX, Rosenberg DW and Kaech SM: Prostaglandin
E2 and programmed cell death 1 signaling coordinately impair CTL
function and survival during chronic viral infection. Nat Med.
21:327–334. 2015. View
Article : Google Scholar :
|
|
27
|
Chen S, Liu C, Wang X, Li X, Chen Y and
Tang N: 15-Deoxy-Δ(12,14)-prostaglandin J2 (15d-PGJ2) promotes
apoptosis of HBx-positive liver cells. Chem Biol Interact.
214:26–32. 2014. View Article : Google Scholar
|
|
28
|
Zgair AK, Ghafil JA and Al-Sayidi RH:
Direct role of antibody-secreting B cells in the severity of
chronic hepatitis B. J Med Virol. 87:407–416. 2015. View Article : Google Scholar
|
|
29
|
Wang F, Xu RH, Luo HY, Zhang DS, Jiang WQ,
Huang HQ, Sun XF, Xia ZJ and Guan ZZ: Clinical and prognostic
analysis of hepatitis B virus infection in diffuse large B-cell
lymphoma. BMC Cancer. 8:1152008. View Article : Google Scholar :
|
|
30
|
Bussmann BM, Reiche S, Bieniek B, Krznaric
I, Ackermann F and Jassoy C: Loss of HIV-specific memory B-cells as
a potential mechanism for the dysfunction of the humoral immune
response against HIV. Virology. 397:7–13. 2010. View Article : Google Scholar
|
|
31
|
Töpfer E, Boraschi D and Italiani P:
Innate Immune Memory: The latest frontier of adjuvanticity. J
Immunol Res. 2015:4784082015. View Article : Google Scholar :
|
|
32
|
Fazilleau N, Mark L, McHeyzer-Williams LJ
and McHeyzer-Williams MG: Follicular helper T cells: Lineage and
location. Immunity. 30:324–335. 2009. View Article : Google Scholar :
|
|
33
|
McHeyzer-Williams LJ, Pelletier N, Mark L,
Fazilleau N and McHeyzer-Williams MG: Follicular helper T cells as
cognate regulators of B cell immunity. Curr Opin Immunol.
21:266–273. 2009. View Article : Google Scholar :
|
|
34
|
Feng J, Lu L, Hua C, Qin L, Zhao P, Wang
J, Wang Y, Li W, Shi X and Jiang Y: High frequency of CD4+ CXCR5+
TFH cells in patients with immune-active chronic hepatitis B. PLoS
One. 6:e216982011. View Article : Google Scholar :
|
|
35
|
Zheng BY, Fang XF, Zou LY, Huang YH, Chen
ZX, Li D, Zhou LY, Chen H and Wang XZ: The co-localization of HBx
and COXIII upregulates COX-2 promoting HepG2 cell growth. Int J
Oncol. 45:1143–1150. 2014.
|