Introduction
Rheumatoid arthritis (RA) is a common, complex and
long lasting autoimmune disorder that originates in the joints
(1). It typically manifests with
signs of inflammation, the affected joints becoming swollen, warm,
painful and stiff, particularly, early in the morning upon waking
or following prolonged inactivity (2). However, the underlying mechanism
behind RA remains to be fully elucidated. Increased understanding
of the immune mechanisms has led to the development of a
considerable number of novel therapeutic agents that alter the
progression of the disease and reduce mortality (3). Previous genetic studies on RA,
including recent genome wide association studies, have identified
32 risk loci among individuals of European ancestry, including
major histocompatibility complex class II DR β 1 (HLA-DRB1),
protein tyrosine phosphatase non-receptor type 22 (PTPN22)
and other loci with shared autoimmune associations (4,5).
Meanwhile, peptidyl arginine deiminase type IV (PADI4) has
been identified as a major risk factor in people of Asian descent;
however, not in those of European descent (6). Few studies have investigated other
biological markers that are associated with RA aside from genetic
loci, such as the signaling pathways involved.
Pathway analysis has become a common method to gain
insight into the underlying biology of genes and proteins, as it
reduces the complexity and increases explanatory power fo analysis
(7). However, previous studies
primarily focused on identifying the altered pathways between
normal and cancer groups, or the common genes between two pathways,
whereas investigation of the differential interactions between two
pathways across disease samples and normal samples is infequent
(8,9). Additionally, network-based methods
provide more stable and effective measures to investigate functions
of genes in certain diseases, and and to understand the connections
betweeen different genes (10).
Scoring pathways by evaluating the coherency of gene expression
changes and combining gene expression quantification over multiple
datasets may a lead to novel insights in pathway-associated
studies.
Therefore, the present study proposed a novel method
to identify hub pathways of RA based on differential pathway
network (DPN), which investigated the differential interactions
between pathways in RA. In order to perform this, pathway data was
obtained from background protein-protein interaction (PPI) networks
and the Reactome pathway database. Subsequently, the differential
pathway interactions were extracted from the pathway data and
gene-gene interactions were built randomly. The differential
pathway interactions were visualized using Cytoscape to construct a
DPN. Modules of DPN were mined according to ClusterONE. Topological
analysis of DPN was conducted to identify hub pathways that may be
potential targets for treatment of RA.
Materials and methods
Gene expression data
The gene expression profile of RA with access no.
E-GEOD-45291 (11) was obtained
from a public functional genomics data repository ArrayExpress
(http://www.ebi.ac.uk/arrayexpress/).
E-GEOD-45291, which was deposited on A-GEOD-13158-
[HT_HG-U133_Plus_PM] Affymetrix HT HG-U133+PM Array Plate Platform
(Affymetrix, Inc., Santa Clara, CA, USA), consisted of 378 RA
samples and 20 normal controls. The probe-level dataset in CEL file
format was converted into expression measures and a total of 7,352
genes were identified in the expression profile.
Pathway data
In the present study, global PPI interactions were
downloaded from the Search Tool for the Retrieval of Interacting
Genes/Proteins database (http://string-db.org/), which has catalogued a total
of 787,896 PPI in human. By mapping the gene expression profile
E-GEOD-45291 on the global PPI network, the present study
identified a background PPI network with 6,666 nodes and 196,304
interactions.
Information from gene sets representing different
biological pathways was downloaded from the Reactome pathway
database (www.reactome.org) and a total of 1,675
pathways were obtained. The Reactome database is an online-curated
resource for human pathway data and provides infrastructure for
computation across biological reaction networks (12). The number of interacting genes
between each pathway and the background PPI network were
calculated, and pathways with intersections <5 were discarded in
order to improve pathway stability. Pathways with a small number of
genes are more easily understood; therefore pathways with gene sets
>100 were also excluded (13).
A total of 855 pathways were reserved as pathway data for further
analysis. An ID for each pathway was assigned in ascending
order.
Pathway network construction
To evaluate the interactions between different
pathways, the present study used the genes in each pathway to
construct random gene interactions. When the same gene interaction
was established between two pathways, it was considered that the
two pathways were correlated. In order to determine the strength of
pathway interactions, Spearman correlation coefficient (SCC)
(14) was used for intersected
interactions in two pathways. Their absolute differences in RA and
normal controls were calculated, and the mean value of absolute
differences for all intersected interactions was denoted as the
weight between two pathways. Taking pathway 1 for example, genes
enriched in pathway 1 and pathway 2 were used to build gene
interaction and then these interactions were integrated with the
background PPI network, the intersections were considered to be
pathway interactions between pathway 1 and pathway 2. Subsequently,
the pathway intersections under RA and normal conditions were
weighted by SCC. The SCC of a pair of interactions (x and
y), was defined as:
SCC(x,y)=1s–1∑i=1s(g(x,i)–g¯(x)σ(x))·(g(y,i)–g¯(y)σ(y))
Where s was the number of interactions,
g(x, i) or g(y, i) was
the expression level of interaction x or y in the
pathway i under a specific condition (RA or normal),
̄g (x) or ̄g (y) represent the mean
expression level of interaction x or y. Calculating
the absolute difference of an interaction in RA and normal
conditions, the mean value of absolute differences of all
interactions was defined as the weight value between pathway 1 and
pathway 2. If there was no intersection between pathway 1 and
pathway 2, the two pathways had no interaction.
Subsequently, gene interactions were constructed
based on genes in pathway 1 and pathway 3, the aforementioned
method used to determine the interaction and weight value between
pathway 1 and pathway 3. Therefore, all interactions and their
weight values for any two pathways were obtained and interactions
of weight value >0.7 were identified as differential
interactions and used to construct a DPN which was visualized by
Cytoscape (15).
Topological analysis
To further investigate the functions and importance
of pathways in the DPN, the biological importance of pathways was
characterized using indices of topological analysis. Degree
quantified the local topology of each gene, by summing the number
of its adjacent genes (16). This
provides a simple count of the number of interactions of a given
node. The degree of a pathway was the sum of its adjacent pathways.
The pathways at the top 5% of degree distribution (the ≥95%
quantile) in the significantly perturbed networks were defined as
hub pathways. The degree D(v) of a node v was defined
as:
D(v)=∑javj
Modules mined from DPN
The emergence of high-throughput techniques for
inferring protein interactions on a large-scale has fueled the
development of computational techniques to systematically mine for
potential complexes from the interaction networks (17). Therefore, the present study mined
potential complexes from the network of pathway interaction using
computational techniques, and the resulting complexes were defined
as modules. The present study used ClusterONE (18), a method for detecting overlapping
pathway complexes from weighted differential interactions based on
seeding and greedy growth, was implemented to identify the modules
of DPN. It used a cohesiveness measure to determine how likely is
it for a group of pathways to form a complex, based on the weight
of the interactions within the group and with the rest of the
network (19).
In the first step, ClusterONE identified seed
pathways and greedy growth them into groups with high cohesiveness.
When the greedy growth for a group could not progress any more, the
next seed pathway was selected and the procedure was repeated until
no more seed pathways remained. In the second step, ClusterONE
detected highly overlapping cohesive groups and merged them into
potential complex candidates or modules. Furthermore, ClusterONE
allowed the identification of overlapping complexes if each of the
merged groups represented individual complexes that shared
pathways. The modules that met the following thresholds: Size ≥20,
density ≥0.3 and overlap ≥0.5) were selected as significant modules
for the RA DPN.
Results
DPN construction
A total of 855 pathways were identified to establish
pathway-pathway interactions and 295,509 interactions between
pathways were obtained. Each pathway interaction was assigned a
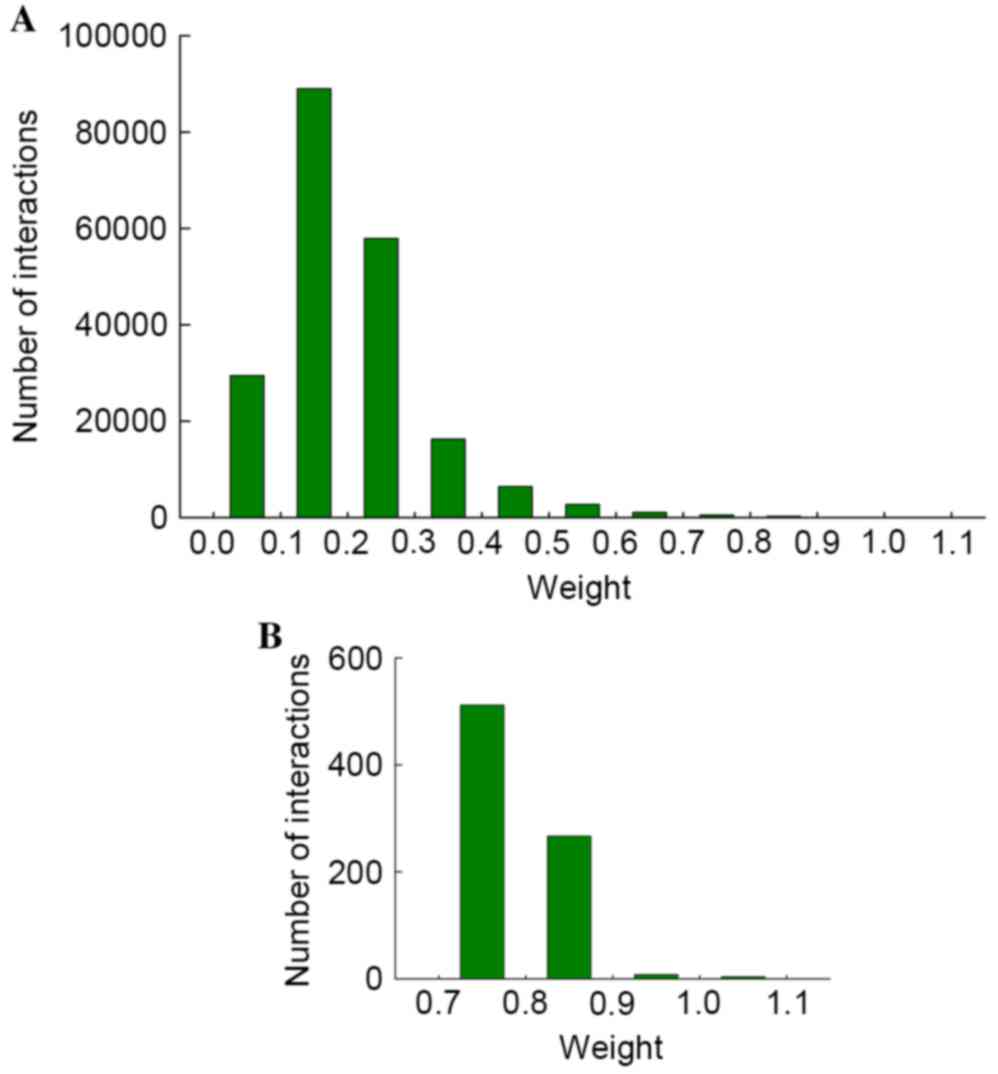
weight value. Fig. 1 presents the
distribution of weight values. It was determined that weight values
of the majority interactions ranged between 0 and 0.4, particularly
0.1–0.2. This low weight value may indicate that the two pathways
had low interaction strength and there was little change in the two
pathways between the RA and normal controls; therefore,
interactions of with weight values <0.7 were filtered out, and
the remaining pathway interactions were selected for further
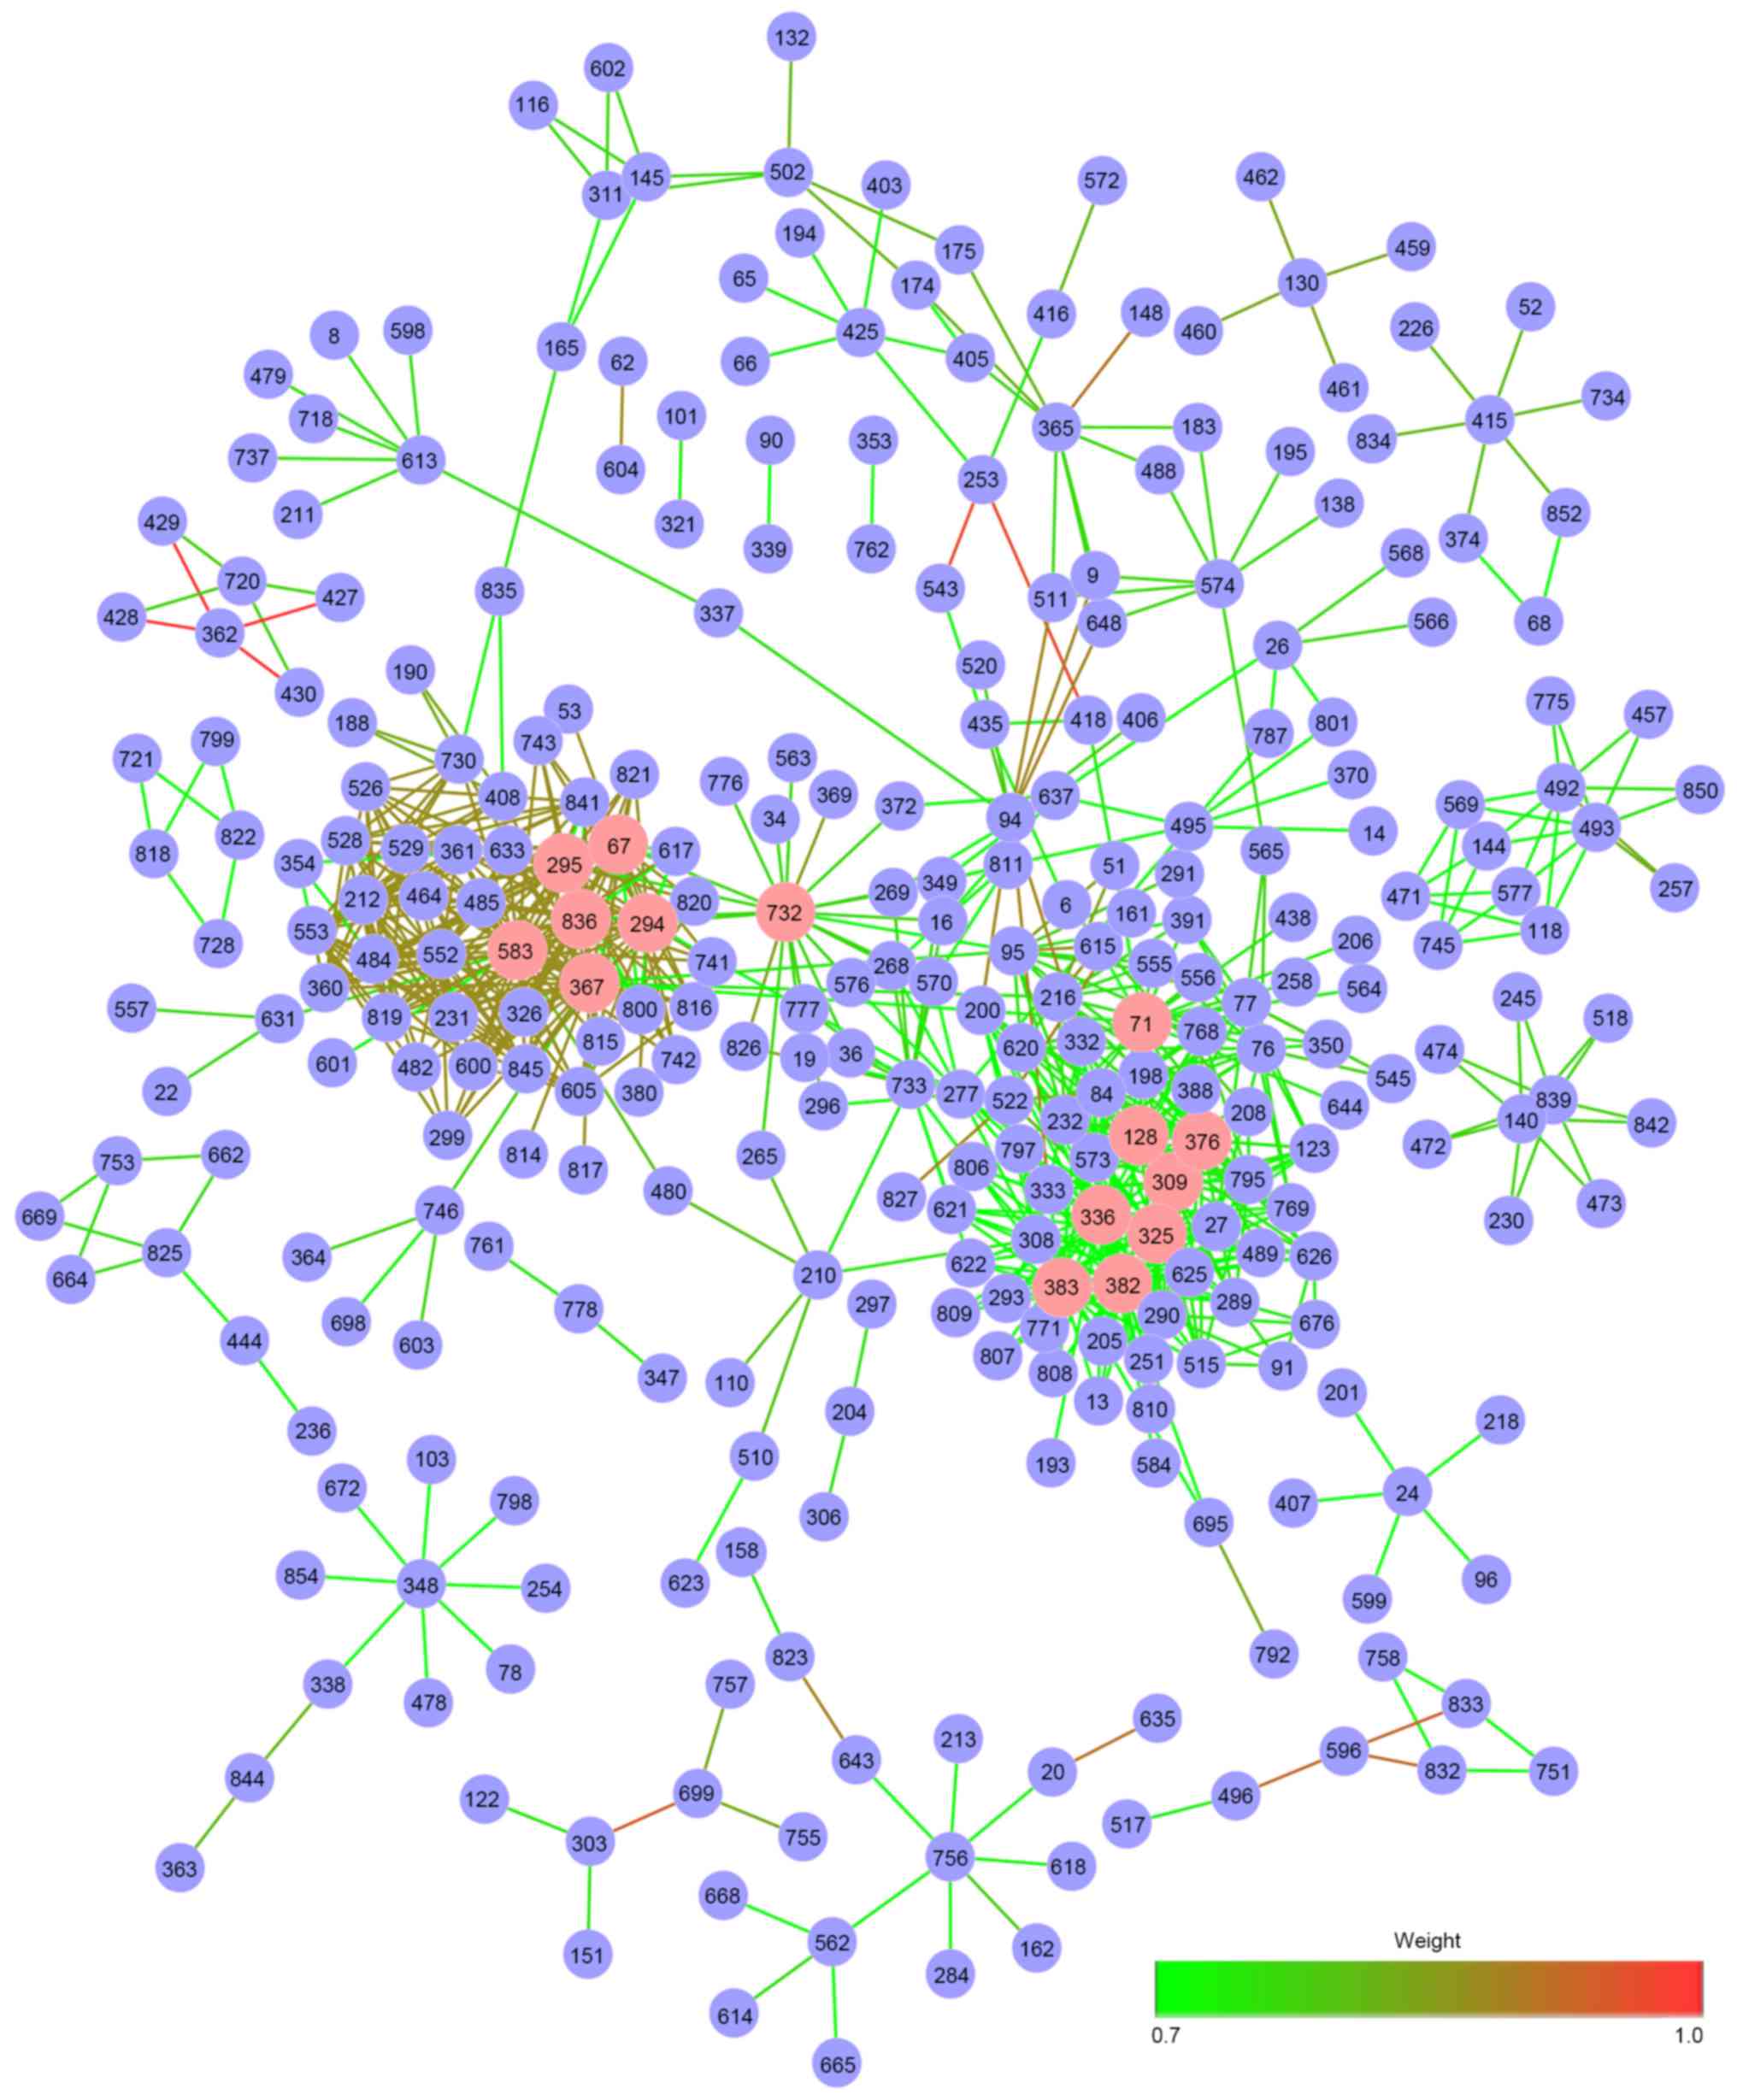
analysis. When inputting these differential interactions into the
Cytoscape software, a DPN with 312 nodes and 791 interactions was
visualized (Fig. 2). Nodes
represented pathways, and edges represented pathway
interactions.
Hub pathways
In order to determine the functions and importance
of 312 pathways, topological analysis of degree for the DPN was
conducted. The degree of a pathway was the sum of all connected
pathways, and pathways with top 5% degree distribution in the
pathway network were defined as hub pathways. Fig. 2 presents hub pathways with pink
vertices, and the detailed degrees for 15 hub pathways are
presented in Table I. Each pathway
was represented by its matching ID number. Heparan
sulfate/heparin-glycosaminoglycan (HS-GAG) degradation with degree
35 (ID: 336), HS-GAG metabolism (ID: 325) with degree 33, keratan
sulfate degradation (ID: 382) with degree 33, DNA-binding
transcription factor RAP1 signaling (ID: 583) with degree 28 and
interleukin-3, 5 and granulocyte-macrophage colony-stimulating
factor signaling (ID: 367) with degree 26 were the top 5
significant hub pathways of RA based on the DPN. Notably, the top
two hub pathways, HS-GAG degradation and HS-GAG metabolism, were
both associated with HS-GAG, this may indicate that HS-GAG may be
important in RA.
 | Table I.Hub pathways of rheumatic arthritis
based on differential pathway network. |
Table I.
Hub pathways of rheumatic arthritis
based on differential pathway network.
| ID | Pathway name | Degree |
|---|
| 336 | HS-GAG
degradation | 35 |
| 325 | HS-GAG
metabolism | 33 |
| 382 | Keratan sulfate
degradation | 33 |
| 583 | DNA-binding
transcription factor RAP1 signaling | 28 |
| 367 | Interleukin-3,5 and
granulocyte-macrophage colony-stimulating factor signaling | 26 |
| 294 | Glucagon signaling
in metabolic regulation | 24 |
| 67 | Aquaporin-mediated
transport | 23 |
| 836 | Vasopressin
regulates renal water homeostasis via aquaporins | 23 |
| 732 | Sphingolipid de
novo biosynthesis | 22 |
| 295 | Glucagon-like
peptide-1 regulates insulin secretion | 21 |
| 71 | Assembly of the
human immunodeficiency virus virion | 21 |
| 383 | Keratan
sulfate/keratin metabolism | 20 |
| 376 | Iron uptake and
transport | 18 |
| 128 | Clathrin derived
vesicle budding | 17 |
| 309 | Golgi-associated
vesicle biogenesis | 17 |
Modules
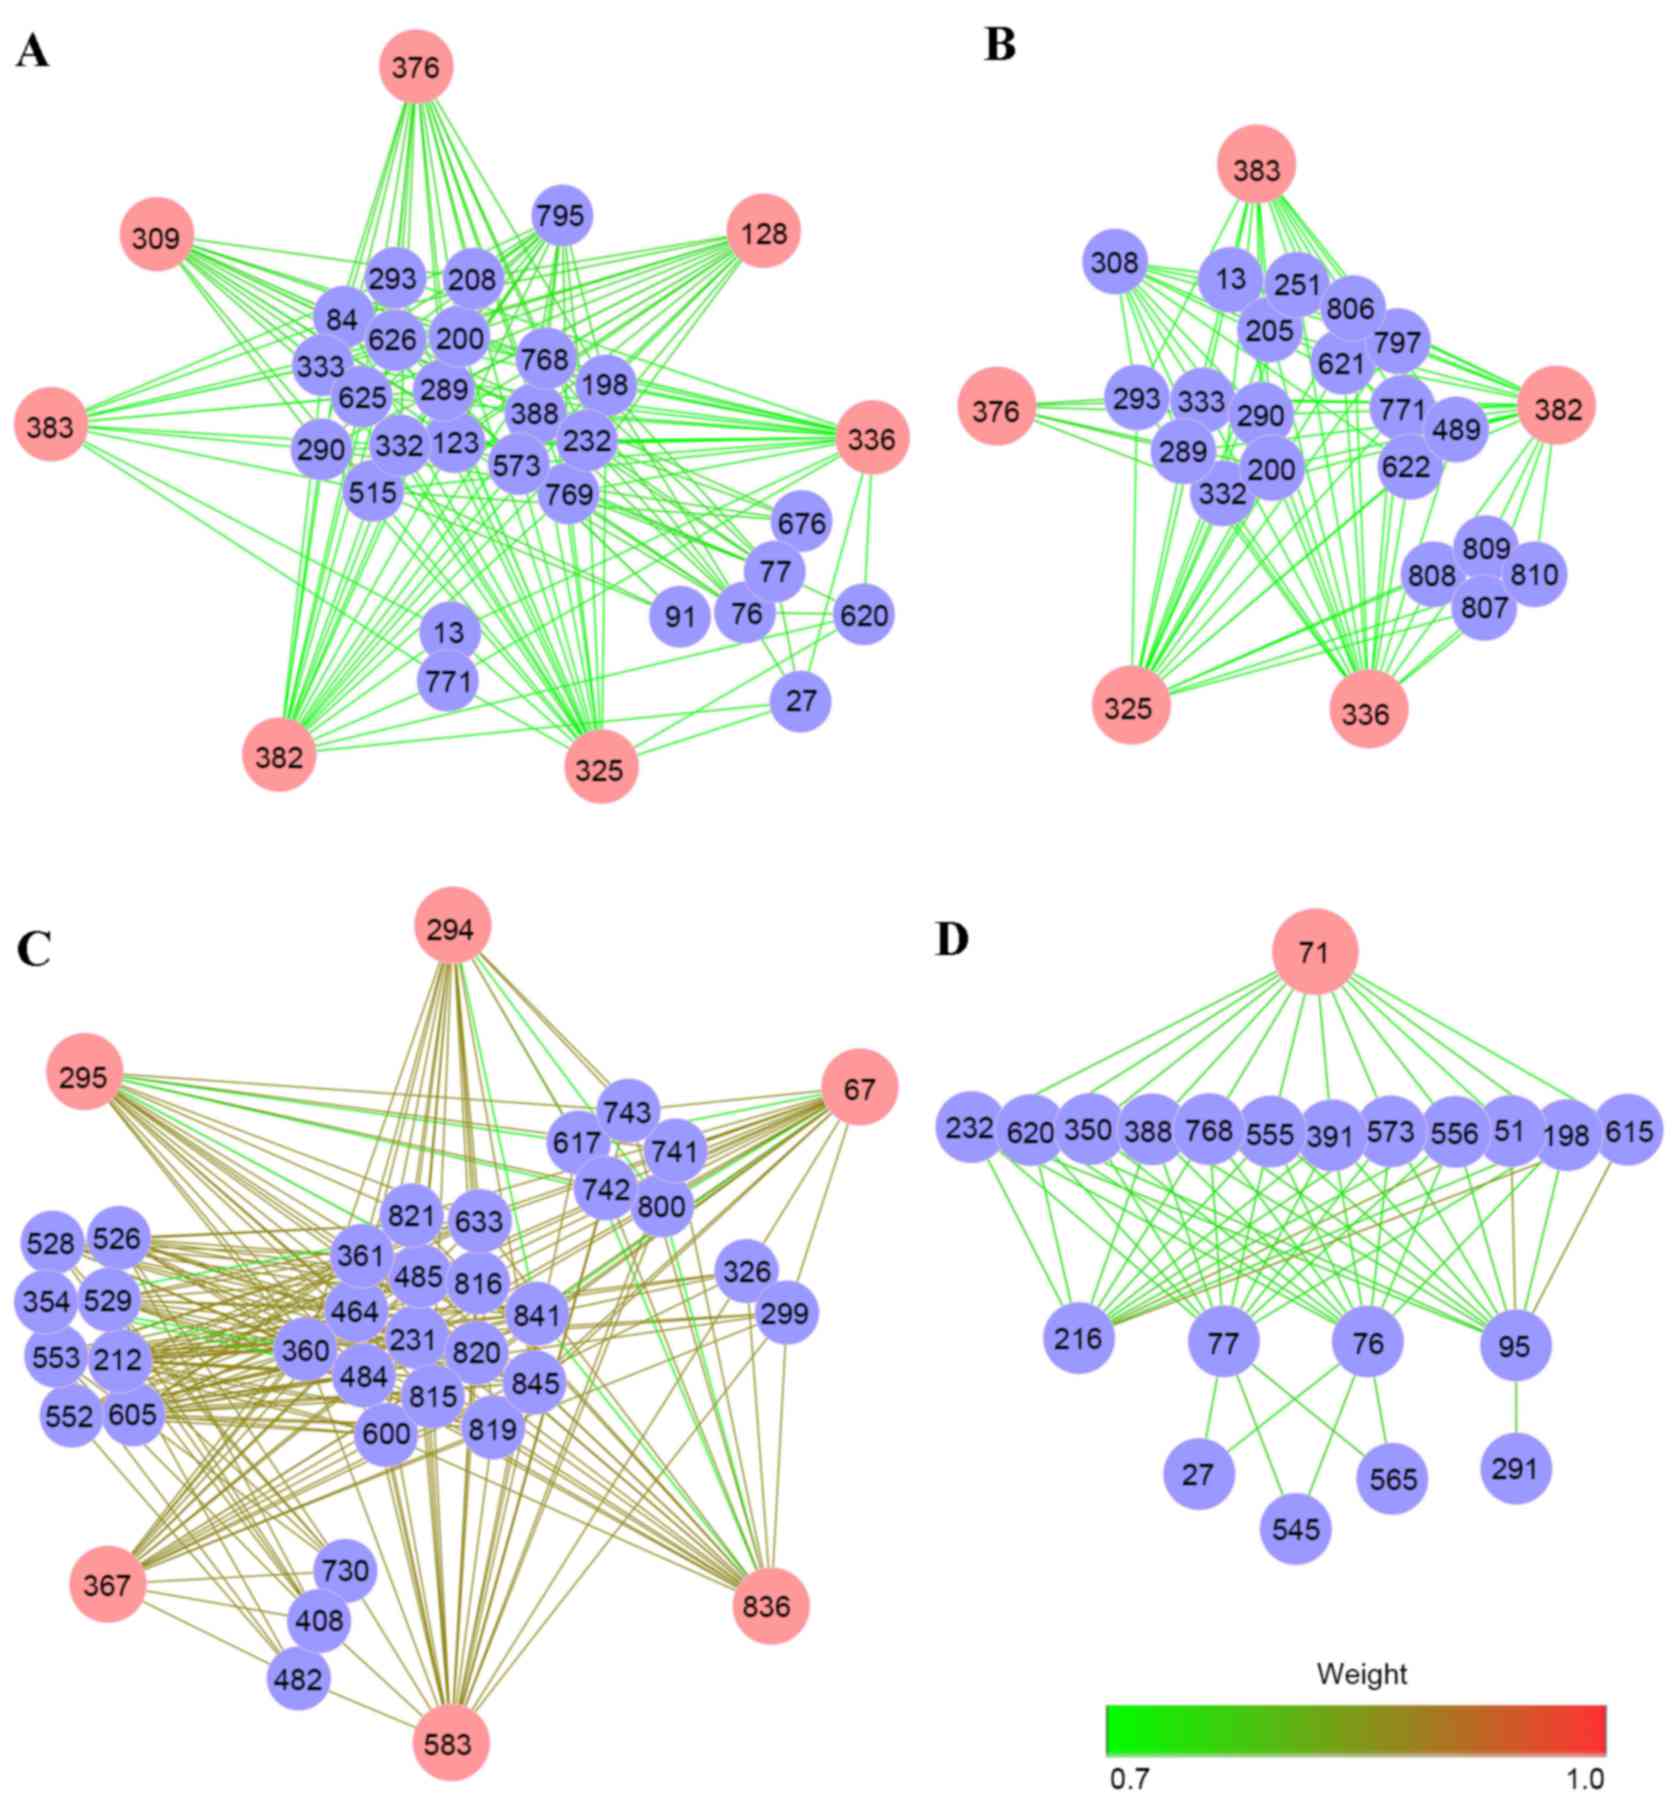
ClusterONE was used to mine modules, which had
similar biological processes and functions from the DPN. A total of
4 modules were identified with thresholds of size ≥20, density ≥0.3
and overlap threshold ≥0.5 (Fig.
3). There were 7, 6, 5 and 1 hub pathways in Module 1, Module
2, Module 3 and Module 4, respectively. The weight values of
pathway interactions and edges in Module 3 were higher compared
with the other modules. In addition, pathways 336 (HS-GAG
degradation), 383 (keratan sulfate/keratin metabolism), 325 (HS-GAG
metabolism) and 376 (iron uptake and transport) participated in
more than one module. For Module 4, only one hub pathway (71,
assembly of the HIV virion) was involved. Based on the ClusterONE
analysis, hub pathways were important for modules, suggesting that
they may have potential roles in the progression of RA.
Discussion
The present study proposed a novel method to
identify hub pathways of RA using DPN, which was composed of
differential pathway interactions based on a background PPI
network, the Reactome pathway database and gene expression
profiles. It was determined that 15 hub pathways, including HS-GAG
degradation, HS-GAG metabolism and keratan sulfate degradation,
were significant pathways involved in RA. Modules of DPN were mined
depending on which ClusterONE and hub pathways they were involved
into validate the feasibility of this novel approach for
identifying hub pathways involved in RA.
Diagnostic or prognostic markers are usually
obtained by identification of the most significant differentially
expressed genes (DEGs) in high-throughput case-control studies of a
disease. However, a previous study determined that the most
significant DEGs obtained from different studies for a particular
disease are frequently inconsistent (20). To overcome this problem,
significant genes and biological processes for disease-association
may be evaluated using a network strategy, such as PPI networks
(21). A network may provide
significant instructions for mining unknown connections in
incomplete networks. Although the data of large-scale protein
interaction has accumulated with the development of high throughput
testing technology, a certain number of significant interactions
are not tested, such as key genes in significant pathways (22). This may be resolved to some extent
by using pathway-associated networks, such as DPN (23). Therefore, the present study
proposed a novel method to construct DPN, which determined
differential pathway interactions across RA patients and normal
controls and identified hub pathways based on DPN. These findings
were validated using ClusterONE modules and determined that the
method was an efficient and feasible approach.
From the 15 hub pathways identified, HS-GAG
degradation, HS-GAG metabolism and keratan sulfate degradation were
significant. HS-GAG is a member of the glycosaminoglycan family and
consists of a variably sulfated repeating disaccharide unit, the
most common one (50% of the total) is glucuronic acid associated
with N-acetylglucosamine (24). In
addition, GAG and HS have a similar molecular structure, and the
polymer chains are composed of repeating disaccharide units of
glucosamine and hexuronic acids are sulfated at various positions
(25). It has been previously
reported that HS-GAG may bind to a core protein and regulate
various biological processes, including angiogenesis, blood
coagulation and tumor metastasis (26). Li et al (27) revealed that heparanase activity was
elevated in the synovial fluid of patients with RA, indicating that
heparanase may be a reliable prognostic factor for RA progression
and a potential target for RA treatment. Taking into account that
heparanase is responsible the degradation of heparin (28) and HS (29), it is possible that degradation of
macromolecular heparin in cells may modulate the release of granule
proteases that are involved in inflammation (30). Increased heparanase activity in
activated inflammatory cells may accelerate the turnover of HS
production and thereby induce alterations in HS structure, such as
over-sulfation, the increased sulfation of HS induced by
upregulated heparanase may facilitate its significant role in
disease (31). A previous study
suggested that degradation of HS-GAG was required to maintain a
natural turnover of GAGs, which accumulate, rather than being
broken down by degradative enzymes in RA (32). Degradation of the HS side chains
represents an important mechanism underlying chronic inflammation
of the arthrosis and associated tumorigenesis (33). Furthermore, heparanase is expressed
by the vascular endothelium at the site of inflammation, which
results in degradation of the subendothelial basement membrane and
subsequent vascular leakage (34).
Therefore, RA, as a common autoimmune disease, may be closely
associated with HS-GAG closely.
Belcher et al (35) demonstrated that GAG concentration
in knee synovial fluid was reduced in RA, and that altered
concentrations of chondroitin sulfate and keratan sulfate were be
detected in RA. Keratan sulfate is one of several sulfated
glycosaminoglycans (structural carbohydrates) that have been
identified, in the cornea, cartilage and bone, and consists of
large, highly hydrated molecules, which acts as a cushion to absorb
mechanical shock in joints (36).
The use of circulating keratan sulfate as a marker of metabolic
changes of cartilage proteoglycan in juvenile idiopathic arthritis
indicated that treatment which modified inflammation simultaneously
did not contribute to total regeneration of articular matrix
components, and signalized the need for further treatment (37). Additionally, keratan sulfate
suppressed cartilage damage and ameliorated inflammation in an
experimental arthritis mouse model (38). Previous studies have not identified
a correlation between keratan sulfate degradation and RA, however,
the present study indicated that keratan sulfate was important for
RA progression.
In conclusion, the proposed method used in the
current study was computationally efficient to identify hub
pathways of RA and 15 hub pathways, including HS-GAG degradation,
HS-GAG metabolism and keratan sulfate degradation were identified.
These pathways may be potential biomarkers for RA and provide
insights for the future study and treatment of RA.
References
|
1
|
Eyre S, Bowes J, Diogo D, Lee A, Barton A,
Martin P, Zhernakova A, Stahl E, Viatte S, McAllister K, et al:
High-density genetic mapping identifies new susceptibility loci for
rheumatoid arthritis. Nat Genet. 44:1336–1340. 2012. View Article : Google Scholar : PubMed/NCBI
|
|
2
|
Schellekens GA, de Jong B, van den Hoogen
F, van de Putte L and van Venrooij WJ: Pillars article: Citrulline
is an essential constituent of antigenic determinants recognized by
rheumatoid arthritis-specific autoantibodies. J Clin Invest.
101:273–281. 1998. View
Article : Google Scholar : PubMed/NCBI
|
|
3
|
McInnes IB and Schett G: The pathogenesis
of rheumatoid arthritis. N Engl J Med. 365:2205–2219. 2011.
View Article : Google Scholar : PubMed/NCBI
|
|
4
|
Stahl EA, Raychaudhuri S, Remmers EF, Xie
G, Eyre S, Thomson BP, Li Y, Kurreeman FA, Zhernakova A, Hinks A,
et al: Genome-wide association study meta-analysis identifies seven
new rheumatoid arthritis risk loci. Nat Genet. 42:508–514. 2010.
View Article : Google Scholar : PubMed/NCBI
|
|
5
|
Zhernakova A, Stahl EA, Trynka G,
Raychaudhuri S, Festen EA, Franke L, Westra HJ, Fehrmann RS,
Kurreeman FA, Thomson B, et al: Meta-analysis of genome-wide
association studies in celiac disease and rheumatoid arthritis
identifies fourteen non-HLA shared loci. PLoS Genet.
7:e10020042011. View Article : Google Scholar : PubMed/NCBI
|
|
6
|
Letter AJ: Classifying rheumatoid
arthritis risk with genetic subgroups using genome-wide
association. Medical College of Georgia. 2010.
|
|
7
|
Glazko GV and Emmert-Streib F: Unite and
conquer: Univariate and multivariate approaches for finding
differentially expressed gene sets. Bioinformatics. 25:2348–2354.
2009. View Article : Google Scholar : PubMed/NCBI
|
|
8
|
Khatri P, Sirota M and Butte AJ: Ten years
of pathway analysis: Current approaches and outstanding challenges.
PLoS Comput Biol. 8:e10023752012. View Article : Google Scholar : PubMed/NCBI
|
|
9
|
Ertel A, Verghese A, Byers SW, Ochs M and
Tozeren A: Pathway-specific differences between tumor cell lines
and normal and tumor tissue cells. Mol Cancer. 5:552006. View Article : Google Scholar : PubMed/NCBI
|
|
10
|
Horvát EÁ, Zhang JD, Uhlmann S, Sahin Ö
and Zweig KA: A network-based method to assess the statistical
significance of mild co-regulation effects. PLoS One. 8:e734132013.
View Article : Google Scholar : PubMed/NCBI
|
|
11
|
Bienkowska J, Allaire N, Thai A, Goyal J,
Plavina T, Nirula A, Weaver M, Newman C, Petri M, Beckman E and
Browning JL: Lymphotoxin-LIGHT pathway regulates the interferon
signature in rheumatoid arthritis. PLoS One. 9:e1125452014.
View Article : Google Scholar : PubMed/NCBI
|
|
12
|
Croft D, O'Kelly G, Wu G, Haw R, Gillespie
M, Matthews L, Caudy M, Garapati P, Gopinath G, Jassal B, et al:
Reactome: A database of reactions, pathways and biological
processes. Nucleic Acids Res. 39:(Database issue). D691–D697. 2011.
View Article : Google Scholar : PubMed/NCBI
|
|
13
|
Ahn T, Lee E, Huh N and Park T:
Personalized identification of altered pathways in cancer using
accumulated normal tissue data. Bioinformatics. 30:i422–i429. 2014.
View Article : Google Scholar : PubMed/NCBI
|
|
14
|
Myers L and Sirois MJ: Spearman
correlation coefficients, differences between. Wiley StatsRef:
Statistics Reference Online. 2006.
|
|
15
|
Smoot ME, Ono K, Ruscheinski J, Wang PL
and Ideker T: Cytoscape 2.8: New features for data integration and
network visualization. Bioinformatics. 27:431–432. 2011. View Article : Google Scholar : PubMed/NCBI
|
|
16
|
Haythornthwaite C: Social network
analysis: An approach and technique for the study of information
exchange. Libr Inf Sci Res. 18:323–342. 1996. View Article : Google Scholar
|
|
17
|
Srihari S and Leong HW: A survey of
computational methods for protein complex prediction from protein
interaction networks. J Bioinform Comput Biol. 11:12300022013.
View Article : Google Scholar : PubMed/NCBI
|
|
18
|
Nepusz T, Yu H and Paccanaro A: Detecting
overlapping protein complexes in protein-protein interaction
networks. Nat Methods. 9:471–472. 2012. View Article : Google Scholar : PubMed/NCBI
|
|
19
|
Mukhopadhyay A, Ray S and De M: Detecting
protein complexes in a PPI network: A gene ontology based
multi-objective evolutionary approach. Mol Biosyst. 8:3036–3048.
2012. View Article : Google Scholar : PubMed/NCBI
|
|
20
|
Ein-Dor L, Kela I, Getz G, Givol D and
Domany E: Outcome signature genes in breast cancer: Is there a
unique set? Bioinformatics. 21:171–178. 2005. View Article : Google Scholar : PubMed/NCBI
|
|
21
|
Zhang L, Li S, Hao C, Hong G, Zou J, Zhang
Y, Li P and Guo Z: Extracting a few functionally reproducible
biomarkers to build robust subnetwork-based classifiers for the
diagnosis of cancer. Gene. 526:232–238. 2013. View Article : Google Scholar : PubMed/NCBI
|
|
22
|
Nibbe RK, Chowdhury SA, Koyutürk M, Ewing
R and Chance MR: Protein-protein interaction networks and
subnetworks in the biology of disease. Wiley Interdiscip Rev Syst
Biol Med. 3:357–367. 2011. View
Article : Google Scholar : PubMed/NCBI
|
|
23
|
Wu Y, Jing R, Jiang L, Jiang Y, Kuang Q,
Ye L, Yang L, Li Y and Li M: Combination use of protein-protein
interaction network topological features improves the predictive
scores of deleterious non-synonymous single-nucleotide
polymorphisms. Amino Acids. 46:2025–2035. 2014. View Article : Google Scholar : PubMed/NCBI
|
|
24
|
Li P, Sheng J, Liu Y, Li J, Liu J and Wang
F: Heparosan-derived heparan sulfate/heparin-like compounds: One
kind of potential therapeutic agents. Med Res Rev. 33:665–692.
2013. View Article : Google Scholar : PubMed/NCBI
|
|
25
|
Dagälv A, Holmborn K, Kjellén L and Åbrink
M: Lowered expression of heparan sulfate/heparin biosynthesis
enzyme N-deacetylase/N-sulfotransferase 1 results in increased
sulfation of mast cell heparin. J Biol Chem. 286:44433–44440. 2011.
View Article : Google Scholar : PubMed/NCBI
|
|
26
|
Tumova S, Woods A and Couchman JR: Heparan
sulfate proteoglycans on the cell surface: Versatile coordinators
of cellular functions. Int J Biochem Cell Biol. 32:269–288. 2000.
View Article : Google Scholar : PubMed/NCBI
|
|
27
|
Li RW, Freeman C, Yu D, Hindmarsh EJ,
Tymms KE, Parish CR and Smith PN: Dramatic regulation of heparanase
activity and angiogenesis gene expression in synovium from patients
with rheumatoid arthritis. Arthritis Rheum. 58:1590–1600. 2008.
View Article : Google Scholar : PubMed/NCBI
|
|
28
|
Gong F, Jemth P, Galvis ML Escobar,
Vlodavsky I, Horner A, Lindahl U and Li JP: Processing of
macromolecular heparin by heparanase. J Biol Chem. 278:35152–35158.
2003. View Article : Google Scholar : PubMed/NCBI
|
|
29
|
Pikas DS, Li JP, Vlodavsky I and Lindahl
U: Substrate specificity of heparanases from human hepatoma and
platelets. J Biol Chem. 273:18770–18777. 1998. View Article : Google Scholar : PubMed/NCBI
|
|
30
|
Shin K, Nigrovic PA, Crish J, Boilard E,
McNeil HP, Larabee KS, Adachi R, Gurish MF, Gobezie R, Stevens RL
and Lee DM: Mast cells contribute to autoimmune inflammatory
arthritis via their tryptase/heparin complexes. J Immunol.
182:647–656. 2009. View Article : Google Scholar : PubMed/NCBI
|
|
31
|
Galvis ML Escobar, Jia J, Zhang X,
Jastrebova N, Spillmann D, Gottfridsson E, van Kuppevelt TH,
Zcharia E, Vlodavsky I, Lindahl U and Li J: Transgenic or
tumor-induced expression of heparanase upregulates sulfation of
heparan sulfate. Nat Chem Biol. 3:773–778. 2007. View Article : Google Scholar : PubMed/NCBI
|
|
32
|
Ballabio A and Gieselmann V: Lysosomal
disorders: From storage to cellular damage. Biochim Biophys Acta.
1793:684–696. 2009. View Article : Google Scholar : PubMed/NCBI
|
|
33
|
Li JP and Vlodavsky I: Heparin, heparan
sulfate and heparanase in inflammatory reactions. Thromb Haemost.
102:823–828. 2009.PubMed/NCBI
|
|
34
|
Edovitsky E, Lerner I, Zcharia E, Peretz
T, Vlodavsky I and Elkin M: Role of endothelial heparanase in
delayed-type hypersensitivity. Blood. 107:3609–3616. 2006.
View Article : Google Scholar : PubMed/NCBI
|
|
35
|
Belcher C, Yaqub R, Fawthrop F, Bayliss M
and Doherty M: Synovial fluid chondroitin and keratan sulphate
epitopes, glycosaminoglycans, and hyaluronan in arthritic and
normal knees. Ann Rheum Dis. 56:299–307. 1997. View Article : Google Scholar : PubMed/NCBI
|
|
36
|
Funderburgh JL: Keratan sulfate:
Structure, biosynthesis, and function. Glycobiology. 10:951–958.
2000. View Article : Google Scholar : PubMed/NCBI
|
|
37
|
Winsz-Szczotka K, Komosińska-Vassev K,
Kuźnik-Trocha K, Siwiec A, Żegleń B and Olczyk K: Circulating
keratan sulfate as a marker of metabolic changes of cartilage
proteoglycan in juvenile idiopathic arthritis; influence of growth
factors as well as proteolytic and prooxidative agents on aggrecan
alterations. Clin Chem Lab Med. 53:291–297. 2015. View Article : Google Scholar : PubMed/NCBI
|
|
38
|
Hayashi M, Kadomatsu K and Ishiguro N:
Keratan sulfate suppresses cartilage damage and ameliorates
inflammation in an experimental mice arthritis model. Biochem
Biophys Res Commun. 401:463–468. 2010. View Article : Google Scholar : PubMed/NCBI
|