Introduction
Coronin 3, a short protein of 474 aa, is the most
widely expressed coronin protein in mammals and localizes to
lamellipodia (1–4). It has been reported that coronin 3
may interact with actin-related protein 2/3 (Arp2/3) and negatively
regulate actin polymerization (5).
In addition, coronin 3 may negatively regulate cell motility by
regulating cell-matrix adhesion via focal adhesion kinase (6).
Human coronin 3 is involved in many types of
cancers, including diffuse gliomas (7), lung cancer (8), gastric cancer (9) and hepatocellular carcinoma (HCC)
(10). It has been reported that
the expression level of coronin 3 in the HCCLM97H HCC cell line
(high metastasis capacity) was significantly increased compared
with in the MHCC97L cell line (low metastasis capacity) (11); and the increased expression of
coronin 3 was strongly associated with tumor spontaneous pulmonary
metastasis in a nude mouse model of HCC. Furthermore, coronin 3
enhances cell motility and proliferation; knockdown of coronin 3 in
BEL-7402 cells reduces the stress fiber network, decreases
lamellipodial extension and attenuates the malignant potential of
BEl-7402 cells in mice (10). In
clinical HCC tissues, coronin 3 was significant differently
expressed among HCC specimens of different clinical stages;
compared with early stage (Barcelona Clinic Liver Cancer I and II)
tumor tissues, the later stage (Barcelona Clinic Liver Cancer III
and IV) tumor tissues had significantly stronger staining of
coronin 3 (28.6 and 46.7%, respectively) (11).
It has been reported that coronin 3 could enhance
activation of Ras-related C3 botulinum toxin substrate 1 precursor
(Rac-1), a Rho family small GTPase (10,12),
but little is known about the molecular mechanisms or proteins that
are regulated by coronin 3. Therefore, the present study aimed to
analyze the expression levels of coronin 3 in HCC clinical tissue
samples by reverse transcription-quantitative polymerase chain
reaction and immunohistochemical staining, and further analyze the
proteins regulated by coronin 3 using mass spectrometry in HCC cell
lines where coronin 3 was stably overexpressed or knocked down.
Materials and methods
Ethics statement
The use of human biopsies in the present study was
ethically approved by the Institution Review Board of Mengchao
Hepatobiliary Hospital of Fujian Medical University (Fuzhou,
China). Written consent was received from all participants at the
time of surgery.
Clinical samples
A total of 20 fresh-frozen primary HCC tissues and
their corresponding adjacent non-tumorous samples (basic
information is presented in Table
I) and 98 pairs of paraffin-embedded primary HCC tissues were
collected during surgical resection at Mengchao Hepatobiliary
Hospital of Fujian Medical University, and stored in the tissue
bank for further usage.
 | Table I.Basic information of 20 hepatocellular
carcinoma patients. |
Table I.
Basic information of 20 hepatocellular
carcinoma patients.
| Number | Age | Sex | Tumor diameter
(cm) | Tumor number | HBV-DNA (copy
number) | Cirrhosis grade | Tumor capsule | Blood tumor
thrombosis |
|---|
| 1 | 33 | Male | 4 | 1 | 1,110 | Low | Non | Yes |
| 2 | 49 | Male | 11 | 1 | 323,000 | Low | Integrate | Yse |
| 3 | 34 | Male | 7 | 1 | 151,000 | Sever | Non | Yes |
| 4 | 37 | Male | 4 | 1 | 1280,000 | Low | Integrate | Yes |
| 5 | 66 | Male | 11 | 1 | <1,000 | Non | Integrate | Yes |
| 6 | 33 | Male | 14 | 1 | 3,290 | Low | Non | Yse |
| 7 | 47 | Male | 16 | 1 | 40,000 | Low | Non | Yes |
| 8 | 37 | Male | 10 | 1 | 2,800 | Non | Ruptured | Yes |
| 9 | 46 | Male | 15 | 1 | 8,320 | Non | Non | Yes |
| 10 | 61 | Male | 10.5 | 1 | 18,100 | Low | Integrate | No |
| 11 | 61 | Male | 15 | 1 | 5,900 | Non | Integrate | Yes |
| 12 | 46 | Male | 12 | 1 | 311,000 | Middle | Integrate | Yse |
| 13 | 65 | Male | 11 | 1 | <1,000 | Non | Integrate | No |
| 14 | 62 | Male | 6 | 4 | 582,000 | Middle | Integrate | Yes |
| 15 | 44 | Female | 12 | 1 | 6,490 | Middle | Integrate | Yes |
| 16 | 54 | Male | 5 | 1 | 7,990 | Meddle | Integrate | Yes |
| 17 | 49 | Female | 8.5 | 1 | 1,070 | Non | Integrate | No |
| 18 | 60 | Female | 3.5 | 1 | 3,980 | Non | Non | No |
| 19 | 45 | Male | 11 | 1 | 8,260 | Middle | Integrate | No |
| 20 | 54 | Male | 15 | 1 | <1,000 | Non | Non | No |
RNA extraction
Trizol reagent (Invitrogen; Thermo Fisher
Scientific, Inc., Waltham, MA, USA) was used to extract total RNA
from clinical samples and cell lines according to the manufacture's
protocol. The spectrophotometer (Nano Drop ND-2000, Thermo Fisher
Scientific Inc.) was used to measure the concentration and purity
of RNAs through the optical density of 260/280 readings. RNA
integrity was determined by 1% formaldehyde denaturing gel
electrophoresis.
RT-qPCR analysis
RNA (1 µg) was reverse transcribed using a GoScript™
Reverse Transcription System kit (Promega Corporation, Madison, WI,
USA) in accordance with the manufacturer's protocol. The expression
levels of coronin 3 and associated genes were analyzed using
RT-qPCR with a Go Taq® qPCR Master Mix kit (Promega
Corporation) in accordance with manufacturer's protocol, using the
primers listed in Table II. The
reaction system (20 µl) was as follows: qPCR Master mix (2X), 10
µl; forward primer (10 nM), 0.2 µl; reverse primer (10 nM), 0.2 µl;
cDNA, 50 ng; finally supplemented with water to 20 µl. qPCR was
performed on StepOne Plus PCR system (Applied Biosystems; Thermo
Fisher Scientific, Inc.) with the following parameters:
Pre-denaturing at 95°C for 2 min; cycling at 95°C for 15 sec; 60°C
for 20 sec; 72°C for 20 sec (collect the signature at this step),
for a total of 40 cycles; followed by the melt curve stage: 95°C
for 15 sec, 60°C for 1 min and 90°C for 30 sec, with a reading
signature of per 0.3°C from 60 to 90°C). β-actin served as an
internal control and the 2−∆∆Cq method (13) was used to calculate the expression
levels of genes.
| Table II.Primer sequences used for reverse
transcription-quantitative polymerase chain reaction. |
Table II.
Primer sequences used for reverse
transcription-quantitative polymerase chain reaction.
| Gene | Sequence | Tm (°C) |
|---|
| β-actin | F:
ATAGCACAGCCTGGATAGCAACGTAC | 60 |
|
| R:
CACCTTCTACAATGAGCTGCGTGTG |
|
| Coronin 3 | F:
CTGCACAGCTTCCAAAGACAAGA | 60 |
|
| R:
GGCTGAACCCAGTGGTGAAGA |
|
| G6PC3 | F:
TCTTCAAGTGGTTTCTTTTTGGAG | 60 |
|
| R:
GCTAGGCATCACCCTTACCC |
|
Cell culture, plasmid construction,
transient transfection and establishment of stable overexpression
and knockdown of coronin 3 in HepG2 cell lines
The HepG2 human HCC cell line was obtained from The
Cell Bank of Chinese Academy of Sciences (Shanghai, China). The
cells were cultured in minimum essential medium (MEM) supplemented
with 10% fetal bovine serum (FBS) at 37°C in 5% CO2. For
the establishment of coronin 3 stably over-expressing cells, the
coding sequence of coronin 3 was cloned into a pLVX-AcGFPI-N1
plasmid. Then the plasmid was co-transfected into 293T cells with
three lentiviral packaging plasmids, pLP1, pLP2 and pLP VSV-G. For
the establishment of knockdown cells, small hairpin RNAs (shRNAs)
were used to specifically reduce coronin 3 expression in HepG2
cells as follows: The shRNA oligo 5′-CGTCCACTACCTCAACACATT-3′ was
cloned into pGreenPuro (System Biosciences, Inc., Palo Alto, CA,
USA); the shRNA plasmid was subsequently co-transfected into 293T
cells with lentiviral packaging plasmids, and the resulting
lentiviruses were collected and used to infect the target HepG2
cells. The HepG2 cells were spread in a T75 flask 24 h after
infection for a subsequent 1-week incubation in MEM supplemented
with 2 µg/ml puromycin. Cells infected with the empty vectors were
used as control transfectants. Stable overexpression and stable
knockdown of coronin 3 were confirmed by RT-qPCR and western blot
analysis.
Immunohistochemical staining
assay
Primary HCC tissues and their corresponding adjacent
non-tumorous samples were fixed with 4% paraformaldehyde, embedded
in paraffin and sectioned. The sections were dried at 60°C for 2 h
and then de-waxed and rehydrated. Antigens were retrieved by
microwave in EDTA (1 mM). Subsequently, the sections were stained
with a mouse anti-coronin 3 antibody (catalog no. sc-376919, 1:100,
Santa Cruz Biotechnology, Inc., Dallas, TX, USA) at 4°C overnight,
then incubated with a secondary antibody (catalog no. HS201-01,
Beijing Transgen Biotech Co., Ltd., Beijing, China) for 2 h at room
temperature. The sections were finally visualized using a DAB
substrate chromogen system (Dako; Agilent Technologies, Inc., Santa
Clara, CA, USA) according to the manufacturer's protocol.
Western blot analysis
Cells were washed in pre-cold PBS at 4°C and lysed
in radioiummunoprecipitation buffer (20 mM Tris, pH 7.4, 150 mM
NaCl, 1% Triton X-100, 1% Na deoxycholate, 2 mM EGTA, 2 mM EDTA,
0.1% SDS) containing protease inhibitor cocktail (Thermo Fisher
Scientific, Inc.) and phosphatase inhibitor cocktails
(Sigma-Aldrich; Merck KGaA, Darmstadt, Germany). Lysates were
centrifuged at 17,000 × g for 30 min at 4°C. Protein concentration
was determined using a Bicinchoninic Acid protein quantification
assay. Proteins (50 µg) were separated by 10% SDS-PAGE and blocked
with 5% bovine serum albumin (catalog no. A7906-1KG, Sigma-Aldrich)
in TBST (20 mM Tris-HCl, 500 mM NaCl (pH 7.5) and 0.1% Tween 20) at
room temperature for 2 h, and then incubated with mouse
anti-coronin 3 (catalog no. sc-376919, Santa Cruz Biotechnology,
Inc., 1:500) and anti-β-actin (catalog no. 04693132001, 1:1,000,
Transgene, Beijing, China) primary antibodies at 4°C overnight.
Subsequently, membranes were incubated with corresponding secondary
antibodies (catalog no. HS201-01, Beijing Transgen Biotech Co.,
Ltd.) at room temperature for 2 h. Finally, the results were
visualized by enhanced chemiluminescence.
Label-free mass spectrometry (MS)
The MS experiment was performed as previously
described (14) with some
modifications. Briefly, a total of 500 ng proteins from the whole
cell lysate of cells stably overexpressing and stably silencing
coronin 3 were digested with 10 U/100 ng trypsin. Following this,
the peptide mixture was dried and re-dissolved in solution A (5%
acetonitrile and 0.1% formic acid in water, pH 10.0), and then
fractionated by high pH separation using an Agilent 1260 Infinity
system (Agilent Technologies, Inc., Santa Clara, CA, USA) equipped
with a reverse phase column (Durashell C18, 5 µm, 4.6×250 mm,
Tianjin Bonna-Agela Technologies, Co., Ltd., Tianjin, China). High
pH separation was performed using a linear gradient starting from
20% B to 80% B in 90 min [solution B: 0.1% formic acid in 90%
acetonitrile (can), pH 10.0] with a column flow rate at 700 µl/min
and the column temperature at 45°C. Finally, 40 fractions were
collected. To reduce the fraction numbers, two fractions with the
same time interval were pooled together, such as 1 and 21, 2 and
22, and so on (14), and 20
fractions at the end were dried in a vacuum concentrator and stored
at −80°C for further usage.
The fractions were re-suspended with 80 µl solution
C (0.1% formic acid in water), and separated by a Nano-LC1000
system (Waters Corporation, Milford, MA, USA) connected to a
quadrupole-Orbitrap mass spectrometer (Q-Exactive Plus; Thermo
Fisher Scientific, Inc.) equipped with an online nano-electrospray
ion source nano-LC and analyzed by online electrospray tandem mass
spectrometry. The experiment parameters were set as follows: 2 µl
peptide sample was loaded onto the trap column (Thermo Scientific
Acclaim PepMap C18, 100 µmx2 cm) with a flow rate at 10 µl/min, and
subsequently separated on an analytical column (Acclaim PepMap C18,
75 µmx15 cm) with a linear gradient, from 3% D to 35% D in 60 min
(solution D: 0.1% formic acid in ACN) with flow rate at 300 nl/min
and the column temperature at 40°C and an electrospray voltage of
2.8 kV. Survey full-scan MS spectra (m/z 300–1500) was acquired
with a mass resolution of 70 K, followed by 10 sequential high
energies collisional dissociation MS/MS scans with a resolution of
17.5 K. In all cases, one microscan was recorded using a dynamic
exclusion of 30 sec.
Mass spectrometry data analysis
Label-free MS experiments were repeated 3 times
(with 3 biological repeats), and the raw MS data was analyzed by
MaxQuant V4.2 (http://www.maxquant.org) using the decoy UniProt-human
database (Version April 2014, 20264 entries) supplemented with 262
frequently observed contaminants with forward and reverse
sequences. Precursor mass and fragment mass were identified with an
initial mass tolerance of 6 and 20 ppm in the main Andromeda
search, respectively. The search included variable modifications of
N-terminal acetylation, methionine oxidation and fixed modification
of carbamidomethyl cysteine with 7aa as minimal peptide length and
a maximum of two mis-cleavages and a false discovery rate of 0.01.
The identified peptides shared by two proteins or more were
combined and reported as one protein group, and the peptides that
matched the reverse database were filtered out.
The fold change of proteins was calculated through
comparing the relative protein expression of coronin 3
over-expressing/knockdown cells with their corresponding control
cells, and the mean average fold change was calculated from 3
replicates. The differentially expressed proteins were selected
using the following criteria for average fold-change of protein
expression levels compared with control cells: >2, upregulation;
<0.5, downregulation.
Gene ontology and pathway
analysis
The Molecular Annotation system (CB-MAS) V3.0
(http://bioinfo.capitalbio.com/mas3/)
was used to perform protein ontology and pathway analysis. An
‘input list’ containing 249 proteins was introduced into MAS
version 3.0 and the analysis was performed with default parameters
(selecting all pathways in Kyoto Encyclopedia of Genes and Genomes
(KEGG) pathway database and perform KEGG analysis.
Ingenuity® pathway analysis
(IPA) network analysis
To identify the potential associations among the
differentially expressed proteins, identified proteins were
subjected to IPA (Qiagen GmbH, Hilden, Germany; http://www.ingenuity.com). Accession numbers of
differentially expressed proteins (with NCBI identities) and
P-values obtained from Student's t-test were entered into Microsoft
Excel and then imported into IPA to identify the relationships
among proteins. The Ingenuity Knowledge Base was used to perform
the construction of canonical pathways and interaction networks.
Based on the hypergeometric distribution, the network score was
calculated and tested using the right-tailed Fisher's exact test.
The higher the score, the more relevant the eligible submitted
proteins were in relation to the network.
Rac-1 activity analysis
Rac-1 activity was tested using ‘Active Rac1
Pull-Down and Detection kit’ (catalog no. 16118, Pierce; Thermo
Fisher Scientific, Inc.). Briefly, the HepG2 cells were cultured in
75 cm2 flask to 80–90% confluency, and subsequently the
culture medium was removed and the cells were rinsed once with
ice-cold TBS, and 1 ml lysis/binding/wash buffer (25 mM Tris-HCl at
pH 7.2, 150 mM NaCl, 5 mM MgCl2, 1% NP-40 and 5%
glycerol) was further added. Cells were scraped and transferred
into a 1.5 ml tube and incubated on ice for 5 min. Cells were
centrifuged at at 16,000 × g at 4°C for 15 min, and the supernatant
was transferred into a new tube. Afterwards, 100 µl 50% resin
slurry (contained in the Active Rac1 Pull-Down and Detection kit)
was added to the spin cup and then centrifuged at 6,000 × g for 30
sec and washed once with 400 µl lysis/binding/wash buffer;
subsequently, 20 µg GST-human Pak1-PBD (contained in the Active
Rac1 Pull-Down and Detection kit) was added to the spin cup
containing the resin. A total of 700 µl cell lysate (containing at
list 500 µg total proteins) was immediately transferred into the
spin cup, and the sample was vortexed and incubated at 4°C for 1 h
with gentle rocking. The sample was centrifuged at 6,000 × g for 30
sec and washed with 400 µl lysis/binding/wash buffer three times.
Finally, 50 µl of 2X reducing buffer (125 mM Tris-HCl at pH 6.8, 2%
glycerol, 4% SDS (w/v) and 0.05% bromophenol blue) was added to the
resin sample and incubated at room temperature for 2 min, then
centrifuged at 6,000 × g for 2 min. The eluted samples were heated
for 5 min at 100°C and the samples were detected by western
blotting using 12% SDS-PAGE gels and an anti-Rac1 antibody
(contained in the Active Rac1 Pull-Down and Detection kit).
Statistical analysis
All data are presented as the mean ± standard
deviation. Student's t-test was used for data analysis with using
SPSS version 15 software (SPSS, Inc., Chicago, IL, USA). P<0.05
was considered to indicate a statistically significant
difference.
Results
Coronin 3 is overexpressed in HCC
tumor tissues
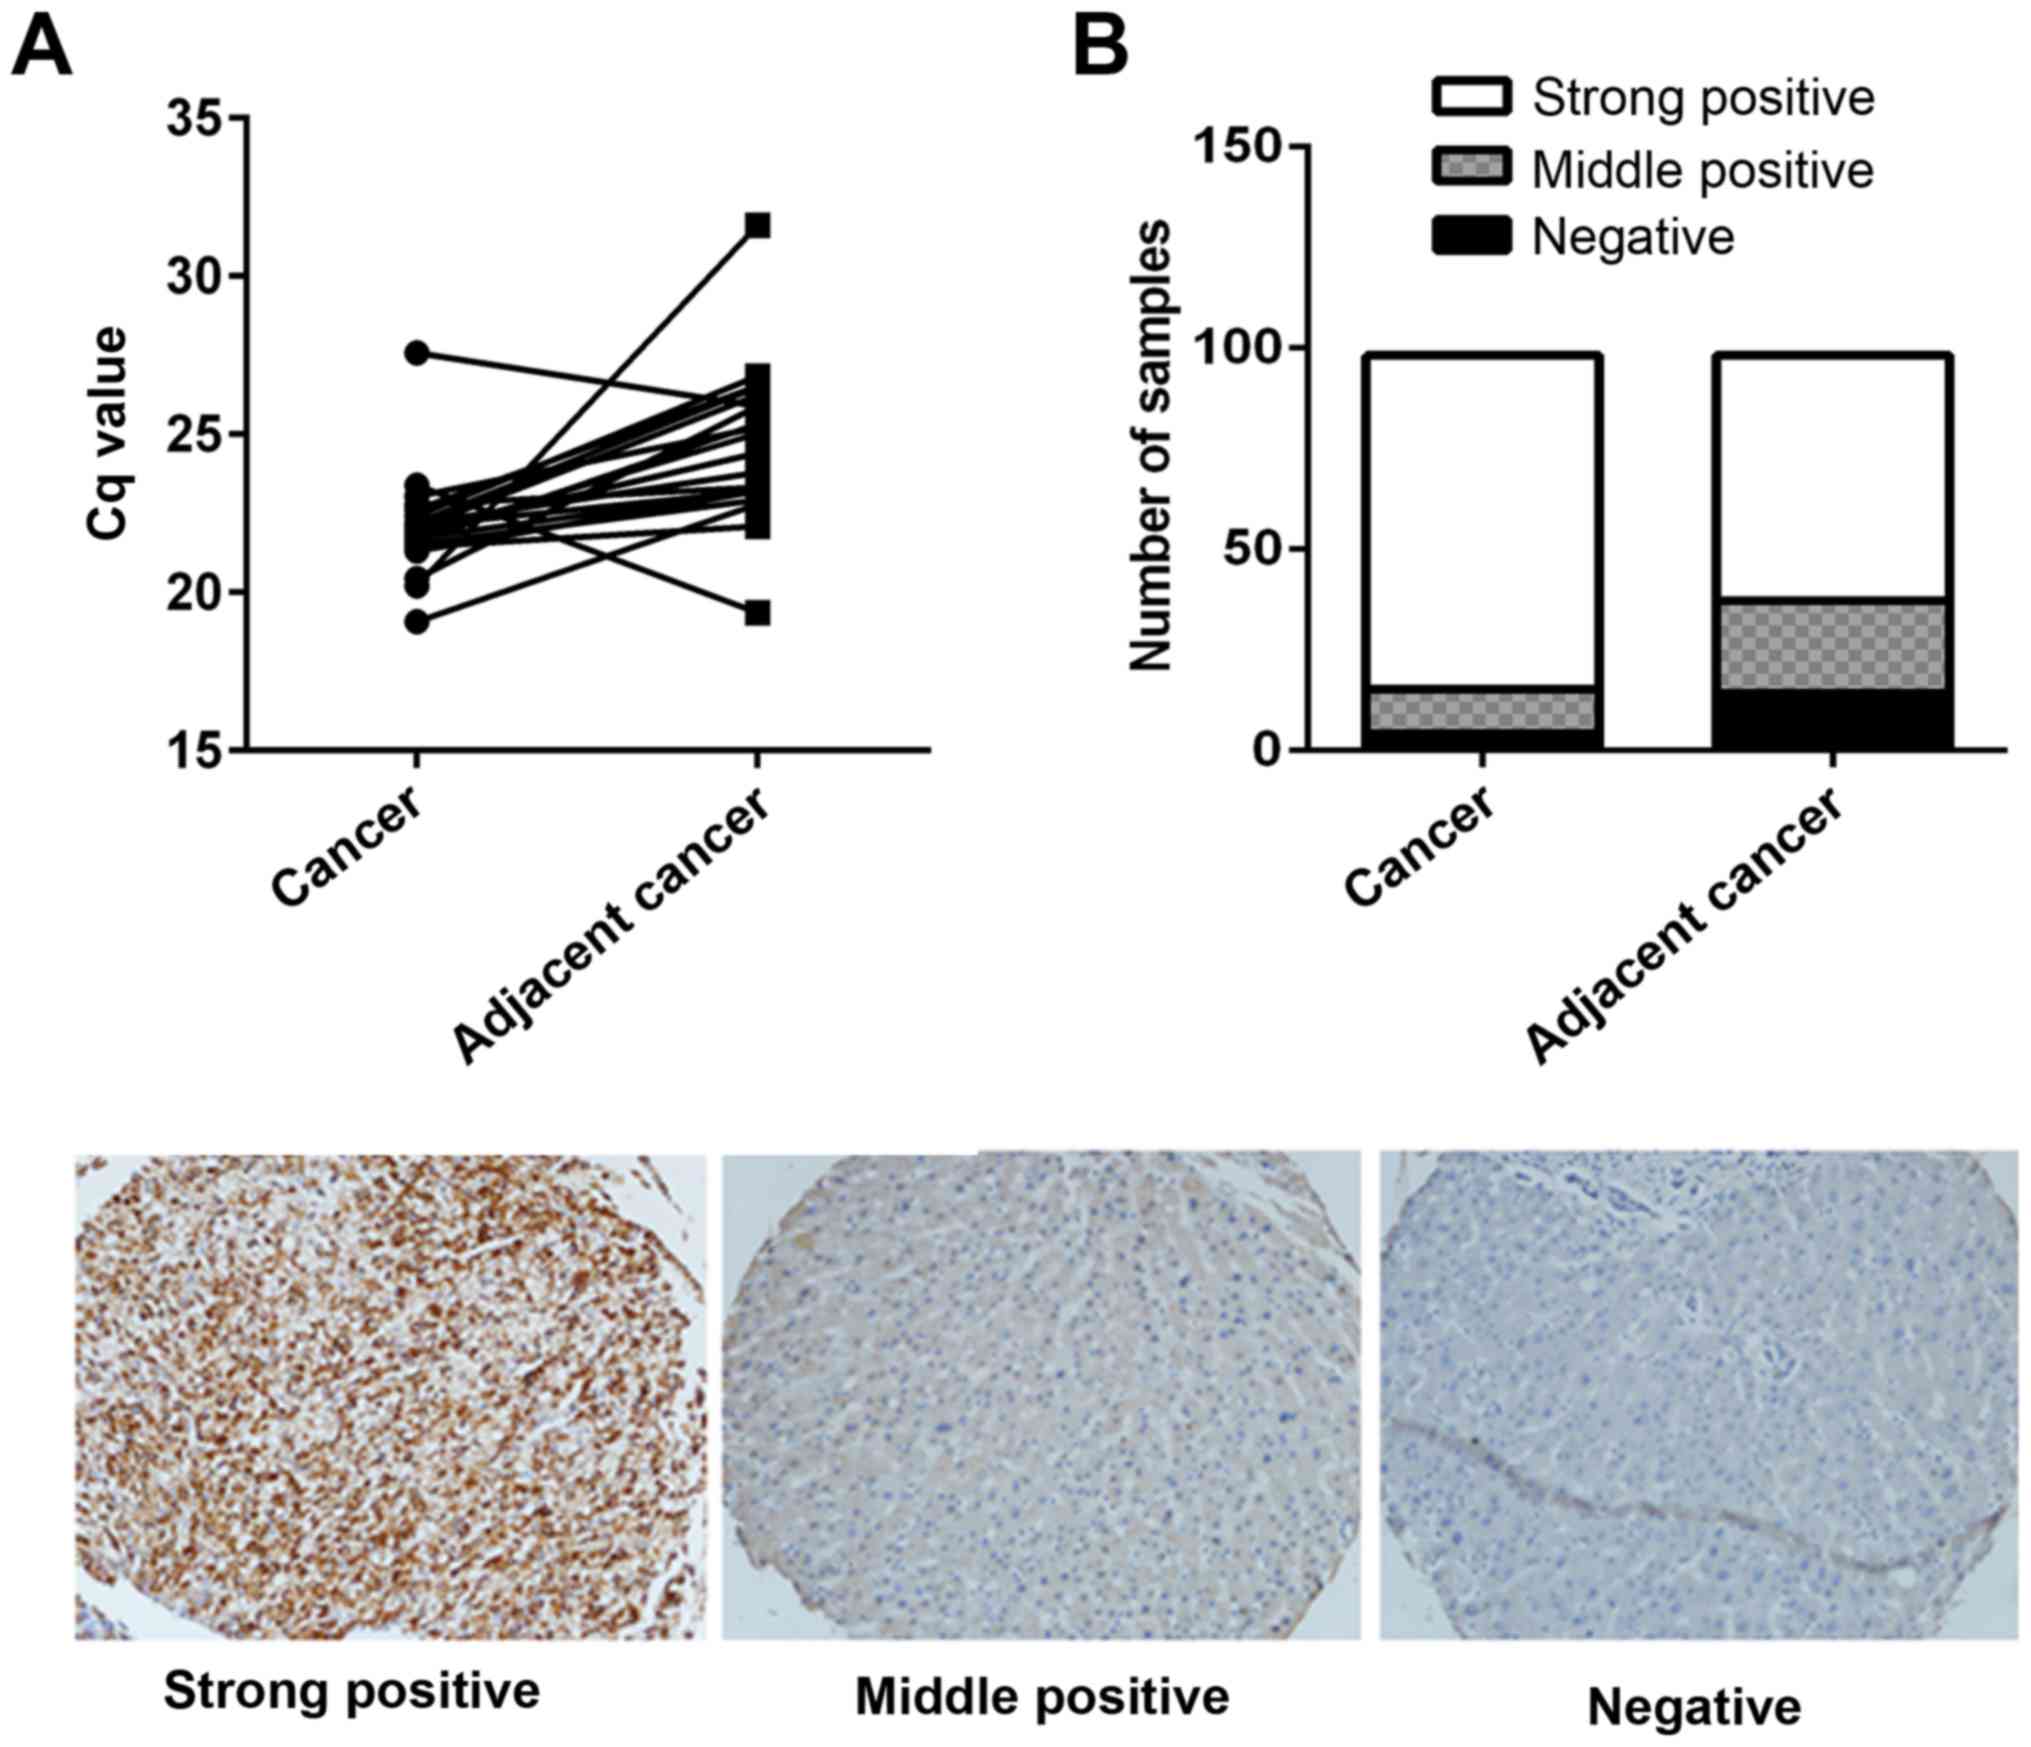
To analyze the expression levels of coronin 3 in
clinical tissue samples, qPCR and immunohistochemical staining
assays were performed. The expression levels of coronin 3 in
primary HCC tissues and their corresponding adjacent non-tumorous
tissues were analyzed from 20 patients. As presented in Fig. 1A, the mRNA expression levels of
coronin 3 were significantly increased in HCC tumor tissues
compared with adjacent non-tumorous tissues. Furthermore, 98
paraffin embedded samples were immunohistochemically stained using
a coronin 3 antibody; the results revealed that coronin 3 had
significant stronger staining in HCC tumorous tissues, with a
strong positive staining rate of 84.69%, compared with a strong
positive staining rate of 62.22% in adjacent non-tumorous tissues
(Fig. 1B).
Coronin 3-regulated proteins are
enriched in metabolism, and cellular and physiological
processes
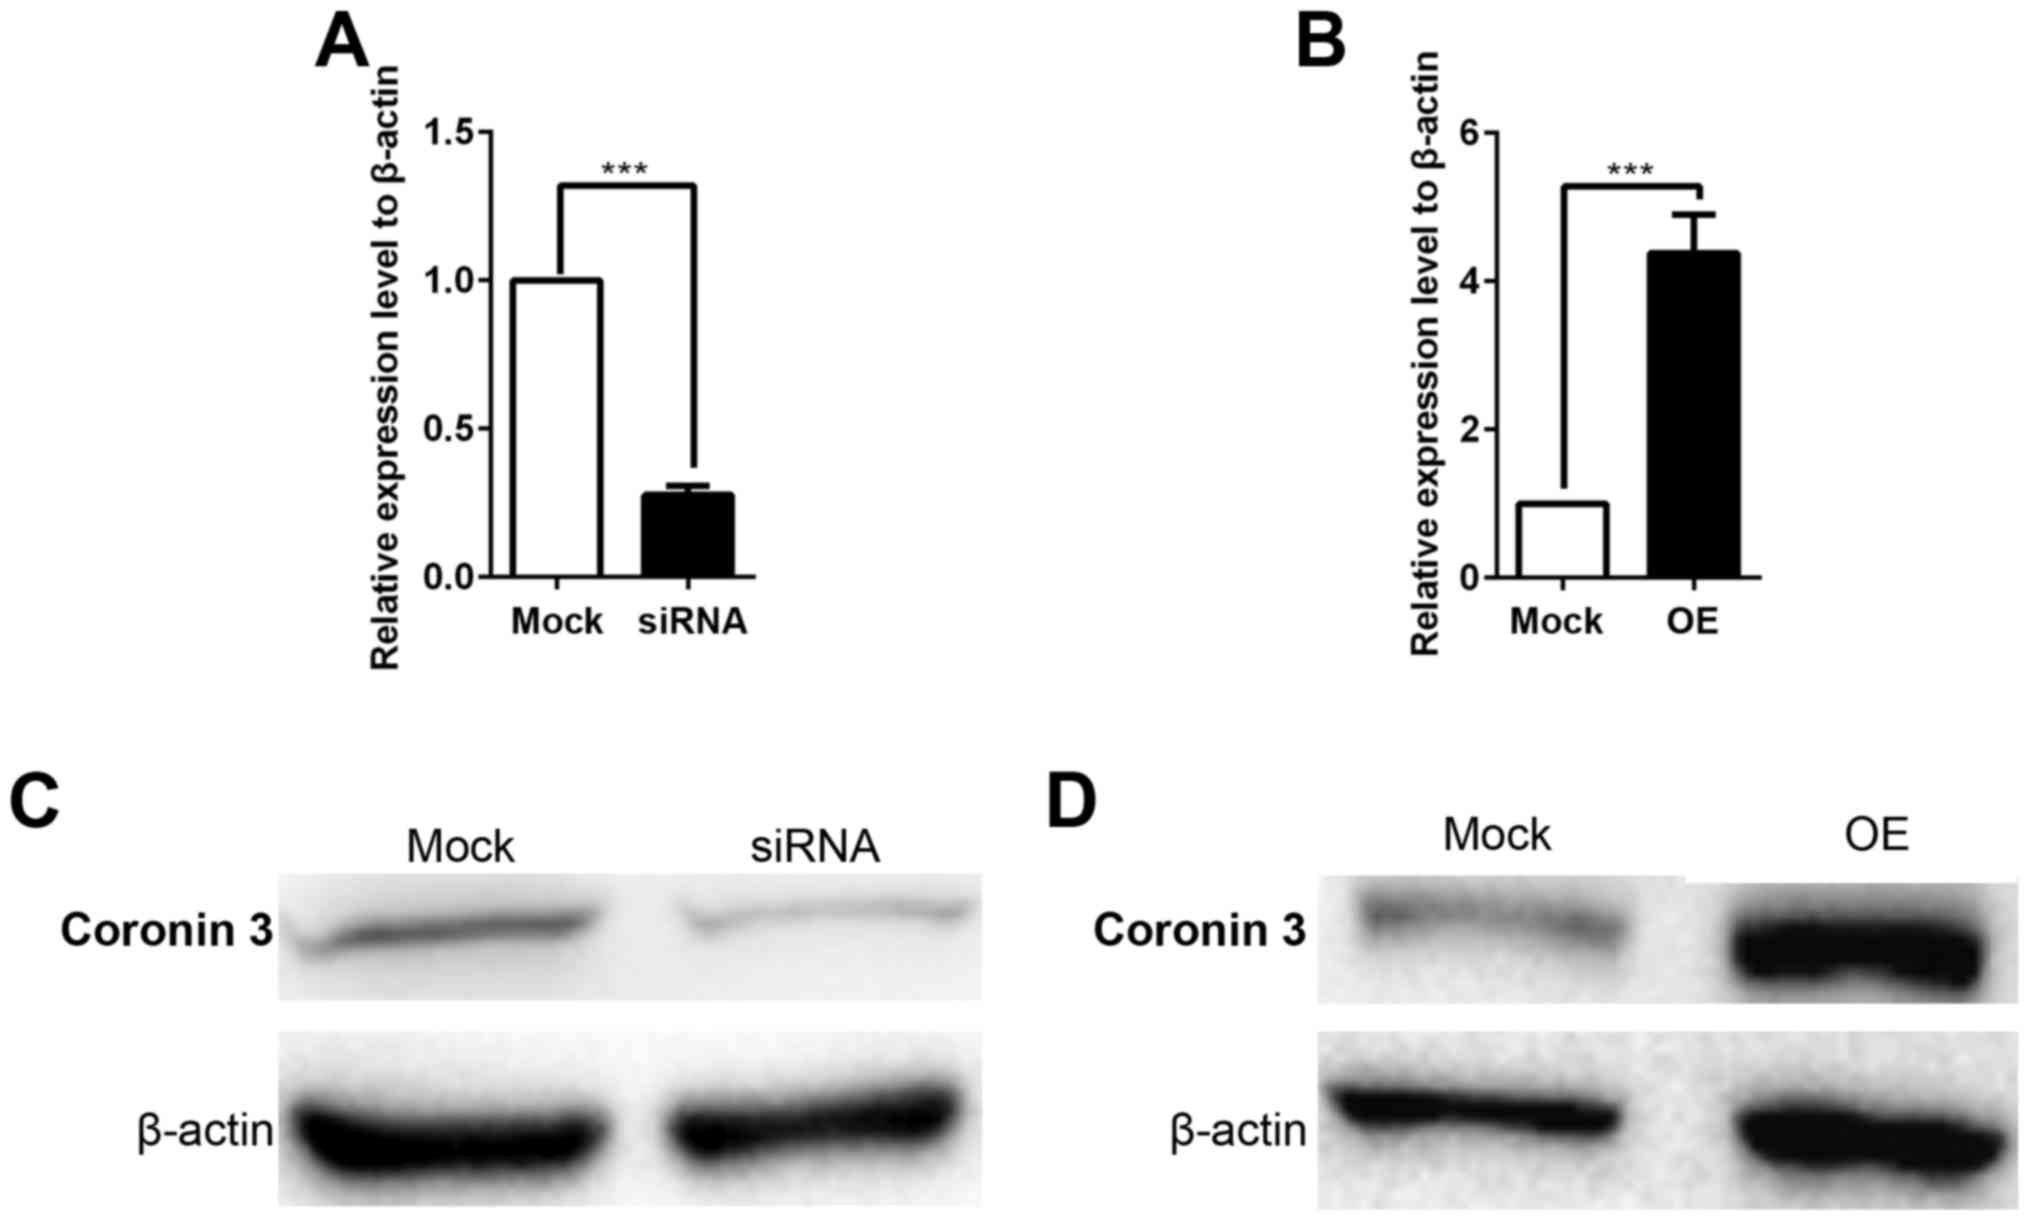
To further analyze the proteins that could be
regulated by coronin 3, coronin 3 was stably knocked down and
overexpressed in HepG2 cells. The overexpression or knockdown
results were confirmed by RT-qPCR (Fig. 2A and B) and western blotting
(Fig. 2C). These stable cells were
cultured in MEM medium supplemented with 10% FBS in T75 flasks to
90% confluency and then harvested; afterwards, 500 ng total
proteins were digested into peptides by trypsin and then the
peptides underwent mass spectrometry analysis.
Overall, 453 and 2834 significantly differentially
expressed proteins were identified in cells which stably
overexpress or knockdown coronin 3, respectively, compared with
their corresponding mock cells. In those dysregulated proteins, 249
proteins had a reversed tendency in coronin 3 overexpressed and
knockdown cells [the protein was up-regulated (or down-regulated)
when coronin 3 was overexpressed, but down-regulated (or
up-regulated) when coronin 3 was knocked down, and vice versa].
These 249 proteins were defined as coronin 3-regulated proteins.
Using these 249 proteins, Gene Ontology (GO) analysis was
performed. As presented in Table
III, 14.69, 13.55 and 7.21% proteins were enriched in cellular
processes, physiological processes and metabolism, respectively.
Pathway analysis demonstrated that these proteins were involved
into 94 different signaling pathways, including cell cycle, insulin
signaling, Wnt signaling and jak-stat signaling pathways. Some of
these 249 proteins were also involved in human disease processes
such as glioma [calcium/calmodulin-dependent protein kinase type II
subunit delta), RAC-alpha serine/threonine-protein kinase (AKT1),
G/S-specific cyclin-D1 (CCND1) and cyclin-dependent kinase 4 CDK4],
chronic myeloid leukemia (AKT1, CCND1, CDK4 and S-phase
kinase-associated protein 2) and small cell lung cancer (AKT1,
CCND1, CDK4 and signal transducer and activator of transcription
5B).
| Table III.GO analysis results of 249
dysregulated proteins. |
Table III.
GO analysis results of 249
dysregulated proteins.
| GO term | Count | Percent (%) |
|---|
| GO:0009987 cellular
process | 322 | 14.68978 |
| GO:0007582
physiological process | 297 | 13.54927 |
| GO:0008152
metabolism | 158 |
7.208029 |
| GO:0065007
biological regulation | 140 |
6.386861 |
| GO:0044464 cell
part | 124 |
5.656934 |
| GO:0005623
cell | 124 |
5.656934 |
| GO:0050789
regulation of biological process | 121 |
5.520073 |
| GO:0003824
catalytic activity | 110 |
5.018248 |
| GO other items | 97 |
4.425182 |
| GO:0005488
binding | 84 |
3.832117 |
| GO:0043226
organelle | 83 |
3.786496 |
| GO:0032502
developmental process | 68 |
3.10219 |
| GO:0044422
organelle part | 64 |
2.919708 |
| GO:0032501
multicellular organismal process | 63 |
2.874088 |
| GO:0050896 response
to stimulus | 58 |
2.645985 |
| GO:0051179
localization | 57 |
2.600365 |
| GO:0051234
establishment of localization | 53 |
2.417883 |
| GO:0032991
macromolecular complex | 40 |
1.824818 |
| GO:0048518 positive
regulation of biological process | 38 |
1.733577 |
| GO:0048519 negative
regulation of biological process | 28 |
1.277372 |
| GO:0005215
transporter activity | 24 |
1.094891 |
| GO:0002376 immune
system process | 21 |
0.958029 |
| GO:0031974
membrane-enclosed lumen | 18 |
0.821168 |
Coronin 3 inhibits
glucose-6-phosphatase catalytic subunit 3 (G6PC3) expression in
HepG2 cells
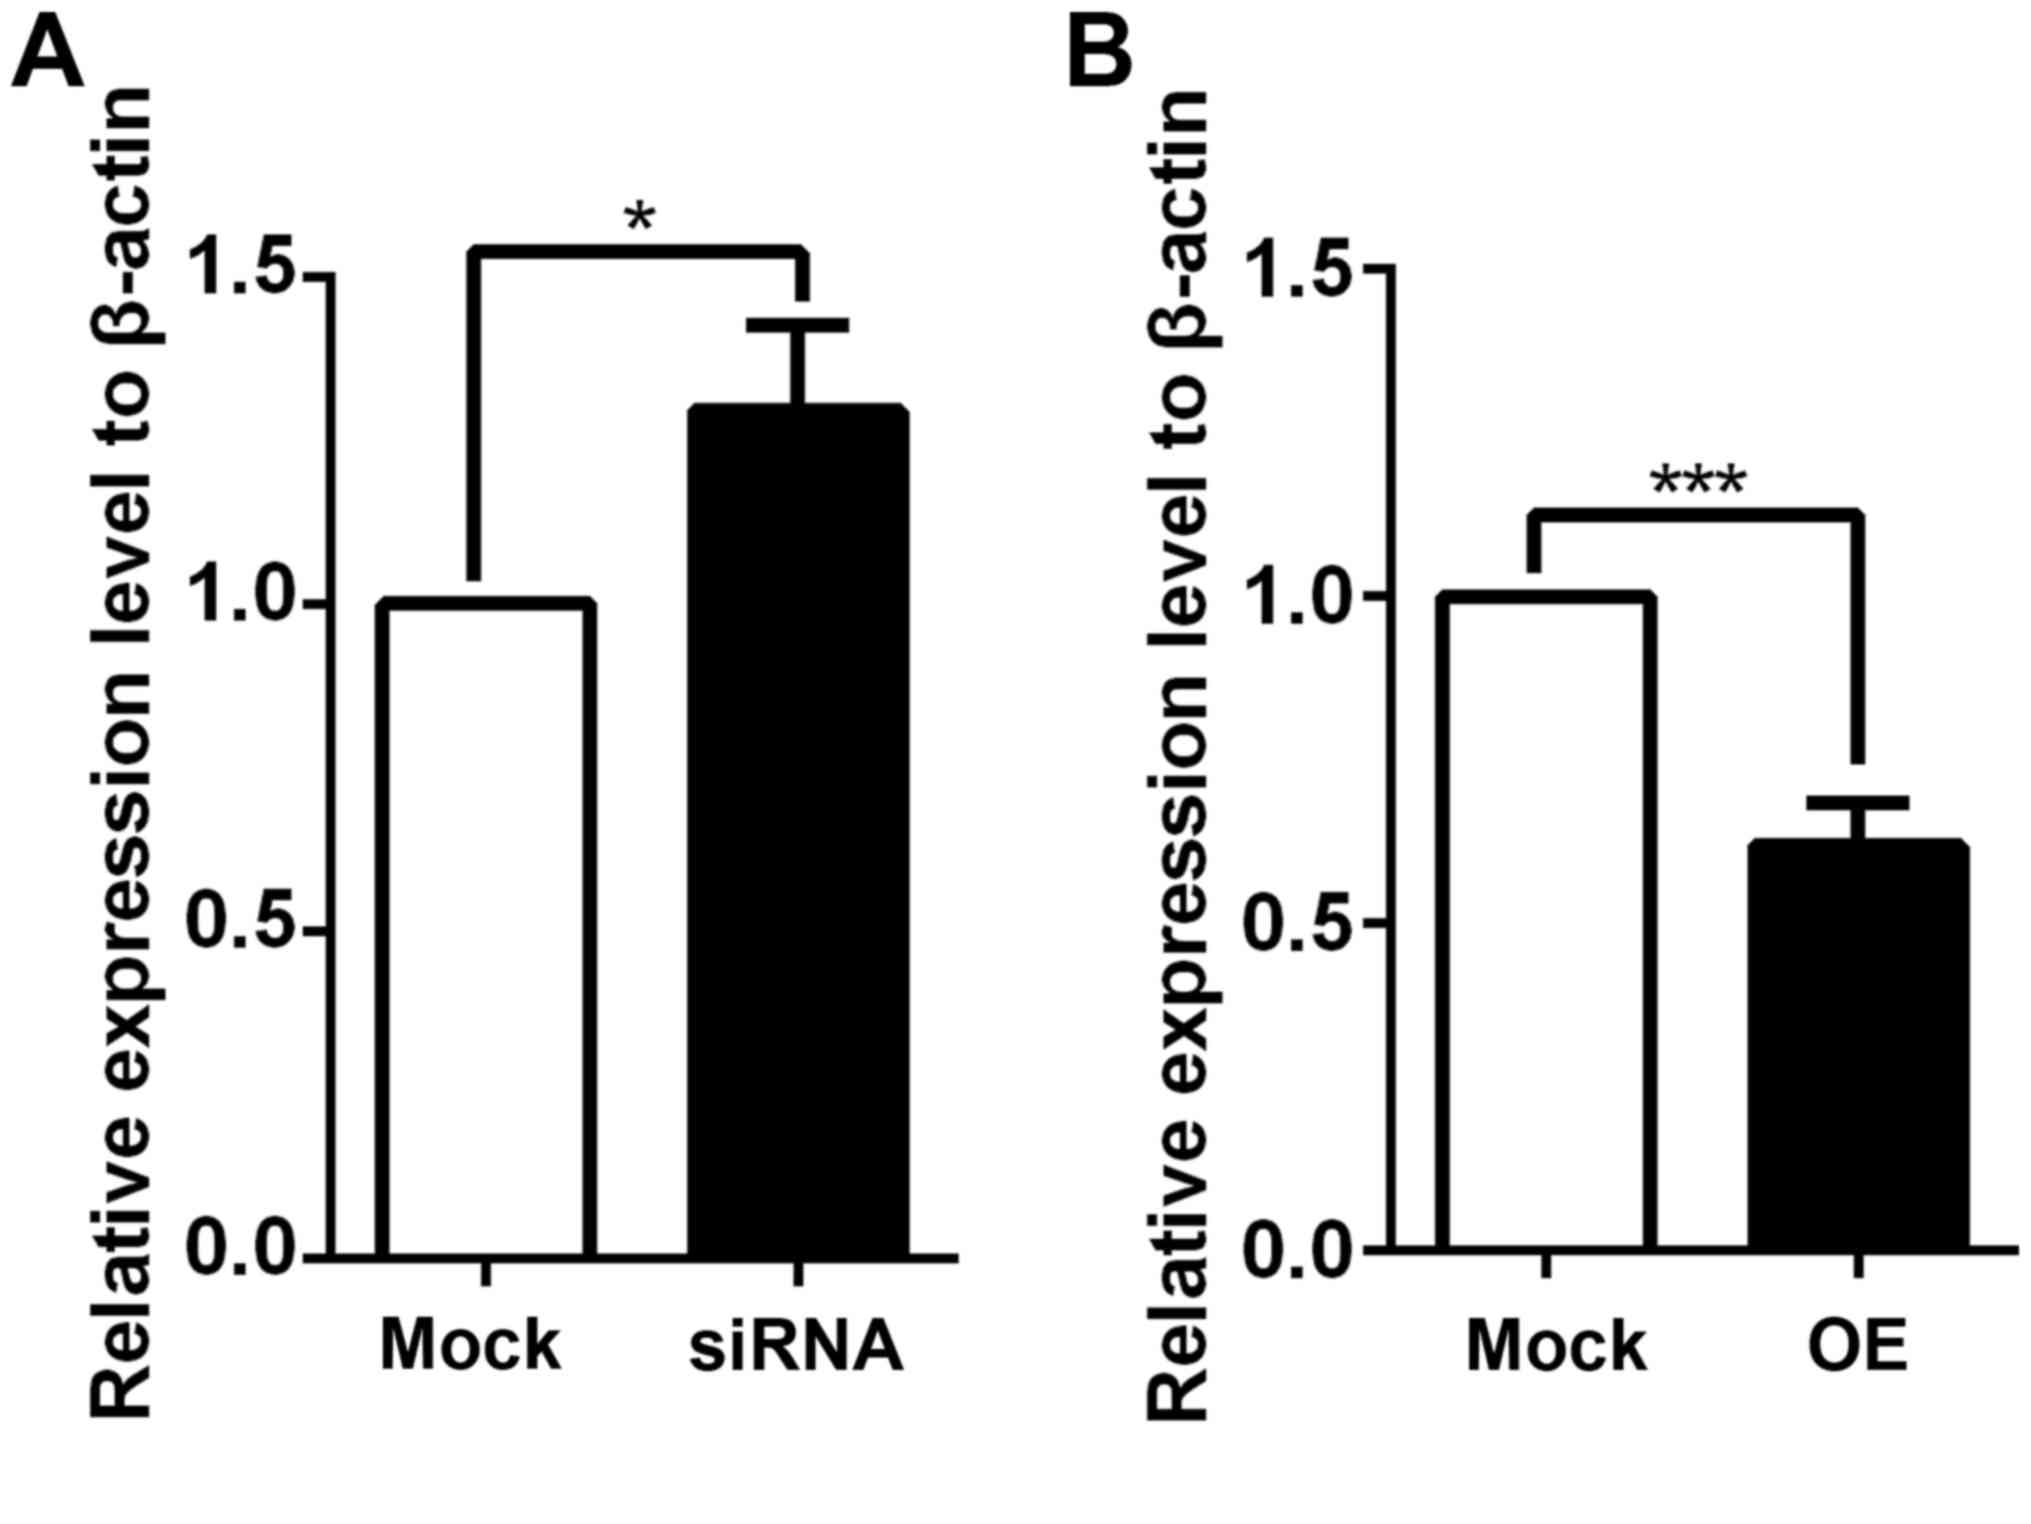
To verify the mass spectrometry results, 4
upregulated [human epithelial cell adhesion molecule (hepCAM), zinc
binding alcohol dehydrogenase domain containing 2 (ZADH2),
mitochondrial calcium uptake 1 (MICU1) and squamous cell
carcinoma-related oncogene (DCUN1D1)] and 1 downregulated (G6PC3)
proteins were selected out of these 249 proteins to perform qPCR
verification (primers were listed in Table II), as they have been reported to
serve important roles in tumorigenesis, growth and metastasis of
cancer (15–19), and had a marked fold change in the
MS analysis. Among these 5 selected proteins, only G6PC3
demonstrated alterations in mRNA expression levels when coronin 3
expression was dysregulated in the verification experiments. As
presented in Fig. 3, knockdown of
coronin 3 promoted the expression of the G6PC3 (Fig. 3A), whereas overexpression of
coronin 3 inhibited the expression of the G6PC3 (Fig. 3B). However, the other selected
targets (hepCAM, ZADH2, MICU and DCUN1D1) demonstrated no
significant differences in mRNA expression levels when coronin 3
was dysregulated, which may be due to the limitation of the MS
technique itself (the repeatability of MS technique is always low,
and requires other techniques to confirm its results), or due to
the expression change of selected targets at the protein level,
rather than the mRNA level. Therefore, G6PC3 may be a downstream
target of coronin 3.
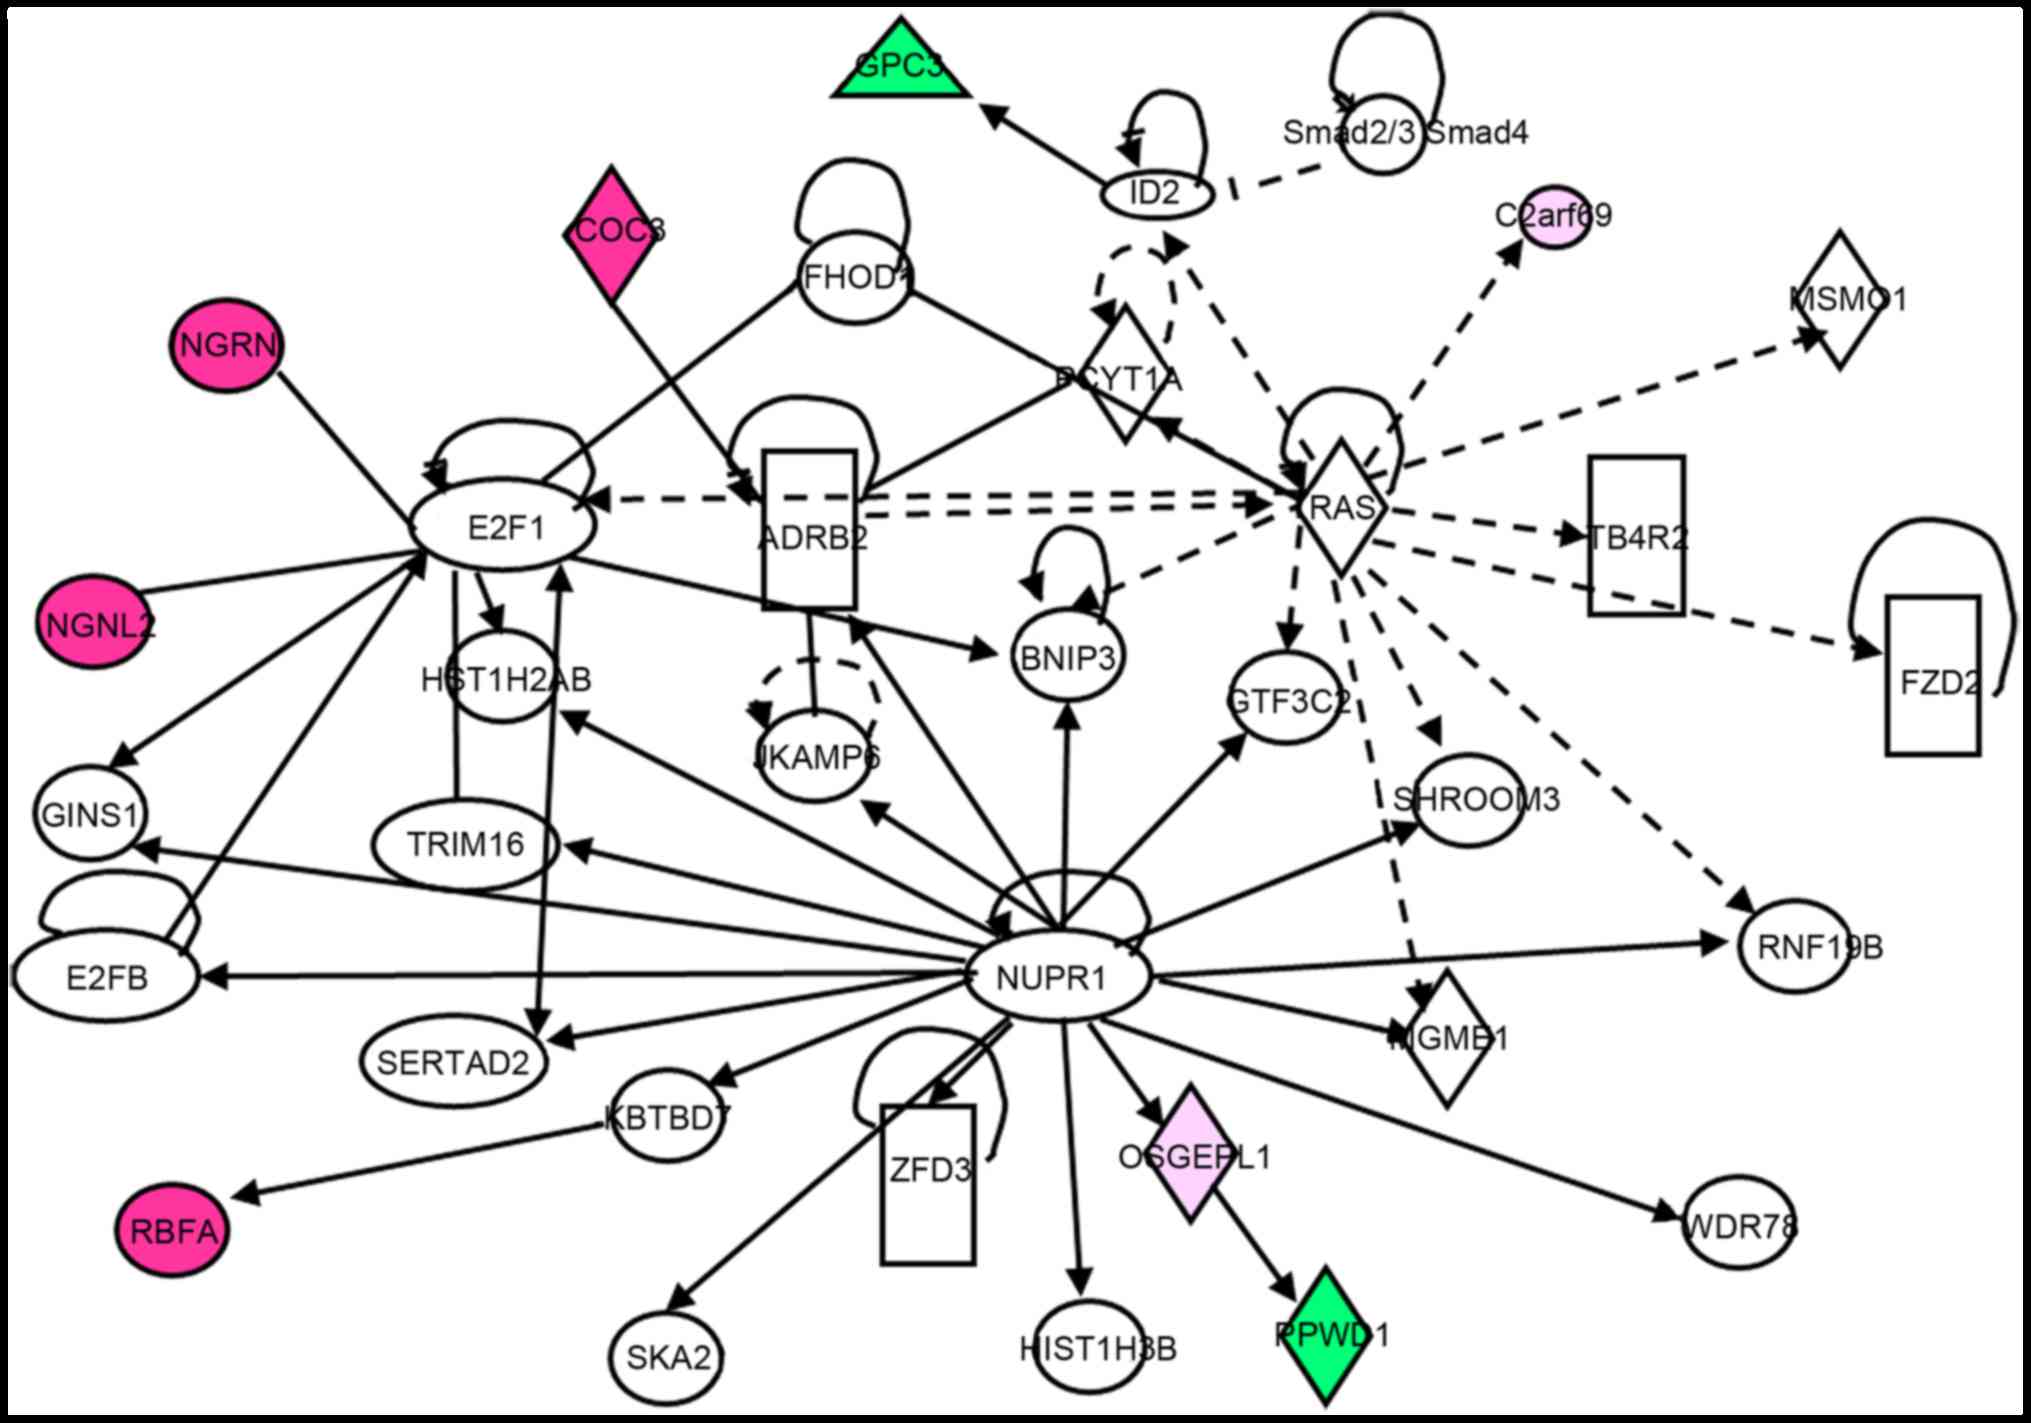
Using these 249 dysregulated proteins, Ingenuity
Pathway Analysis (IPA) (https://www.qiagenbioinformatics.com/products/ingenuity-pathway-analysis/)
was performed. The results demonstrated that G6PC3 is a downstream
target of inhibitors of differentiation 2 (ID2) protein, which is
downstream of the Ras and TGF-β signaling pathways, and ID2
expression is negatively associated with G6PC3 expression (Fig. 4). Additionally, G6PC3 was inhibited
when ID2 was activated (Fig. 4).
It has been reported that Rac-1 is involved in both the Ras
(20,21) and TGF-β (22,23)
signaling pathways, and knockdown of coronin 3 could disrupt Rac-1
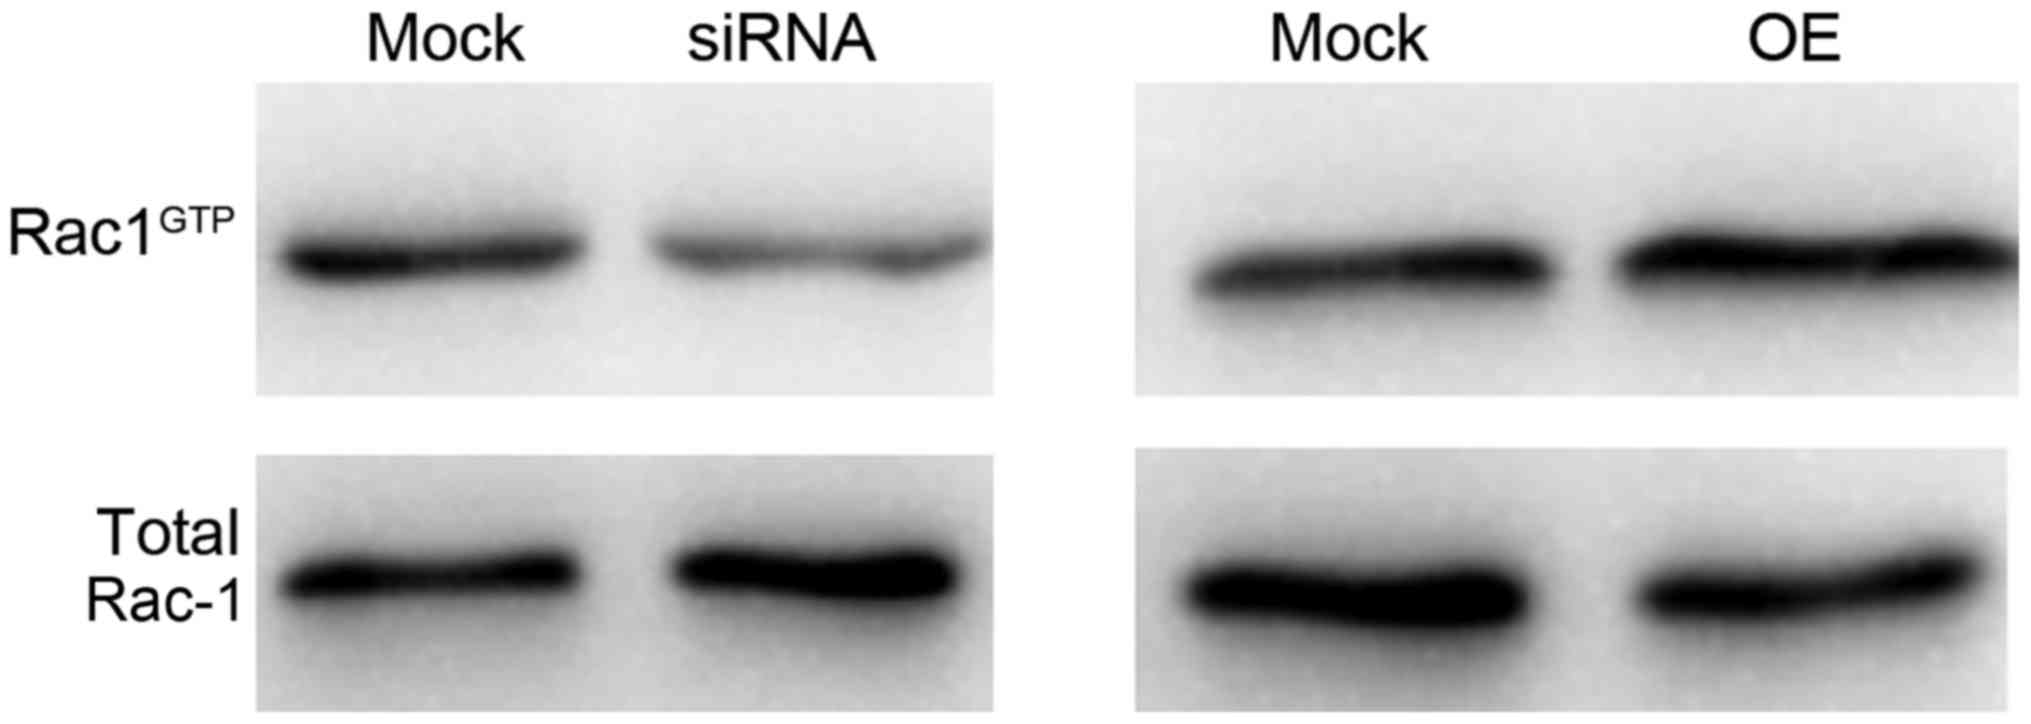
activity in HCC (10). Therefore,
Rac-1 activity was further assessed using the above constructed
stable cells. As presented in Fig.
5, Rac-1 activity was decreased when coronin 3 was
downregulated, whereas was increased when coronin 3 was
upregulated. These results indicated that coronin 3 may be involved
in the TGF-β and Ras signaling pathway via Rac-1.
Discussion
Coronin 3 (also known as coronin 1C) is the most
widely expressed coronin protein in mammals (3,24)
and is a type I coronin protein which is part of a conserved family
of WD-repeat-containing, actin-binding proteins. The coronin
protein family comprise of seven members (coronin 1–6) (25). Coronins serve various roles in cell
chemotaxis, cytokinesis, phagocytosis, locomotion and migration
(24). Coronin 3 interacts with
Arp2/3 and negatively regulates actin polymerization (5); in addition, it negatively regulates
cell motility through regulation of cell-matrix adhesion via focal
adhesion kinase (6). The present
study confirmed that the expression level of coronin 3 was
significantly increased in primary HCC tumor samples. This was
consistent with early work that the upregulated expression of
coronin 3 was strongly associated with tumor spontaneous pulmonary
metastasis in a nude mice model of HCC (10,11).
Recently, it has been reported that, besides HCC,
coronin 3 is also involved in the process of human diffuse gliomas,
gastric cancer and lung cancer. However, the biochemical mechanism
of coronin 3 activity remains largely unknown, and the relevant
downstream factors necessary for this activity require
identification. The present study constructed cells stably over-
expressing or knockdown of coronin 3. To uncover the proteins that
may be regulated by coronin 3, label-free MS analysis was performed
using whole cell lysates; 249 proteins were preliminarily
identified to be regulated by coronin 3 indirectly or directly.
These dysregulated proteins were enriched in cellular,
physiological and metabolism processes, and were involved in 94
different signaling pathways according to KEGG. Previously, a list
of 967 genes were identified as being downregulated in coronin
3-silenced lung cancer cells compared with the control by
genome-wide gene expression analysis; and a total of 29 pathways
were identified as being regulated by coronin 3 according to a KEGG
pathway (8). In gastric cancer,
the expression levels of 84 metastasis-associated genes were
investigated in coronin 3 silenced cells, and 9 of these 84 genes
were downregulated, while only 2 genes were upregulated;
furthermore, the regulation of matrix metalloproteinase-9 (MMP-9)
and cathepsin K by coronin 3 was further confirmed by qPCR in the
MKN-45 and MKN-28-NM cell lines (9). However, MMP-9 and cathepsin K are not
discovered in our current list, which might due to the differences
of cell lines and cancer models.
Cancer cells utilize a variety of metabolic
reprogramming strategies such as the Warburg Effect to survive in
the presence of hypoxia and overgrowth (26,27).
Nevertheless, no matter how much of the metabolic program
alteration, glucose is always the essential substrate for metabolic
reactions. G6PC is one of the key enzyme that regulates glucose
homeostasis and glycogenolysis. It has been reported that G6PC may
be used as a specific enzyme marker for tumors of liver and kidney
origin (28). In ovarian cancer,
G6PC serves dual roles both in glucose metabolism and cell cycle
control; knockdown of G6PC in ovarian cancer cells decreases cell
proliferation, viability, invasiveness and anchorage-independent
cell growth (29). In
glioblastoma, G6PC is a key enzyme that has pro-malignant functions
(30). In human primary HCC, qPCR
analysis demonstrated that is G6PC significantly reduced compared
with matching healthy liver tissues (19). G6PC3 is the third catalysis subunit
of the G6PC. The present study demonstrated that coronin 3 could
negatively regulate the expression of the G6PC3 in HepG2 cells, as
assessed by mass spectrometry; and further analysis by IPA revealed
that G6PC3 is negatively regulated by ID2, located downstream of
the Ras and TGF-β signaling pathways. It has been reported that
IL-6/Stat3 signaling activated by microRNA-23a could directly
target G6PC (19); and Rac-1, a
Rho family small GTPase involved in many cell activities including
cell cytoskeletal reorganization, cell growth, cell migration and
invasion (31), could bind to and
regulate Stat3 (32,33). Recently, it has been reported that
coronin 3 is closely associated with Rac-1 in HCC. In the present
study, although the overexpression or knockdown of coronin 3 did
not alter the protein expression levels of Rac-1, coronin 3
overexpression could significantly enhance Rac-1 activation by
triggering the interaction between GTP and Rac-1. Therefore,
coronin 3 may regulate G6PC3 expression through activating the
Rac-1, then activated Rac1 may bind to and regulate Stat3, and thus
inhibit the expression of G6PC3.
In conclusion, the present study demonstrated that
Rac-1 is a key member of the TGF-β and Ras signaling pathway, and
coronin 3 may interact with these two signaling pathways by
enhancing the activation of Rac-1. However, the detailed mechanisms
require further elucidation. These results implicate coronin 3 as a
potential therapeutic target for HCC.
Acknowledgements
The present study was supported by the National
Natural Science Foundation of China (grant no. 31201008), the
Educational and Research Project of Fujian Educational Department
(grant no. JB13425), the Scientific Foundation of Fujian Province
(grant no. 2015D001), the Scientific Foundation of Fuzhou Health
Department (grant no. 2013-S-wq18), the Mengchao Hepatobiliary
Hospital of Fujian Medical University (grant no. QDZJ-2014-004),
the Science and Technology Bureau of Fuzhou City (grant no.
2014-S-139-1), the Fujian Provincial Health and Family Planning
Commission (grant no. 2014-2-41) and the Special Research
Development Fund of indirectly affiliated hospital of Fujian
Medical University (grant no. FZS13004Y).
References
|
1
|
Iizaka M, Han HJ, Akashi H, Furukawa Y,
Nakajima Y, Sugano S, Ogawa M and Nakamura Y: Isolation and
chromosomal assignment of a novel human gene, CORO1C, homologous to
coronin-like actin-binding proteins. Cytogenet Cell Genet.
88:221–224. 2000. View Article : Google Scholar : PubMed/NCBI
|
|
2
|
McArdle B and Hofmann A: Coronin structure
and implications. Subcell Biochem. 48:56–71. 2008. View Article : Google Scholar : PubMed/NCBI
|
|
3
|
Wick M, Bürger C, Brüsselbach S, Lucibello
FC and Müller R: Identification of serum-inducible genes: Different
patterns of gene regulation during G0->S and G1->S
progression. J Cell Sci. 107:227–239. 1994.PubMed/NCBI
|
|
4
|
Chang HY, Sneddon JB, Alizadeh AA, Sood R,
West RB, Montgomery K, Chi JT, van de Rijn M, Botstein D and Brown
PO: Gene expression signature of fibroblast serum response predicts
human cancer progression: Similarities between tumors and wounds.
PLoS Biol. 2:E72004. View Article : Google Scholar : PubMed/NCBI
|
|
5
|
Carlier MF and Pantaloni D: Control of
actin assembly dynamics in cell motility. J Biol Chem.
282:23005–23009. 2007. View Article : Google Scholar : PubMed/NCBI
|
|
6
|
Samarin SN, Koch S, Ivanov AI, Parkos CA
and Nusrat A: Coronin 1C negatively regulates cell-matrix adhesion
and motility of intestinal epithelial cells. Biochem Biophys Res
Commun. 391:394–400. 2010. View Article : Google Scholar : PubMed/NCBI
|
|
7
|
Thal D, Xavier CP, Rosentreter A, Linder
S, Friedrichs B, Waha A, Pietsch T, Stumpf M, Noegel A and Clemen
C: Expression of coronin-3 (coronin-1C) in diffuse gliomas is
related to malignancy. J Pathol. 214:415–424. 2008. View Article : Google Scholar : PubMed/NCBI
|
|
8
|
Mataki H, Enokida H, Chiyomaru T, Mizuno
K, Matsushita R, Goto Y, Nishikawa R, Higashimoto I, Samukawa T,
Nakagawa M, et al: Downregulation of the microRNA-1/133a cluster
enhances cancer cell migration and invasion in lung-squamous cell
carcinoma via regulation of Coronin1C. J Hum Genet. 60:53–61. 2015.
View Article : Google Scholar : PubMed/NCBI
|
|
9
|
Ren G, Tian Q, An Y, Feng B, Lu Y, Liang
J, Li K, Shang Y, Nie Y, Wang X and Fan D: Coronin 3 promotes
gastric cancer metastasis via the up-regulation of MMP-9 and
cathepsin K. Mol Cancer. 11:672012. View Article : Google Scholar : PubMed/NCBI
|
|
10
|
Wang ZG, Jia MK, Cao H, Bian P and Fang
XD: Knockdown of Coronin-1C disrupts Rac1 activation and impairs
tumorigenic potential in hepatocellular carcinoma cells. Oncol Rep.
29:1066–1072. 2013.PubMed/NCBI
|
|
11
|
Wu L, Peng CW, Hou JX, Zhang YH, Chen C,
Chen LD and Li Y: Coronin-1C is a novel biomarker for
hepatocellular carcinoma invasive progression identified by
proteomics analysis and clinical validation. J Exp Clin Cancer Res.
29:172010. View Article : Google Scholar : PubMed/NCBI
|
|
12
|
Tilley FC, Williamson RC, Race PR, Rendall
TC and Bass MD: Integration of the Rac1- and actin-binding
properties of Coronin-1C. Small GTPases. 6:36–42. 2015. View Article : Google Scholar : PubMed/NCBI
|
|
13
|
Livak KJ and Schmittgen TD: Analysis of
relative gene expression data using real-time quantitative PCR and
the 2(−Delta Delta C(T)) Method. Methods. 25:403–408. 2001.
View Article : Google Scholar
|
|
14
|
Gilar M, Olivova P, Daly AE and Gebler JC:
Two-dimensional separation of peptides using RP-RP-HPLC system with
different pH in first and second separation dimensions. J Sep Sci.
28:1694–1703. 2005. View Article : Google Scholar : PubMed/NCBI
|
|
15
|
Guan DX, Shi J, Zhang Y, Zhao JS, Long LY,
Chen TW, Zhang EB, Feng YY, Bao WD, Deng YZ, et al: Sorafenib
enriches epithelial cell adhesion molecule-positive tumor
initiating cells and exacerbates a subtype of hepatocellular
carcinoma through TSC2-AKT cascade. Hepatology. 62:1791–1803. 2015.
View Article : Google Scholar : PubMed/NCBI
|
|
16
|
Auld DS and Bergman T: Medium- and
short-chain dehydrogenase/reductase gene and protein families: The
role of zinc for alcohol dehydrogenase structure and function. Cell
Mol Life Sci. 65:3961–3970. 2008. View Article : Google Scholar : PubMed/NCBI
|
|
17
|
Wang W, Xie Q, Zhou X, Yao J, Zhu X, Huang
P, Zhang L, Wei J, Xie H, Zhou L and Zheng S: Mitofusin-2 triggers
mitochondria Ca2+ influx from the endoplasmic reticulum
to induce apoptosis in hepatocellular carcinoma cells. Cancer Lett.
358:47–58. 2015. View Article : Google Scholar : PubMed/NCBI
|
|
18
|
Fu W, Sun J, Huang G, Liu JC, Kaufman A,
Ryan RJ, Ramanathan SY, Venkatesh T and Singh B: Squamous cell
carcinoma-related oncogene (SCCRO) family members regulate cell
growth and proliferation through their cooperative and antagonistic
effects on cullin neddylation. J Biol Chem. 291:6200–6217. 2016.
View Article : Google Scholar : PubMed/NCBI
|
|
19
|
Wang B, Hsu SH, Frankel W, Ghoshal K and
Jacob ST: Stat3-mediated activation of microRNA-23a suppresses
gluconeogenesis in hepatocellular carcinoma by down-regulating
glucose-6-phosphatase and peroxisome proliferator-activated
receptor gamma, coactivator 1 alpha. Hepatology. 56:186–197. 2012.
View Article : Google Scholar : PubMed/NCBI
|
|
20
|
Zhou C, Licciulli S, Avila JL, Cho M,
Troutman S, Jiang P, Kossenkov AV, Showe LC, Liu Q, Vachani A, et
al: The Rac1 splice form Rac1b promotes K-ras-induced lung
tumorigenesis. Oncogene. 32:903–909. 2013. View Article : Google Scholar : PubMed/NCBI
|
|
21
|
Wu CY, Carpenter ES, Takeuchi KK, Halbrook
CJ, Peverley LV, Bien H, Hall JC, DelGiorno KE, Pal D, Song Y, et
al: PI3K Regulation of RAC1 Is required for KRAS-induced pancreatic
tumorigenesis in mice. Gastroenterology. 147:1405–1416.e7. 2014.
View Article : Google Scholar : PubMed/NCBI
|
|
22
|
Yamamoto N, Otsuka T, Kondo A,
Matsushima-Nishiwaki R, Kuroyanagi G, Kozawa O and Tokuda H: Rac
limits TGF-β-induced VEGF synthesis in osteoblasts. Mol Cell
Endocrinol. 405:35–41. 2015. View Article : Google Scholar : PubMed/NCBI
|
|
23
|
Yu JR, Tai Y, Jin Y, Hammell MC, Wilkinson
JE, Roe JS, Vakoc CR and Van Aelst L: TGF-β/Smad signaling through
DOCK4 facilitates lung adenocarcinoma metastasis. Genes Dev.
29:250–261. 2015. View Article : Google Scholar : PubMed/NCBI
|
|
24
|
Rybakin V and Clemen CS: Coronin proteins
as multifunctional regulators of the cytoskeleton and membrane
trafficking. Bioessays. 27:625–632. 2005. View Article : Google Scholar : PubMed/NCBI
|
|
25
|
Uetrecht AC and Bear JE: Coronins: The
return of the crown. Trends Cell Biol. 16:421–426. 2006. View Article : Google Scholar : PubMed/NCBI
|
|
26
|
Lee AS: Glucose-regulated proteins in
cancer: Molecular mechanisms and therapeutic potential. Cancer.
14:263–276. 2014.PubMed/NCBI
|
|
27
|
Li B, Qiu B, Lee DS, Walton ZE, Ochocki
JD, Mathew LK, Mancuso A, Gade TP, Keith B, Nissim I and Simonn MC:
Fructose-1,6-bisphosphatase opposes renal carcinoma progression.
Nature. 513:251–255. 2014. View Article : Google Scholar : PubMed/NCBI
|
|
28
|
Michals K, Pringle K, Pang EJ and Matalon
R: Glucose-6-phosphatase as a marker for tumors of liver and kidney
origin. Biochem Med. 30:127–130. 1983. View Article : Google Scholar : PubMed/NCBI
|
|
29
|
Guo T, Chen T, Gu C, Li B and Xu C:
Genetic and molecular analyses reveal G6PC as a key element
connecting glucose metabolism and cell cycle control in ovarian
cancer. Tumour Biol. 36:7649–7658. 2015. View Article : Google Scholar : PubMed/NCBI
|
|
30
|
Abbadi S, Rodarte JJ, Abutaleb A, Lavell
E, Smith CL, Ruff W, Schiller J, Olivi A, Levchenko A,
Guerrero-Cazares H and Quinones-Hinojosa A: Glucose-6-phosphatase
is a key metabolic regulator of glioblastoma invasion. Mol Cancer
Res. 12:1547–1559. 2014. View Article : Google Scholar : PubMed/NCBI
|
|
31
|
Moissoglu K, Slepchenko BM, Meller N,
Horwitz AF and Schwartz MA: In vivo dynamics of Rac-membrane
interactions. Mol Biol Cell. 17:2770–2779. 2006. View Article : Google Scholar : PubMed/NCBI
|
|
32
|
Simon AR, Vikis HG, Stewart S, Fanburg BL,
Cochran BH and Guan KL: Regulation of STAT3 by direct binding to
the Rac1 GTPase. Science. 290:144–147. 2000. View Article : Google Scholar : PubMed/NCBI
|
|
33
|
Sawada N, Li Y and Liao JK: Novel aspects
of the roles of Rac1 GTPase in the cardiovascular system. Curr Opin
Pharmacol. 10:116–121. 2010. View Article : Google Scholar : PubMed/NCBI
|