Introduction
Multiple symmetric lipomatosis (MSL), first
described in 1846 by Brodie (1),
is a rare disorder characterized by aberrantly multiple, symmetric
and substantial subcutaneous adipose tissue overgrowth in the face,
neck, shoulders, back, chest and abdomen (2,3). MSL
patients will present several clinical repercussions, including
sleep apnea syndrome, swallowing and breathing difficulties, and
polyneuropathies (4,5). MSL frequently occurs in men between
30 and 70 years of age with a high incidence rate of 1:25,000 in
the Mediterranean region and a low rate in Asia. Alcoholism is a
highly-associated risk factor in the development of MSL (6–8). MSL
diagnosis is based on history, clinical appearance and X-ray
computed tomography or magnetic resonance imaging. To date, the
majority of studies of MSL have demonstrated that adipose tissue
accumulation in MSL patients does not result in metabolic
dysfunctions (9,10), whereas other studies reveal an
association of MSL with hyperlipidemia, diabetes mellitus,
hypertension, or liver disease (11,12).
Clinically, there are no effective treatments for MSL, leading to a
disappointing disease control, although other preventive measures
or procedures, including alcohol withdrawal and weight reduction,
may help in control of MSL fat mass, however do not reduce the
progression of the disease (13).
Currently, the primary treatment is surgical fat excision or
liposuction and the latter is only effective on a smaller fat mass
(14). The recurrence rate of
surgical fat excision is ~63%, and the recurrence rate of
liposuction is 95% (12).
At present, the precise MSL etiology and
pathogenesis remain to be elucidated. Previous studies demonstrated
an association of MSL with the point mutations (m.8344A>G or
m.8363 G>A) in the mitochondrial DNA, genes of which are
associated with the lipolytic pathway (15,16).
Further studies have demonstrated that MSL is associated with
myoclonus epilepsy and ragged red fibers syndrome (17,18).
Furthermore, additional studies reported that pre-adipocytes
express high levels of uncoupling protein 1 (UCP1) in MSL and the
latter is a brown adipocyte marker for MSL adipocytes containing
abundant mitochondria in the cytoplasm, suggesting overgrowth of
MSL adipocytes from immature brown precursor cells (19,20).
In addition, defects in the adrenal β3 adrenoceptor function or
decrease in inducible nitric oxide synthase (iNOS) are also
postulated in MSL since decrease in iNOS leads to reduction of
nitric oxide and in turn, to enhancement of adipogenesis (19,20).
A recent study analyzed differential expression of p53 signaling
pathway genes, nuclear receptors and co-regulators and
mitochondrial genes using pathway cDNA arrays in adipose tissues
derived stem cells in five sporadic MSL cases (21). Therefore, improved understanding of
MSL pathogenesis and identification of gene alterations may aid the
provision of novel strategies in MSL control, prevention and
prognosis.
The present study employed a digital gene expression
technique with a next-generation sequencing platform to first
profile differentially expressed genes in MSL compared with normal
control tissues. The technique overcomes the deficiency of cDNA
microarray technique with improved accuracy, sensitivity,
repeatability and detection range in analysis of gene transcripts.
The present study aimed to provide novel information regarding the
differentially expressed genes in MSL in order to identify novel
strategies in prevention, treatment and pathogenesis of MSL in the
future.
Materials and methods
Patients and samples collection
The present study recruited three male MSL patients
(age range between 45 to 51 years old) who received medical
treatment in The Department of Endocrinology and General Surgery,
The Third Xiangya Hospital of Central South University (Changsha,
China). These unrelated patients were clinically diagnosed with MSL
and reported in the author's previous studies (10,22).
Clinically, these patients had fatty masses progressively appearing
in the neck, upper arms, bilateral shoulders, upper thorax, back
and abdomen with a history of heavy alcohol consumption (100–150,
100–150 and 150–200 ml of wine daily for 15, 10 and 8 years,
respectively). Furthermore, the present study obtained three age-
and sex-matched control males from the outpatient clinic as control
subjects. These control subjects had no history of diabetes,
malignancies, acute infectious disease, or smoking history and were
matched with MSL patients in terms of age, body mass index and
where they lived. These samples were collected at The Third Xiangya
Hospital, Central South University (Changsha, China) between July
2008 and September 2014. The present study was approved by the
Human Ethical Review Committee of The Third Xiangya Hospital,
Central South University and all studies were conducted according
to the principles expressed in the Declaration of Helsinki.
Subjects signed informed written consent prior to their inclusion
in the present study. Tissue samples were obtained from the right
upper abdomen subcutaneous lipomatous tissues of MSL patients and
from the right upper abdomen subcutaneous adipose tissues of
control subjects and then snap-frozen and stored at −80°C until
use.
RNA isolation, cDNA library
construction and DNA sequencing
Tissue samples of each MSL and control subject were
subjected to RNA isolation using TRIzol® (Invitrogen;
Thermo Fisher Scientific, Inc., Waltham, MA, USA) according to the
manufacturer's protocol. The concentration and purity of these RNA
samples were then assessed using a Nano Photometer®
spectrophotometer (Implen, Inc., Westlake Village, CA, USA) and a
Qubit® RNA Assay kit in a Qubit® 2.0
Flurometer (Invitrogen; Thermo Fisher Scientific, Inc.), and RNA
integrity was determined using the RNA Nano 6000 Assay kit
(procedures were conducted according to the manufacturer's
protocol) of the Bioanalyzer 2100 system (Agilent Technologies,
Inc., Santa Clara, CA, USA).
A cDNA library was then constructed using Novogene
Bioinformatics Technologies Co., Ltd. (Beijing, China) using a NEB
Next® Ultra™ RNA Library Prep kit for
Illumina® (New England Biolabs, Inc., Ipswich, MA, USA)
following the manufacturer's protocols. Briefly, mRNA was purified
from the RNA samples using poly-T-oligo-attached magnetic beads and
fragmented to ~200 bp using divalent cations under elevated
temperature and then reversely transcribed into cDNA using random
hexamer primers and M-MuLV Reverse Transcriptase. The second strand
cDNA was synthesized using RNase H, dNTP and DNA polymerase I.
Subsequently, polymerase chain reaction (PCR) was performed using
Phusion High-Fidelity DNA polymerase, Universal PCR primers and
Index (X) Primer for double-stranded cDNA amplification. The PCR
products were then purified using the AMPure XP system and the
library quality was assessed using the Agilent Bioanalyzer 2100
system and the cDNA library was sequenced using an Illumina Hiseq
2000/2500 platform and 100 bp/50 bp single-end reads were
generated.
Data analysis
The raw data generated from Illumina Hiseq 2000
sequencing were processed through in-house Perl scripts. The
processed data reads were filtered into clean reads by removing
adaptor sequences, duplicated sequences, empty reads, or poly-N
reads containing >10% ‘N’ and low-quality reads (<Q20). The
clean reads were then mapped to the reference sequences with using
TopHat 2 available at www.ccb.jhu.edu/software/tophat.
Next, differentially expressed genes in MSL compared
with controls were identified using the DESeq R package from
www.bioinfo.au.tsinghua.edu.cn/software/degseq
(23). DESeq provides statistical
routines to determine differential gene expression with the digital
gene expression data using a model based on the negative binomial
distribution. The resulting P-values were then adjusted using the
Benjamini and Hochberg's approach for controlling the false
discovery rate (24). Genes with
an adjusted P-value <0.05 identified by DESeq were assigned as
differentially expressed ones.
Bioinformatic analysis
These differentially expressed genes were grouped
and analyzed using the Gene Ontology (GO) enrichment analysis with
the GOseq R package (version 1.12.0), in which gene length bias was
corrected. GO terms with corrected P<0.05 were considered
significantly enriched.
Subsequently, these differentially expressed genes
were grouped into gene pathways using the pathway enrichment
analysis with the Kyoto Encyclopedia of Genes and Genomes database
(KEGG; www.genome.jp/kegg) and KOBAS version
2.0 software (25,26). The statistical enriched
differentially expressed genes in KEGG pathways were considered
significant with corrected P<0.05.
Protein-protein interaction (PPI) analysis was
performed to predict PPIs of these differentially expressed genes
(mips.helmholtz-muenchen.de/proj/ppi/). The protein
network was then constructed using these differentially expressed
gene IDs using the STRING database (http://string-db.org/) and Cytoscape version 3.5.1
software (http://www.cytoscape.org/download.html).
Reverse transcription-quantitative PCR
(RT-qPCR)
Total RNA was isolated from tissue samples using
TRIzol reagent (Invitrogen; Thermo Fisher Scientific, Inc.) and 1
µg of each RNA sample was reversely transcribed into cDNA using a
reverse transcription kit (Fermentas; Thermo Fisher Scientific,
Inc., Pittsburgh, PA, USA). PCR amplification was performed for 12
genes that were randomly selected for validation of gene profiling
data on a Mastercycler®ep realplex real-time PCR
(Eppendorf, Hamburg, Germany). The primer pairs are listed in
Table I and were synthesized by
Shanghai Shenggong Biology Engineering Technology Service, Ltd.
(Shanghai, China). GAPDH was used as an endogenous control. The
SYBR-Green PCR assay contained 10 µl of QuantiTect SYBR-Green PCR
Master mix (ToYoBo, Osaka, Japan), 2 µl of cDNA, 1.2 µl of each
primer (10 µM) and 6.8 µl of RNase-free water, The cycling
conditions were as follows: An initial denaturation at 95°C for 1
min, followed by 40 cycles of denaturation for 15 sec at 95°C,
annealing for 30 sec at 60°C and extension for 30 sec at 72°C.
Levels of the relative gene expression were computed using the
2−ΔΔCT method (27),
and each experiment contained three replicates.
 | Table I.Primers used for reverse
transcription-quantitative polymerase chain reaction. |
Table I.
Primers used for reverse
transcription-quantitative polymerase chain reaction.
| Gene name | Gene ID | Sequences of
primers |
|---|
| PPARγ | NM_138711.3 |
5′-ACCAAAGTGCAATCAAAGTGGA-3′ |
|
|
|
5′-ATGAGGGAGTTGGAAGGCTCT-3′ |
| PDXK | NM_003681.4 |
5′-GATTTGAGATTGACGCGGTGA-3′ |
|
|
|
5′-CCCTCGTATAACCTGTGAGCAC-3′ |
| PGLS | NM_012088.2 |
5′-CAGACTGCCGATCCCAGAAAG-3′ |
|
|
|
5′-CCCTTGGAATGCCTGTCTCA-3′ |
| DGAT1 | NM_012079.5 |
5′-TATTGCGGCCAATGTCTTTGC-3′ |
|
|
|
5′-CACTGGAGTGATAGACTCAACCA-3′ |
| HOXC8 | NM_022658.3 |
5′-ACCGGCCTATTACGACTGC-3′ |
|
|
|
5′-TGCTGGTAGCCTGAGTTGGA-3′ |
| ATP5D | NM_001001975.1 |
5′-TCCCACGCAGGTGTTCTTC-3′ |
|
|
|
5′-GGAACCGCTGCTCACAAAGT-3′ |
| THY1 | NM_001311162.1 |
5′-ATCGCTCTCCTGCTAACAGTC-3′ |
|
|
|
5′-CTCGTACTGGATGGGTGAACT-3′ |
| SAR1A | NM_020150.4 |
5′-ATAATGCAGGCAAAACCACTCT-3′ |
|
|
|
5′-TGATGTCGGATGTAGTGTTGGAA-3′ |
| JUNB | NM_002229.2 |
5′-ACGACTCATACACAGCTACGG-3′ |
|
|
|
5′-GCTCGGTTTCAGGAGTTTGTAGT-3′ |
| RGS16 | NM_002928.3 |
5′-ATCAGAGCTGGGCTGCGATA-3′ |
|
|
|
5′-CAGGTCGAACGACTCTCTCC-3′ |
| HBEGF | NM_001945.2 |
5′-ATCGTGGGGCTTCTCATGTTT-3′ |
|
|
|
5′-TTAGTCATGCCCAACTTCACTTT-3′ |
| IGF1R | NM_001291858.1 |
5′-TCGACATCCGCAACGACTATC-3′ |
|
|
|
5′-CCAGGGCGTAGTTGTAGAAGAG-3′ |
| GAPDH | NM_001289746.1 |
5′-GGCTGAGAACGGGAAGCTTGTCAT-3′ |
|
|
|
5′-CAGCCTTCTCCATGGTGGTGAAGA-3′ |
Statistical analyses
All statistical analyses were performed by using
SPSS software version 13.0 (SPSS, Inc., Chicago, IL, USA) and an
unpaired Student's t-test was used to analyze data between MSL and
control. P<0.05 was considered to indicate a statistically
significant difference.
Results
DNA sequencing of cDNA libraries from
MSL and control
To profile differentially expressed genes in MSL and
explore genes that may associate with MSL pathogenesis, 6 cDNA
libraries (3 of MSL A1, A2 and A3 vs. 3 of control B1, B2 and B3)
were constructed. Following the removal of adaptor sequences,
duplicated sequences, poly-N reads containing >10% ‘N’ and
low-quality reads (<Q20), a total number of clean reads per
library ranged between 26.6 and 38.2 million were obtained. The Q20
values were >96% and GC content ~53% (Table II).
| Table II.Sequence statistics of MSL and
control. |
Table II.
Sequence statistics of MSL and
control.
| Sample ID | Raw reads | Clean reads | Clean bases | Error rate (%) | Q20 (%) | Q30 (%) | GC content (%) |
|---|
| A1 | 32,904,914 | 31,084,596 | 3.89G | 0.01 | 96.71 | 92.87 | 51.46 |
| A2 | 28,879,428 | 27,757,944 | 3.47G | 0.01 | 96.82 | 92.95 | 54.0 |
| A3 | 34,129,132 | 32,691,812 | 4.09G | 0.01 | 96.88 | 93.11 | 52.37 |
| B1 | 27,662,982 | 26,610,062 | 3.33G | 0.01 | 96.72 | 92.76 | 52.68 |
| B2 | 33,834,004 | 32,320,326 | 4.04G | 0.01 | 96.69 | 92.78 | 53.7 |
| B3 | 42,327,474 | 38,225,640 | 4.78G | 0.01 | 97.72 | 94.34 | 51.92 |
Identification of differentially
expressed genes in MSL
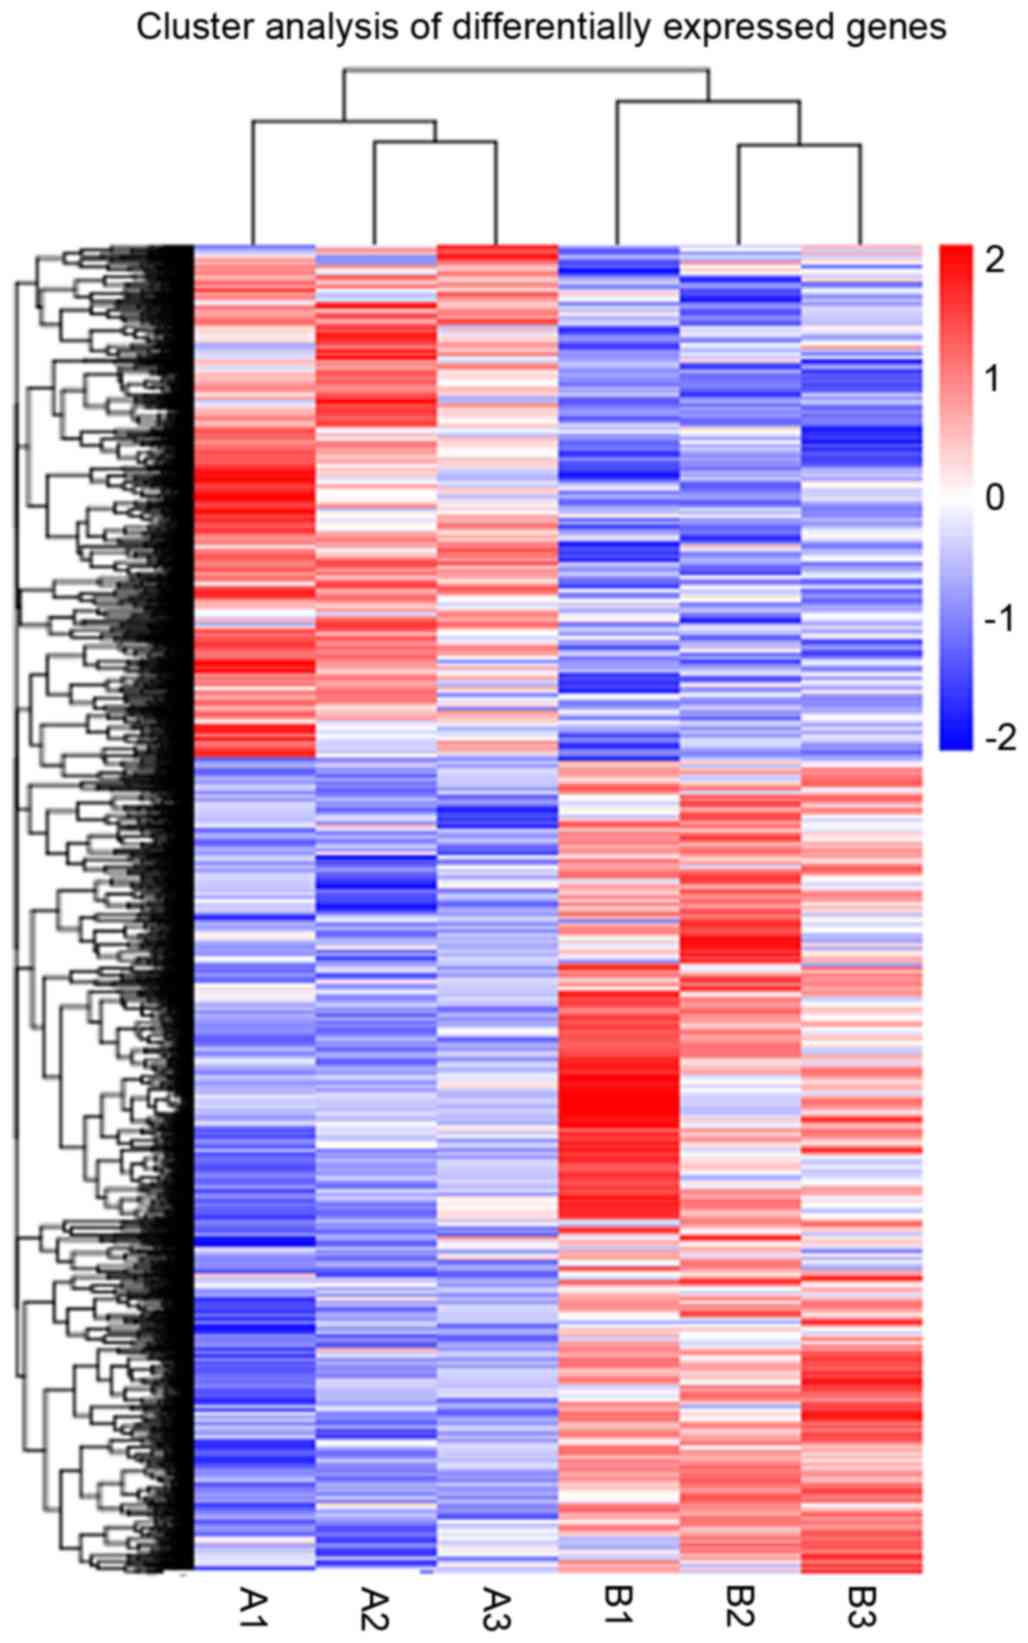
The present study obtained a total of 859 genes that
were differentially expressed in MSL, of which 308 genes were
upregulated and 551 were downregulated (the top 20 up- and
downregulated genes are presented in Tables III and IV). Specifically, expression levels of
C19orf80, apelin (APLN), C21orf33, FAM166B and HSD11B2 were the
most upregulated in MSL, whereas expression levels of FosB
proto-oncogene, AP-1 transcription factor subunit (FOSB), selectin
(SEL) E, RAR related orphan receptor (ROR) B, salt inducible kinase
(SIK)1 and epidermal growth factor-like protein (EGFL) were the
most downregulated. These differentially expressed genes were then
clustered together in Fig. 1,
where the red colored genes are upregulated and the blue colored
genes downregulated. The results verified that MSL vs. the normal
control had differentially expressed genes.
| Table III.Expression of the top twenty
upregulated genes in MSL compared with control, isolated from
abdomen adipose tissue. |
Table III.
Expression of the top twenty
upregulated genes in MSL compared with control, isolated from
abdomen adipose tissue.
| Gene_ID | Gene name | Log2
(Fold change) | P-value |
|---|
|
ENSG00000130173 | C19orf80 | 6.984 |
7.07×10−09 |
|
ENSG00000171388 | APLN | 4.670 |
7.06×10−07 |
|
ENSG00000160221 | C21orf33 | 4.412 |
9.60×10−09 |
|
ENSG00000215187 | FAM166B | 3.693 |
4.14×10−08 |
|
ENSG00000176387 | HSD11B2 | 3.561 |
2.51×10−240 |
|
ENSG00000170522 | ELOVL6 | 3.289 |
8.86×10−06 |
|
ENSG00000142583 | SLC2A5 | 3.286 |
1.53×10−08 |
|
ENSG00000130208 | APOC1 | 3.272 |
1.86×10−05 |
|
ENSG00000132170 | PPARγ | 3.180 |
1.22×10⁻⁴ |
|
ENSG00000186188 | FFAR4 | 3.040 |
1.913×10⁻⁴ |
|
ENSG00000100344 | PNPLA3 | 2.860 |
4.05×10⁻¹⁴ |
|
ENSG00000072310 | SREBF1 | 2.859 |
9.14×10−42 |
|
ENSG00000164308 | ERAP2 | 2.809 |
2.08×10⁻⁴ |
|
ENSG00000123080 | CDKN2C | 2.734 |
1.58×10−06 |
|
ENSG00000236824 | BCYRN1 | 2.632 |
1.70×10⁻¹¹ |
|
ENSG00000224940 | PRRT4 | 2.617 |
2.57×10⁻¹⁹ |
|
ENSG00000087237 | CETP | 2.567 |
5.41×10−06 |
|
ENSG00000151365 | THRSP | 2.519 |
1.84×10−56 |
|
ENSG00000062282 | DGAT2 | 2.494 |
9.13×10−06 |
|
ENSG00000230630 | DNM3OS | 2.426 |
4.93×10−70 |
| Table IV.Expression of the top twenty
downregulated genes in MSL compared with control, isolated from
abdomen adipose tissues. |
Table IV.
Expression of the top twenty
downregulated genes in MSL compared with control, isolated from
abdomen adipose tissues.
| Gene_ID | Gene Name | Log2
(Fold change) | P-value |
|---|
|
ENSG00000125740 | FOSB | −9.845 |
2.67×10−36 |
|
ENSG00000007908 | SELE | −8.243 |
1.00×10−09 |
|
ENSG00000198963 | RORB | −8.123 |
1.365×10⁻⁴ |
|
ENSG00000142178 | SIK1 | −7.702 |
3.94×10−07 |
|
ENSG00000198759 | EGFL6 | −7.664 |
2.06×10−08 |
|
ENSG00000120738 | EGR1 | −7.466 |
1.90×10−06 |
|
ENSG00000122877 | EGR2 | −7.397 |
1.65×10⁻²⁷ |
|
ENSG00000184557 | SOCS3 | −6.572 |
3.17×10⁻³⁰ |
|
ENSG00000073756 | PTGS2 | −6.192 |
4.95×10⁻¹² |
|
ENSG00000162772 | ATF3 | −6.104 |
7.19×10−05 |
|
ENSG00000136244 | IL6 | −6.085 |
2.64×10−42 |
|
ENSG00000123358 | NR4A1 | −5.894 |
5.48×10−59 |
|
ENSG00000170345 | FOS | −5.578 |
1.88×10⁻¹⁰ |
|
ENSG00000183186 | C2CD4C | −5.572 |
4.32×10⁻¹⁵ |
|
ENSG00000172602 | RND1 | −5.462 |
3.90×10−07 |
|
ENSG00000128016 | ZFP36 | −5.381 |
1.23×10⁻⁴ |
|
ENSG00000108342 | CSF3 | −5.324 |
1.65×10−05 |
|
ENSG00000144802 | NFKBIZ | −5.060 |
3.47×10−07 |
|
ENSG00000179388 | EGR3 | −5.047 |
3.50×10⁻²² |
|
ENSG00000171223 | JUNB | −4.924 |
2.28×10−08 |
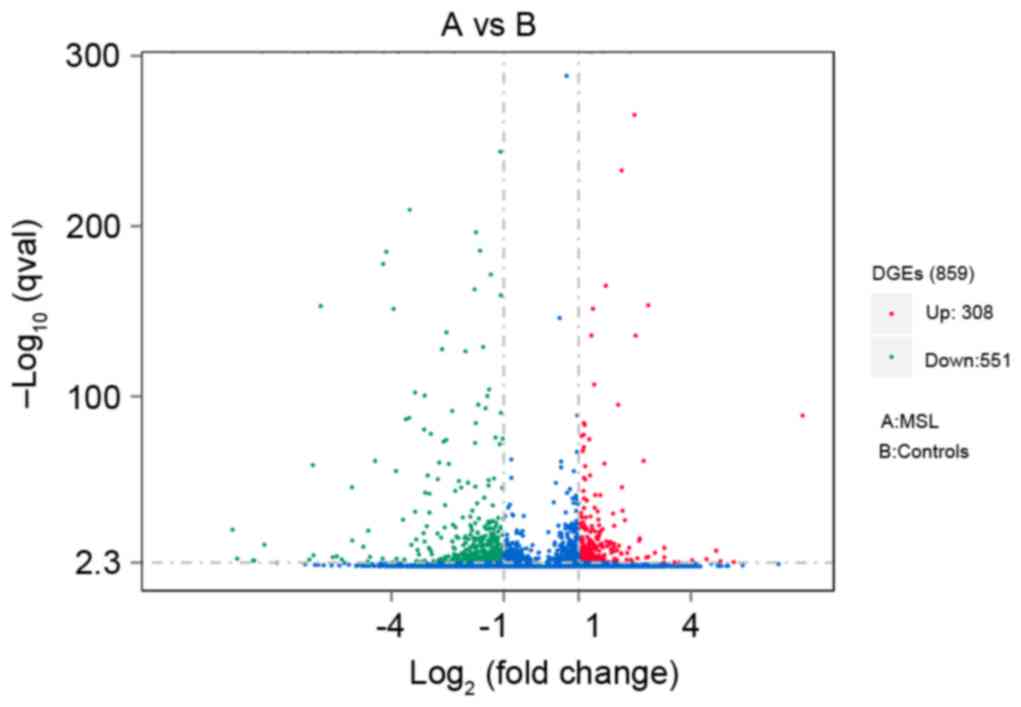
A volcano map (Fig.
2) with log2 (fold change) as the abscissa and
-log10 (q-value) as the ordinate was used to demonstrate
the overall distribution of differentially expressed genes between
MSL and controls. In this volcano map, upregulated genes are
presented as red dots and downregulated genes as green dots.
Functional annotation and pathway
assignment
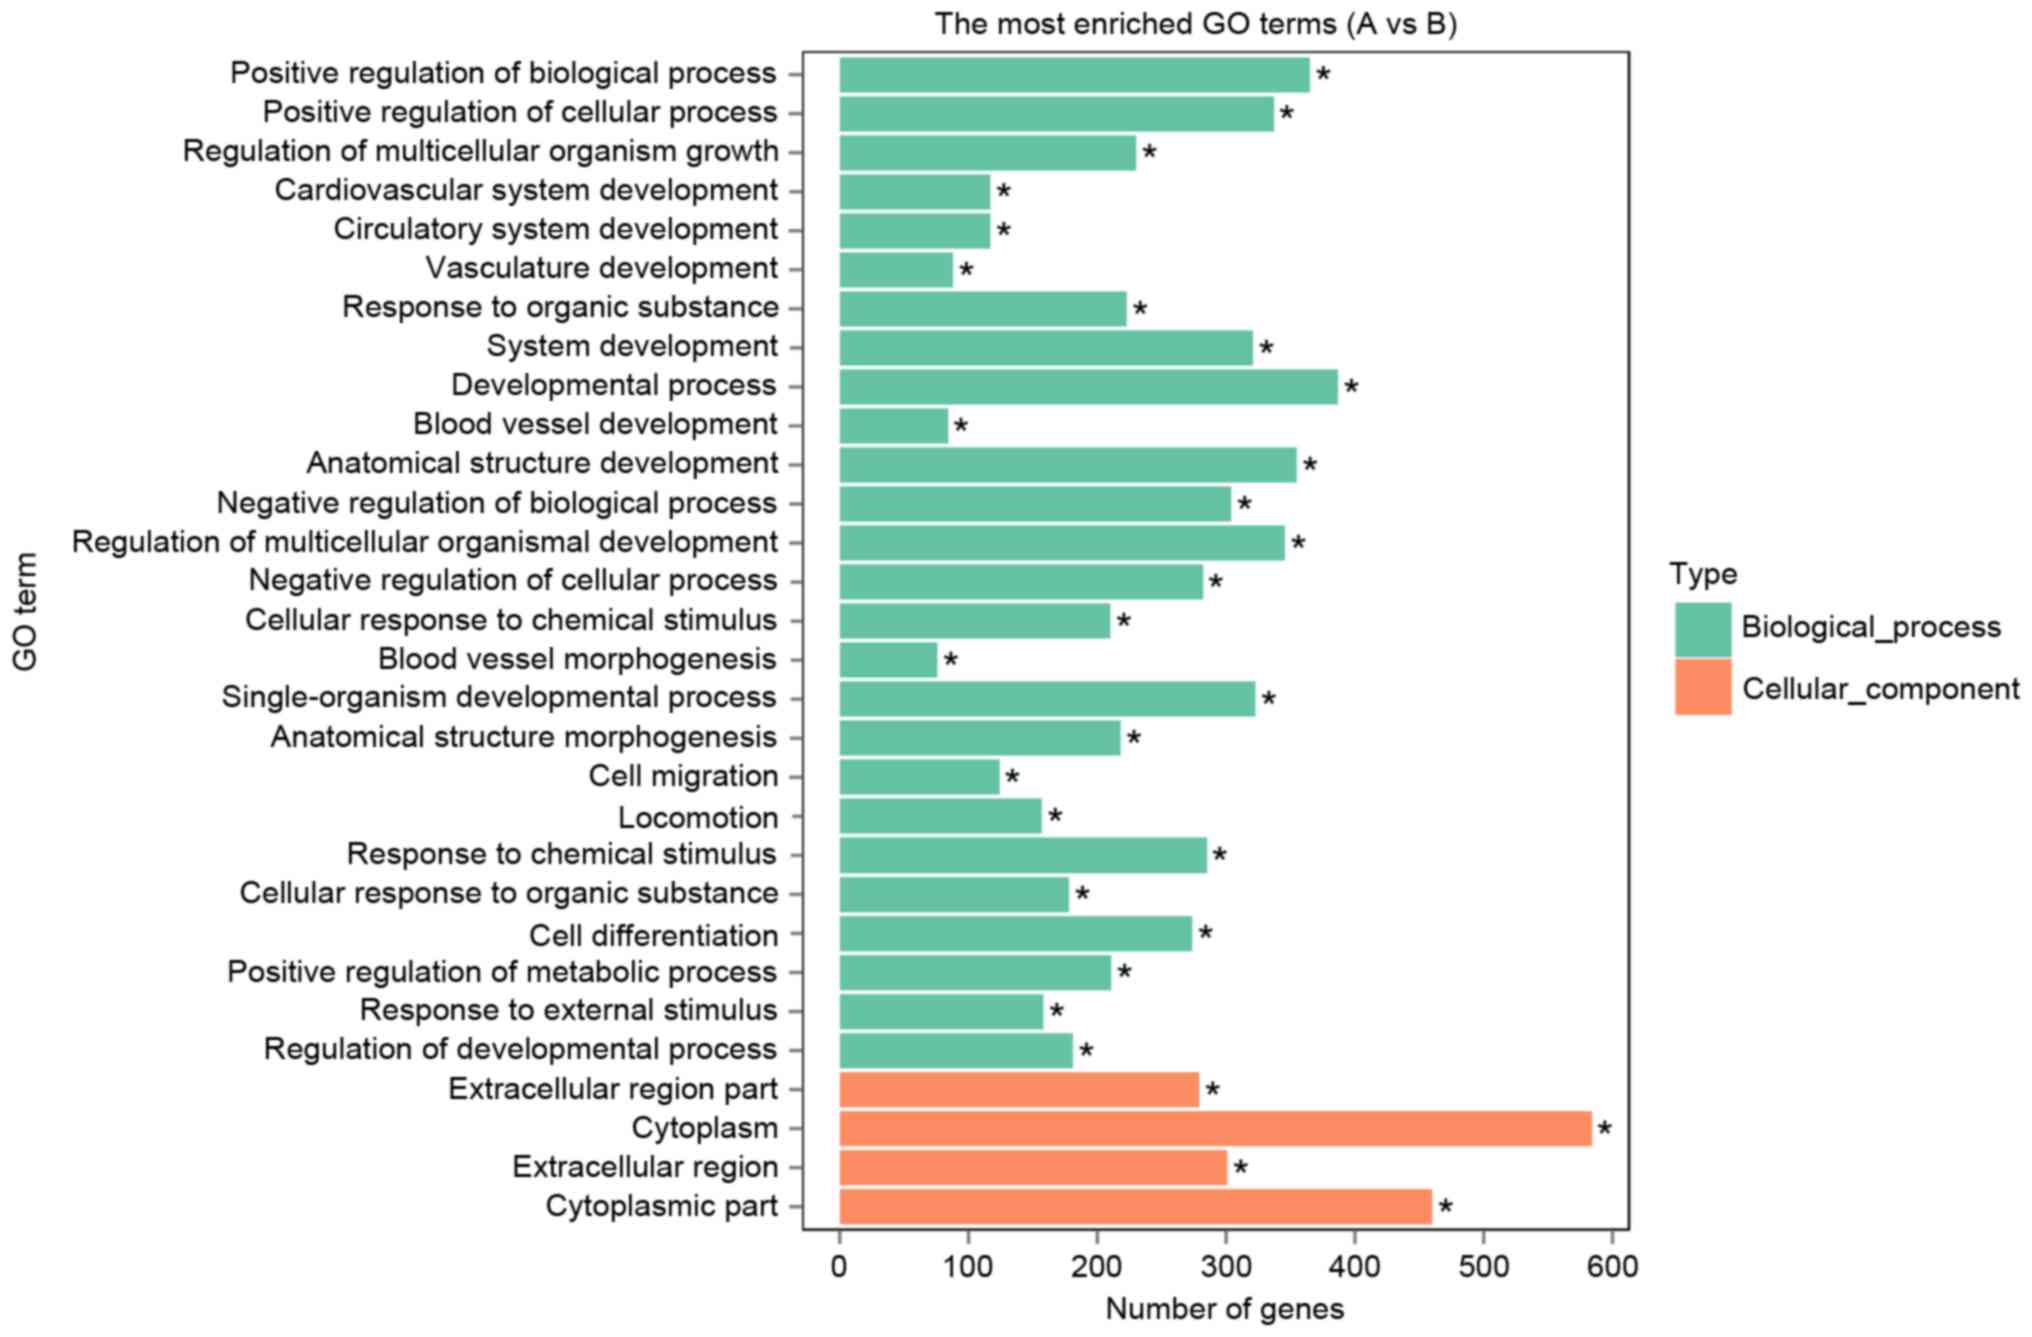
GO term analysis was then performed to group genes
with similar functions and associations, and KEGG was used to group
these differentially expressed genes into gene pathways. These
differentially expressed genes could be enriched into 8,162 GO
categories for different biological processes, cellular components
and molecular functions. As presented in Fig. 3, the top 30 GO categories for 26
different biological processes and 4 cellular components were
identified. Of these 30 GO categories, cellular component
‘cytoplasm’ was the most enriched, involving 584 differentially
expressed genes. Of the 26 biological processes, the GO categories
‘positive regulation of biological process’, ‘positive regulation
of cellular process’ and ‘developmental process’ were most
enriched.
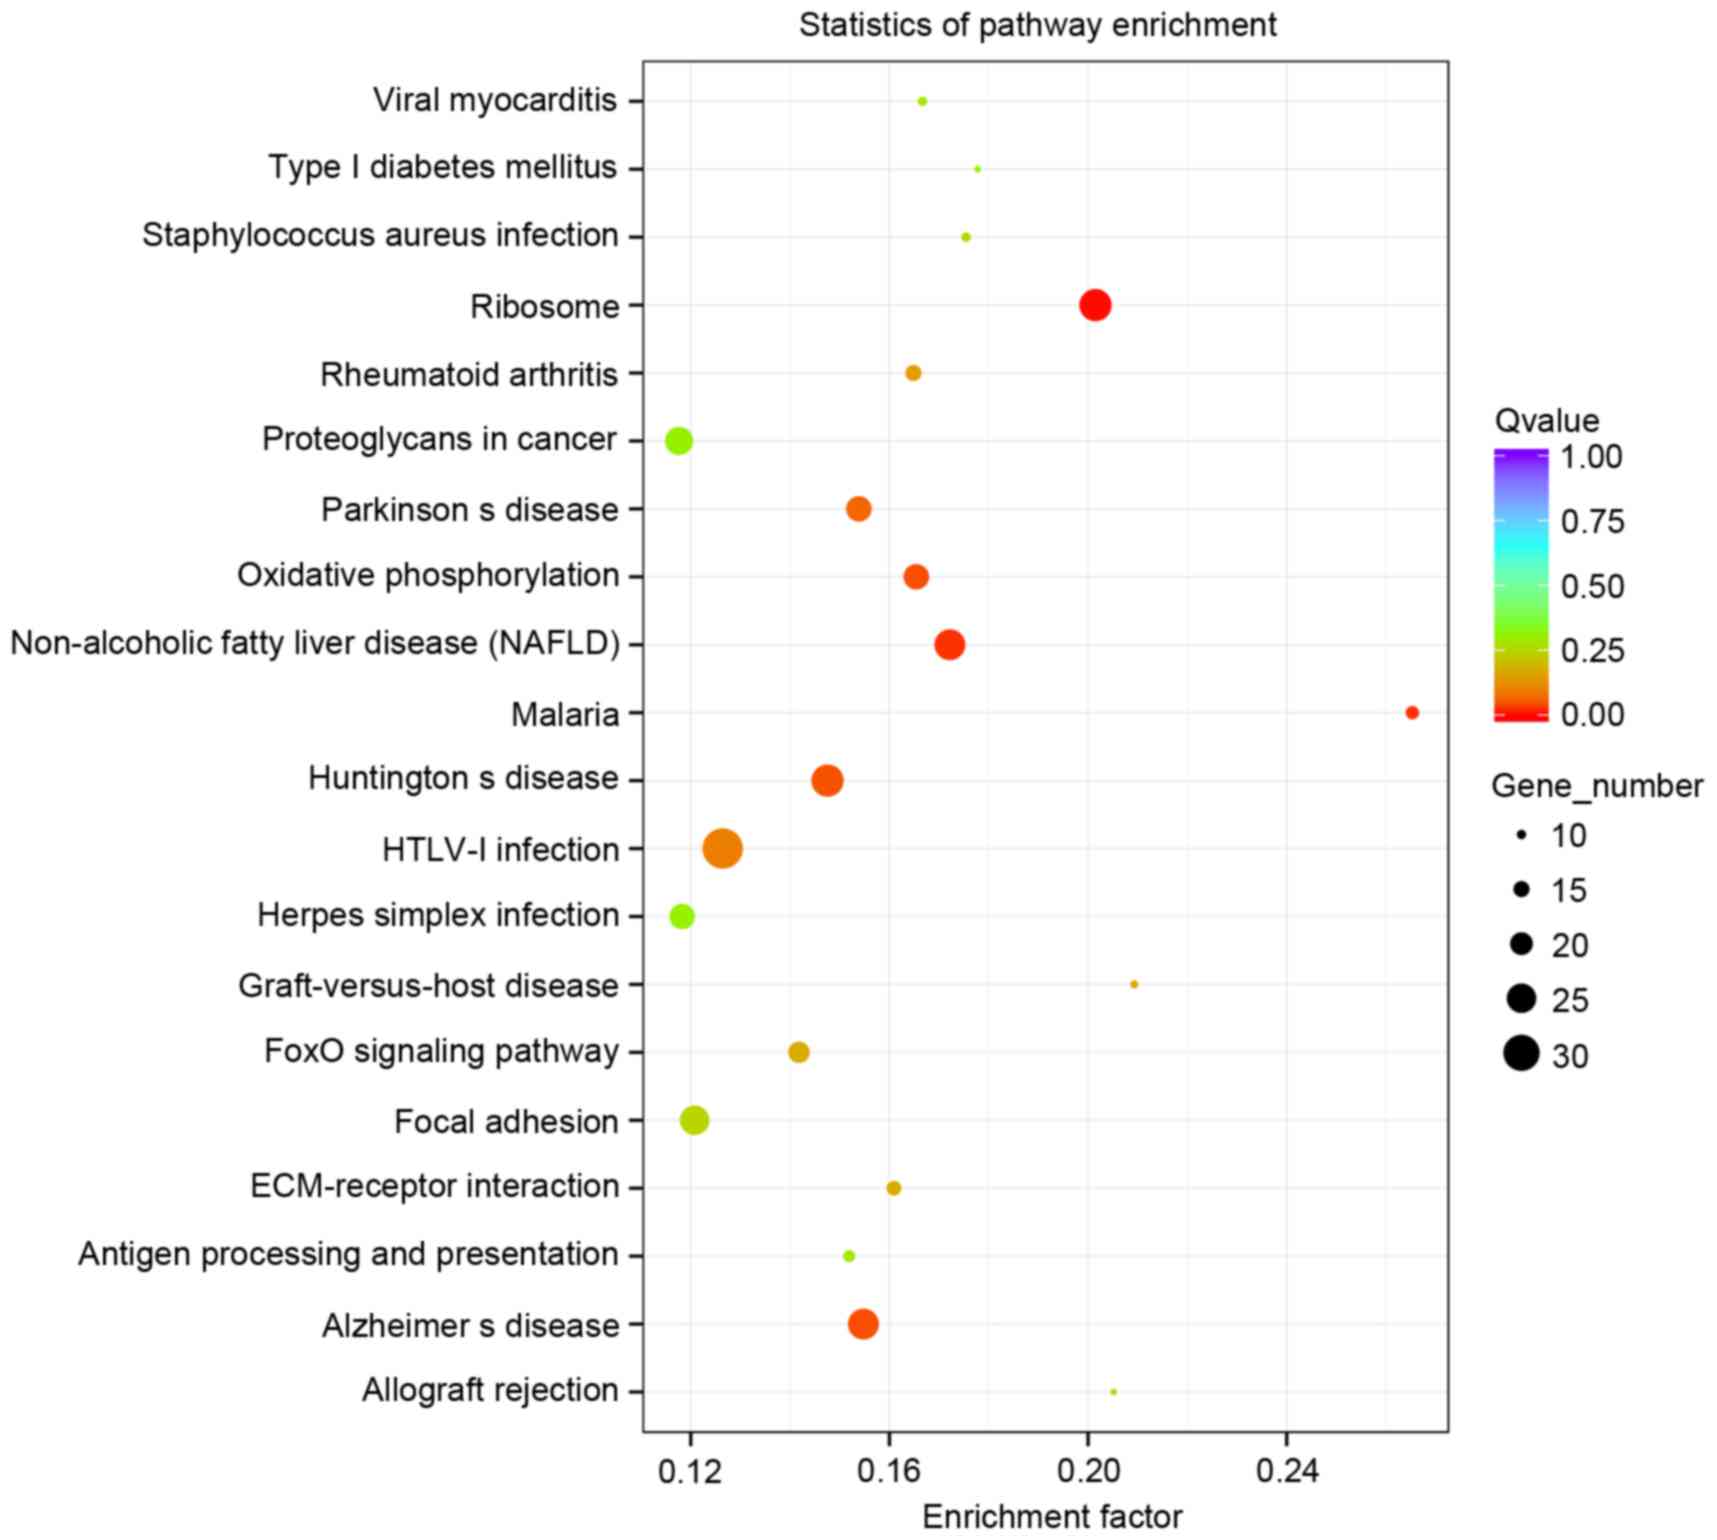
The KEGG pathway database analysis of these
differentially expressed genes enriched 245 gene pathways and
Fig. 4 demonstrates the top 20
pathways, in which 27 differentially expressed genes were enriched
‘ribosome’, 26 differentially expressed genes in ‘non-alcoholic
fatty liver disease (NAFLD)’, 33 differentially expressed genes in
‘HTLV-I infection’ and 26 differentially expressed genes in
Alzheimer's disease (Fig. 4).
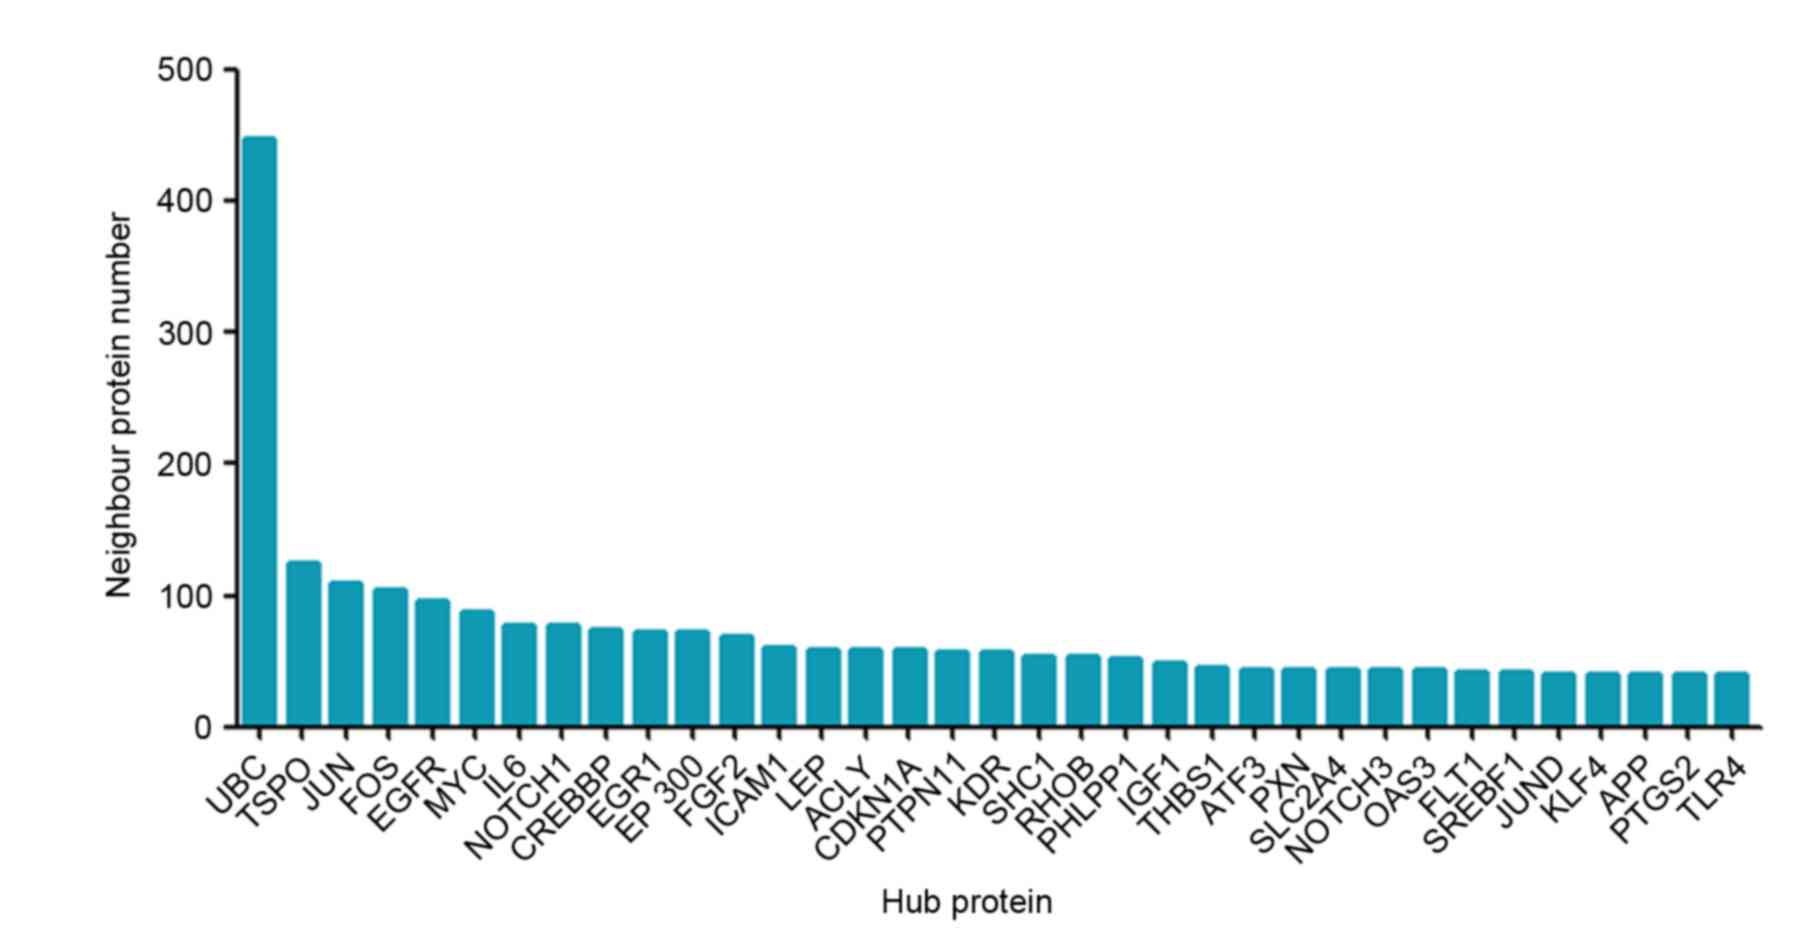
Protein-protein interaction
analysis
Subsequently, protein-protein interaction analysis
of these differentially expressed genes was performed. In Fig. 5, 35 genes were demonstrated to be
linked by more than 40 directed edges, of which ubiquitin C (UBC),
translocator protein (TSPO), Jun Proto-Oncogene, AP-1 Transcription
Factor (JUN) FOS and EGFR were most enriched with neighbor
proteins.
RT-qPCR confirmation of differentially
expressed genes in MSL tissues
The expression of 12 randomly selected
differentially expressed genes in MSL was next verified using
RT-qPCR. The data confirmed that peroxisome proliferator activated
receptor (PPAR)-γ, pyridoxal pyridoxine, vitamin B6 kinase,
phosphogluconolactonase, diacylglycerol O-acyltransferase 1,
homeobox C8, ATP synthase, H+ transporting,
mitochondrial F1 complex, D Subunit A, Thy-1 cell surface antigen
and secretion associated Ras Related GTPase 1A were indeed
significantly upregulated in MSL compared with control. Conversely,
insulin like growth factor 1 receptor, heparin binding EGF like
growth factor, regulator of G-protein signaling 16 and JUNB were
significantly downregulated in MSL (Fig. 6), indicating that these data are
highly consistent with the gene profiling data.
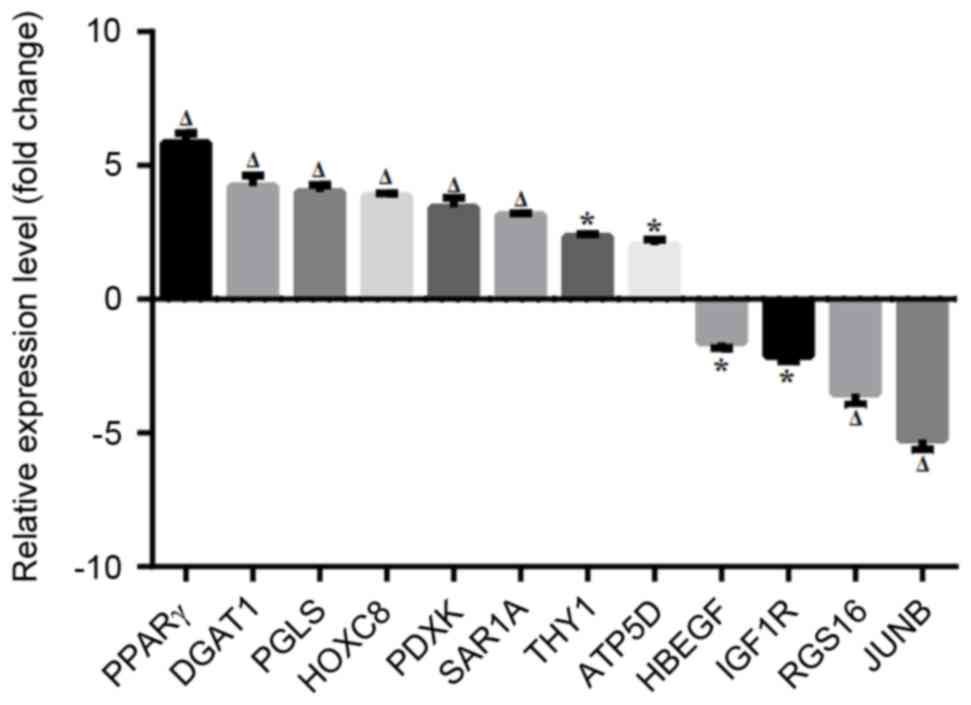 | Figure 6.Validation of differentially
expressed genes using RT-qPCR. MSL tissue specimens were subjected
to RNA isolation and RT-qPCR amplification of randomly selected 12
differentially expressed genes and GAPDH was used for an endogenous
control. Data collected from 3 independent experiments are
presented as means ± standard deviation; *P<0.05,
ΔP<0.01 vs. normal control tissues. MSL, multiple
symmetric lipomatosis; RT-qPCR, reverse transcription-polymerase
chain reaction; PPAR-γ, peroxisome proliferator activated receptor;
PDXK, pyridoxal pyridoxine, vitamin B6 kinase; PGLS,
phosphogluconolactonase; DGAT1, diacylglycerol O-acyltransferase 1;
HOXC8, homeobox C8; ATP5D, ATP synthase, H+
transporting, mitochondrial F1 complex, ∆ Subunit A; THY-1, Thy-1
cell surface antigen; SAR1A, secretion associated Ras Related
GTPase 1A; IGF1R, insulin like growth factor 1 receptor, HBEGF,
heparin binding EGF like growth factor; RGS16, regulator of
G-protein signaling 16; JUNB, Jun Proto-Oncogene, AP-1
Transcription Factor B. |
Discussion
The current study first profiled differentially
expressed genes in MSL compared with normal controls and identified
a total of 859 differentially expressed genes in MSL, of which 308
genes were upregulated and 551 downregulated. The most upregulated
genes in MSL were C19orf80, APLN, C21orf33, FAM166B and HSD11B2,
and the most downregulated genes were FOSB, SELE, RORB, SIK1 and
EGFL6. The current study profiled differentially expressed genes in
MSL and identified gene pathways that may be associated with MSL
development and progression. The data from the current study were
partly consistent with those of a previous study reported by Harsch
et al (28) using ELISA to
detect decreased interleukin (IL)6 and increased leptin (LEP) in
plasma, however are quite different from those of Prantl et
al (21) which demonstrated
that levels of IL6 and tumor necrosis factor (TNF) were
upregulated, as the data from the current study demonstrated
downregulated IL6 and TNF levels. The data from the current study
also failed to demonstrate upregulated levels of UCP1, 2, 3 and 4.
Future studies will further investigate the role of these
differentially expressed genes and gene pathways in MSL development
and progression.
The current study grouped and enriched these
differentially expressed genes into functional groups of genes
using GO categories and KEGG pathway analyses. The data
demonstrated that the ‘cytoplasm’ was the most enriched category in
GO term analysis. The cell cytoplasm is a component where the
majority of gene products are localized, suggesting these genes may
take part in MSL progression in the cytoplasm. Other GO terms were
the ‘positive regulation of biological process’, ‘positive
regulation of cellular process’ and ‘developmental process’. The
development of the cardiovascular symptom is highly associated with
fat accumulation (29,30), suggesting that these differentially
expressed genes may regulate cellular process, particularly
adipocyte development. In pathway analysis, the ‘ribosome’ was most
enriched, followed by ‘NAFLD’, ‘HTLV-I infection’ and ‘Alzheimer's
disease’. The ribosome, the site of protein translation, is formed
by ribosome proteins and RNA, and localized in the cytoplasm. The
present study identified 27 differentially expressed genes that are
ribosome proteins, although there is no study, to the best of the
authors' knowledge, that reports the correlation of MSL with the
ribosome protein, suggesting that these 27 ribosome proteins may
regulate the translation of adipocytokines. There is also no direct
association between NAFLD and MSL in the literature, however NAFLD
pathogenesis is involved in the adipocytokine signaling to promote
adipogenesis, suggesting that NAFLD and MSL may utilize similar
gene pathways. Protein-protein interaction analysis identified that
UBC was in the hub of the network and formed a sub-network by
directly connecting to 447 other proteins (Fig. 5), indicating that UBC serves a role
in MSL development and progression. However, Prantl et al
(21) did not provide data on UBC,
TSPO, JUN, FOS and EGFR, whereas the present study did not find
alterations in the p53 signaling pathway, nuclear receptors and
co-regulators or mitochondrial genes.
UBC protein is a 76-amino acid polypeptide expressed
in all eukaryotes; it is a polyubiquitin precursor that functions
to maintain normal cellular ubiquitin levels under stress
conditions (31). Ubiquitin may
ubiquitinate and modify cellular proteins to alter protein levels,
functions, localization or fate (32,33).
Polyubiquitin-C serves a crucial role in regulation of protein
turnover, particularly under stress conditions (31,32).
Furthermore, the ubiquitin-proteasome system degrades short-lived
regulatory proteins and long-lived structural proteins (33). Once poly-ubiquitinated, proteins
are undergo degradation through the 26S proteasomes. A previous
study demonstrated that accumulation of poly-ubiquitinated proteins
induced by all 3 ω-3 polyunsaturated fatty acids in adipocytes
promotes the degradation of fatty acid synthase and blocks
adipogenesis (34). The current
study identified that UBC as the hub of the network was
downregulated in MSL, suggesting that its downregulation may induce
aberrant fat distribution by decreasing the ubiquitinated proteins
that are involved in the adipocyte proliferation and adipogenesis,
and that UBC may be a critical target in future control of MSL
pathogenesis.
Another protein identified by the protein-protein
interaction analysis was 18 kDa TSPO, which formed a 124-protein
network as direct neighbors (35).
TSPO is known to be involved in cholesterol metabolism, oxidative
stress and cardiovascular pathology, and in various human diseases,
including metastatic cancer, Alzheimer's and Parkinson's diseases,
inflammation and cardiovascular disorders (36–40).
A previous study demonstrated that chronic high fat and cholesterol
diet reduced the TSPO binding capacity in rat livers and aortas,
suggesting that TSPO may be a compensatory responder to the
challenges of the high-fat, high-cholesterol diet as a protection
mechanism against the triggering of cell death (41,42).
Therefore, TSPO may be targeted as a novel strategy to reduce
atherosclerosis risk or control atherosclerosis, although thus far,
there are no studies associating TSPO with MSL.
Certain differentially expressed genes in MSL
appeared to be from the same family of genes, including JUN, JUNB
and JUND, or FOS, FOSB and FOSL2. Previous studies have reported
that, when overexpressed, these gene families impair adipocyte
differentiation and regulate adipogenesis through CCAAT/enhancer
binding protein (C/EBP)-α or C/EBPβ expression to differentiate
mesenchymal cells into adipocytes (43–45).
In the present study, levels of the transcription factors JUN,
JUNB, JUND, FOS, FOSB and FOSL2 were decreased, whereas certain
other critical regulatory genes of adipogenesis and lipid
metabolism, including PPARγ, sterol regulatory element binding
transcription factor 1, C/EBPα, C/EBPβ, insulin induced gene 1,
ELOVL fatty acid elongase 6 and LEP were significantly increased in
MSL adipose tissue compared with normal controls. These data
suggest that altered expression of these genes may participate in
dysregulated adipocyte differentiation, leading to MSL development
and progression.
In conclusion, the present study used differential
gene expression analysis techniques to profile differentially
expressed genes in MSL. A group of differentially expressed genes
were identified in MSL, which exhibit the ability to alter
adipocyte differentiation, lipid metabolism or protein
ubiquitination, and therefore contribute to MSL development and
progression. Future studies may be required to verify these
differentially expressed genes using a larger spread of MSL tissue
samples and explore the role of each differentially expressed gene
and any underlying mechanisms associated with the development and
progression of MSL.
Acknowledgements
The authors would like to thank Medjaden Bioscience
Limited (Hong Kong, China) for assistance in editing of this
manuscript.
References
|
1
|
Brodie BC: Lecture XIV: On Fatty or
Adipose TumorsLectures Illustrative of Various Subjects In
Pathology and Surgery. Longman, Brown, Green and Longmans; London:
pp. 275–282. 1846
|
|
2
|
Nisi G and Sisti A: Images in clinical
medicine. Madelung's disease. N Engl J Med. 374:5722016. View Article : Google Scholar : PubMed/NCBI
|
|
3
|
Rendina D, De Filippo G, Nazzaro A and
Strazzullo P: Impaired gonadal function in a woman with multiple
symmetric lipomatosis. Minerva Endocrinol. 38:211–215.
2013.PubMed/NCBI
|
|
4
|
Palacios E, Neitzschman HR and Nguyen J:
Madelung disease: Multiple symmetric lipomatosis. Ear Nose Throat
J. 93:94–96. 2014.PubMed/NCBI
|
|
5
|
Esteban J, úlvez L, Perelló Aragonés S and
Bargalló X Aguilar: Sleep apnea-hypopnea syndrome and multiple
symmetrical lipomatosis. Arch Bronconeumol. 49:86–87. 2013.(In
English, Spanish). View Article : Google Scholar : PubMed/NCBI
|
|
6
|
Ardeleanu V, Chicos S, Georgescu C and
Tutunaru D: Multiple benign symmetric lipomatosis-a differential
diagnosis of obesity. Chirurgia (Bucur). 108:580–583.
2013.PubMed/NCBI
|
|
7
|
Yeh NC, Yang CY, Chou CW, Yen FC, Lee SY
and Tien KJ: Madelung's disease. J Clin Endocrinol Metab.
97:3012–3013. 2012. View Article : Google Scholar : PubMed/NCBI
|
|
8
|
Tadisina KK, Mlynek KS, Hwang LK, Riazi H,
Papay FA and Zins JE: Syndromic lipomatosis of the head and neck: A
review of the literature. Aesthetic Plast Surg. 39:440–448. 2015.
View Article : Google Scholar : PubMed/NCBI
|
|
9
|
Haap M, Siewecke C, Thamer C, Machann J,
Schick F, Häring HU, Szeimies RM and Stumvoll M: Multiple symmetric
lipomatosis: A paradigm of metabolically innocent obesity? Diabetes
Care. 27:794–795. 2004. View Article : Google Scholar : PubMed/NCBI
|
|
10
|
Chen K, Xie Y, Hu P, Zhao S and Mo Z:
Multiple Symmetric Lipomatosis: Substantial subcutaneous adipose
tissue accumulation did not induce glucose and lipid metabolism
dysfunction. Ann Nutr Metab. 57:68–73. 2010. View Article : Google Scholar : PubMed/NCBI
|
|
11
|
Cojocaru DC, Cozma CD and Postolache P:
Markers of insulin resistance in a case of Launois-Bensaude
syndrome. Rev Med Chir Soc Med Nat Iasi. 117:404–408.
2013.PubMed/NCBI
|
|
12
|
Brea-García B, Cameselle-Teijeiro J,
Couto-González I, Taboada-Suárez A and González-Álvarez E:
Madelung's disease: Comorbidities, fatty mass distribution and
response to treatment of 22 patients. Aesthetic Plast Surg.
37:409–416. 2013. View Article : Google Scholar : PubMed/NCBI
|
|
13
|
Heike Z, Gudrun UM, Frank RD, Vetter H and
Walger P: Multiple benign symmetric lipomatosis-a differential
diagnosis of obesity: Is there a rationale for fibrate treatment?
Obes Surg. 18:240–242. 2008. View Article : Google Scholar : PubMed/NCBI
|
|
14
|
Verhelle NA, Nizet JL, van den Hof B,
Guelinckx P and Heymans O: Liposuction in benign symmetric
lipomatosis: Sense or senseless? Aesthetic Plast Surg. 27:319–321.
2003. View Article : Google Scholar : PubMed/NCBI
|
|
15
|
Enzi G, Busetto L, Sergi G, Coin A,
Inelmen EM, Vindigni V, Bassetto F and Cinti S: Multiple symmetric
lipomatosis: A rare disease and its possible links to brown adipose
tissue. Nutr Metab Cardiovasc Dis. 25:347–353. 2015. View Article : Google Scholar : PubMed/NCBI
|
|
16
|
Ballester S, ánchez R, Mira MÁ Navarro,
Marco C Pujol and Estrada R Botella: Symmetric benign lipomatosis:
Madelung syndrome. Med Clin (Barc). 141:366–367. 2013.(In Spanish).
View Article : Google Scholar : PubMed/NCBI
|
|
17
|
Kobayashi J, Nagao M, Miyamoto K and
Matsubara S: MERRF syndrome presenting with multiple symmetric
lipomatosis in a Japanese patient. Intern Med. 49:479–482. 2010.
View Article : Google Scholar : PubMed/NCBI
|
|
18
|
Schoffer K and Grant I: Multiple lipomas,
alcoholism, and neuropathy: Madelung's disease or MERRF? Muscle
Nerve. 33:142–146. 2006. View Article : Google Scholar : PubMed/NCBI
|
|
19
|
Nisoli E, Regianini L, Briscini L,
Bulbarelli A, Busetto L, Coin A, Enzi G and Carruba MO: Multiple
symmetric lipomatosis may be the consequence of defective
noradrenergic modulation of proliferation and differentiation of
brown fat cells. J Pathol. 198:378–387. 2002. View Article : Google Scholar : PubMed/NCBI
|
|
20
|
Plummer C, Spring PJ, Marotta R, Chin J,
Taylor G, Sharpe D, Athanasou NA, Thyagarajan D and Berkovic SF:
Multiple symmetrical lipomatosis-a mitochondrial disorder of brown
fat. Mitochondrion. 13:269–276. 2013. View Article : Google Scholar : PubMed/NCBI
|
|
21
|
Prantl L, Schreml J, Gehmert S, Klein S,
Bai X, Zeitler K, Schreml S, Alt E, Gehmert S and Felthaus O:
Transcription profile in sporadic multiple symmetric lipomatosis
reveals differential expression at the level of adipose
tissue-derived stem cells. Plast Reconstr Surg. 137:1181–1190.
2016. View Article : Google Scholar : PubMed/NCBI
|
|
22
|
Chen K, He H, Xie Y, Zhao L, Zhao S, Wan
X, Yang W and Mo Z: miR-125a-3p and miR-483-5p promote adipogenesis
via suppressing the RhoA/ROCK1/ERK1/2 pathway in multiple symmetric
lipomatosis. Sci Rep. 5:119092015. View Article : Google Scholar : PubMed/NCBI
|
|
23
|
Wang L, Feng Z, Wang X, Wang X and Zhang
X: DEGseq: An Rpackage for identifying differentially expressed
genes from RNA-seq data. Bioinformatics. 26:136–138. 2010.
View Article : Google Scholar : PubMed/NCBI
|
|
24
|
Benjamini Y and Hochberg Y: Controlling
the false discovery rate: A practical and powerful approach to
multipletesting. J R Statist Soc. 57:289–300. 1995.
|
|
25
|
Mao X, Cai T, Olyarchuk JG and Wei L:
Automated genome annotation and pathway identification using the
KEGG Orthology (KO) as a controlled vocabulary. Bioinformatics.
21:3787–3793. 2005. View Article : Google Scholar : PubMed/NCBI
|
|
26
|
Kanehisa M, Araki M, Goto S, Hattori M,
Hirakawa M, Itoh M, Katayama T, Kawashima S, Okuda S, Tokimatsu T
and Yamanishi Y: KEGG for linking genomes to life and the
environment. Nucleic Acids Res. 36(Database Issue): D480–D484.
2008.PubMed/NCBI
|
|
27
|
Livak KJ and Schmittgen TD: Analysis of
relative gene expression data using real-time quantitative PCR and
the 2(-Delta Delta C(T)) method. Methods. 25:402–408. 2001.
View Article : Google Scholar : PubMed/NCBI
|
|
28
|
Harsch IA, Bergmann T, Koebnick C,
Wiedmann R, Ruderich F, Hahn EG and Konturek PC: Adiponectin,
resistin and subclinical inflammation-the metabolic burden in
Launois Bensaude Syndrome, a rare form of obesity. J Physiol
Pharmacol. 58 Suppl 1:S65–S76. 2007.
|
|
29
|
Ouchi N: Adipocytokines in cardiovascular
and metabolic diseases. J Atheroscler Thromb. 23:645–654. 2016.
View Article : Google Scholar : PubMed/NCBI
|
|
30
|
Matsuzawa Y: Therapy insight:
Adipocytokines in metabolic syndrome and related cardiovascular
disease. Nat Clin Pract Cardiovasc Med. 3:35–42. 2006. View Article : Google Scholar : PubMed/NCBI
|
|
31
|
Ryu KY, Maehr R, Gilchrist CA, Long MA,
Bouley DM, Mueller B, Ploegh HL and Kopito RR: The mouse
polyubiquitin gene UbC is essential for fetal liver development,
cell-cycle progression and stress tolerance. EMBO J. 26:2693–2706.
2007. View Article : Google Scholar : PubMed/NCBI
|
|
32
|
Dikic I, Wakatsuki S and Walters KJ:
Ubiquitin-binding domains-from structures to functions. Nat Rev Mol
Cell Biol. 10:659–671. 2009. View
Article : Google Scholar : PubMed/NCBI
|
|
33
|
Ciechanover A: Intracellular protein
degradation: From a vague idea through the lysosome and the
ubiquitin-proteasome system and onto human diseases and drug
targeting. Neurodegener Dis. 10:7–22. 2012. View Article : Google Scholar : PubMed/NCBI
|
|
34
|
Wójcik C, Lohe K, Kuang C, Xiao Y, Jouni Z
and Poels E: Modulation of adipocyte differentiation by omega-3
polyunsaturated fatty acids involves the ubiquitin-proteasome
system. J Cell Mol Med. 18:590–599. 2014. View Article : Google Scholar : PubMed/NCBI
|
|
35
|
Santoro A, Raso G Mattace, Taliani S, Da
Pozzo E, Simorini F, Costa B, Martini C, Laneri S, Sacchi A,
Cosimelli B, et al: TSPO-ligands prevent oxidative damage and
inflammatory response in C6 glioma cells by neurosteroid synthesis.
Eur J Pharm Sci. 88:124–131. 2016. View Article : Google Scholar : PubMed/NCBI
|
|
36
|
Wyatt SK, Manning HC, Bai M, Ehtesham M,
Mapara KY, Thompson RC and Bornhop DJ: Preclinical molecular
imaging of the translocator protein (TSPO) in a metastases model
based on breast cancer xenografts propagated in the murine brain.
Curr Mol Med. 12:458–466. 2012. View Article : Google Scholar : PubMed/NCBI
|
|
37
|
Repalli J: Translocator protein (TSPO)
role in aging and Alzheimer's disease. Curr Aging Sci. 7:168–175.
2014. View Article : Google Scholar : PubMed/NCBI
|
|
38
|
Cumming P and Borghammer P: Molecular
imaging and the neuropathologies of Parkinson's disease. Curr Top
Behav Neurosci. 11:117–148. 2012. View Article : Google Scholar : PubMed/NCBI
|
|
39
|
Qi X, Xu J, Wang F and Xiao J:
Translocator protein (18 kDa): A promising therapeutic target and
diagnostic tool for cardiovascular diseases. Oxid Med Cell Longev.
2012:1629342012. View Article : Google Scholar : PubMed/NCBI
|
|
40
|
Li F, Liu J, Liu N, Kuhn LA, Garavito RM
and Ferguson-Miller S: Protein 18 kDa (TSPO): An Old protein with
new functions? Biochemistry. 55:2821–2831. 2016. View Article : Google Scholar : PubMed/NCBI
|
|
41
|
Dimitrova-Shumkovska J, Veenman L,
Ristoski T, Leschiner S and Gavish M: Chronic high fat, high
cholesterol supplementation decreases 18 kDa translocator protein
binding capacity in association with increased oxidative stress in
rat liver and aorta. Food Chem Toxicol. 48:910–921. 2010.
View Article : Google Scholar : PubMed/NCBI
|
|
42
|
Lecanu L, Yao ZX, McCourty A, Sidahmed
el-K, Orellana ME, Burnier MN and Papadopoulos V: Control of
hypercholesterolemia and atherosclerosis using the cholesterol
recognition/interaction amino acid sequence of the translocator
protein TSPO. Steroids. 78:137–146. 2013. View Article : Google Scholar : PubMed/NCBI
|
|
43
|
Wagner EF and Eferl R: Fos/AP-1 proteins
in bone and the immune system. Immunol Rev. 208:126–140. 2005.
View Article : Google Scholar : PubMed/NCBI
|
|
44
|
Kveiborg M, Sabatakos G, Chiusaroli R, Wu
M, Philbrick WM, Horne WC and Baron R: DeltaFosB induces
osteosclerosis and decreases adipogenesis by two independent
cell-autonomous mechanisms. Mol Cell Biol. 24:2820–2830. 2004.
View Article : Google Scholar : PubMed/NCBI
|
|
45
|
Luther J, Driessler F, Megges M, Hess A,
Herbort B, Mandic V, Zaiss MM, Reichardt A, Zech C, Tuckermann JP,
et al: Elevated Fra-1 expression causes severe lipodystrophy. J
Cell Sci. 124:1465–1476. 2011. View Article : Google Scholar : PubMed/NCBI
|