Introduction
Lung cancer is the type of cancer with the highest
incidence rate worldwide (1). Lung
adenocarcinoma is the most common histological type, accounting for
~50% of all lung cancer cases (2–4). The
prognosis for lung adenocarcinoma is generally poor, since its
histopathological sub-classification is unclear and it tends to
metastasize widely at an early stage of the disease (5,6).
Therefore, the majority of patients with metastatic adenocarcinoma
receive empirical chemotherapy regimens (7). Different genetic or molecular
backgrounds may affect the response of an individual to cancer
treatment and finally lead to a survival discrepancy (8). Thus, improved understanding of the
mechanisms underlying the occurrence and development of lung
adenocarcinoma is needed, and prognostic factors that identify
patients at high risk for recurrence or metastasis are urgently
required.
Among the numerous pathogenic factors of lung
adenocarcinoma, long non-coding RNAs (lncRNAs), which are ncRNAs of
>200 nucleotides in length, have attracted great interest. Lung
adenocarcinoma-associated lncRNAs are increasingly being
identified. For example, colon cancer associated transcript 2, a
lung adenocarcinoma-specific lncRNA, promotes the invasion of
non-small cell lung cancer and may be a potential biomarker for
lymph node metastasis (9). HNF1A
antisense RNA 1 is overexpressed in lung adenocarcinoma compared
with corresponding non-tumor tissues, and its expression level is
significantly associated with Tumor-Node-Metastasis (TNM) stage,
tumor size and lymph node metastasis, leading to worse overall
survival (10). The expression of
the lncRNAs DKFZP434 L187 and LOC285548 have been demonstrated to
be negatively associated with the overall survival of patients with
lung adenocarcinoma (3). A total
of three differentially expressed lncRNAs [maternally expressed 3
(MEG3), myocardial infarction associated transcript (MIAT) and
MIR4697 host gene) are reportedly associated with clinical features
of lung adenocarcinoma, while nine differentially expressed lncRNAs
[long intergenic non-protein coding RNA 115 (LINC00115), long
intergenic non-protein coding RNA 265, long intergenic non-protein
coding RNA 1001, long intergenic non-protein coding RNA 1002, MIR22
host gene, NFYC antisense RNA 1, small nucleolar RNA host gene 10,
THUMPD3 antisense RNA 1 and TMPO antisense RNA 1] were revealed as
prognostic biomarkers for lung adenocarcinoma (11). MEG3 and MIAT may be important in
the development of lung adenocarcinoma via their interactions with
microRNA (miR)-106, with the consequent regulation of
mitogen-activated protein kinase (MAPK)9 in MAPK signaling
pathways, while LINC00115 may interact with miR-7 to regulate
fibroblast growth factor 2 and thus be involved in ‘pathways in
cancer’ (11).
Despite the marked progress that has been made, the
prognostic roles of lncRNAs in lung adenocarcinoma and the
underlying mechanisms remain poorly characterized. Further
functional studies are required to identify additional lung
adenocarcinoma associated lncRNAs and verify their functional
mechanisms in lung adenocarcinoma.
In the present study, extensive RNA sequencing
(RNA-seq) data and clinical survival prognosis information from
patients with lung adenocarcinoma was downloaded from The Cancer
Genome Atlas (TCGA) and the Gene Expression Omnibus (GEO) databases
at the National Center for Biotechnology Information (NCBI), in
order to construct a co-expression network and mine network modules
with particular biological functions. Our goal was to construct a
prognostic risk assessment model based on the expression of these
lncRNAs. The reliability of the prognostic risk assessment model
was further validated in two independent datasets. Target genes
regulated by the prognostic lncRNAs were investigated, lncRNA-mRNA
networks were built, and Kyoto Encyclopedia of Genes and Genomes
(KEGG) pathway enrichment analysis was performed to decipher the
possible biological function of the prognostic lncRNAs in the
pathogenesis of lung adenocarcinoma.
Materials and methods
Data
TCGA database (https://gdc-portal.nci.nih.gov) was used to download
mRNA-seq expression profiles of lung adenocarcinoma, which included
513 lung adenocarcinoma samples detected in the Illumina HiSeq 2000
RNA Sequencing platform. The NCBI GEO database (http://www.ncbi.nlm.nih.gov/geo) was also used
for a search based on the key word ‘lung adenocarcinoma’ to
retrieve all publicly uploaded expression profiles. According to
the different data screening criteria, dataset I and dataset II
were obtained. The screening criteria of dataset I were gene
expression data, solid tissue lung cancer specimens (non-blood,
non-cell lines etc.), human expression profiles and a total number
of samples ≥80. A total of three chip datasets [GSE30219 (12), GSE37745 (13) and GSE50081 (14)] were included in the analysis, which
contained 84, 106 and 127 samples, respectively. The detection
platform was the Affymetrix-GPL570 (Affymetrix; Thermo Fisher
Scientific, Inc., Waltham, MA, USA).
The screening criteria of dataset II were gene
expression data, lung adenocarcinoma tumor tissue specimens
(non-blood and non-cell lines) patients, presence of control
tissues, human expression profiles and a total number of samples
≥100. Finally, a total of four sets was included in the analysis of
the microarray datasets [GSE32863 (15), GSE75037 (16), GSE10072 (17) and GSE43458 (18)]. They included 116 (58 tumor and 58
normal control), 166 (83 tumor and 83 normal control), 107 (58
tumor and 49 normal control) and 110 (80 tumor and 30 normal
control) samples, respectively. The detection platforms for the
samples were the Illumina-GPL6884 (Illumina, Inc., San Diego, CA,
USA), Affymetrix-GPL96 (Affymetrix; Thermo Fisher Scientific, Inc.)
and Agilent-GPL6244 (Agilent Technologies, Inc., Santa Clara, CA,
USA) systems.
Data preprocessing
The original format of the downloaded expression
spectrum data was divided into three different formats, according
to the different detection platforms. The original expression data
were preprocessed in the following three different ways. In the
first approach, the expression profile data files were downloaded
from the Affy platform in the original CEL format, and their
formats were transformed using the oligo package, version 1.41.1,
in R language 3.4.1 (19)
(http://www.bioconductor.org/packages/release/bioc/html/oligo.html).
The median method was supplemented using the missing values, and
the data were standardized using MAS 5.0 algorithm (19) and the quantile method.
In the second approach, the expression profile data
file was downloaded from the Illumina and Agilent platforms in the
original TXT format. The log2 logarithm was performed using the
Limma package, version 3.34.0, in R language 3.4.1 (20) (https://bioconductor.org/packages/release/bioc/html/limma.html)
to transform the expressed data from a partial distribution to an
approximate normal distribution. The data normalization was
performed using the median method.
In the third approach, fragments per kilobase of
exon per million fragments mapped expression profile data
downloaded from TCGA dataset were normalized using the quantile
standardization method in the preprocessCore package, version
1.40.0, of R language 3.4.1 (21)
(http://bioconductor.org/packages/release/bioc/html/preprocessCore.html).
Ref_seq and Transcript_ID provided by the annotation
platforms were used to annotate the lncRNAs. Comparisons between
the detection sequence provided by the platform and the human
genome sequence (version GRCh38) were performed using Clustal 2
(22) (http://www.clustal.org/clustal2). Finally, multiple
annotation results were combined to identify each lncRNA and its
corresponding expression information.
Selection of stable modules using
weighted gene co-expression network analysis (WGCNA)
As a bioinformatics algorithm, WGCNA is commonly
used to construct co-expression networks to identify modules
associated with diseases to screen important pathogenic mechanisms
or potential therapeutic targets (23). In this study, the stable modules
associated with lung adenocarcinoma were selected from the
co-expression networks built using the WGCNA package, version 1.61,
(https://cran.r-project.org/web/packages/WGCNA/index.html)
(24) in R language 3.4.1, on the
basis of the GSE50081 dataset. The GSE30219 and GSE37745 datasets
in this section were used as validation sets. The WGCNA algorithm
was executed in three steps: i) Calculation of the correlated
expression between two of the three aforementioned datasets
selected randomly; ii) definition of adjacency function; and iii)
module partition. A module containing ≥100 RNAs with cutHeight =
0.99 was set as the screening threshold for module partition. The
functions of the significantly stable modules were annotated using
the userListEnrichment function, and lncRNAs in the stable module
were defined as those with an association with lung
adenocarcinoma.
MetaDE analysis of expression
differences in integrated multi-data
The meta-analysis of the GSE32863, GSE75037,
GSE10072 and GSE43458 datasets was performed using MetaDE.ES of the
MetaDE package (https://cran.r-project.org/web/packages/MetaDE)
(25,26) in R language 3.4.1. The aim was a
comprehensive screen of significantly differently expressed RNAs
with consistent expression across these four datasets between lung
adenocarcinoma and control samples. Thresholds of tau2 = 0 and
Qpval >0.05 were set as consistency selection parameters.
P-values and false discovery rate values <0.05 were selected as
the significant difference screening parameters to identify
expression differences in lncRNAs.
Construction of risk prediction
model
Based on the important lncRNAs that were validated
as being associated with lung adenocarcinoma through the
aforementioned analyses, the optimal prognostic lncRNA combination
was screened using the Cox proportional hazards (Cox-PH) (27) model, according to the L1-penalized
regular regression algorithm. The screening model was derived from
the penalized package (28)
(http://bioconductor.org/packages/penalized/) in R
language 3.4.1, in which the optimized parameter of ‘lambda’ was
obtained using the 1,000 cycle calculation of cross-validation
likelihood (CVL). The sample risk assessment system was established
based on the lncRNA expression, which was weighted by the
regression coefficient of each lncRNA in the optimal combination,
and the risk-score of each sample was obtained. The risk assessment
score was calculated as follows:
Risk-score = β lncRNA1 × exprlncRNA1 + ··· + β
lncRNAn × exprlncRNAn.
The GSE37745 dataset was used as a validation
dataset, which was performed using WGCNA analysis along with
GSE50081, and TCGA dataset was used as an independent validation
dataset to evaluate the risk of concentrating samples. The
viability of the risk-score model was judged by the significance of
the prognosis difference between the two groups, with high and low
risks identified by this model.
Analysis of important
lncRNA-associated pathways
KEGG pathways were enriched using the Gene Set
Enrichment Analysis (GSEA) method (http://software.broadinstitute.org/gsea/index.jsp)
(29). Signaling pathways that
significantly correlated with lncRNAs were screened out when the
gene sets had been extracted from the corresponding important
lncRNA modules. The basic principle of GSEA is to use a predefined
gene set that usually comes from functional annotations, such as
the KEGG pathway, or previous experimental results, to rank genes
according to their expression levels in samples, and to test
whether the predefined gene set is enriched in the top or the
bottom of the ranking table. GSEA analysis is able to evaluate gene
sets rather than single gene expression changes; thus, it may
contain these subtle expression changes, with better results
expected.
Results
Screening of stable modules
significantly correlated with lung adenocarcinoma using WGCNA
algorithm
RNA of each dataset was annotated when the
expression profiles of the downloaded datasets had been
standardized. There were 15,988 mRNAs and 851 lncRNAs shared in the
GSE30219, GSE37745 and GSE50081 datasets. Using GSE50081 expression
data as the training set and the remaining data as the validation
set, RNA modules significantly associated with lung adenocarcinoma
were selected using the WGCNA algorithm. The steps and results are
described as follows.
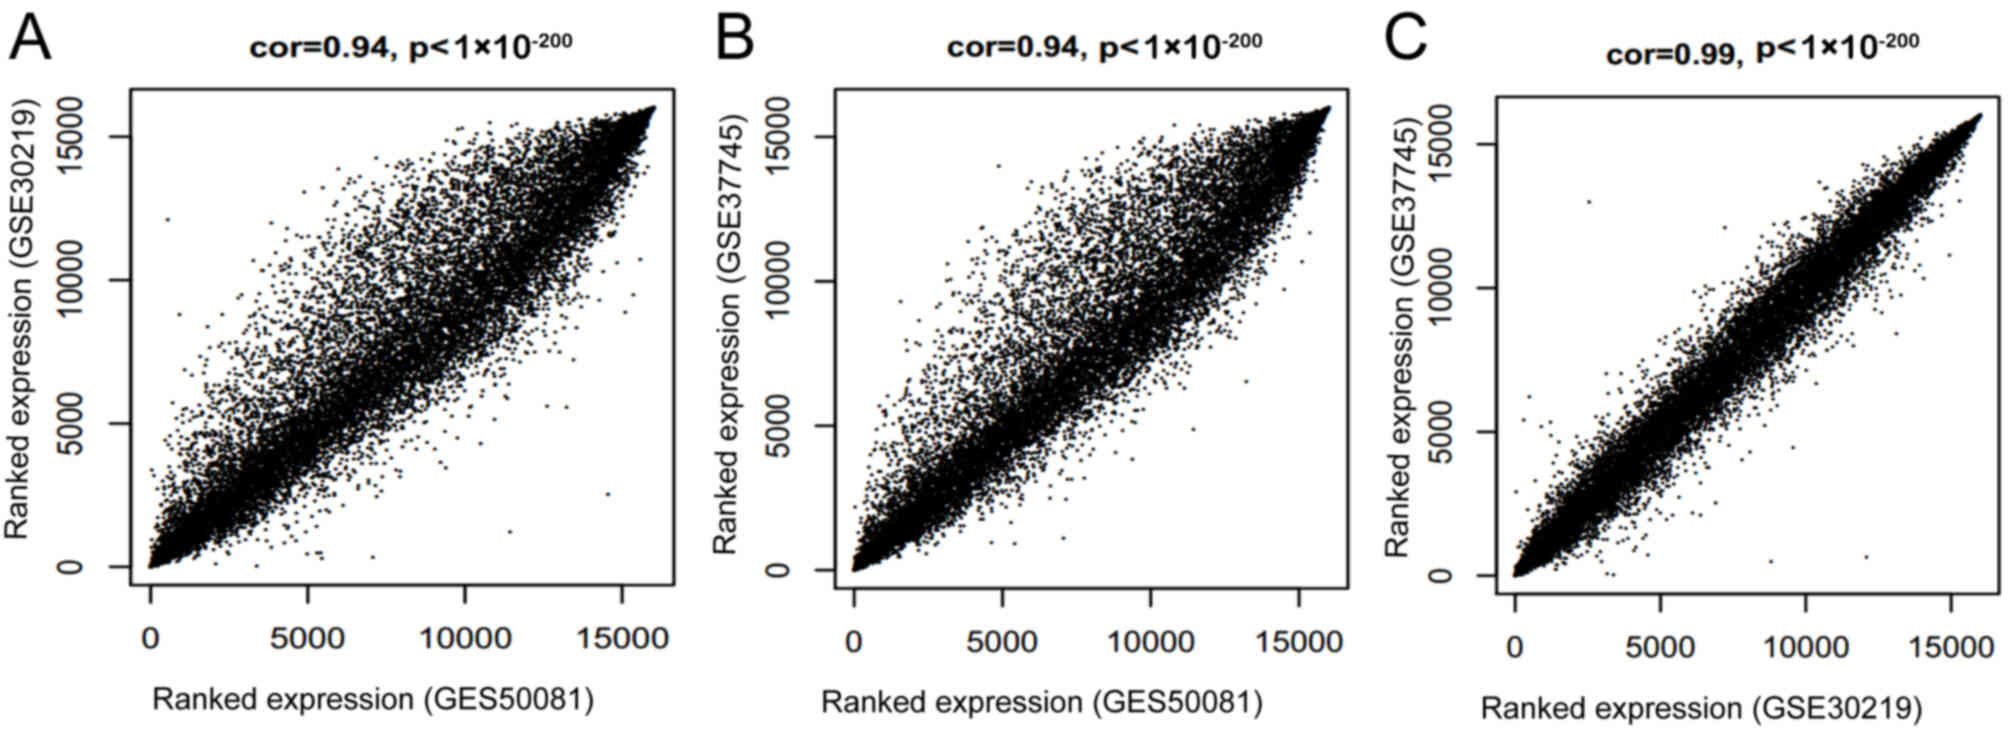
Correlation analysis of RNA expression
among the three datasets
The consistency of expression values of the common
RNAs was first checked in the three datasets to ensure the
comparability of RNA expression levels in each dataset. The results
indicated that the correlation distribution of RNA expression
levels among the three datasets always exceeded 0.9, while the
P-values were all <1×10−200 (Fig. 1). The results suggested a
significantly positive correlation between each paired combination
of the datasets.
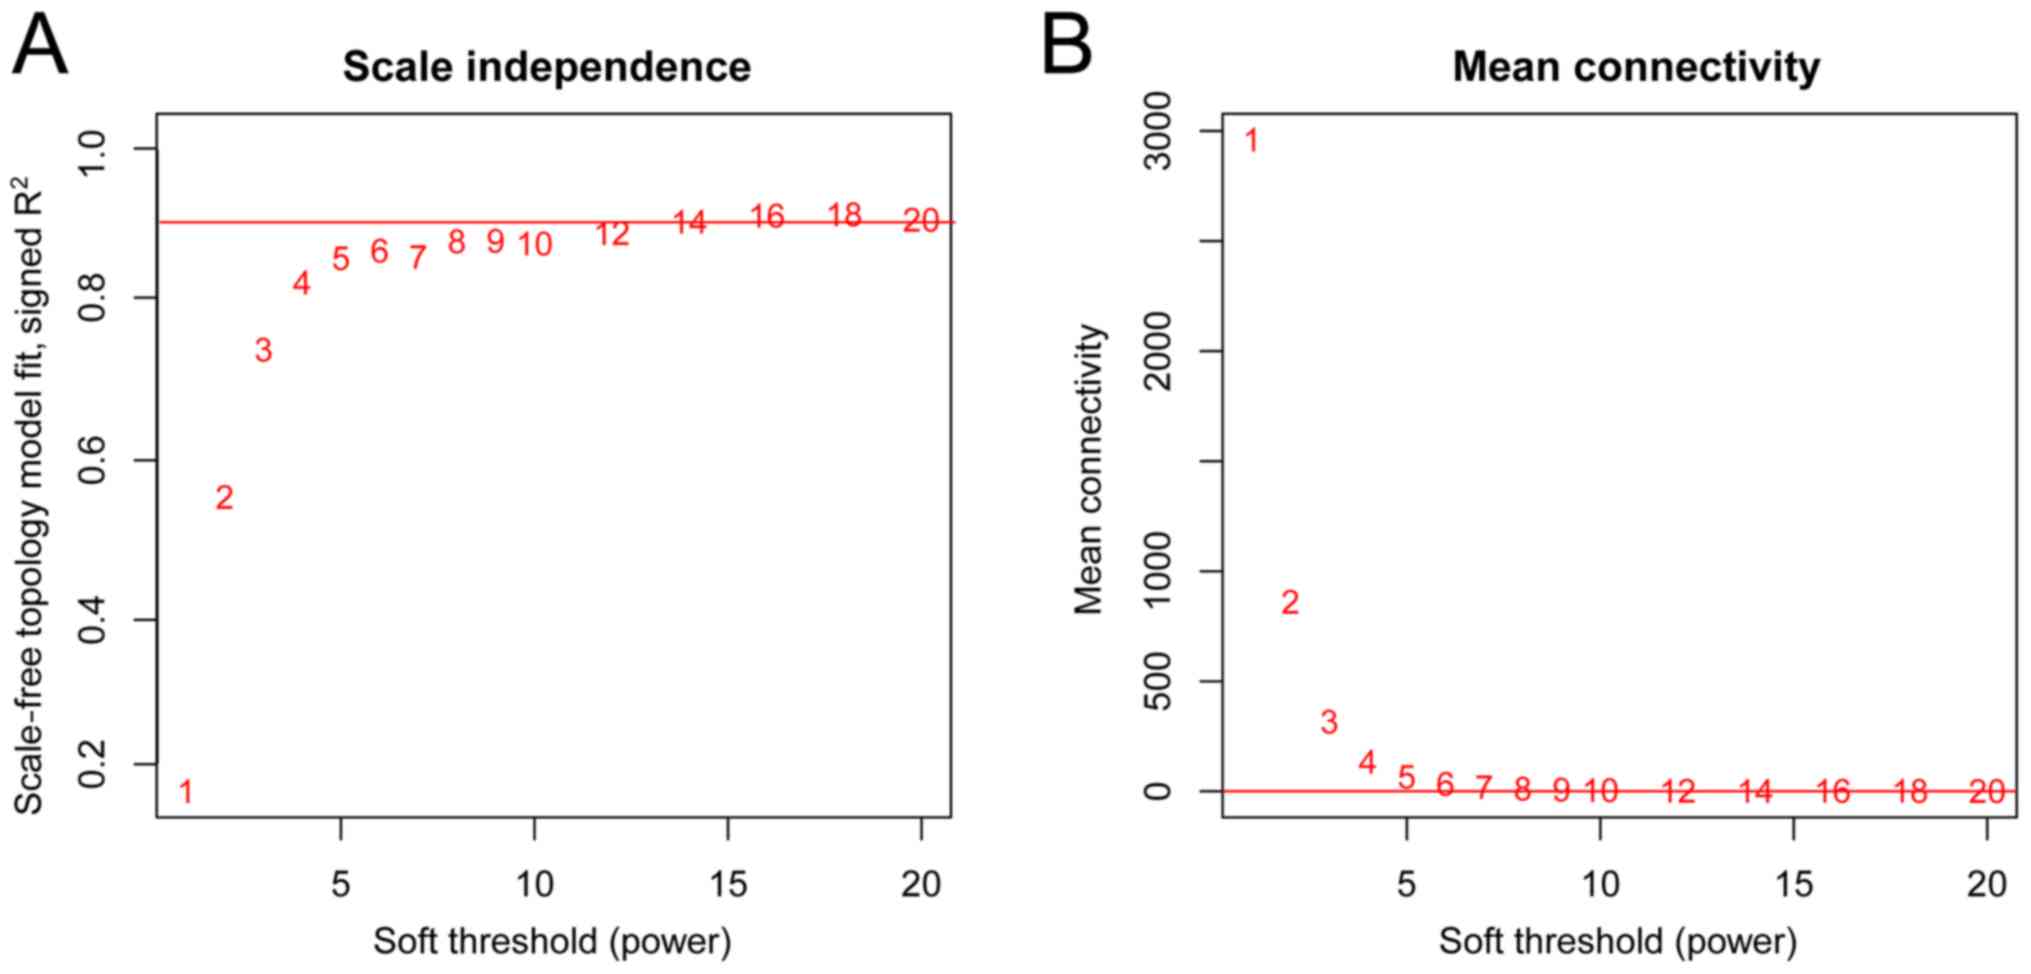
Selection of β parameter value in the
adjacency function
A prerequisite of WCGNA analysis is a scale-free
network distribution. Thus, the appropriate adjacency matrix weight
parameter β (power) should be chosen to ensure that the constructed
co-expression network is as close to a scale-free distribution as
possible. With a β value ranging between 1 and 20, a linear model
was established using the logarithms of the adjacency degree of a
node (log k) and the probability of the node appearance [log P
(k)], respectively. The parameter β is the square value of
coefficient R. A higher R2 value indicates a closer
association between the network and the scale-free distribution
(Fig. 2A). In the present study,
the β (power) of 5 when the R2 value was ~0.9 for the
first time was finally chosen. This selection ensured that the
network connection was close to a scale-free distribution, and made
the curve smooth as the minimum threshold. When the β value was
equal to 5, the average connection degree of RNAs in the network
was 5 (Fig. 2B), consistent with
the small world network property in the scale-free network.
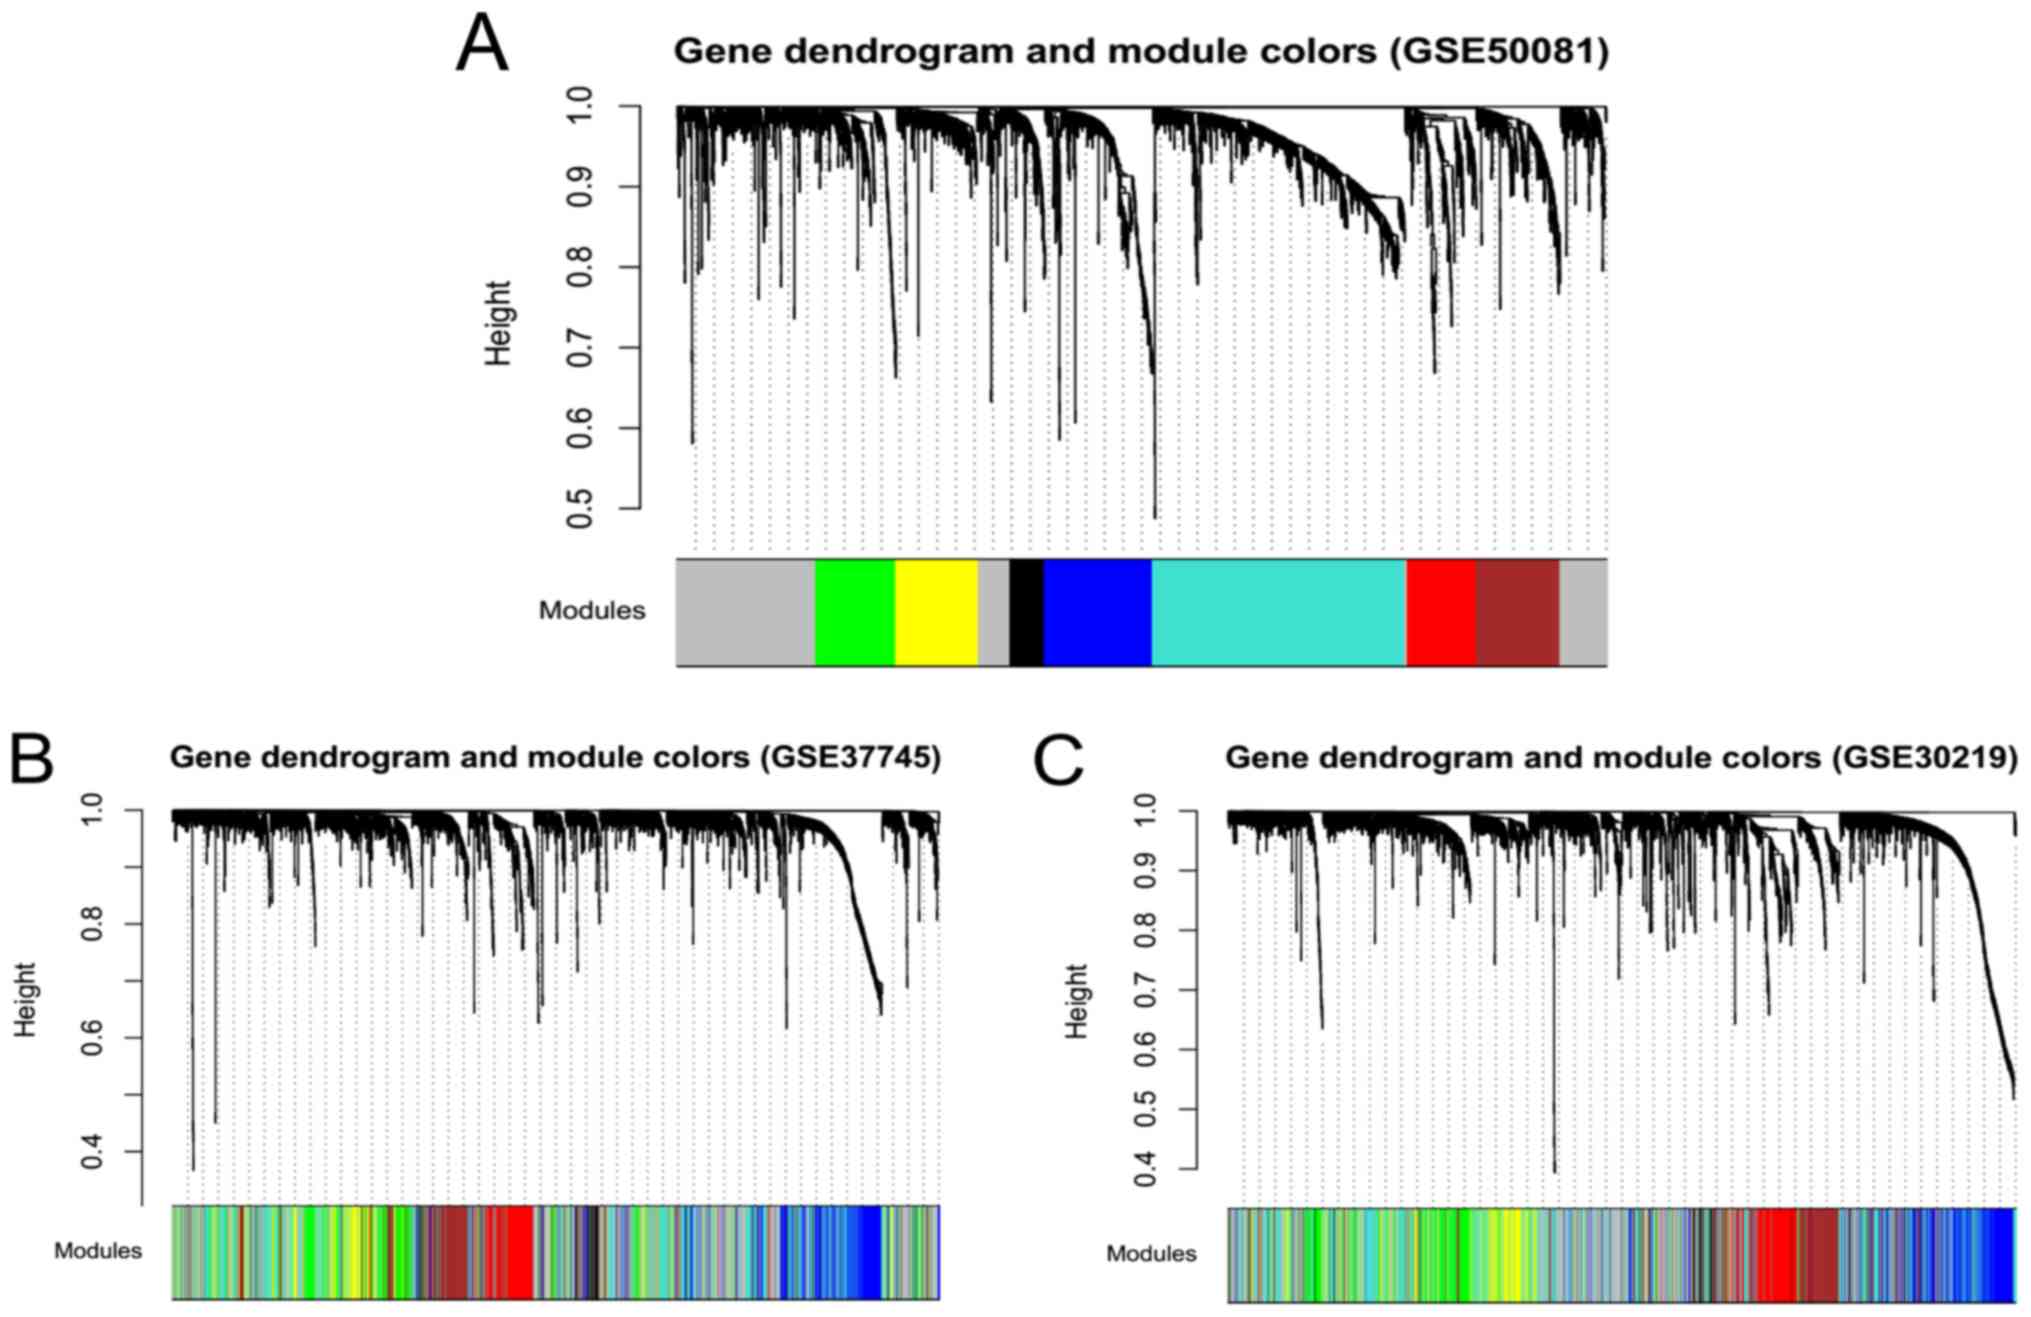
Screening of stable RNA function
modules associated with lung adenocarcinoma
The RNA adjacency matrix, which is the correlation
matrix among RNAs, was constructed on the basis of the GSE50081
data set as the training set, with the β value set at 5. The
hierarchical clustering tree was built based on this matrix, in
which each RNA module contained at least 100 RNAs, according to the
standard of the hybrid dynamic shear tree, with the pruning height
set at cutHeight = 0.99. A total of eight modules were obtained:
M1-black, M2-blue, M3-brown, M4-green, M5-gray, M6-red,
M7-turquoise, and M8-yellow (Fig.
3A). The stability of the modules in training set GSE50081 was
evaluated by partitioning the corresponding module in the other
validation datasets, GSE30219 and GSE37745 (Fig. 3B and C).
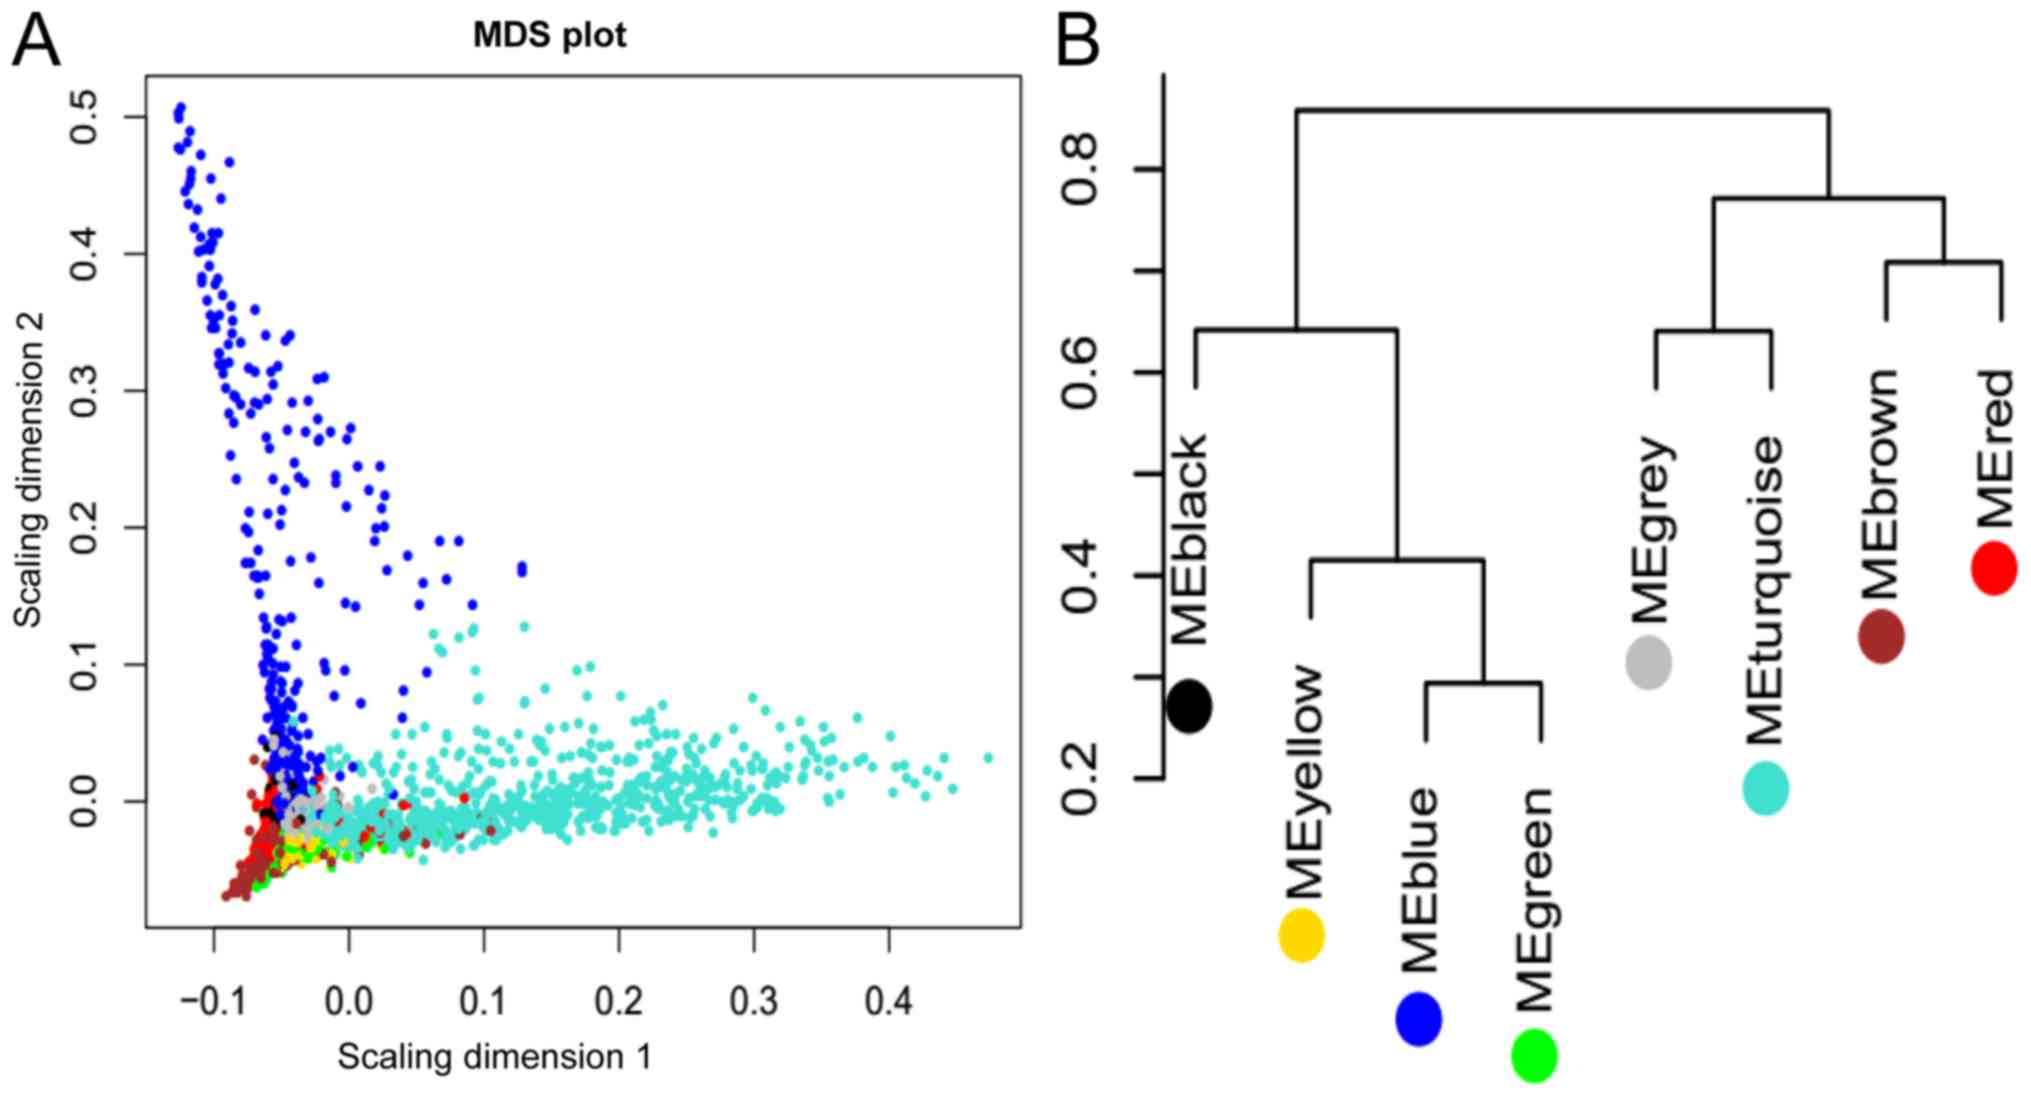
The results of module partition and correlation in
the GSE50081 dataset are displayed in Fig. 4. RNAs in the same module (denoted
by the same color dots) aggregated together (Fig. 4A), indicating that RNAs in the same
module had similar expression. The brown-red module and
blue-green-yellow module exhibited the characteristics of
independent branches (Fig.
4B).
The eight modules were partitioned and their
stabilities were analyzed. Except for the gray, turquoise and black
modules, the stability scores (preservation Z-scores) of the
remaining six modules exceeded 5 (Table I), indicating that they were all
stable. The top five modules with high stability were the red,
blue, yellow, green and brown modules, in which RNAs were likely to
be relevant to the pathogenesis of lung adenocarcinoma. Table I lists the functional annotation
information of these eight modules, of which the top three were
red, blue and brown. A total of six lncRNAs in the red module, 37
in the blue module, and 24 in the brown module were associated with
cellular immune responses, the cell cycle and focal adhesion,
respectively.
 | Table I.Details of preservation Z-scores and
annotation in the eight stable modules of the GSE50081, GSE30219
and GSE37745 datasets. |
Table I.
Details of preservation Z-scores and
annotation in the eight stable modules of the GSE50081, GSE30219
and GSE37745 datasets.
| Module | Color | Module size | mRNAs | lncRNAs | Preservation
z-score | Module GO
annotation |
|---|
| Module 7 | Turquoise | 911 | 887 | 24 | 3.1526 | Mitotic nuclear
division |
| Module 5 | Grey | 792 | 771 | 21 | 4.8675 | Cell-cell
signaling |
| Module 1 | Black | 129 | 121 | 8 | 5.7128 | Epidermis
development |
| Module 4 | Green | 290 | 283 | 7 | 19.2659 | Epithelial cell
proliferation |
| Module 8 | Yellow | 306 | 288 | 18 | 19.5524 | Oxidation-reduction
process |
| Module 3 | Brown | 318 | 294 | 24 | 22.9983 | Focal adhesion |
| Module 2 | Blue | 413 | 376 | 37 | 47.6821 | Cell cycle |
| Module 6 | Red | 246 | 240 | 6 | 50.8970 | Immune
response |
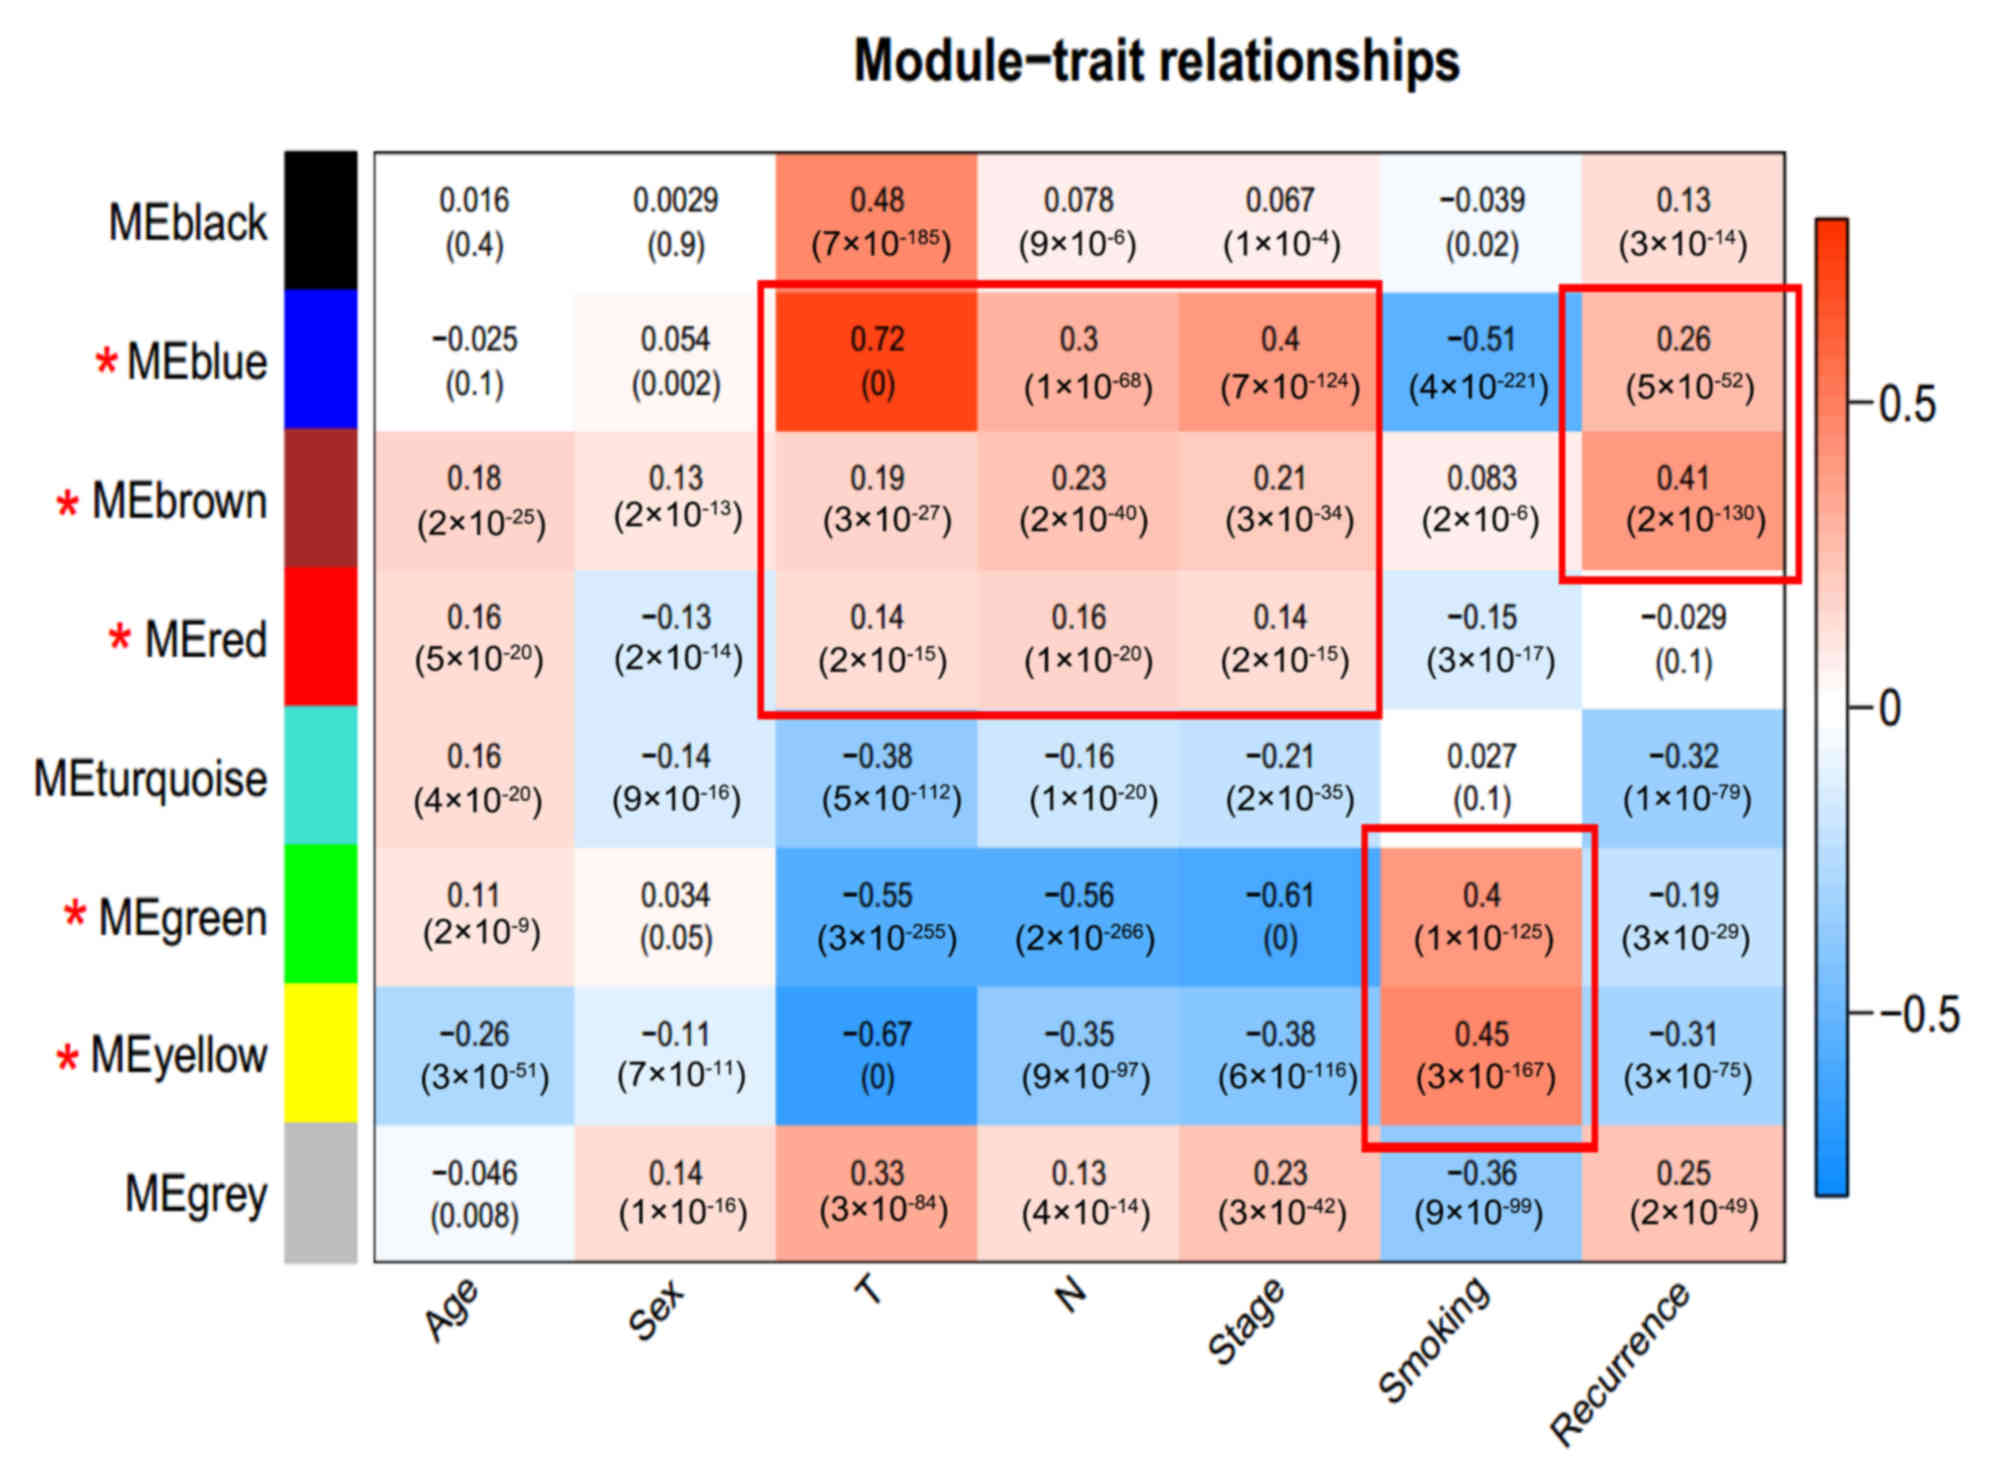
The correlation between each module and the various
clinical factors was calculated by integrating the clinical
information of samples in the GSE50081 dataset. The results
presented in Fig. 5 indicated that
the top three modules in terms of stability (red, blue, and brown)
were significantly correlated with the T and N staging (T, the
range of the primary tumors; N, the metastasis of peripheral lymph
nodes) and recurrence of lung adenocarcinoma. The remaining two
modules with high stability (green and yellow) were significantly
associated with smoking. Therefore, lncRNAs in these five modules,
which were considered to be important factors associated with lung
adenocarcinoma, were focused upon.
Screening of important lncRNAs
associated with lung adenocarcinoma
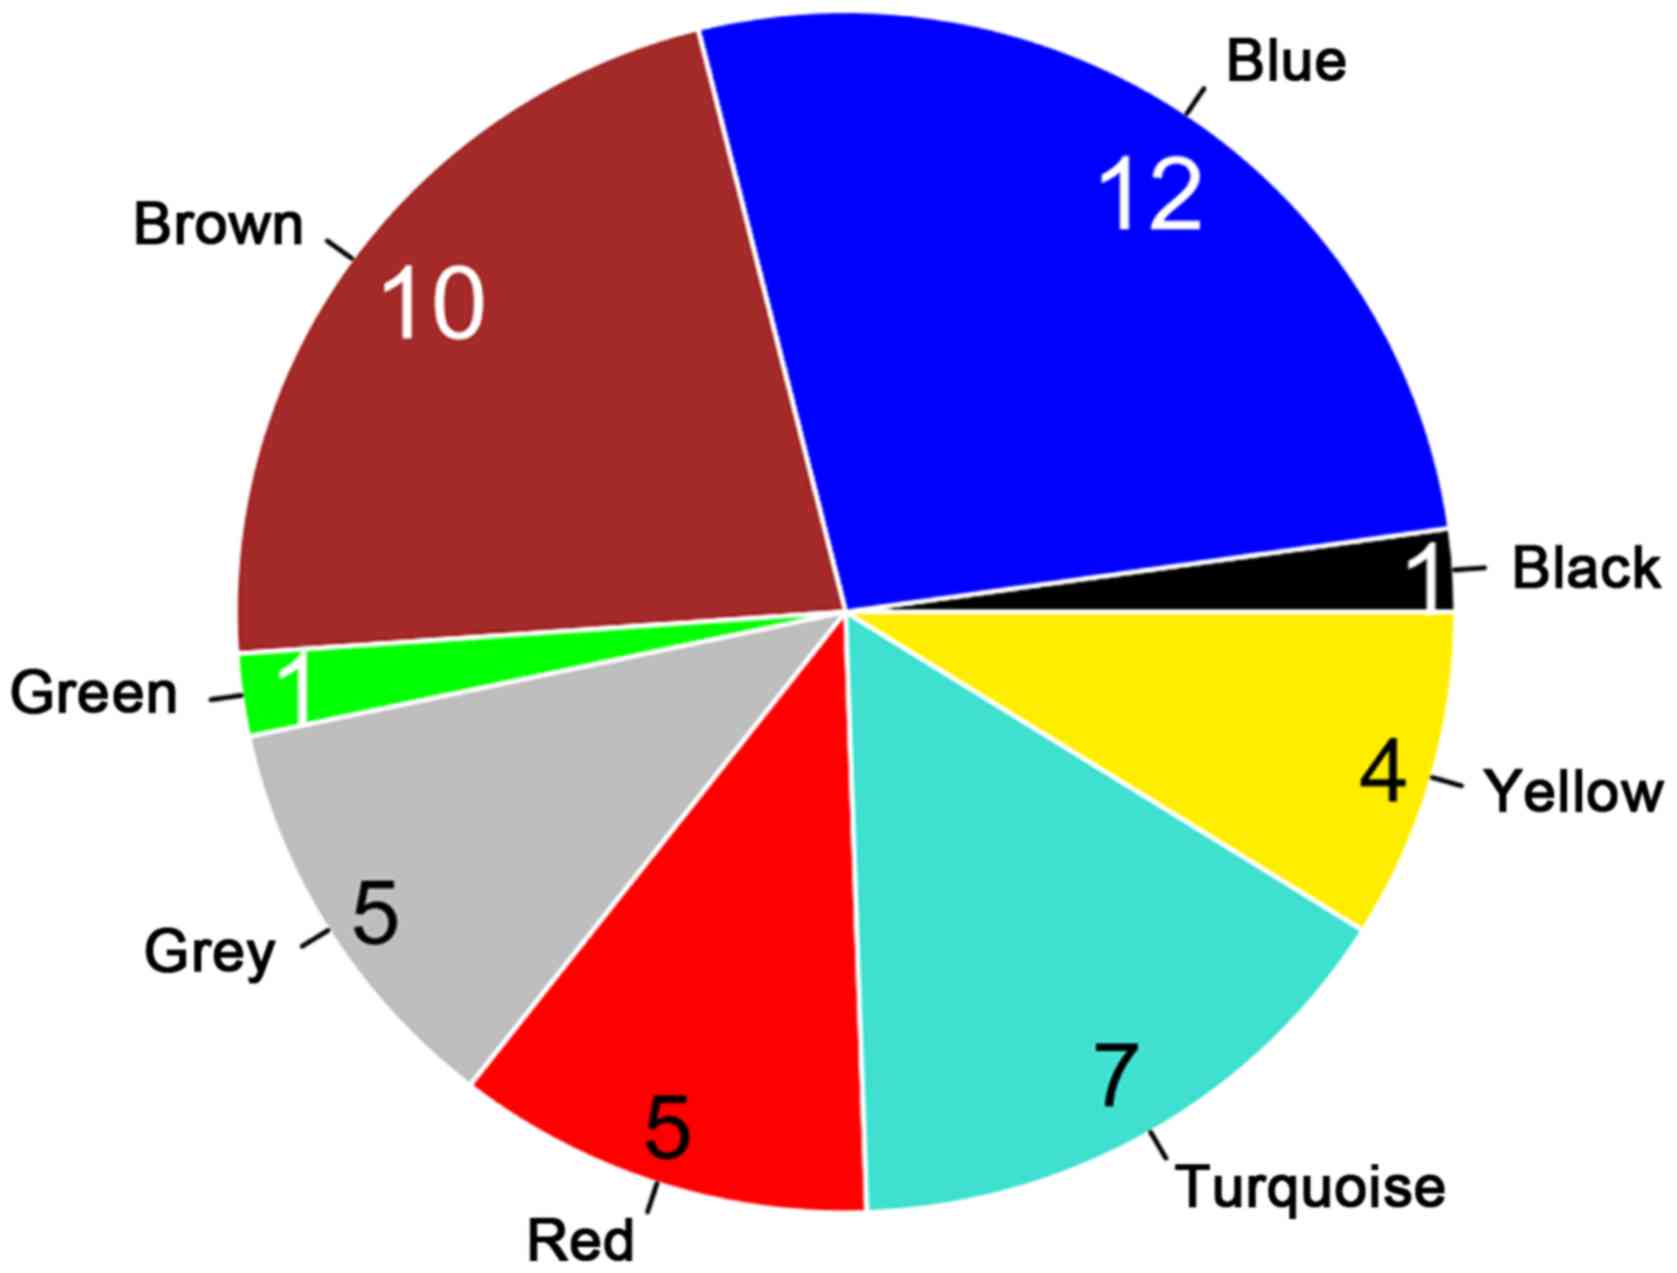
Based on the integration of the GSE32863, GSE75037,
GSE10072 and GSE43458 datasets, a total of 1,691 RNAs with
consistently significant expression were screened through the
comprehensive analysis of the MetaDE package, including 58
differentially expressed lncRNAs and 1,633 differentially expressed
mRNAs. Considering the previous results of module stability,
annotation and correlation between modules and clinical factors,
lncRNAs in the brown, red, blue, green and yellow modules were
regarded as the factors significantly associated with the incidence
and prognosis of lung adenocarcinoma. In addition, their
differential expression was considered to be associated with cancer
pathogenesis. Therefore, combining the two aforementioned aspects,
32 differentially expressed lncRNAs were selected from the brown,
red, blue, green and yellow modules for subsequent survival
analysis in relation to lung adenocarcinoma. The distributions in
the eight modules are presented in Fig. 6.
Establishment and evaluation of risk
assessment model
Selection of optimal lncRNAs
According to the results of the phylogenetic tree
(Fig. 4B), 17 and 15
differentially expressed lncRNAs in the blue-green-yellow and
brown-red modules, respectively, were divided into two groups. The
third group was defined as the combined group, which included these
32 lncRNAs. The lncRNAs in each group were further optimized and
screened using the Cox-PH model based on the L1-penalized
regularization regression algorithm in the penalized package to
obtain the optimal prognosis-associated lncRNAs. As presented in
Fig. 7A, the 1,000-cycle
calculation of the CVL algorithm was performed to obtain the
optimal lambda values in the Cox-PH model. The lambda value
corresponding to the maximum CVL value was selected as the input
value in the Cox-PH model. Using the Cox-PH model, the best
combinations composed of 5, 5 and 6 lncRNAs emerged in the
blue-green-yellow, brown-red and combined modules, respectively.
The corresponding coefficients of the three selected sets of the
optimal combination of lncRNAs are presented in Fig. 7B (the algorithm yielded different
coefficients to the optimal lncRNAs, and the coefficients of the
excluded lncRNAs were all reduced to zero).
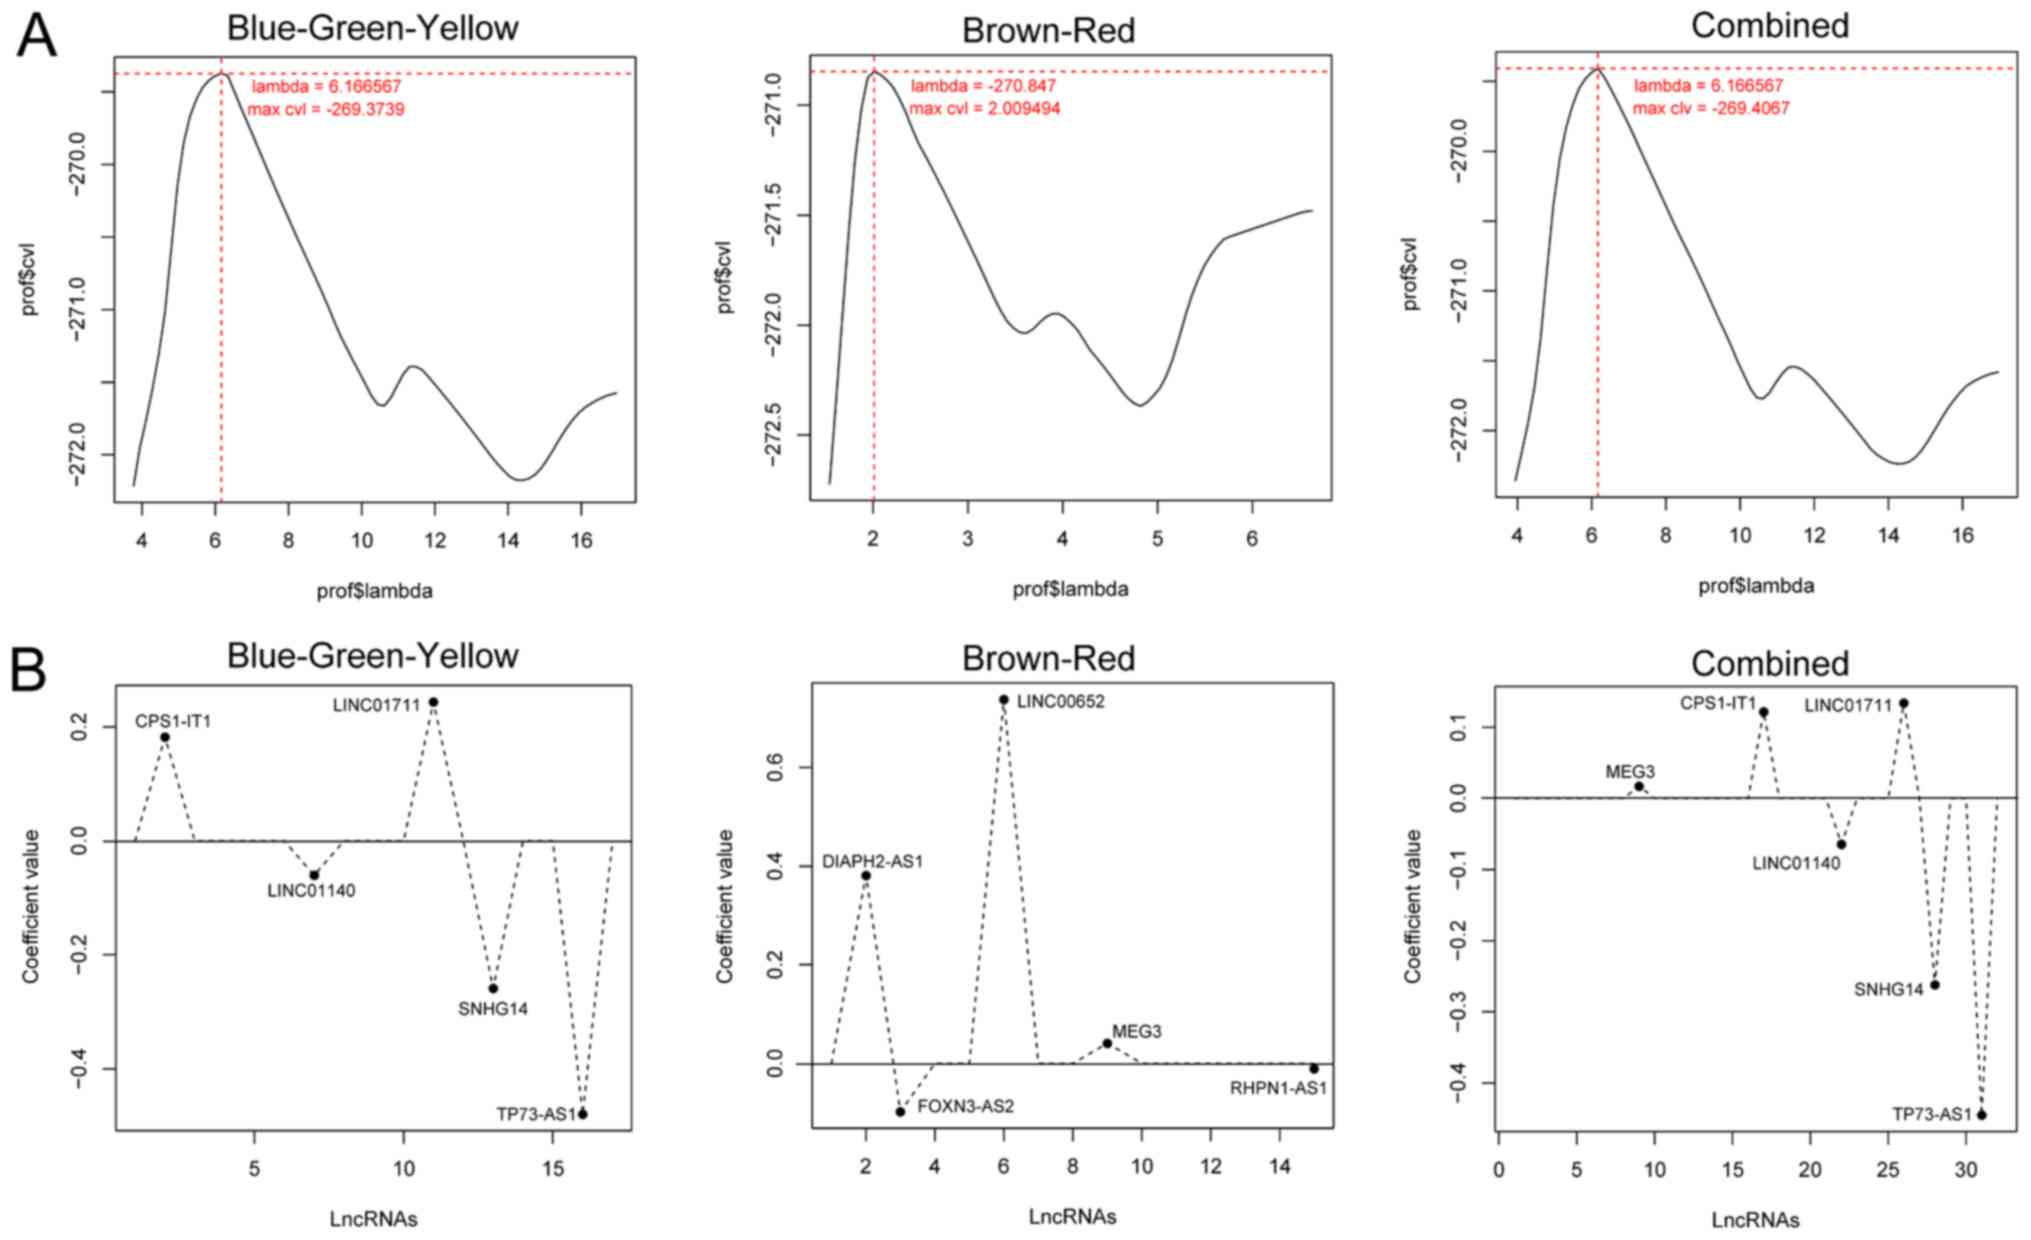 | Figure 7.Lambda parameter filtration and
coefficient distribution of the best prognosis-associated lncRNAs.
(A) Curve graphs of lambda parameters screened by CVL in the
blue-green-yellow, brown-red and combined groups, respectively. The
horizontal and vertical axes represent the different values of
lambda and CVL, respectively. The intersection of the dotted lines
indicates the value of the lambda parameter when the CVL is
maximal. (B) Distribution charts of the optimal
prognosis-associated lncRNAs selected by the Cox proportional
hazards model when the value of lambda parameter corresponding to
the maximum CVL value was taken. Each point corresponds to each
lncRNA. lncRNA, long non-coding RNA; CVL, cross-validation
likelihood; CPS1-IT1, CPS1 intronic transcript 1; LINC01140, long
intergenic non-protein coding RNA 1140; LINC01711, long intergenic
non-protein coding RNA 1711; SNHG14, small nucleolar RNA host gene
14; TP73-AS1, TP73 antisense RNA 1; DIAPH2-AS1, DIAPH2 antisense
RNA 1; LINC00652, long intergenic non-protein coding RNA 652;
FOXN3-AS2, FOXN3 antisense RNA 2; MEG3, maternally expressed 3;
RHPN1-AS1, RHPN1 antisense RNA 1 (head to head). |
Establishment, evaluation, and
selection of risk prediction model
Based on the corresponding Cox-PH regression
coefficients of the three optimal lncRNAs obtained in the previous
step, three sets of prediction models of sample risk scoring were
constructed as follows:
Risk-score (blue-green-yellow) = (0.182) ×
ExpCPS1-IT1 + (−0.060) × ExpLINC01140 + (0.244) × ExpLINC01711 +
(−0.259) × ExpSNHG14 + (−0.480) × ExpTP73-AS1;
Risk-score (brown-red) = (0.381) × ExpDIAPH2-AS1 +
(−0.097) × ExpFOXN3-AS2 + (0.738) × ExpLINC00652 + (0.041) ×
ExpMEG3 + (−0.0003) × ExpRHPN1-AS1;
Risk-score (combined) = (0.122) × ExpCPS1-IT1 +
(−0.065) × ExpLINC01140 + (0.134) × ExpLINC01711 + (−0.262)
xExpSNHG14 + (−0.445) × ExpTP73-AS1 + (0.017) × ExpMEG3.
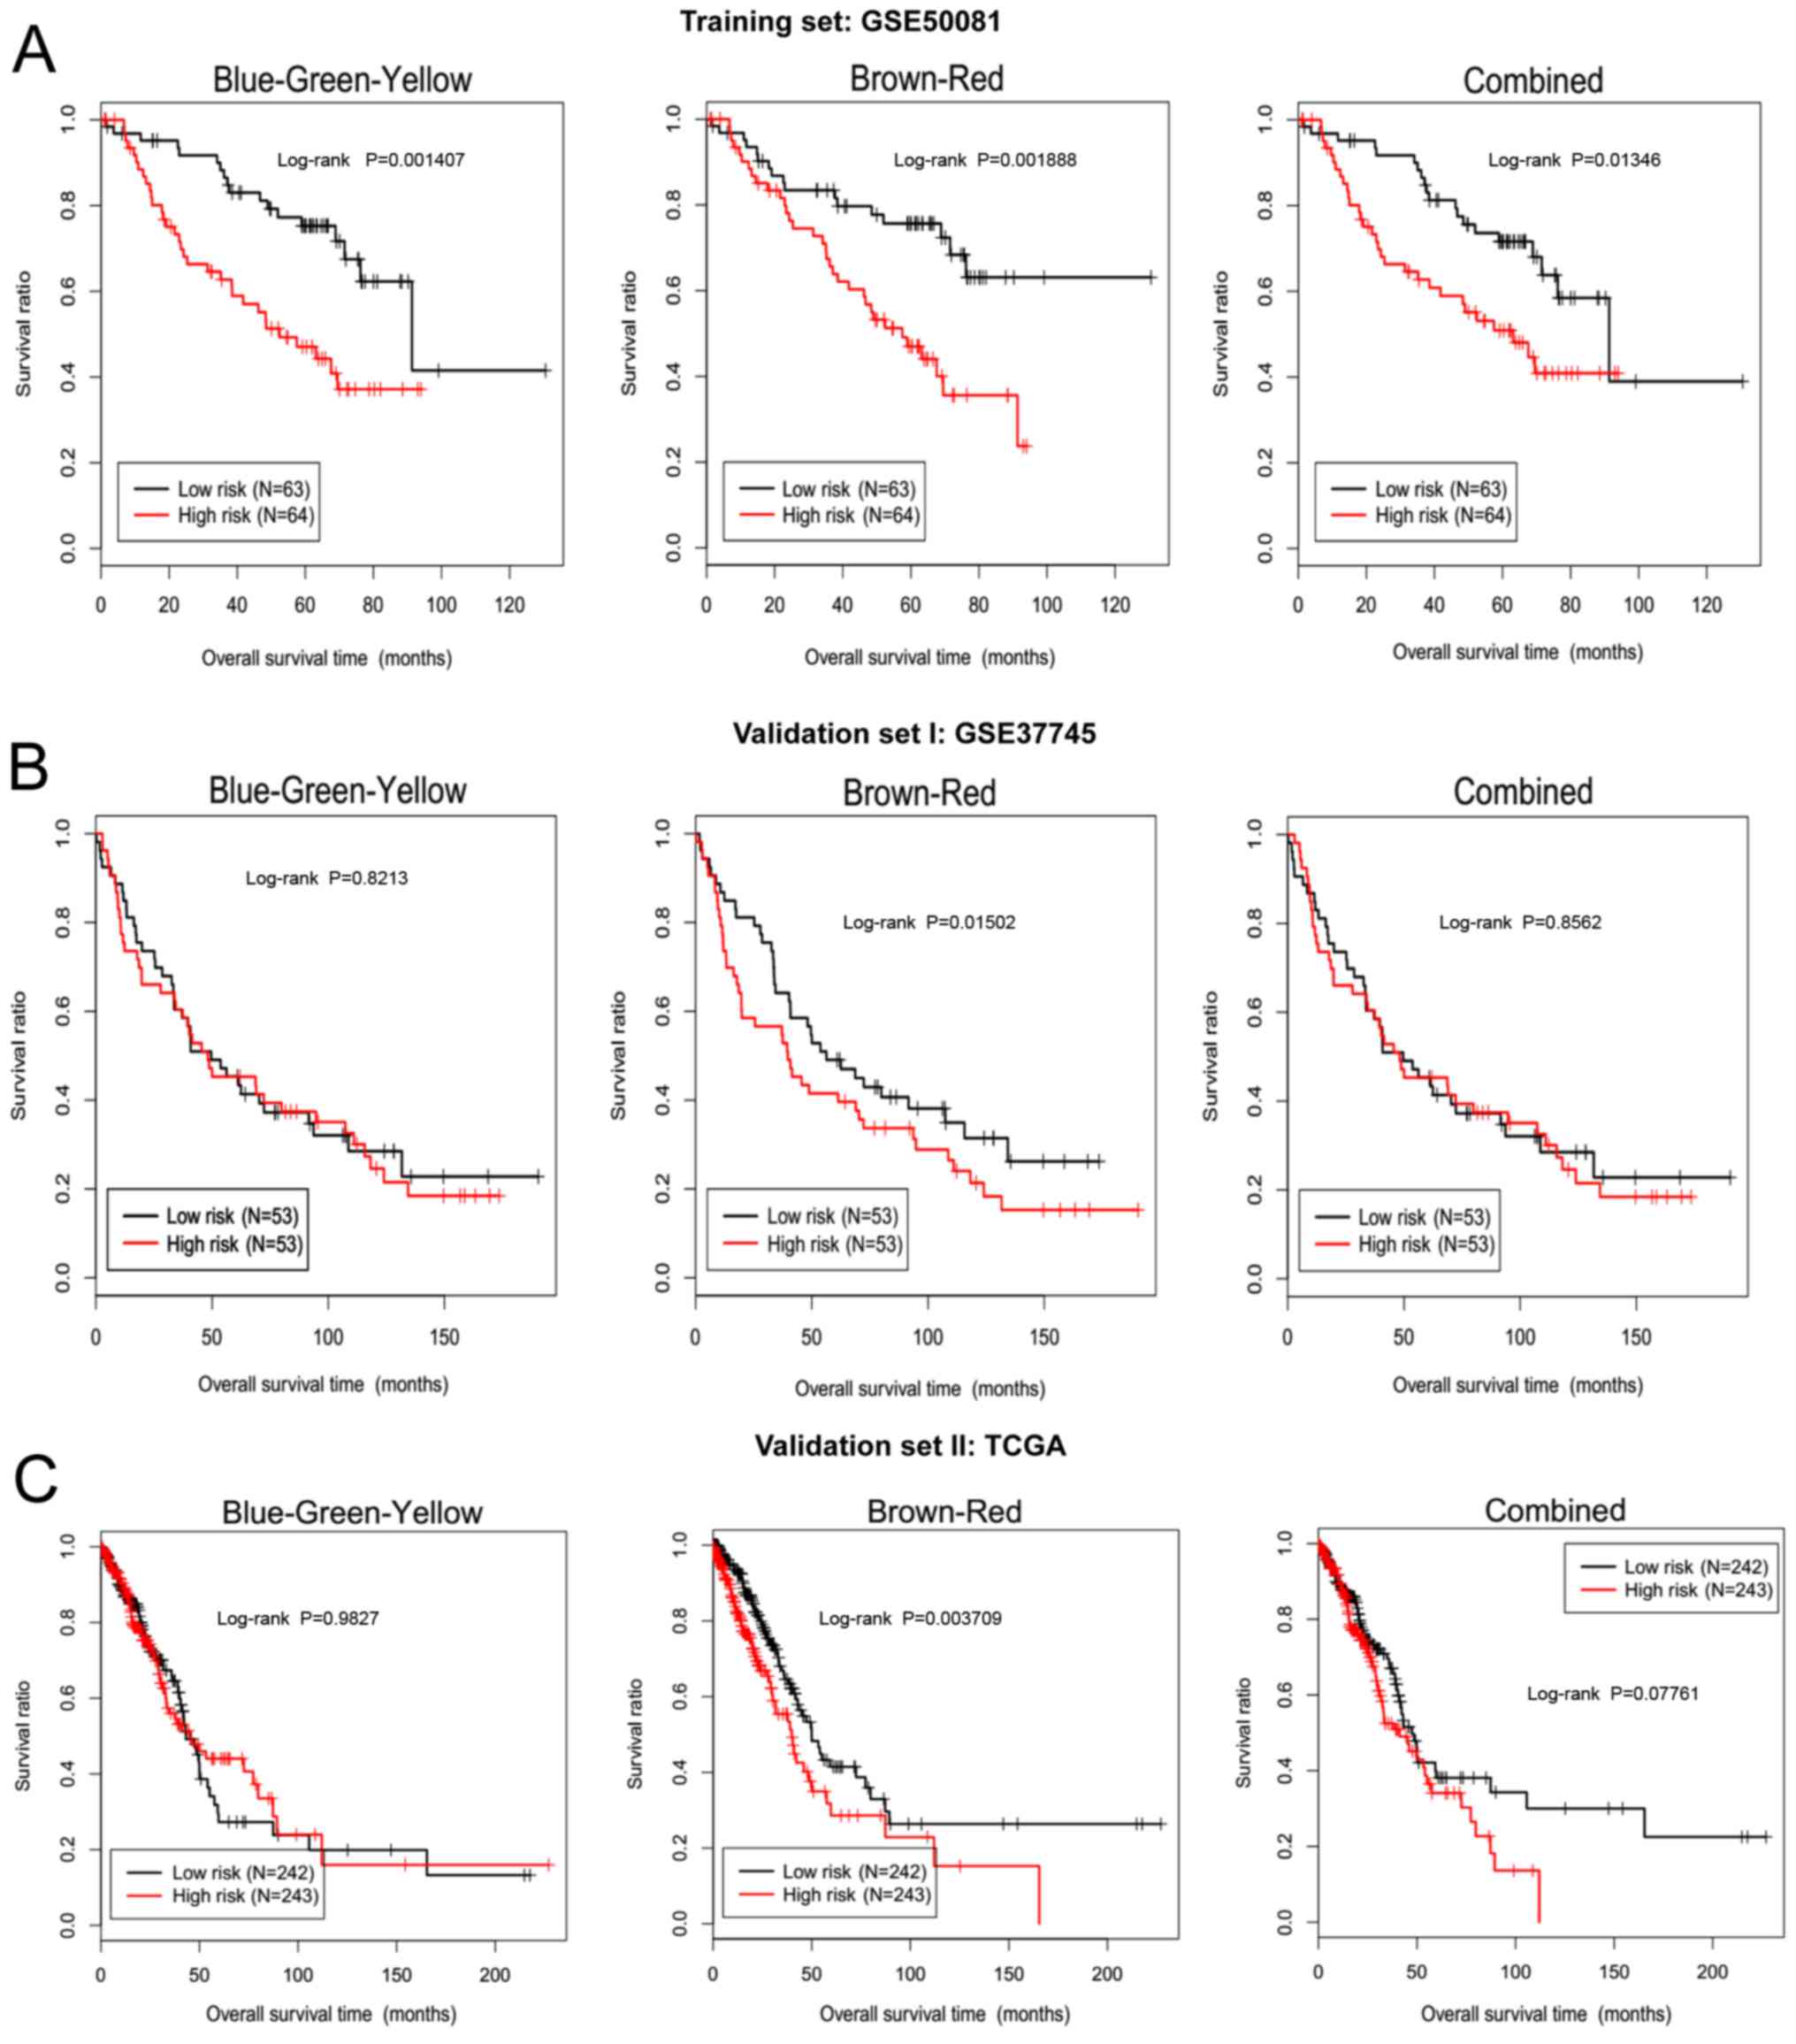
Based on these three models, the risk-score of each
sample in training dataset GSE50081 was calculated, and these
samples were divided into high and low-risk groups according to the
median score. Kaplan-Meier survival curve analysis was used to
assess the significant differences in the survival time between the
two groups. All three constructed models, including
blue-green-yellow, brown-red and combined, had a significantly
different effect on the high and low-risk groups (P<0.05 for all
models) of the GSE50081 training set (Fig. 8A).
GSE50081 together with the GSE37745 dataset in the
WGCNA analysis were used as the validation datasets to evaluate the
efficiency of the prediction models. Only the lncRNAs in the
brown-red model were able to better separate the low-risk and
high-risk prognostic samples in the GSE37745 dataset (Fig. 8B; P=0.015). Furthermore, the
effectiveness of the three models was further verified by the TCGA
independent validation dataset. Only the brown-red model produced a
clear discrimination result (Fig.
8C; P=0.0037), suggesting that the brown-red model was very
robust, in which five lncRNAs [DIAPH2 antisense RNA 1 (DIAPH-AS1),
FOXN3 antisense RNA 2 (FOXN3-AS2), long intergenic non-protein
coding RNA 652 (LINC00652), maternally expressed 3 (MEG3) and RHPN1
antisense RNA 1 (head to head) (RHPN1-AS1)] were significantly
correlated with prognosis, were stable in distinguishing between
the prognosis samples, and could be universally applied to other
new samples.
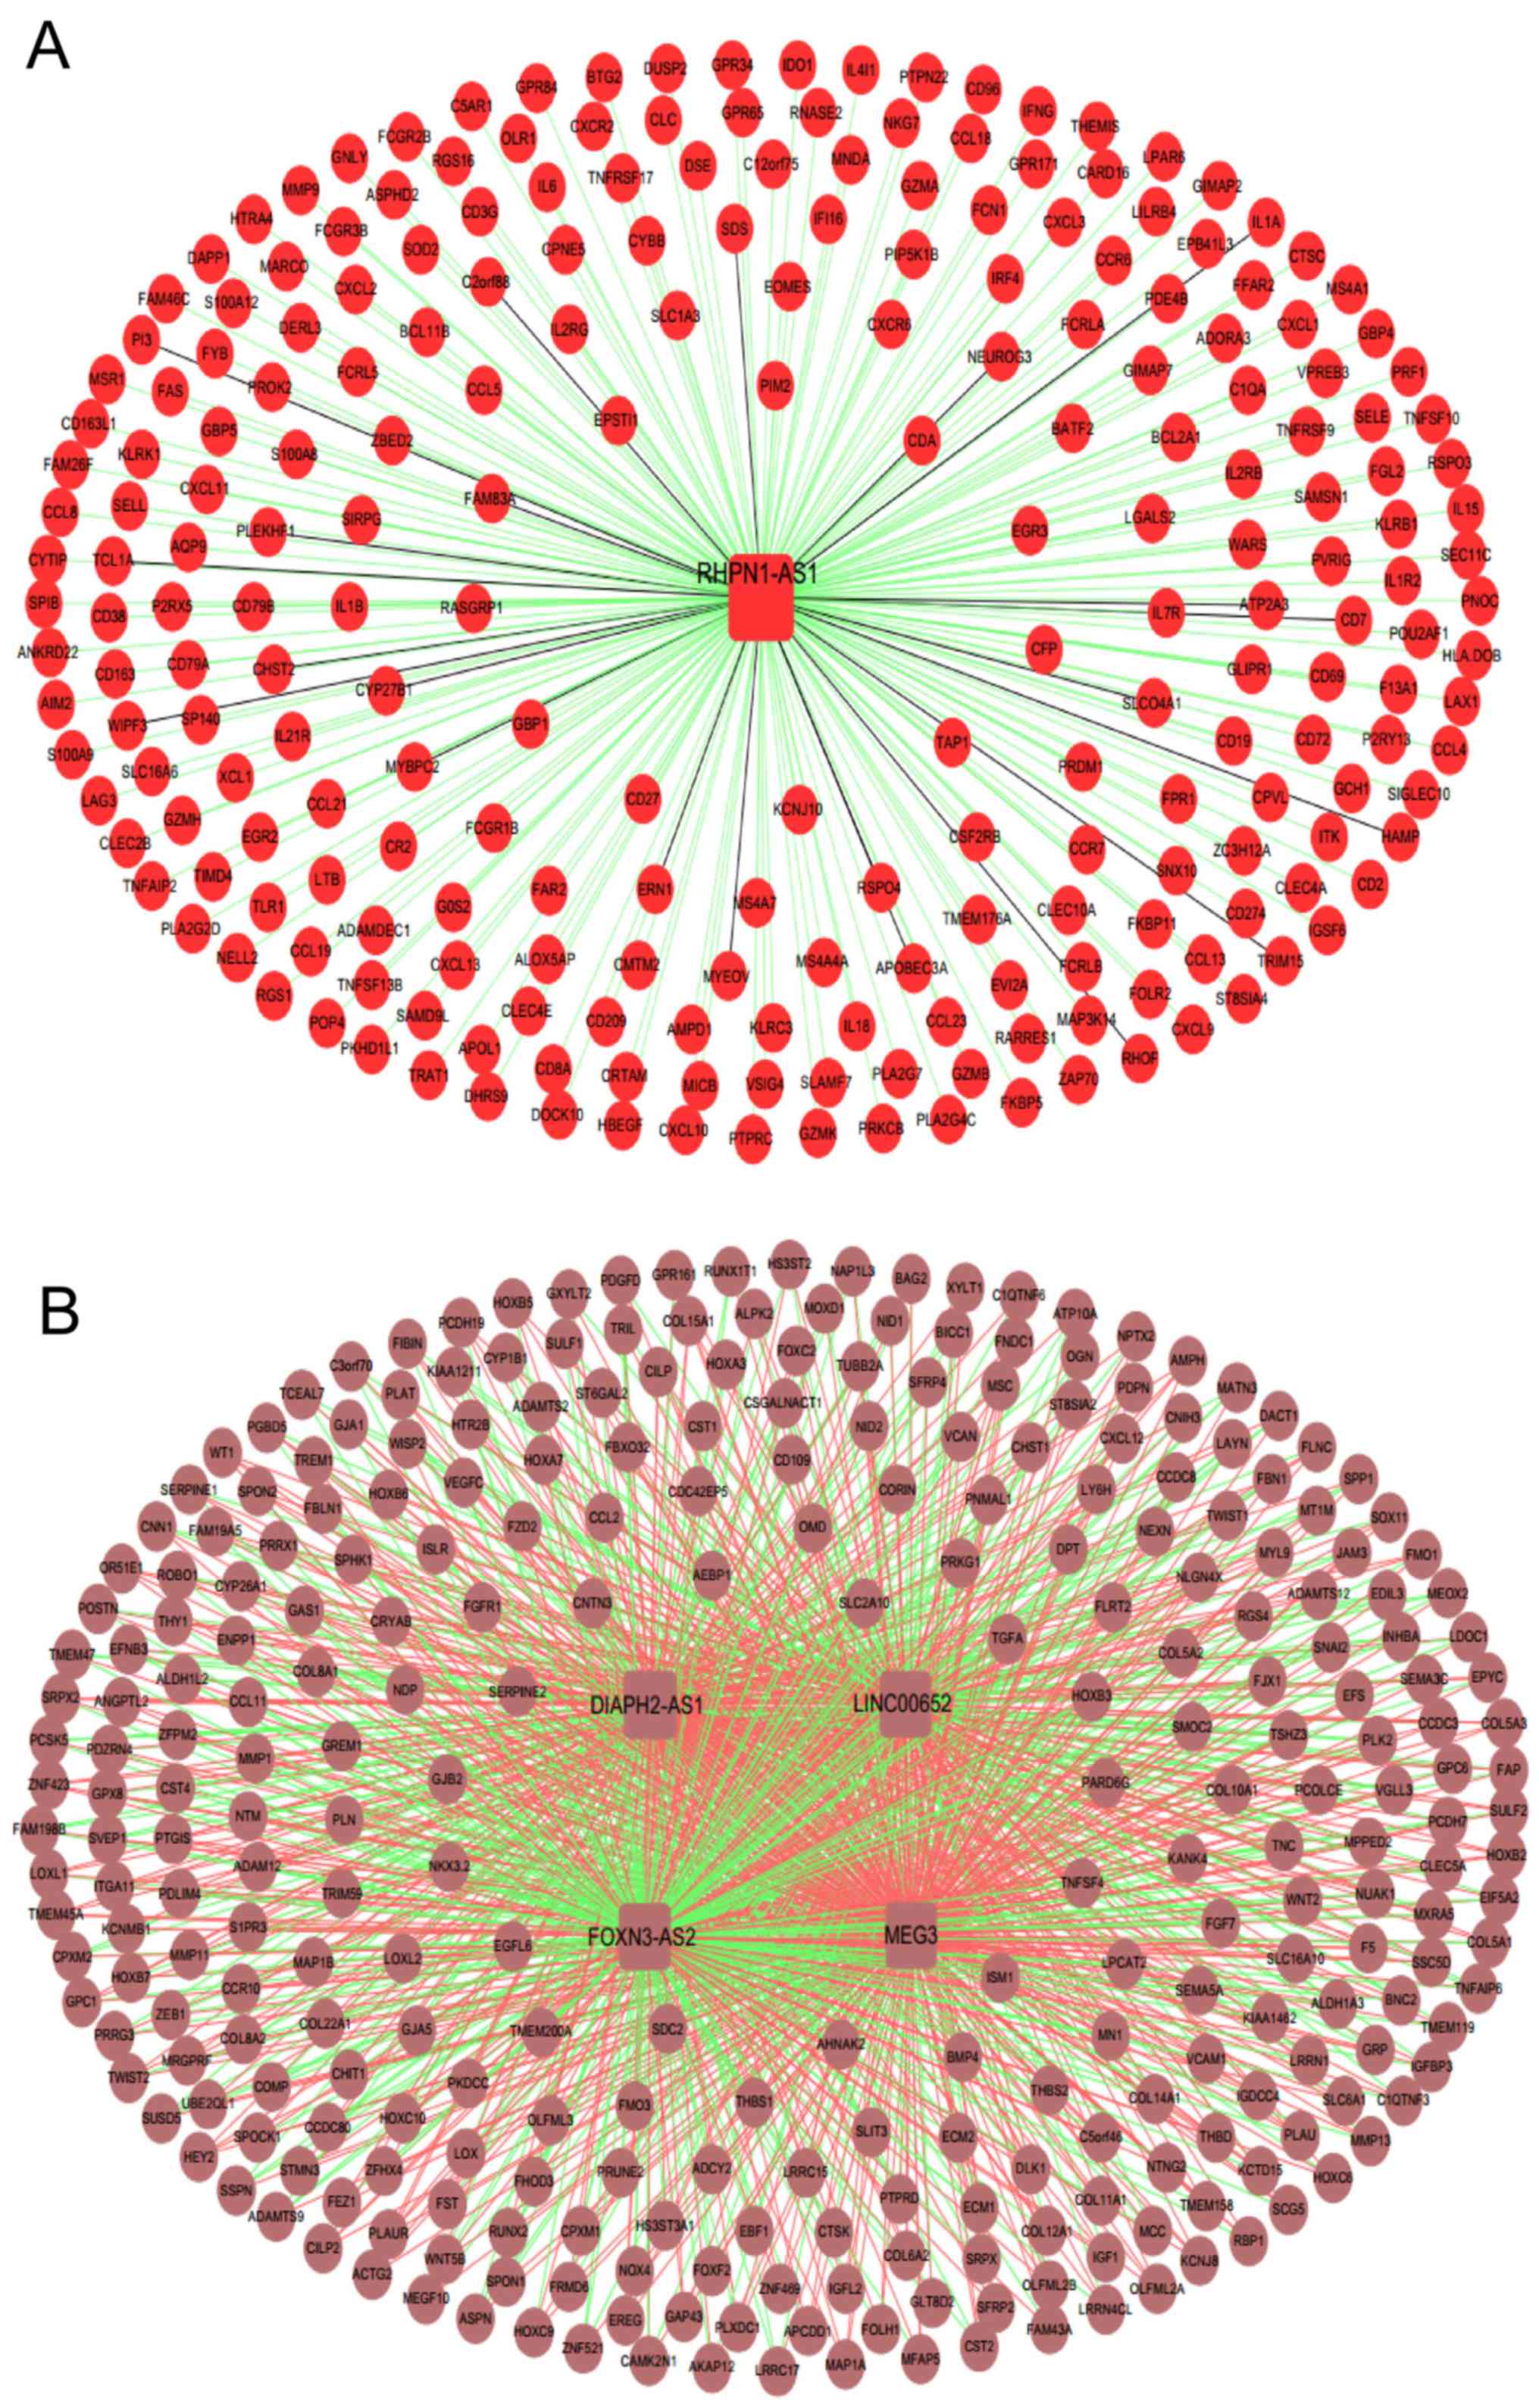
Network construction and analysis of
functional pathways
A total of five important lung
adenocarcinoma-associated lncRNAs, including DIAPH2-AS1, FOXN3-AS2,
LINC00652, MEG3 and RHPN1-AS1, were obtained according to the
previous analysis. Combined with their associated mRNAs selected in
the brown and red modules using WGCNA, the important lncRNA-mRNA
networks were built, as presented in Fig. 9.
GSEA-based pathway enrichment analysis was performed
on the genes in two lncRNA-mRNA networks, in which three key
statistical values were used. The first value was the enrichment
score (ES) that was the original result of the GSEA analysis,
reflecting the enrichment degree value of a functional gene set at
the anterior or posterior of an array when all the hybridization
data have been sorted. The basic principle of the calculation is to
scan the sequence of sequences. When a gene of this set is
prepared, the ES value increases; otherwise, it decreases. The
second value is the normalized enrichment score (NES, which is the
standardized processing of ES values. The final value is the
nominal P-value, which describes the statistical significance of
the ES of a functional gene subset. A smaller P-value indicates
better gene enrichment. When the absolute value of NES is greater,
the P-value will be spontaneously smaller, suggesting a higher
degree of enrichment and greater confidence in the analysis result.
In the present study, P<0.05 was chosen as the threshold for
screening KEGG pathways in which the relevant module genes were
significantly enriched.
As illustrated in Fig.
10A and Table II, six
pathways were significantly associated with the RHPN1-AS1 network
in the red module. In the brown module, three pathways were
simultaneously associated with the DIAPH2-AS1, FOXN3-AS2,
LINC00652, and MEG3 networks (Fig.
10B and Table III).
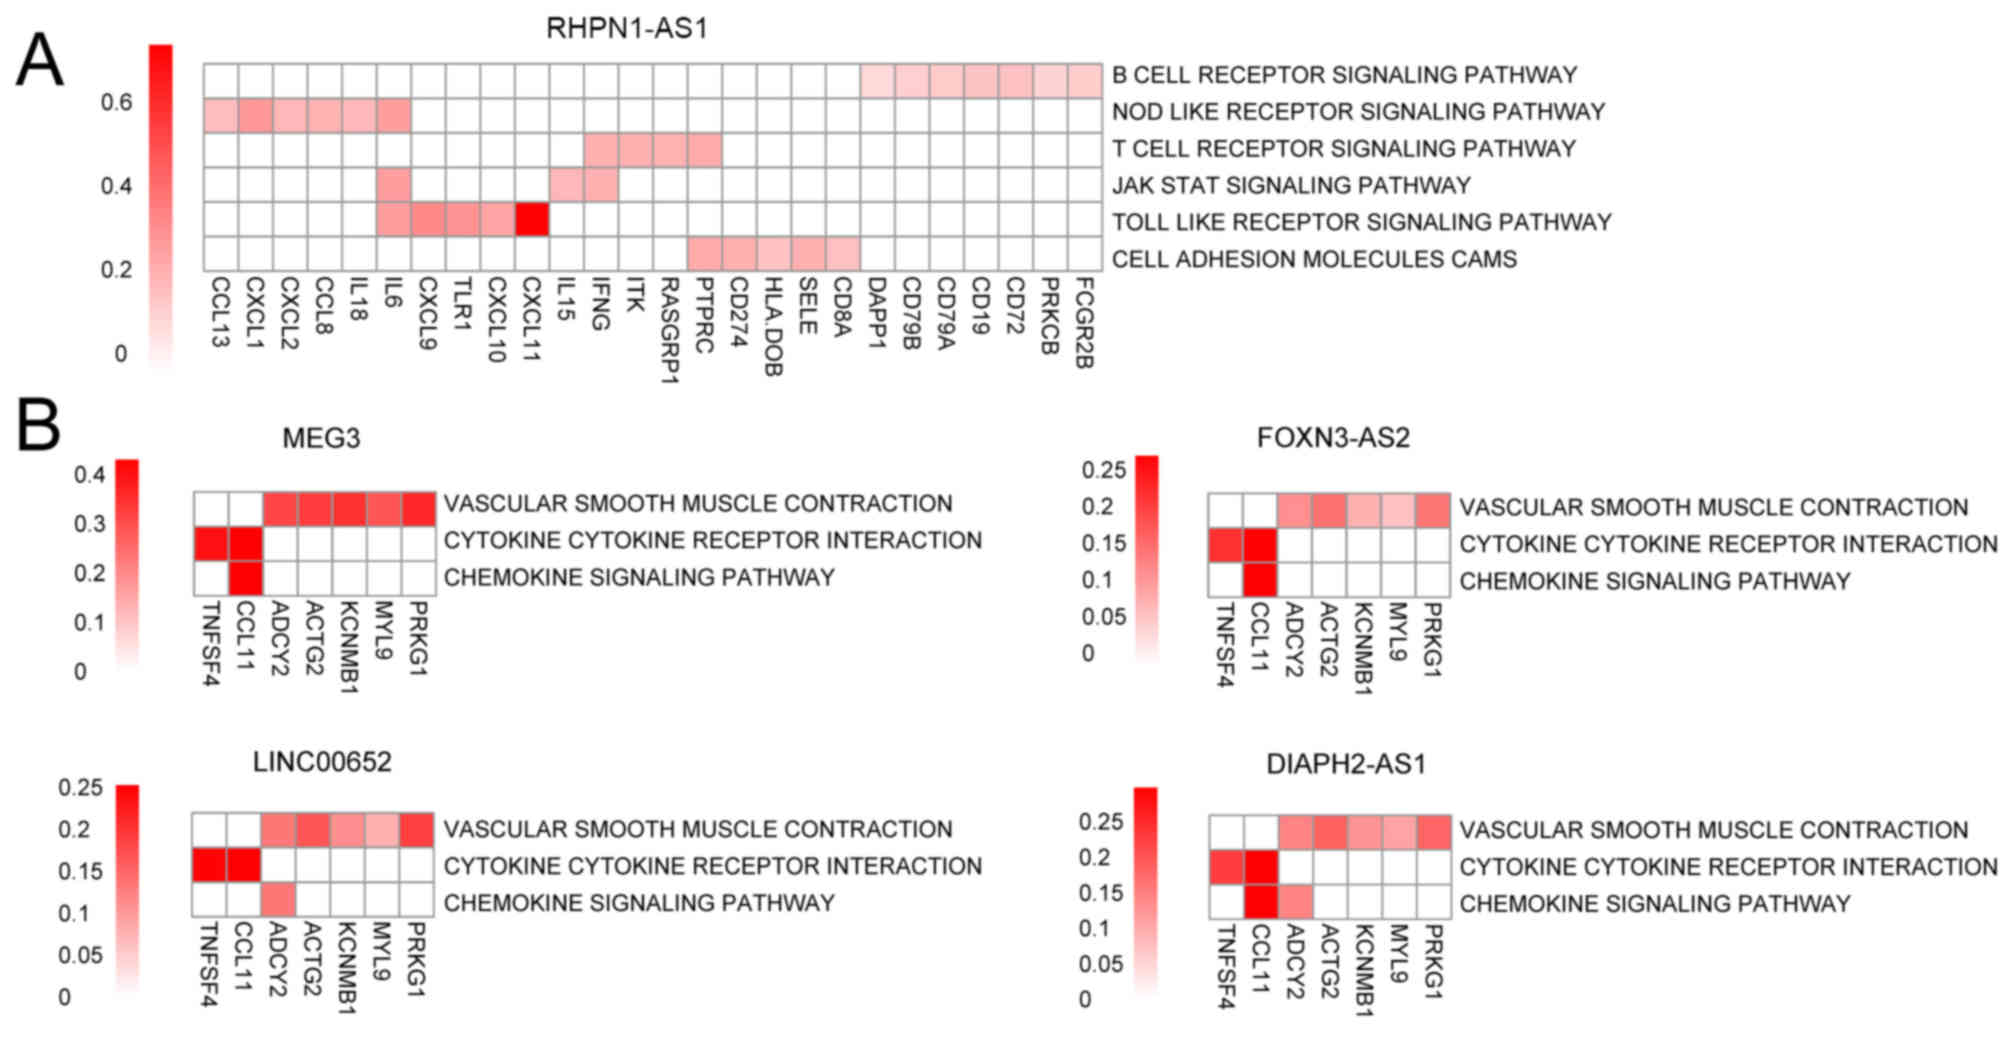 | Figure 10.Pathways enriched in the red and
brown network modules, and heat maps of the associated genes. (A)
Red module. (B) Brown module. The x-axes indicate the genes
involved in the pathways; the y-axes indicate the enriched
pathways. A deeper red color indicates a stronger positive
correlation. MEG3, maternally expressed 3; FOXN3-AS2, FOXN3
antisense RNA 2; LINC00652, long intergenic non-protein coding RNA
652; DIAPH2-AS1, DIAPH2 antisense RNA 1; PRKG1, protein kinase
cGMP-dependent 1; MYL9, myosin light chain 9; KCNMB1, potassium
calcium-activated channel subfamily M regulatory β-subunit 1;
ACTG2, actin, γ2, smooth muscle, enteric; ADCY2, adenylate cyclase
2; CCL11, C-C motif chemokine ligand 11; TNFSF4, TNF superfamily
member 4. |
| Table II.KEGG pathways significantly
associated with the red module. |
Table II.
KEGG pathways significantly
associated with the red module.
| KEGG pathways | ES | NES | NOM p-val |
|---|
|
T_CELL_RECEPTOR_SIGNALING_PATHWAY | 0.3936 | 1.3243 | 0.0001 |
|
JAK_STAT_SIGNALING_PATHWAY | 0.2300 | 1.1451 | 0.0158 |
|
NOD_LIKE_RECEPTOR_SIGNALING_PATHWAY | 0.4680 | 1.0535 | 0.0285 |
|
TOLL_LIKE_RECEPTOR_SIGNALING_PATHWAY | 0.6984 | 1.0162 | 0.0300 |
|
B_CELL_RECEPTOR_SIGNALING_PATHWAY | −0.2269 | −1.0968 | 0.0333 |
|
CELL_ADHESION_MOLECULES_CAMS | 0.3157 | 1.0298 | 0.0394 |
| Table III.KEGG pathways significantly
associated with the brown module. |
Table III.
KEGG pathways significantly
associated with the brown module.
| A, MEG3 |
|---|
|
|---|
| KEGG pathways | ES | NES | NOM p-val |
|---|
|
VASCULAR_SMOOTH_MUSCLE_CONTRACTION | −0.4164 | −1.0637 | 0.0344 |
|
CYTOKINE_CYTOKINE_RECEPTOR_INTERACTION | 0.3187 | 1.3840 | 0.0468 |
|
CHEMOKINE_SIGNALING_PATHWAY | 0.2642 | 1.0044 | 0.0448 |
|
| B,
LINC00652 |
|
| KEGG
pathways | ES | NES | NOM
p-val |
|
|
VASCULAR_SMOOTH_MUSCLE_CONTRACTION | −0.3550 | −0.9555 | 0.0066 |
|
CYTOKINE_CYTOKINE_RECEPTOR_INTERACTION | 0.2316 | 1.0048 | 0.0476 |
|
CHEMOKINE_SIGNALING_PATHWAY | −0.2200 | −0.8889 | 0.0482 |
|
| C, FOXN3-AS2 |
|
| KEGG pathways | ES | NES | NOM p-val |
|
|
VASCULAR_SMOOTH_MUSCLE_CONTRACTION | −0.4266 | −1.1554 | 0.0180 |
|
CYTOKINE_CYTOKINE_RECEPTOR_INTERACTION | 0.2684 | 1.1074 | 0.0800 |
|
CHEMOKINE_SIGNALING_PATHWAY | 0.2802 | 1.0802 | 0.0860 |
|
| D, DIAPH2-AS1 |
|
| KEGG pathways | ES | NES | NOM p-val |
|
|
VASCULAR_SMOOTH_MUSCLE_CONTRACTION | −0.3925 | −1.0452 | 0.3050 |
|
CYTOKINE_CYTOKINE_RECEPTOR_INTERACTION | 0.2130 | 0.9520 | 0.6348 |
|
CHEMOKINE_SIGNALING_PATHWAY | 0.2426 | 1.0289 | 0.3527 |
The pathway enrichment analysis demonstrated that
the RHPN1-AS1 network was significantly associated with cell
receptor-mediated signaling and cell adhesion pathways (Table II). A total of 26 genes, which
included C-X-C motif chemokine ligand (CXCL)1, interleukin (IL)6,
CXCL5, IL15, IL2 inducible T cell kinase (ITK), RAS guanyl
releasing protein 1 (RASGRP1), protein tyrosine phosphatase,
receptor type C (PTPRC), cluster of differentiation (CD)274, CD19,
CD72 and selectin E (SELE), were jointly involved in the six
pathways and positively associated with them. Furthermore, the
DIAPH2-AS1, FOXN3-AS2, LINC00652 and MEG3 networks were
significantly associated with ‘cytokine cytokine receptor signaling
pathway’, ‘chemokine signaling pathway’ and ‘vascular smooth muscle
contraction pathway’ (Table
III). A total of seven genes, which included C-C motif
chemokine ligand 11 (CCL11), TNF superfamily member 4 (TNFSF4),
adenylate cyclase 2 (ADCY2), actin, γ2, smooth muscle, enteric
(ACTG2), myosin light chain 9 (MYL9) and protein kinase
cGMP-dependent 1 (PRKG1), were commonly involved in these three
functional enrichment pathways, with significant positive
correlations between genes and pathways.
Discussion
It has been considered that lncRNAs serve important
roles in the development of lung adenocarcinoma, and may be used as
diagnostic markers for tumors (3,9–11).
To elucidate an lncRNA-based signature that predicts the prognosis
of patients with lung adenocarcinoma, a large amount of of RNA-seq
data and clinical survival prognosis information from patients with
adenocarcinoma was initially downloaded from TCGA and the GEO
database, and a co-expression network was constructed to mine
network modules with particular biological functions. A total of
eight modules were obtained in the GSE50081 training set. Of these,
five (red, blue, yellow, green and brown modules) featured high
stability and appeared likely to be associated with the
pathogenesis of lung adenocarcinoma. Integrated module analyses
that included stability, functional annotations, correlation
analysis with clinical factors and the differential expression of
lncRNAs, identified 32 lncRNAs in the brown, red, blue, green and
yellow modules. These were used for follow-up survival analysis.
Based on the results of the system clustering tree, Cox-PH model
and Kaplan-Meier survival curve, three risk scoring systems were
constructed, among which five lncRNAs (DIAPH2-AS1, FOXN3-AS2,
LINC00652, MEG3 and RHPN1-AS1) comprised a signature-based risk
scoring system that successfully classified the low-risk and the
high-risk samples in the training set.
Considering that MEG3 has been related to the
pathogenesis of lung adenocarcinoma (11,30,31),
it is possible that the other four lncRNAs may be potential novel
prognostic factors for lung adenocarcinoma. DIAPH2 is a mammalian
homolog of Drosophila diaphanous. The latter is a protein
required for cytokinesis, and belongs to a family of
formin-associated proteins containing repetitive polyproline
stretches (32). DIAPH2 interacts
with RhoD (33). However, there is
no information on the association between DIAPH2-AS1 and human
cancer. FOXN3 is an important member of the FOX family of
transcription factors that is essential in organ differentiation,
development, cell growth and cancer (34). FOXN3-AS2 may serve an important
role in esophageal cancer (35).
The function of FOXN3-AS2 in lung adenocarcinoma is not well
understood. The present study provides the first clue that
FOXN3-AS2 may be a potential diagnostic marker for lung
adenocarcinoma, to the best of our knowledge. RHPN1 was originally
identified as a RhoA GTPase-interacting partner (36). It was recently implicated as being
essential for the integrity of the glomerular filtration barrier
and is a key determinant of podocyte cytoskeleton architecture
(37). RHPN1-AS1 has a potential
role in the progression of uveal melanoma and might be an
attractive biomarker and therapeutic target in uveal melanoma
(38). LINC00652 is located in
human chromosome 20; no physiological function has been previously
reported, to the best of our knowledge. The risk stratification
capability of the five-lncRNAs signature was confirmed in the
validation set and independent validation set. The present data
reveal a potential biomarker that may predict the prognosis of lung
adenocarcinoma patients. The data may be helpful in future
explorations of the pathogenesis of lung adenocarcinoma.
It has been demonstrated that lncRNAs serve
important roles in a variety of biological processes by regulating
target genes at the transcriptional, posttranscriptional, and
epigenetic levels (39,40). Therefore, the present study
attempted to investigate the target genes regulated by the five
prognostic lncRNAs to decipher their possible biological functions
in the pathogenesis of lung adenocarcinoma. Since the results of
the module functional annotation demonstrated that lncRNAs in the
red and brown modules were primarily associated with the cellular
immune response and focal adhesion, respectively, these two modules
were used to select the associated mRNAs and to build the important
lncRNA-mRNA networks. Further KEGG pathway enrichment analysis
revealed that six pathways were significantly associated with the
RHPN1-AS1 network in the red module. These included cell
receptor-mediated signaling and cell adhesion pathways, which have
notable roles during the multistage progression of human
carcinogenesis (41). Therefore,
it was hypothesized that RHPN1-AS1 has the same directional
correlation with the six important pathways by positively
regulating the expression level of CXCL1, IL6, CXCL5, IL15, ITK,
PRSGRP1, PTPRC, CD274, CD19, CD72, SELE and other genes. CXCL1 has
been associated with lung cancer (42), upregulation of CD274 is associated
with the poor prognosis of lung adenocarcinoma (43,44),
and IL6 (45) and IL15 (46) are relevant to the pathogenesis of
lung adenocarcinoma. Another three pathways, including ‘cytokine
cytokine receptor signaling pathway’, ‘chemokine signaling pathway’
and ‘vascular smooth muscle contraction pathway’, were
significantly associated with the DIAPH2-AS1, FOXN3-AS2, LINC00652
and MEG3 networks in the brown module. A possible explanation is
that DIAPH2-AS1, FOXN3-AS2, LINC00652 and MEG3 have the same
directional correlation with the three important pathways by
positively regulating the expression levels of CCL11, TNFSF4,
ADCY2, ACTG2, MYL9 and RPKG1. It was reported that the differential
expression of ACTG2 is useful in distinguishing lung adenoma from
normal lung samples (47), and low
MYL9 expression might be associated with the development and
metastasis of non-small cell lung cancer (48). Moreover, CCL11 is reported to have
a direct and selective profibrogenic effect on lung and bronchial
fibroblasts (49). The present
data revealed the possible pathogenesis of lung adenocarcinoma, in
which five lncRNAs (DIAPH2-AS1, FOXN3-AS2, LINC00652, MEG3 and
RHPN1-AS1) may affect the occurrence and development of lung
adenocarcinoma by regulating the expression levels of target
genes.
It is noteworthy that this study was an extensive
bioinformatics study based on published data. The results require
further validation by in vitro or in vivo models.
These useful clues may help other researchers to perform relevant
research. In a further study, the expression levels of the five
lncRNAs in clinical samples with prognostic information may be
measured using experimental methods to validate the predictive
value of this five-lncRNA signature.
In conclusion, the present study identified and
validated a five-lncRNA signature predicting the prognosis of
patients with lung adenocarcinoma. The predictive ability of this
signature may be exploited as a promising prognostic biomarker for
lung adenocarcinoma. The target genes of these five prognostic
lncRNAs are associated with a number of cellular processes and
signaling pathways, including the cell receptor-mediated signaling
pathway and cell adhesion pathway. Therefore, these five prognostic
lncRNAs may be potential diagnostic markers. The present results
may be helpful to elucidate the possible pathogenesis of lung
adenocarcinoma.
Acknowledgements
Not applicable.
Funding
No funding was received.
Availability of data and materials
The datasets used and/or analyzed during the current
study are available from the corresponding author on reasonable
request.
Authors' contributions
JL performed data analyses and wrote the manuscript.
XY, SO, KL, YK, HL, YO and QL contributed significantly to the data
analyses and manuscript revision. RX conceived and designed the
study. All authors read and approved the final manuscript.
Ethics approval and consent to
participate
In the original article of the datasets, the trials
were approved by the local institutional review boards of all
participating centers, and informed consent was obtained from all
patients.
Patient consent for publication
Not applicable.
Competing interests
The authors declare that they have no competing
interests.
References
|
1
|
Stewart BW and Wild CP: World Cancer
Report, 2014. IARC, WHO Press; Lyon, France: 2014
|
|
2
|
Chen WQ, Zheng RS, Baade PD, Zhang S, Zeng
H, Bray F, Jemal A, Yu XQ and He J: Cancer statistics in China,
2015. CA Cancer J Clin. 66:1152016. View Article : Google Scholar : PubMed/NCBI
|
|
3
|
Li L, Feng T, Qu J, Feng N, Wang Y, Ma RN,
Li X, Zheng ZJ, Yu H and Qian B: LncRNA expression signature in
prediction of the prognosis of lung adenocarcinoma. Genet Test Mol
Biomarkers. 22:20–28. 2018. View Article : Google Scholar : PubMed/NCBI
|
|
4
|
Siegel RL, Miller KD and Jemal A: Cancer
statistics, 2016. CA Cancer J Clin. 66:7–30. 2016. View Article : Google Scholar : PubMed/NCBI
|
|
5
|
Bhattacharjee A, Richards WG, Staunton J,
Li C, Monti S, Vasa P, Ladd C, Beheshti J, Bueno R, Gillette M, et
al: Classification of human lung carcinomas by mRNA expression
profiling reveals distinct adenocarcinoma subclasses. Proc Natl
Acad Sci USA. 98:13790–13795. 2001. View Article : Google Scholar : PubMed/NCBI
|
|
6
|
Lin JJ, Cardarella S, Lydon CA, Dahlberg
SE, Jackman DM, Jänne PA and Johnson BE: Five-year survival in
EGFR-mutant metastatic lung adenocarcinoma treated with EGFR-TKIs.
J Thorac Oncol. 11:556–565. 2016. View Article : Google Scholar : PubMed/NCBI
|
|
7
|
Devarakonda S, Morgensztern D and Govindan
R: Genomic alterations in lung adenocarcinoma. Lancet Oncol.
16:e342–e351. 2015. View Article : Google Scholar : PubMed/NCBI
|
|
8
|
Galvan A, Frullanti E, Anderlini M,
Manenti G, Noci S, Dugo M, Ambrogi F, De Cecco L, Spinelli R,
Piazza R, et al: Gene expression signature of non-involved lung
tissue associated with survival in lung adenocarcinoma patients.
Carcinogenesis. 34:2767–2773. 2013. View Article : Google Scholar : PubMed/NCBI
|
|
9
|
Qiu M, Xu Y, Yang X, Wang J, Hu J, Xu L
and Yin R: CCAT2 is a lung adenocarcinoma-specific long non-coding
RNA and promotes invasion of non-small cell lung cancer. Tumour
Biol. 35:5375–5380. 2014. View Article : Google Scholar : PubMed/NCBI
|
|
10
|
Wu Y, Liu HB, Shi XF, Yao YW, Yang W and
Song Y: The long non-coding RNA HNF1A-AS1 regulates proliferation
and metastasis in lung adenocarcinoma. Oncotarget. 6:9160–9172.
2015.PubMed/NCBI
|
|
11
|
Li DS, Ainiwaer JL, Sheyhiding I, Zhang Z
and Zhang LW: Identification of key long non-coding RNAs as
competing endogenous RNAs for miRNA-mRNA in lung adenocarcinoma.
Eur Rev Med Pharmacol Sci. 20:2285–2295. 2016.PubMed/NCBI
|
|
12
|
Rousseaux S, Debernardi A, Jacquiau B,
Vitte AL, Vesin A, Nagy-Mignotte H, Moro-Sibilot D, Brichon PY,
Lantuejoul S, Hainaut P, et al: Ectopic activation of germline and
placental genes identifies aggressive metastasis-prone lung
cancers. Sci Transl Med. 5:186ra1662013. View Article : Google Scholar
|
|
13
|
Botling J, Edlund K, Lohr M, Hellwig B,
Holmberg L, Lambe M, Berglund A, Ekman S, Bergqvist M, Pontén F, et
al: Biomarker discovery in non-small cell lung cancer: Integrating
gene expression profiling, meta-analysis, and tissue microarray
validation. Clin Cancer Res. 19:194–204. 2013. View Article : Google Scholar : PubMed/NCBI
|
|
14
|
Der SD, Sykes J, Pintilie M, Zhu CQ,
Strumpf D, Liu N, Jurisica I, Shepherd FA and Tsao MS: Validation
of a histology-independent prognostic gene signature for
early-stage, non-small-cell lung cancer including stage IA
patients. J Thorac Oncol. 9:59–64. 2014. View Article : Google Scholar : PubMed/NCBI
|
|
15
|
Selamat SA, Chung BS, Girard L, Zhang W,
Zhang Y, Campan M, Siegmund KD, Koss MN, Hagen JA, Lam WL, et al:
Genome-scale analysis of DNA methylation in lung adenocarcinoma and
integration with mRNA expression. Genome Res. 22:1197–1211. 2012.
View Article : Google Scholar : PubMed/NCBI
|
|
16
|
Girard L, Rodriguez-Canales J, Behrens C,
Thompson DM, Botros IW, Tang H, Xie Y, Rekhtman N, Travis WD,
Wistuba II, et al: An expression signature as an aid to the
histologic classification of non-small cell lung cancer. Clin
Cancer Res. 22:4880–4889. 2016. View Article : Google Scholar : PubMed/NCBI
|
|
17
|
Landi MT, Dracheva T, Rotunno M, Figueroa
JD, Liu H, Dasgupta A, Mann FE, Fukuoka J, Hames M, Bergen AW, et
al: Gene expression signature of cigarette smoking and its role in
lung adenocarcinoma development and survival. PLoS One.
3:e16512008. View Article : Google Scholar : PubMed/NCBI
|
|
18
|
Kabbout M, Garcia MM, Fujimoto J, Liu DD,
Woods D, Chow CW, Mendoza G, Momin AA, James BP, Solis L, et al:
ETS2 mediated tumor suppressive function and MET oncogene
inhibition in human non-small cell lung cancer. Clin Cancer Res.
19:3383–3395. 2013. View Article : Google Scholar : PubMed/NCBI
|
|
19
|
Parrish RS and Spencer HJ III: Effect of
normalization on significance testing for oligonucleotide
microarrays. J Biopharm Stat. 14:575–589. 2004. View Article : Google Scholar : PubMed/NCBI
|
|
20
|
Ritchie ME, Phipson B, Wu D, Hu Y, Law CW,
Shi W and Smyth GK: Limma powers differential expression analyses
for RNA-sequencing and microarray studies. Nucleic Acids Res.
43:e472015. View Article : Google Scholar : PubMed/NCBI
|
|
21
|
Bolstad BM, Irizarry RA, Astrand M and
Speed TP: A comparison of normalization methods for high density
oligonucleotide array data based on variance and bias.
Bioinformatics. 19:185–193. 2003. View Article : Google Scholar : PubMed/NCBI
|
|
22
|
Larkin MA, Blackshields G, Brown NP,
Chenna R, McGettigan PA, McWilliam H, Valentin F, Wallace IM, Wilm
A, Lopez R, et al: Clustal W and Clustal X version 2.0.
Bioinformatics. 23:2947–2948. 2007. View Article : Google Scholar : PubMed/NCBI
|
|
23
|
Zhai X, Xue Q, Liu Q, Guo Y and Chen Z:
Colon cancer recurrence-associated genes revealed by WGCNA
co-expression network analysis. Mol Med Rep. 16:6499–6505. 2017.
View Article : Google Scholar : PubMed/NCBI
|
|
24
|
Langfelder P and Horvath S: WGCNA: An R
package for weighted correlation network analysis. BMC
Bioinformatics. 9:5592008. View Article : Google Scholar : PubMed/NCBI
|
|
25
|
Chong QI, Hong L, Cheng Z and Yin Q:
Identification of metastasis-associated genes in colorectal cancer
using metaDE and survival analysis. Oncol Lett. 11:568–574. 2016.
View Article : Google Scholar : PubMed/NCBI
|
|
26
|
Wang XB, Kang DD, Shen K, Song C, Lu S,
Chang LC, Liao SG, Huo Z, Tang S, Ding Y, et al: An R package suite
for microarray meta-analysis in quality control, differentially
expressed gene analysis and pathway enrichment detection.
Bioinformatics. 28:2534–2536. 2012. View Article : Google Scholar : PubMed/NCBI
|
|
27
|
Tibshirani R: The lasso method for
variable selection in the Cox model. Stat Med. 16:385–395. 1997.
View Article : Google Scholar : PubMed/NCBI
|
|
28
|
Goeman JJ: L1 penalized estimation in the
Cox proportional hazards model. Biom J. 52:70–84. 2010.PubMed/NCBI
|
|
29
|
Subramanian A, Tamayo P, Mootha VK,
Mukherjee S, Ebert BL, Gillette MA, Paulovich A, Pomeroy SL, Golub
TR, Lander ES and Mesirov JP: Gene set enrichment analysis: A
knowledge-based approach for interpreting genome-wide expression
profiles. Proc Natl Acad Sci USA. 102:15545–15550. 2005. View Article : Google Scholar : PubMed/NCBI
|
|
30
|
Kruer TL, Dougherty SM, Reynolds L, Long
E, de Silva T, Lockwood WW and Clem BF: Expression of the lncRNA
maternally expressed gene 3 (MEG3) contributes to the control of
lung cancer cell proliferation by the Rb pathway. PLoS One.
11:e01663632016. View Article : Google Scholar : PubMed/NCBI
|
|
31
|
Liu J, Wan L, Lu KH, Sun M, Pan X, Zhang
P, Lu B, Liu G and Wang Z: The long noncoding RNA MEG3 contributes
to cisplatin resistance of human lung adenocarcinoma. PLoS One.
10:e01145862015. View Article : Google Scholar : PubMed/NCBI
|
|
32
|
Watanabe N, Madaule P, Reid T, Ishizaki T,
Watanabe G, Kakizuka A, Saito Y, Nakao K, Jockusch BM and Narumiya
S: p140mDia, a mammalian homolog of Drosophila diaphanous, is a
target protein for Rho small GTPase and is a ligand for profilin.
EMBO J. 16:3044–3056. 1997. View Article : Google Scholar : PubMed/NCBI
|
|
33
|
Gasman S, Kalaidzidis Y and Zerial M: RhoD
regulates endosome dynamics through Diaphanous-related Formin and
Src tyrosine kinase. Nat Cell Biol. 5:195–204. 2003. View Article : Google Scholar : PubMed/NCBI
|
|
34
|
Sun J, Li H, Huo Q, Cui M, Ge C, Zhao F,
Tian H, Chen T, Yao M and Li J: The transcription factor FOXN3
inhibits cell proliferation by downregulating E2F5 expression in
hepatocellular carcinoma cells. Oncotarget. 7:43534–43545.
2016.PubMed/NCBI
|
|
35
|
Li S, Xu Y, Sun Z, Feng L, Shang D, Zhang
C, Shi X, Han J, Su F, Yang H, et al: Identification of a lncRNA
involved functional module for esophageal cancer subtypes. Mol
Biosyst. 12:3312–3323. 2016. View Article : Google Scholar : PubMed/NCBI
|
|
36
|
Watanabe G, Saito Y, Madaule P, Ishizaki
T, Fujisawa K, Morii N, Mukai H, Ono Y, Kakizuka A and Narumiya S:
Protein kinase N (PKN) and PKN-related protein rhophilin as targets
of small GTPase Rho. Science. 271:645–648. 1996. View Article : Google Scholar : PubMed/NCBI
|
|
37
|
Lal MA, Andersson AC, Katayama K, Xiao Z,
Nukui M, Hultenby K, Wernerson A and Tryggvason K: Rhophilin-1 is a
key regulator of the podocyte cytoskeleton and is essential for
glomerular filtration. J Am Soc Nephrol. 26:647–662. 2015.
View Article : Google Scholar : PubMed/NCBI
|
|
38
|
Lu L, Yu X, Zhang L, Ding X, Pan H, Wen X,
Xu S, Xing Y, Fan J, Ge S, et al: The long non-coding RNA
RHPN1-AS1promotes uveal melanoma progression. Int J Mol Sci.
18:E2262017. View Article : Google Scholar : PubMed/NCBI
|
|
39
|
Fatica A and Bozzoni I: Long non-coding
RNAs: New players in cell differentiation and development. Nat Rev
Genet. 15:7–21. 2014. View Article : Google Scholar : PubMed/NCBI
|
|
40
|
Kornienko AE, Guenzl PM, Barlow DP and
Pauler FM: Gene regulation by the act of long non-coding RNA
transcription. BMC Biol. 11:592013. View Article : Google Scholar : PubMed/NCBI
|
|
41
|
Hirohashi S and Kanai Y: Cell adhesion
system and human cancer morphogenesis. Cancer Sci. 52:575–581.
2004.
|
|
42
|
Liu Y, Wu BQ, Geng H, Xu ML and Zhong HH:
Association of chemokine and chemokine receptor expression with the
invasion and metastasis of lung carcinoma. Oncol Lett.
10:1315–1322. 2015. View Article : Google Scholar : PubMed/NCBI
|
|
43
|
Zhang Y, Du W, Chen Z and Xiang C:
Upregulation of PD-L1 by SPP1 mediates macrophage polarization and
facilitates immune escape in lung adenocarcinoma. Exp Cell Res.
359:449–457. 2017. View Article : Google Scholar : PubMed/NCBI
|
|
44
|
Yeo MK, Choi SY, Seong IO, Suh KS, Kim JM
and Kim KH: Association of PD-L1 expression and PD-L1 gene
polymorphism with poor prognosis in lung adenocarcinoma and
squamous cell carcinoma. Hum Pathol. 68:103–111. 2017. View Article : Google Scholar : PubMed/NCBI
|
|
45
|
Miller A, Mcleod L, Alhayyani S, Szczepny
A, Watkins DN, Chen W, Enriori P, Ferlin W, Ruwanpura S and Jenkins
BJ: Blockade of the IL-6 trans-signalling STAT3 axis suppresses
cachexia in Kras-induced lung adenocarcinoma. Oncogene.
36:3059–3066. 2016. View Article : Google Scholar : PubMed/NCBI
|
|
46
|
Wei C, Wang W, Pang W, Meng M, Jiang L,
Xue S, Xie Y, Li R and Hou Z: The CIK cells stimulated with
combination of IL-2 and IL-15 provide an improved cytotoxic
capacity against human lung adenocarcinoma. Tumour Biol.
35:1997–2007. 2014. View Article : Google Scholar : PubMed/NCBI
|
|
47
|
Dong L, Jensen RV, De Rienzo A, Gordon GJ,
Xu Y, Sugarbaker DJ and Bueno R: Differentially expressed
alternatively spliced genes in malignant pleural mesothelioma
identified using massively parallel transcriptome sequencing. BMC
Med Genet. 10:1492009. View Article : Google Scholar : PubMed/NCBI
|
|
48
|
Tan X and Chen M: MYLK and MYL9 expression
in non-small cell lung cancer identified by bioinformatics analysis
of public expression data. Tumour Biol. 35:12189–12200. 2014.
View Article : Google Scholar : PubMed/NCBI
|
|
49
|
Puxeddu I, Bader R, Piliponsky AM, Reich
R, Levi-Schaffer F and Berkman N: The CC chemokine eotaxin/CCL11
has a selective profibrogenic effect on human lung fibroblasts. J
Allergy Clin Immunol. 117:103–110. 2006. View Article : Google Scholar : PubMed/NCBI
|