Introduction
Insulin resistance (IR) is a condition in which the
body does not respond appropriately to circulating insulin. It is
common in various metabolic disorders, such as diabetes, obesity,
hypertension and coronary heart disease. IR occurs in a number of
tissues, including liver, muscle and fat (1).
As a newly identified class of small non-coding RNA,
microRNA (miRNA/miR) have been widely implicated in numerous
physiological processes, including the pathogenesis of diabetes and
obesity (2). miRNAs regulate the
translation of mRNAs by specifically binding to the 3′-untranslated
region of mRNA and inhibiting translation or targeting the
transcript for degradation (3).
Previous studies have suggested that dysregulation of hepatic
miRNAs leads to type 2 diabetes mellitus (T2DM). A number of miRNAs
have been reported to contribute to IR in vivo (4–6).
MicroRNA-802 (miR-802) expression has been reported
at high levels in the serum and livers of C57BL/6J mice fed a
high-fat high-sucrose diet (7),
db/db mice (Leprdb/db) and obese subjects (8). Overexpression of miR-802 can cause IR
and impair glucose tolerance, whereas downregulated miR-802
expression in obese mice improved these metabolic parameters,
suggesting that higher miR-802 expression results in an increased
risk of obesity-associated IR (8).
miR-802 not only induces IR, but also enhances both basal and
forskolin-induced expression of glucose-6-phosphatase (8). However, the roles of miR-802 in
oxidative stress of the liver remain to be elucidated. It is known
that diabetic complications in target organs result from chronic
elevations in the levels of glucose. The pathogenic effect of high
glucose, possibly in combination with fatty acids, is mediated to a
significant extent via increased production of reactive oxygen
species (ROS) and the subsequent oxidative stress. An increase in
the levels of insulin, free fatty acid and/or glucose can elevate
ROS production and oxidative stress, as well as activate
stress-sensitive pathways. β-cells are sensitive to ROS, which may
be associated with their lack of relevant free-radical quenching
(antioxidant) enzymes such as catalase (CAT), glutathione
peroxidase (GSH-Px) and superoxide dismutase (SOD) (9). Indeed, persistent ROS generation can
diminish insulin action through activation of serine-threonine
kinase cascades that, in turn, phosphorylate several targets,
including the insulin receptor and the insulin receptor substrate
(IRS) proteins, with consequent decrease in insulin-stimulated
tyrosine phosphorylation, thereby increasing IR and accelerating
the progression to overt type 2 diabetes (10).
In the present study, a model of IR was established
by feeding mice a high-fat diet (HFD). An adeno-associated virus
(AAV) overexpressing miR-802 was administered to the mice via tail
vein injection. AAV vectors are single-stranded DNA viruses and one
of the smallest types of vector, with a packaging limit of ~5 kb.
AAV vectors stably and efficiently infect a wide variety of
dividing or quiescent cells and have been clinically studied in
multiple tissue types (11). In
particular, AAV vectors provide efficient systemic gene delivery
directly to skeletal muscle in vivo and lentivirus vectors
may enable a combination of ex vivo gene modification
strategies with cell-mediated therapies. AAVs can deliver
substantially higher miRNA copy numbers per cell than lentiviruses
(hundreds vs. a single or few copies) and therefore provide greater
in vivo efficacy and a wider therapeutic window (12). Therefore, AAVs and not lentiviruses
were used in the present study. Subsequently, it was investigated
whether miR-802 induces IR in the mice by increasing hepatic
oxidative stress.
Materials and methods
Animal study
Male C57BL/6J mice (n=50; age, 5 weeks old; weight,
16–19 g) were obtained from Charles River Laboratories, Inc.
(Beijing, China). The animals were housed at a constant temperature
(22±2°C) and humidity (50±10%) under a 12-h light/dark cycle with
access to a standard chow diet and water ad libitum.
Following 1 week of acclimatization, the 6-week old mice were fed
either a normal diet (CON group; n=10) or high fat diet (HFD group;
n=40) for the next 12 weeks. The high fat diet consisted of 60%
kcal fat, 20% kcal carbohydrate and 20% kcal protein (cat. no.
D12492; Huafukang Biology Co., Ltd.). The normal diet consists of
10% kcal fat, 70% kcal carbohydrate and 20% kcal protein (cat. no.
D12450J; Huafukang Biology Co., Ltd.). The present study was
approved by the Animal Care and Use Committee of Hebei General
Hospital (Shijiazhuang, China).
Recombinant AAVs expressing miR-802 (AAV-miR-802,
5′-GGUCCUAUUAUUUGCAAUCAGUAACAAAGAUUCAUCCUUGUGUCAAUCAUACAACACGGAGAGUCUUUGUCACUCAGUGUAAUUAAUAGCCUUCACC-3′)
or miR-802 sponges (inhibitor; AAV-miR-802-SP,
3′-AAGGATGAATCTTTGTTACTGATATACAAGGATGAATCTTTGTTACTGAACATCAAGGATGAATCTTTGTTACTGATCTTCAAAGGATGAATCTTTGTTACTGA-5′)
and a negative control AAV vector containing green fluorescent
protein (AAV-GFP) were purchased from Shanghai HanHeng Co.,
(Shanghai, China).
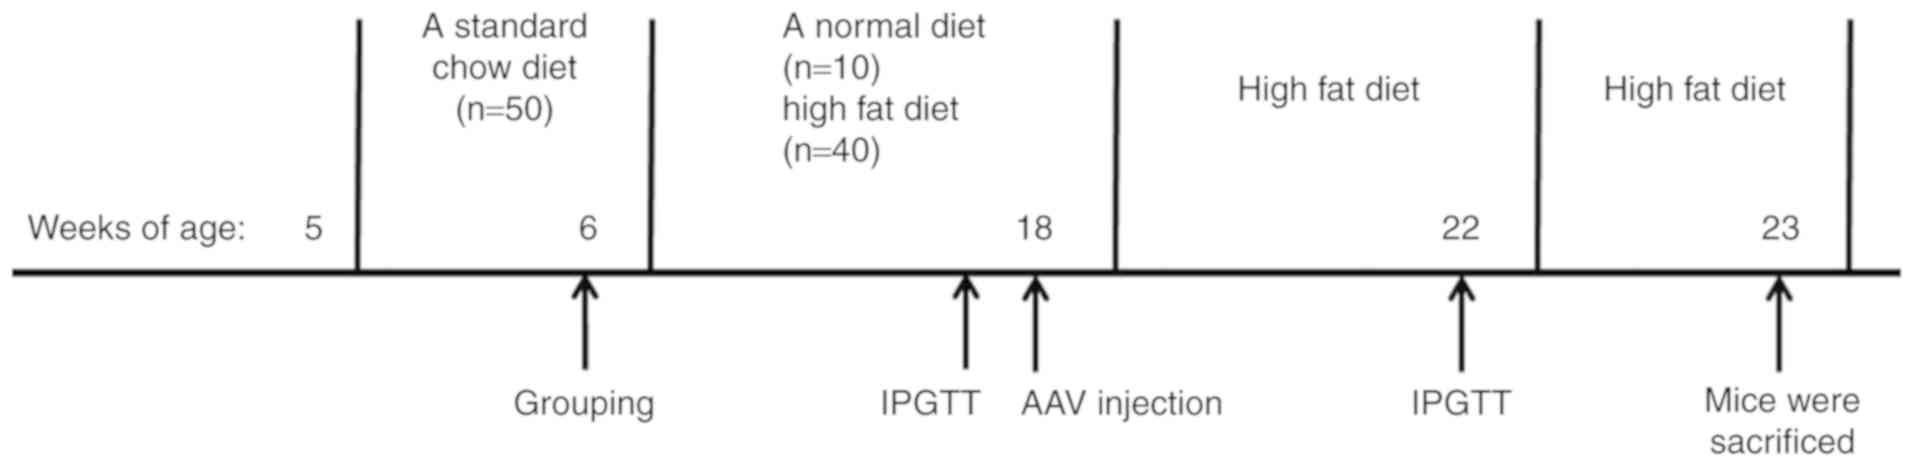
After 12 weeks of the HFD, the AAV vectors were
administered to the mice via tail vein injection at a dose of
1×10¹¹ plaque-forming units in 0.1 ml PBS. The HFD group
(n=40) were subdivided randomly into the following four groups
(n=10 mice/group): HFD, HFD + AAV-miR-802, HFD + AAV-GFP and HFD +
AAV-miR-802-SP. After injection, mice were fed with a HFD for 5
weeks. The mice were sacrificed after AAV injection 5 weeks via
cervical dislocation. The liver was quickly removed after sacrifice
and then divided into 5 parts for further study. One part was
washed with cold phosphate-buffered saline immediately and embedded
in OCT embedding agent for dihydroethidium (DHE)-staining. The rest
of the liver tissue was frozen at −80°C in an EP tube in liquid
nitrogen respectively for the detection by western blotting,
triglyceride (TG), lipid peroxidation (LPO) and ROS-related enzyme
activities. Ensure that detections are completed as soon as
possible and prevent repeated freezing and thawing of the tissue.
The time line for the experiment is depicted in Fig. 1.
Sample collection and total
cholesterol (TC) and TG measurement
Following the experimental period, the mice were
fasted overnight and then sacrificed. All samples were immediately
placed in liquid nitrogen after removal in order to minimize
damage. The blood plasma and liver were sampled from the same mice.
The levels of glucose, insulin, total TC (A111-1; Nanjing Jiancheng
Bioengineering Institute, Nanjing, China) and TG (A110-1; Nanjing
Jiancheng Bioengineering Institute, Nanjing, China) in the blood
were measured.
Enzyme kits were used to measure the hepatic TG
(A110-1; Nanjing Jiancheng Bioengineering Institute, Nanjing,
China), according to the manufacturer's protocol. The TG content of
the livers was measured by first weighing the liver samples and
then homogenizing them with anhydrous ethanol (1 g: 9 ml). The
samples were centrifuged at room temperature for 10 min at 2,500
rpm (1,048.1 × g) and then the supernatant was removed to determine
the level of TG. The supernatants were mixed with reagent from kit
according to the manufacturer's protocol. The reaction mixtures
were placed in a water bath at 37°C for 10 min. The absorbance was
measured at 510 nm. The results were expressed as mmol/g
protein.
Intraperitoneal glucose tolerance test
(IPGTT) and serum insulin analysis
IPGTT were carried out at 12 weeks after HFD
intervention (18 weeks of age) and at 4 weeks after AAV injection
(22 weeks of age). The IPGTT was performed via intraperitoneal
injection of glucose (2 g/kg) after fasting overnight (13). Blood was collected from the tail
vein of the mice in a heparinized capillary tube and the blood
glucose was analyzed with a glucometer (ACCU-CHEK; Roche
Diagnostics GmbH, Mannheim, Germany) at 0 min (prior to the glucose
load), and at 15, 30, 60 and 120 min after the glucose load. The
levels of insulin were measured using insulin ELISA kits (ALCO
Chem. Inc.; cat. no. 04505) according to the manufacturers'
protocol.
IR was calculated using the QUICKI method: QUICKI =
1/[log(I0) + log(G0)]), where I0
is the fasting insulin level (µU/ml) and G0 is the
fasting blood glucose level (mg/dl) (14). The QUICKI method is a mathematical
model that correlates well with the ‘gold standard’ in IR assays,
the euglycemic clamp (14) and
mice or rats with IR tend to have lower QUICKI or insulin
sensitivity values.
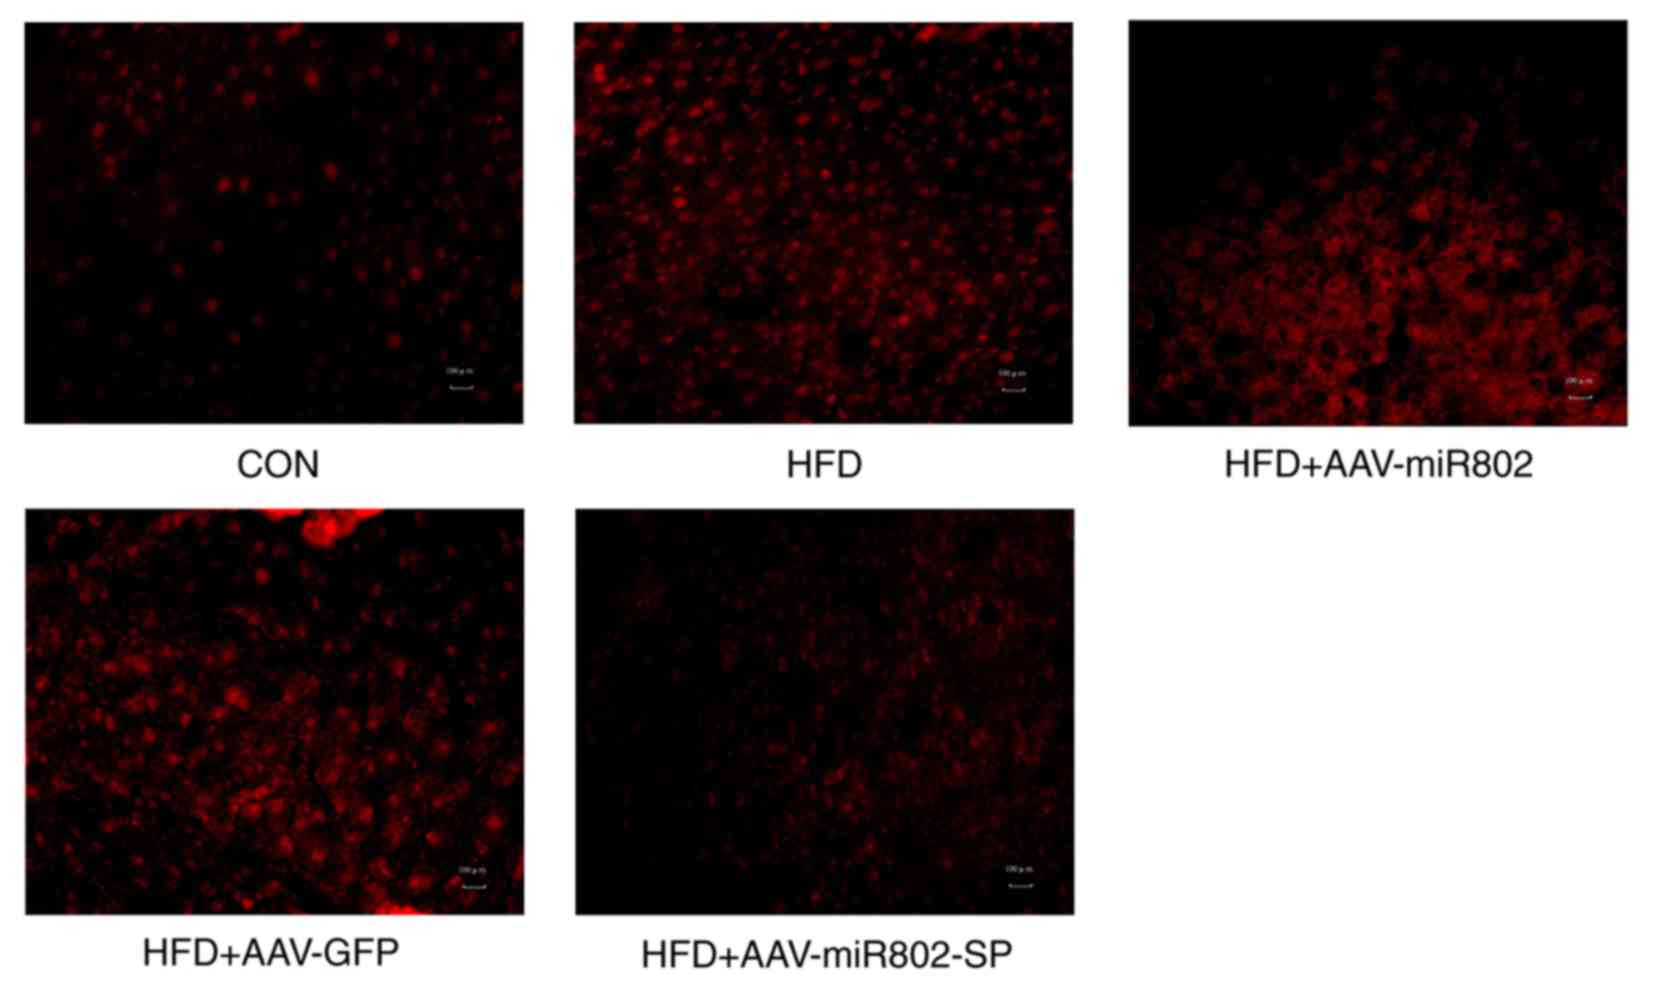
Measurement of ROS production
The levels of ROS were measured with DHE, which can
bind irreversibly to DNA to produce ETH-DNA and displays red
fluorescent signal when oxidized (15). The liver was removed after
sacrifice, a part of the liver was taken and the unfixed tissue was
embedded in OCT embedding agent to prepare frozen slices using the
dry ice acetone method for cryosectioning. The method is described
as follows: 200 ml acetone was injected into a small wide-mouth
thermos flask. Dry ice was gradually added to the flask until it
was saturated and did not bubble. The temperature was ~-70°C. A
small beaker containing 50 ml isopentane was placed into a dry
ice-acetone saturated solution. Tissue blocks embedded in OCT were
then frozen at −40°C in isopentane for 1 min. The frozen segments
were cut into 8-µm-thick transverse sections that were then placed
on glass slides. Following incubation with DHE (10 µm/l) in a
light-protected chamber at 37°C for 40 min, ultrathin (8 µm) frozen
sections of the liver were prepared using a cryostat (Microm HM525;
Thermo Fisher Scientific, Inc., Waltham, MA, USA) at −20°C. The
fluorescence was measured using a fluorescent microscope (Leica
DMI3000 B; Leica Microsystems GmbH, Wetzlar, Germany) at
excitation/emission wavelengths of 530/616 nm.
Measurement of ROS-related enzyme
activities and LPO
The liver samples were homogenized in ice-cold
potassium phosphate-buffered saline at 10-20X dilution. Liver
specimens (10%) in 0.15 M KCl was prepared with a homogenizer from
Pro Scientific, Inc. (PRO 200). After centrifuging at 1,257.7 × g
for 10 min at 4°C, the tissue supernatants were used to measure the
activity of the following anti-oxidant enzymes: CAT (cat. no.
A007-1; Nanjing Jiancheng Biological Engineering Institute), SOD
(cat. no. A001-3; Nanjing Jiancheng Biological Engineering
Institute), reduced glutathione (GSH; cat. no. A006-1; Nanjing
Jiancheng Biological Engineering Institute) and GSH-Px (cat. no.
A005; Nanjing Jiancheng Biological Engineering Institute). All
parameters were determined according to manufacturers'
protocol.
The levels of LPO (cat. no. A106-1; Nanjing
Jiancheng Biological Engineering Institute) were also measured. In
brief, samples were mixed with reagent from kit. The reaction
mixtures were placed in a 45°C water bath for 60 min and
centrifuged at 1,677 × g at room temperature for 10 min. The
absorbance of the supernatant was measured at 586 nm. The results
were expressed as µmol/g protein.
CAT activity was determined using a
spectrophotometer at 405 nm. In brief, samples were mixed with the
reagent from the kit according to the manufacturer's protocol. A
0.5 cm optical path was used and zero adjustment to measure the
absorbance. The amount of enzyme capable of catalyzing the
degradation of 1 µmol of H2O2 per min was
defined as 1 U.
SOD activity was assayed by measuring its ability to
inhibit the photoreduction of nitroblue tetrazolium (NBT) according
to the manufacturer's protocol of the kit. The changes in
absorbance at 450 nm were recorded after 37°C water bath for 20
min. A total of 1 unit of SOD is defined as the amount that
inhibits the NBT reaction by 50%. Specific activity was defined as
U/mg protein.
The tissue GSH concentrations were determined using
a visible spectrum spectrophotometer. Briefly, fresh supernatant
(0.5 ml) was added to applied solution of reagent 1 (2 ml) and
centrifuged at 1,677 × g at room temperature for 10 min. The
mixture was rested for five min, 1 cm optical path was used and
zero adjustment to measure the absorbance of each tube. The optical
density was measured at 420 nm in the spectrophotometer.
Activity of GSH-Px was determined using a visible
spectrum spectrophotometer according to the manufacturer's
protocol. GSH-Px activity for tissues was expressed as U/mg
protein.
Western blot analysis
Western blot analysis was conducted as previously
described (16). To obtain total
proteins, a part of liver tissue from the mice was lysed in a
buffer containing 50 mM TrisHCl (pH 7.4), 150 mM NaCl, 1% Triton
X100, 0.1% SDS and 1 mM phenylmethylsulfonyl fluoride. The protein
concentration was measured using a bicinchoninic acid assay method
(Beijing Solarbio Science and Technology, Co., Ltd., Beijing,
China). Lysates of 1,015 µg protein were separated by 10% SDSPAGE
gel, transferred onto polyvinylidene difluoride membranes (EMD
Millipore, Billerica, MA, USA), blocked with 5% skimmed dry milk at
room temperature for 1 h and probed with primary antibodies at 4°C
overnight. The primary antibodies used included those for
extracellular signal regulated kinase (ERK; CST4695; anti-rabbit;
1:1,000; Cell Signaling Technology, Inc.), phosphorylated
(phosphor)-ERK (Thr202/Tyr204; CST4370; anti-rabbit; 1:2,000; Cell
Signaling Technology, Inc.), p38mitogen-activated protein kinases
(p38MAPK; CST8690; anti-rabbit; 1:1,000; Cell Signaling Technology,
Inc.), phosphor-p38MAPK (Thr180/Tyr182; CST4511, anti-rabbit;
1:1,000; Cell Signaling Technology, Inc.), c-Jun N-terminal kinase
(JNK; CST9252; anti-rabbit; 1:1,000; Cell Signaling Technology,
Inc.), phosphor-JNK (Thr183/Tyr185; CST4671; anti-rabbit; 1:1,000;
Cell Signaling Technology, Inc.), insulin receptor substrate-1
(IRS-1; CST3089; anti-rabbit; 1:1,000; Cell Signaling Technology,
Inc.), phosphor-IRS-1 (Ser307; cat. no. ab3690; anti-rabbit;
1:2,000; Abcam), protein kinase B (AKT1; cat. no. CST75692;
anti-rabbit, 1:1,000; Cell Signaling Technology, Inc.) and
phosphor-AKT1 (Ser473; cat. no. CST9018; anti-rabbit, 1:1,000; Cell
Signaling Technology, Inc.). The blots were subsequently incubated
with horseradish peroxidaseconjugated secondary antibodies at room
temperature for 1 h, the secondary antibodies used were
peroxidaseconjugated rabbit (cat. no. sc2031) or mouse (cat. no.
sc2032) antibodies (1:10,000; both from GE Healthcare BioSciences,
Pittsburgh, PA, USA) followed by detection via and ECL kit (cat.
no. sc2048; Santa Cruz Biotechnology, Inc., Dallas, TX, USA). The
protein bands were quantified by densitometry using ImageJ software
(version 1.51k; National Institutes of Health, Bethesda, MD, USA).
β-actin was used as a loading control (CST3700; antimouse;
1:10,000; Cell Signaling Technology, Inc.).
Statistical analysis
SPSS 17.0 software (SPSS, Inc., Chicago, IL, USA)
was used for data analysis and the results were expressed as the
mean ± standard error of the mean. Student's ttest was performed
for comparisons between two groups. A one-way analysis of variance
was used to detect statistical significance followed by post hoc
Dunn's test. The experiments were repeated three times. P<0.05
was considered to indicate a statistically significant
difference.
Results
Hepatic miR-802 expression increases
in the HFD group
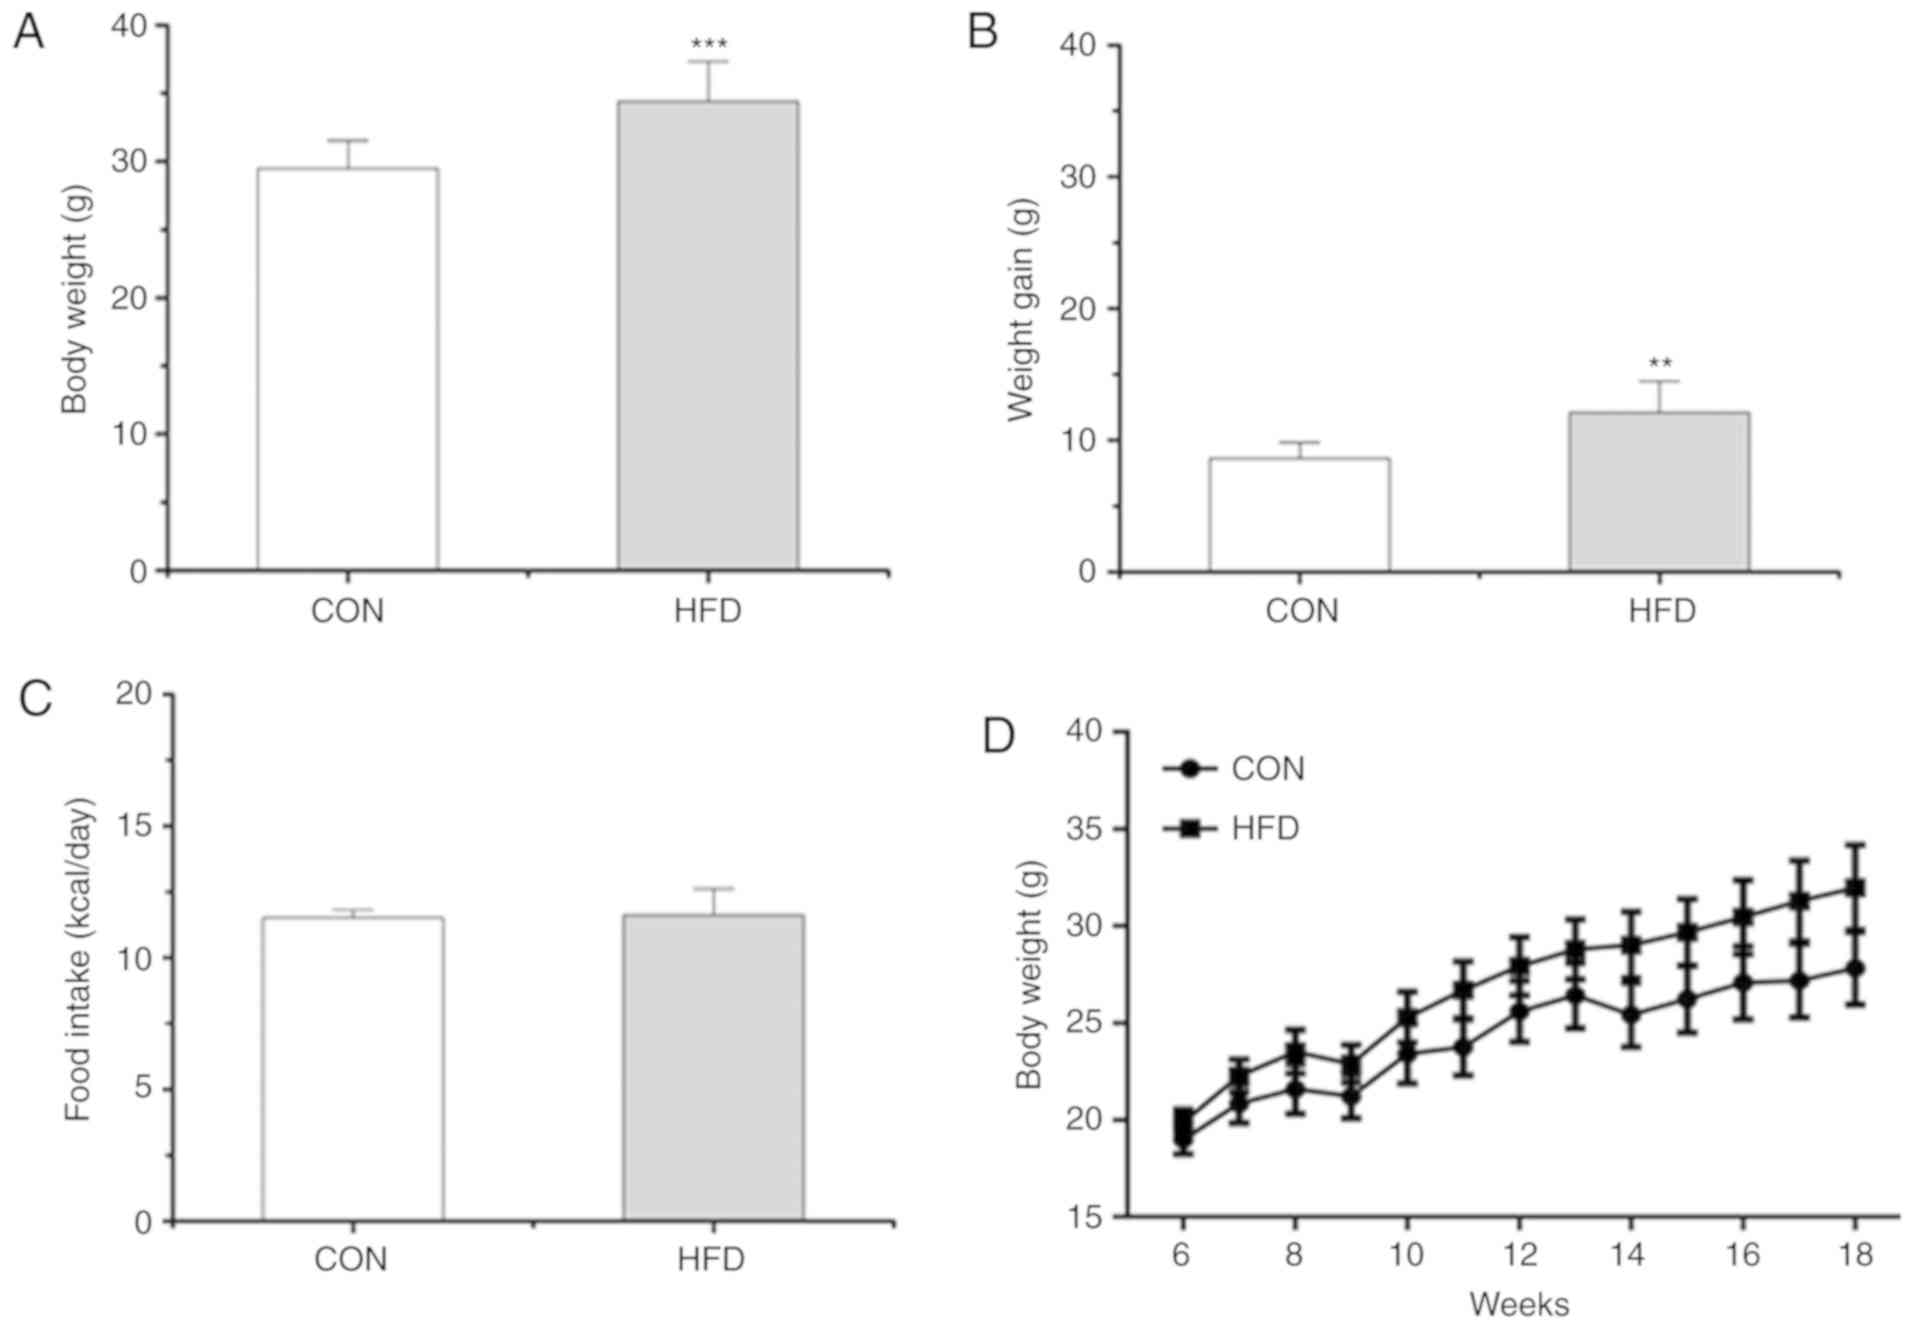
After diet intervention for 12 weeks, the body
weight of the mice in the HFD group was increased compared with the
CON group (Fig. 2A, B and D). Food
intake was similar in the two groups (Fig. 2C). The levels of hepatic miR-802
expression were significantly increased in the HFD group compared
with the CON group (P<0.001; Fig.
3A).
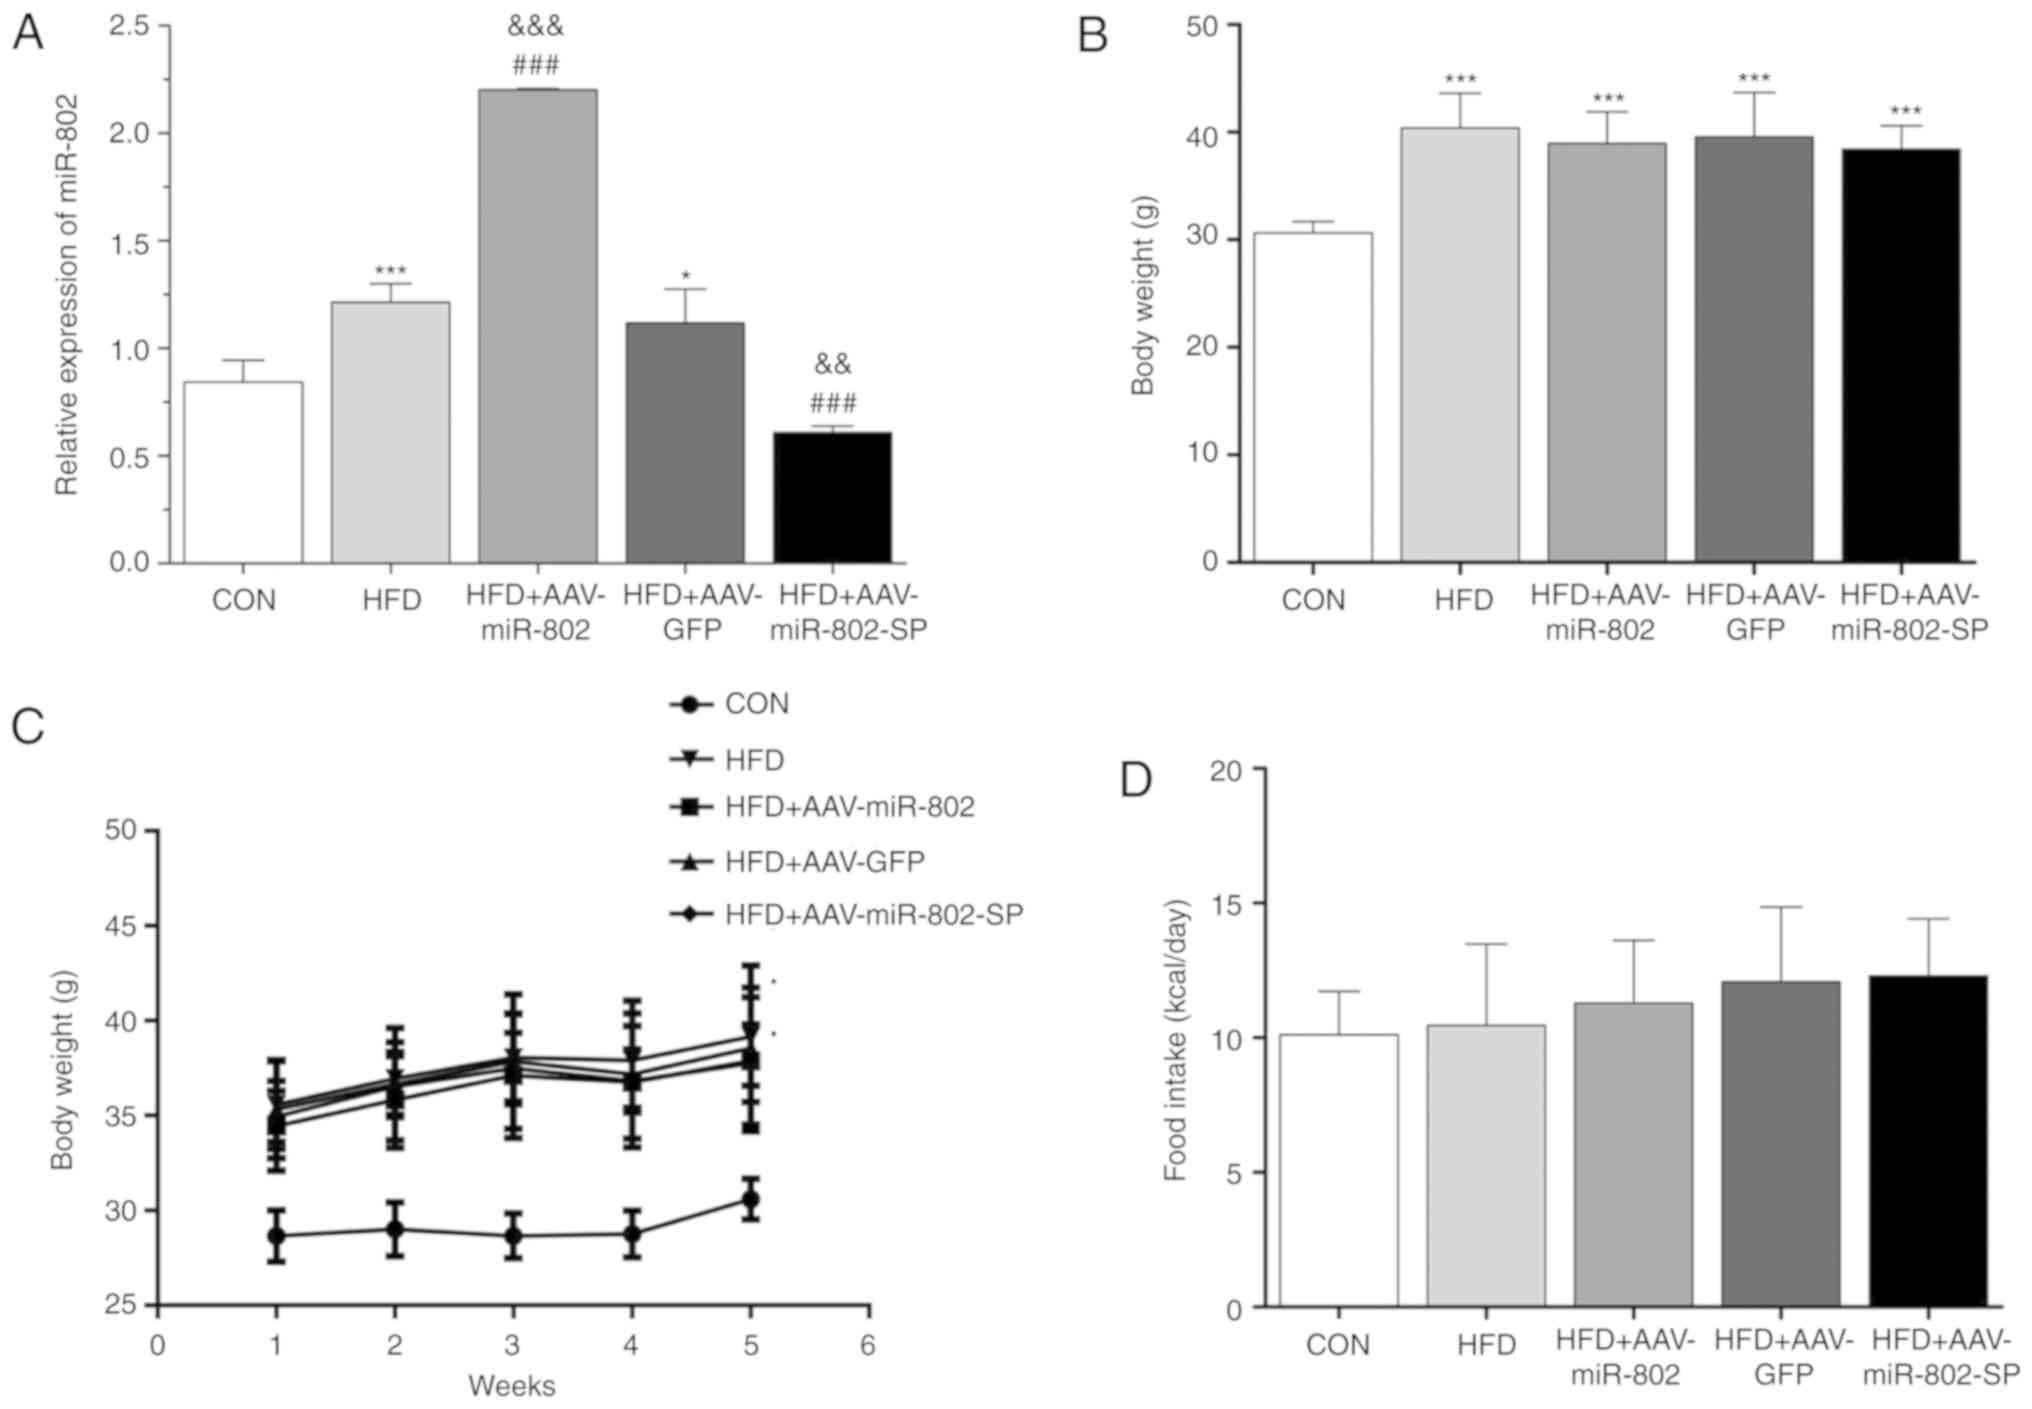
After treatment for 5 weeks with the AAVs, the
expression levels of miR-802 were highest in the HFD + AAV-miR-802
group and lowest in the HFD + AAV-miR-802-SP group (Fig. 3A). The body weight and food intake
were not significantly different between the upregulated and
downregulated miR-802 groups (Fig.
3B-D), which indicates that miR-802 has no significant
influence on body weight.
Effect of miR-802 on blood glucose,
serum insulin and IR
After intervention for 12 weeks with a HFD, the HFD
mice exhibited a significant increase in the blood glucose and
serum insulin levels compared to the CON group (P<0.001;
Fig. 4A-C). The IPGTT revealed
that the HFD fed mice had higher blood glucose levels at 15 and 30
min compared with the CON group. The levels of blood glucose at 0,
60 and 120 min were not significantly different between the two
groups (Fig. 4A). After
intervention for 5 weeks with AAV, in the mice with upregulated
miR-802 expression, the blood glucose levels were further increased
at 0, 15 and 30 min than the HFD group. After administration of
AAV-miR-802-SP, the elevated blood glucose levels were reduced at 0
min compared with the HFD group. The glucose levels at 15, 30, 60
and 120 min were not significantly different among the groups
(Fig. 4D). The 5-week treatment
with the miR-802 plasmid resulted in increased levels of blood
glucose compared with the HFD group. The effect of AAV-miR-802-SP
on the glucose levels was significantly reduced compared with the
HFD group.
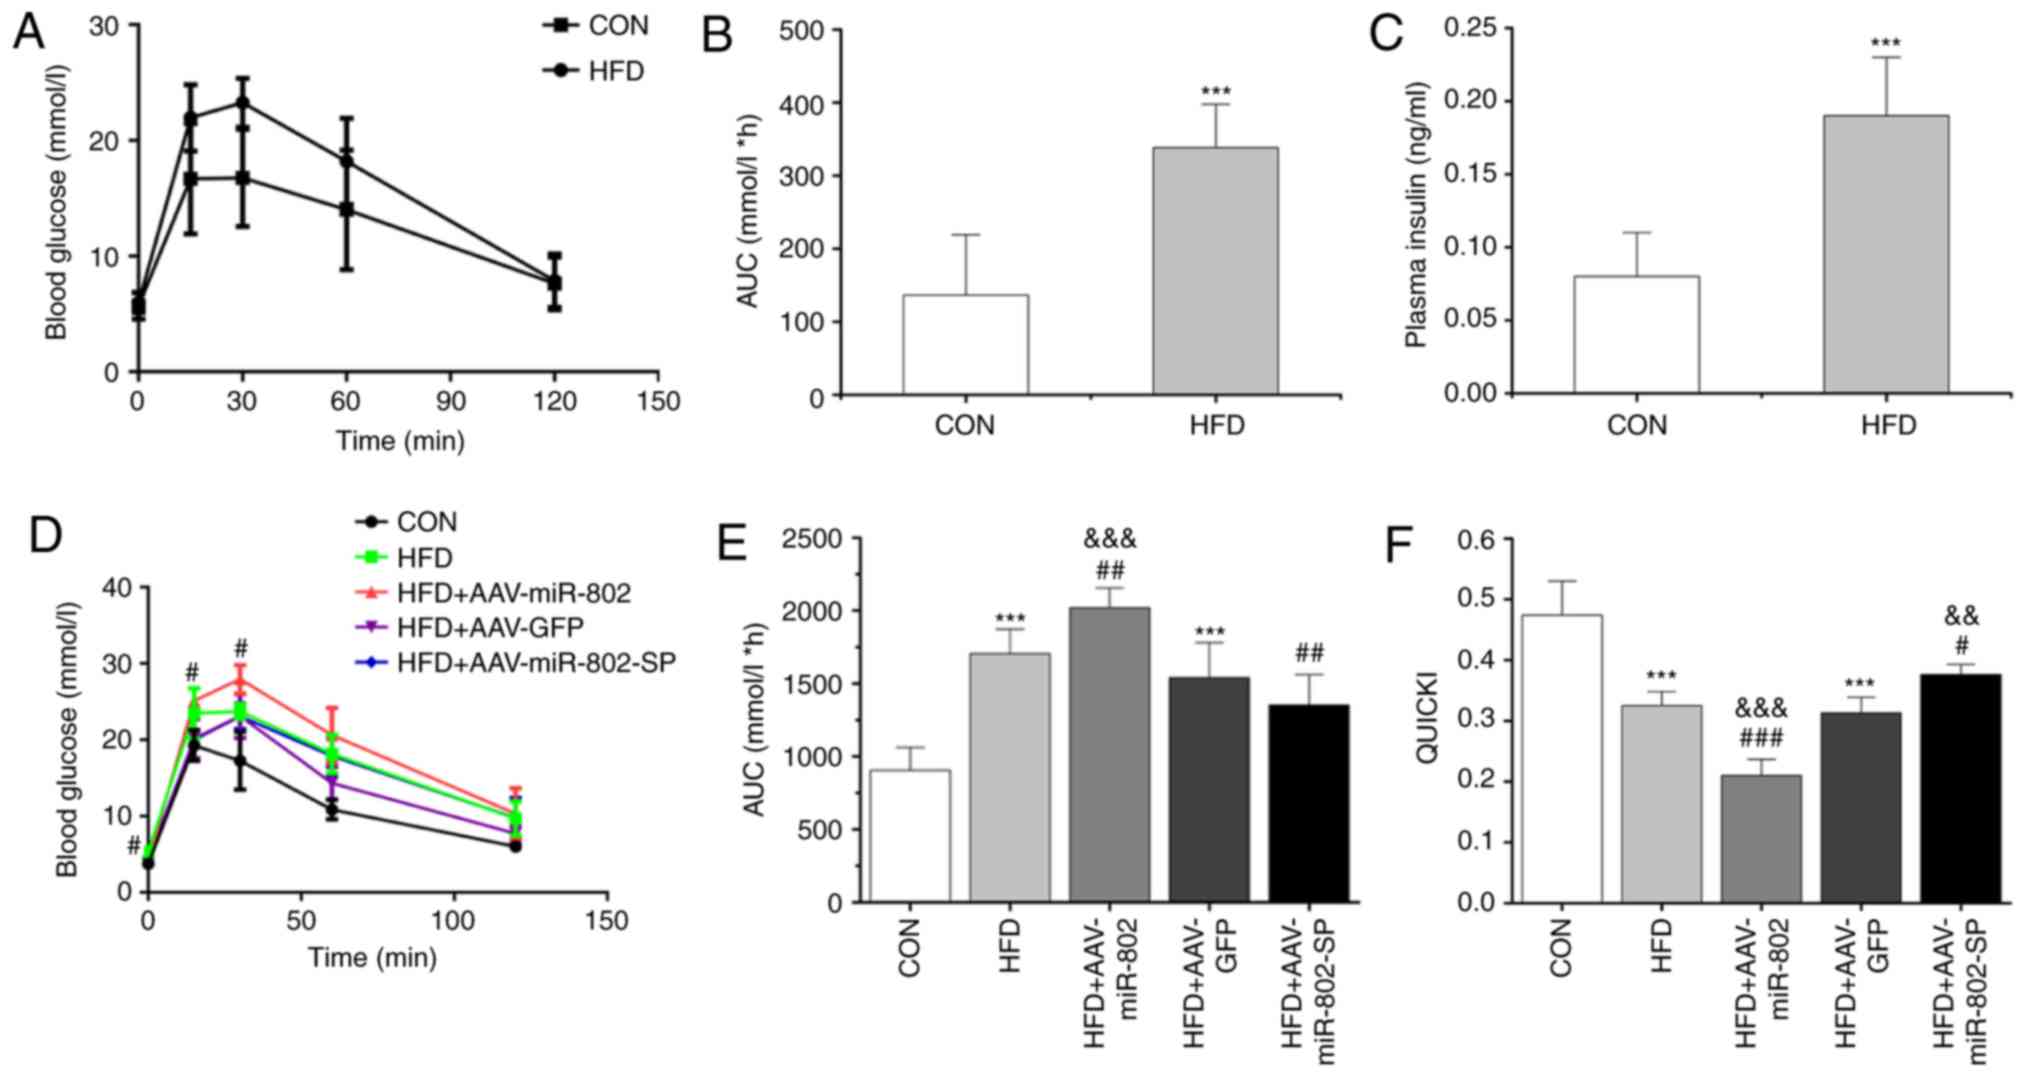 | Figure 4.HFD induces whole-body glucose
intolerance after 12 weeks of feeding. (A) The IPGTT was performed
and (B) the AUC was calculated after 12 weeks of feeding. (C) The
levels of insulin were compared between the groups. The effect of
miR-802 on (D) the IPGTT, (E) AUC and (F) QUICKI after 5 weeks of
miR-802 treatment. Data are presented as the mean ± standard error
of the mean (n=10). ***P<0.001 vs. CON; #P<0.05,
##P<0.01 and ###P<0.001 vs. HFD; and
&&P<0.01 and
&&&P<0.001 vs. HFD + AAV-GFP. HFD,
high-fat diet; IPGTT, intraperitoneal glucose tolerance test; AUC,
area under the curve; miR-802, microRNA-802; CON, normal diet;
AAV-GFP, adeno-associated virus vector containing green fluorescent
protein; AAV-miR-802, AAVs expressing miR-802; AAV-miR-802-SP, AAVs
expressing miR-802 sponges. |
In agreement with these results, the area under the
curve of the AAV-miR-802 group was significantly increased compared
with those of the AAV-GFP and HFD groups (P<0.001). However, the
difference between the AAV-miR-802-SP and AAV-GFP groups was not
significant (Fig. 4E).
After 12 weeks on the HFD, the mice exhibited a
significant reduction in the QUICKI values compared with the CON
group (P<0.001; Fig. 4F), which
indicated that a mice model of IR was successfully established.
miR-802 induced a further reduction in the QUICKI values compared
with the HFD group (Fig. 4F),
indicating that miR-802 exacerbates IR in the mice.
Effect of miR-802 on serum and liver
lipid profiles
Serum TC and TG, and liver TG levels significantly
were increased in the HFD group compared with the CON group
(P<0.001; Fig. 5A and B).
AAV-miR-802 significantly increased the serum TG levels compared
with the HFD group. AAV-miR-802 significantly increased the liver
TG levels compared with the AAV-GFP and HFD groups, while
AAV-miR-802-SP significantly reduced the levels of hepatic TG
compared with the HFD group (P<0.01; Fig. 5C).
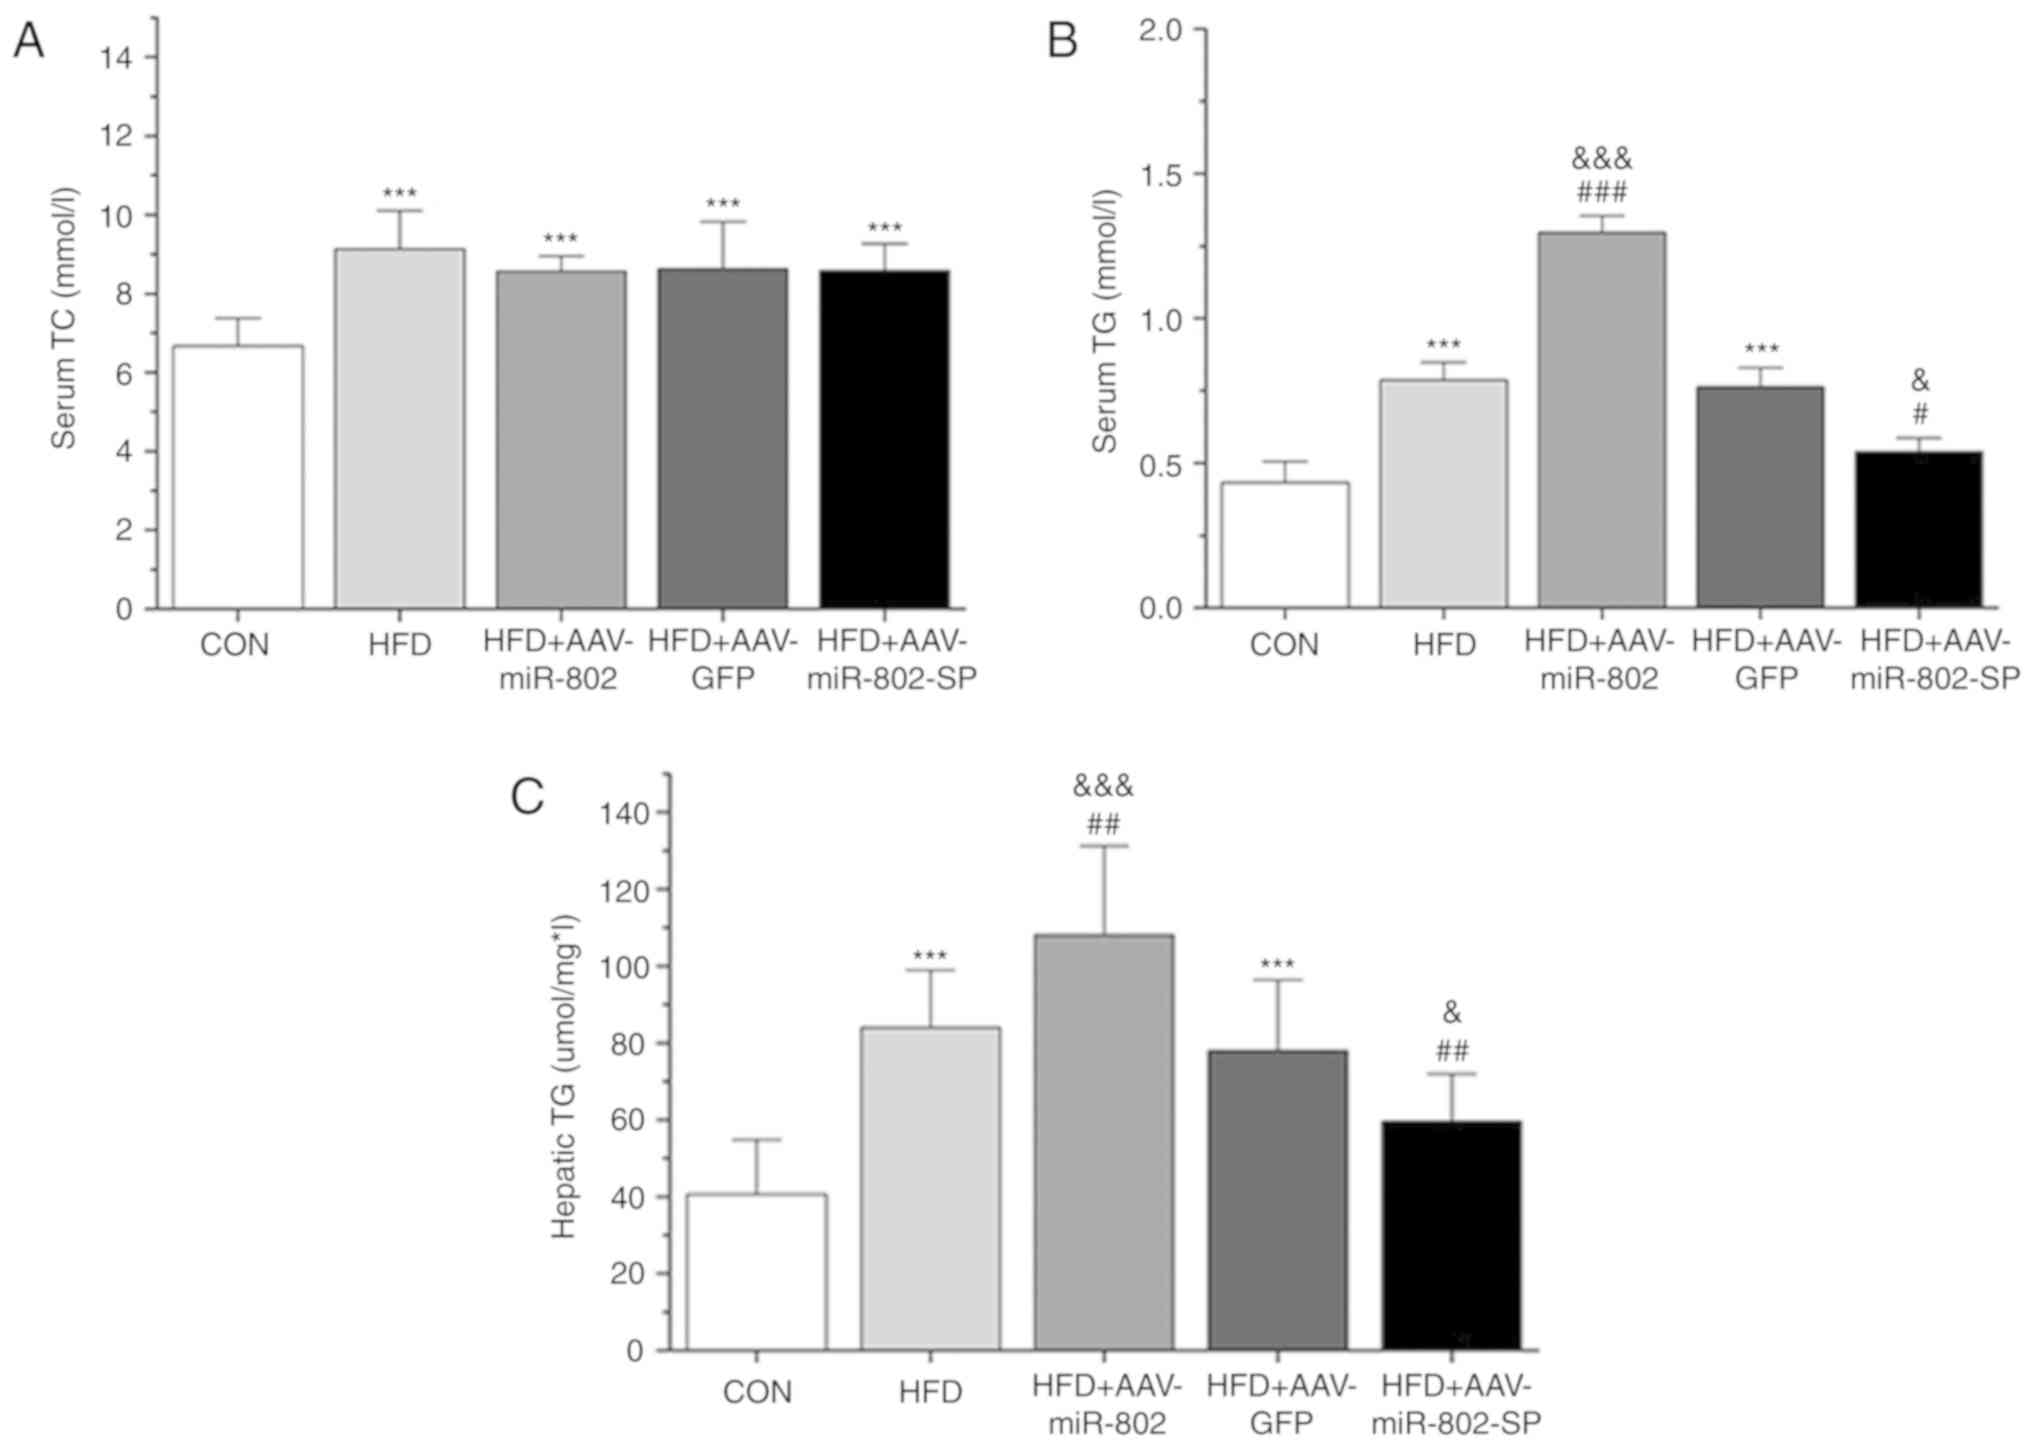 | Figure 5.Analysis of biochemical parameters
associated with a HFD. Effect of miR-802 on serum (A) TC and (B)
TG, and (C) hepatic TG after 5 weeks of miR-802 treatment. Data are
presented as the mean ± standard error of the mean (n=10).
***P<0.001 vs. CON; #P<0.05,
##P<0.01 and ###P<0.001 vs. HFD; and
&P<0.05 and &&&P<0.001
vs. HFD + AAV-GFP. miR-802, microRNA-802; TC, total cholesterol;
TG, triglycerides; CON, normal diet; HFD, high-fat diet; AAV-GFP,
adeno-associated virus vector containing GFP; AAV-miR-802, AAVs
expressing miR-802; AAV-miR-802-SP, AAVs expressing miR-802
sponges. |
Effect of miR-802 on the activities of
oxidative stress-related enzymes and antioxidant biomarkers in the
liver
After miR-802 treatment, the levels of LPO
generation in the liver were significantly increased in the HFD
group compared with the CON group (P<0.01). miR-802
significantly increased the levels of LPO compared with the AAV-GFP
and HFD groups (P<0.01) and this effect was reversed by
AAV-miR-802-SP (Fig. 6A).
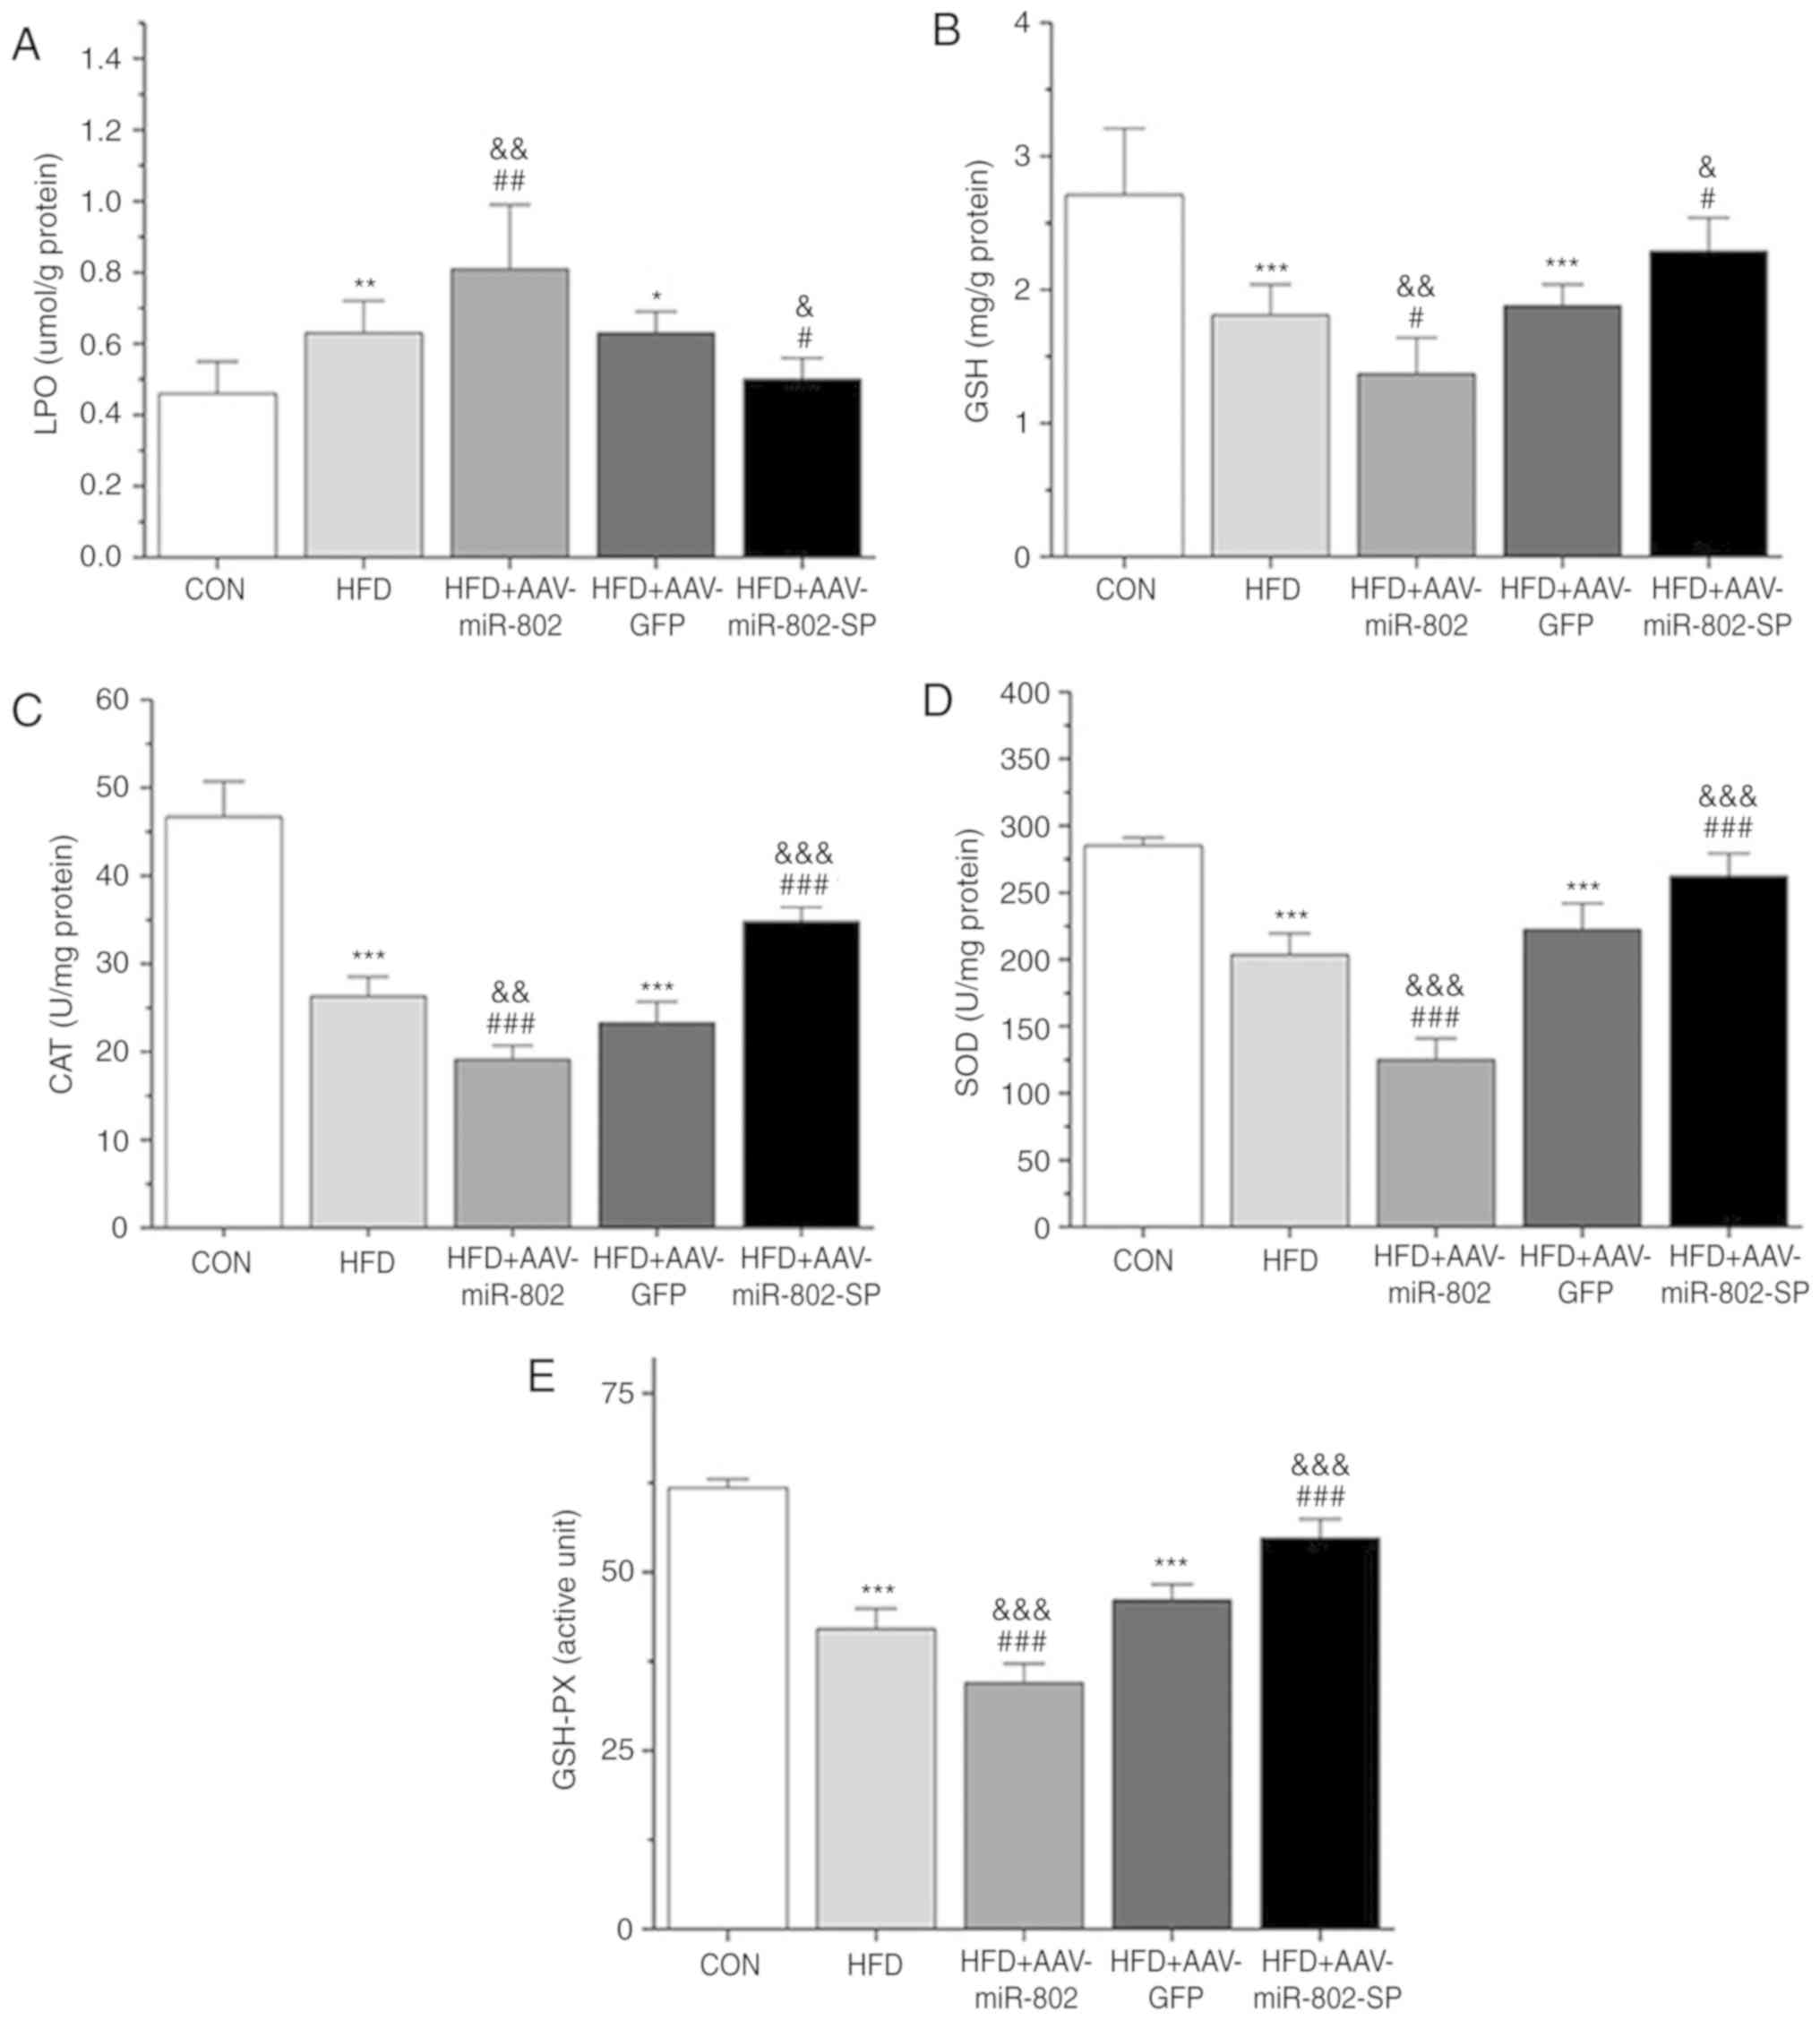 | Figure 6.Effect of miR-802 on hepatic
parameters. (A) LPO, (B) GSH levels and (C) CAT, (D) SOD, and (E)
GSH-Px activity after 5 weeks of miR-802 treatment. Data are
presented as the mean ± standard error of the mean (n=6).
*P<0.05, **P<0.01 and ***P<0.001 vs. CON;
#P<0.05, ##P<0.01 and
###P<0.001 vs. HFD; and &P<0.05,
&&P<0.01 and
&&&P<0.001 vs. HFD + AAV-GFP. miR-802,
microRNA-802; LPO, lipid peroxidation; GSH, reduced glutathione;
CAT, catalase; SOD, superoxide dismutase; GSH-Px, glutathione
peroxidase; HFD, high-fat diet; CON, normal diet; AAV-GFP,
adeno-associated virus vector containing green fluorescent protein;
AAV-miR-802, AAVs expressing miR-802; AAV-miR-802-SP, AAVs
expressing miR-802 sponges. |
The activities of the enzymes CAT, SOD and GSH-Px,
as well as the GSH levels, were significantly reduced in the HFD
group compared with the CON group (P<0.001). Overexpression of
miR-802 further reduced the activities of these enzymes and the
levels of GSH, and these effects were significantly reversed by
AAV-miR-802-SP (P<0.05; Fig.
6B-E). Similarly, the levels of ROS generation in the liver
were also increased after miR-802 treatment and AAV-miR-802-SP
reversed this increase (Fig. 7).
These results indicate that miR-802 increases hepatic oxidative
stress.
Effect of miR-802 on the activities of
the insulin signaling pathway in mouse livers
Insulin-stimulated glucose utilization relies on the
activity of the insulin signaling pathway. Therefore, the
activities of the insulin pathway-related components IRS-1 and AKT1
in the liver of the mice were determined.
After administration of miR-802 for 5 weeks, there
were no significant changes in the protein expression levels of
total IRS-1 and AKT1. The expression levels of phosphorylated AKT1
were reduced compared with the AAV-GFP and HFD groups and the
expression levels of phosphorylated IRS-1 (Ser307) were increased
(Fig. 8). Notably, increased
serine phosphorylation of IRS-1 reduces its phosphorylation in
tyrosine residues, accelerates its degradation and subsequently
reduces AKT phosphorylation (17).
AAV-miR-802-SP completely reversed the effect of miR-802. These
results suggest that miR-802 regulates the activity of individual
components of the insulin signaling pathway.
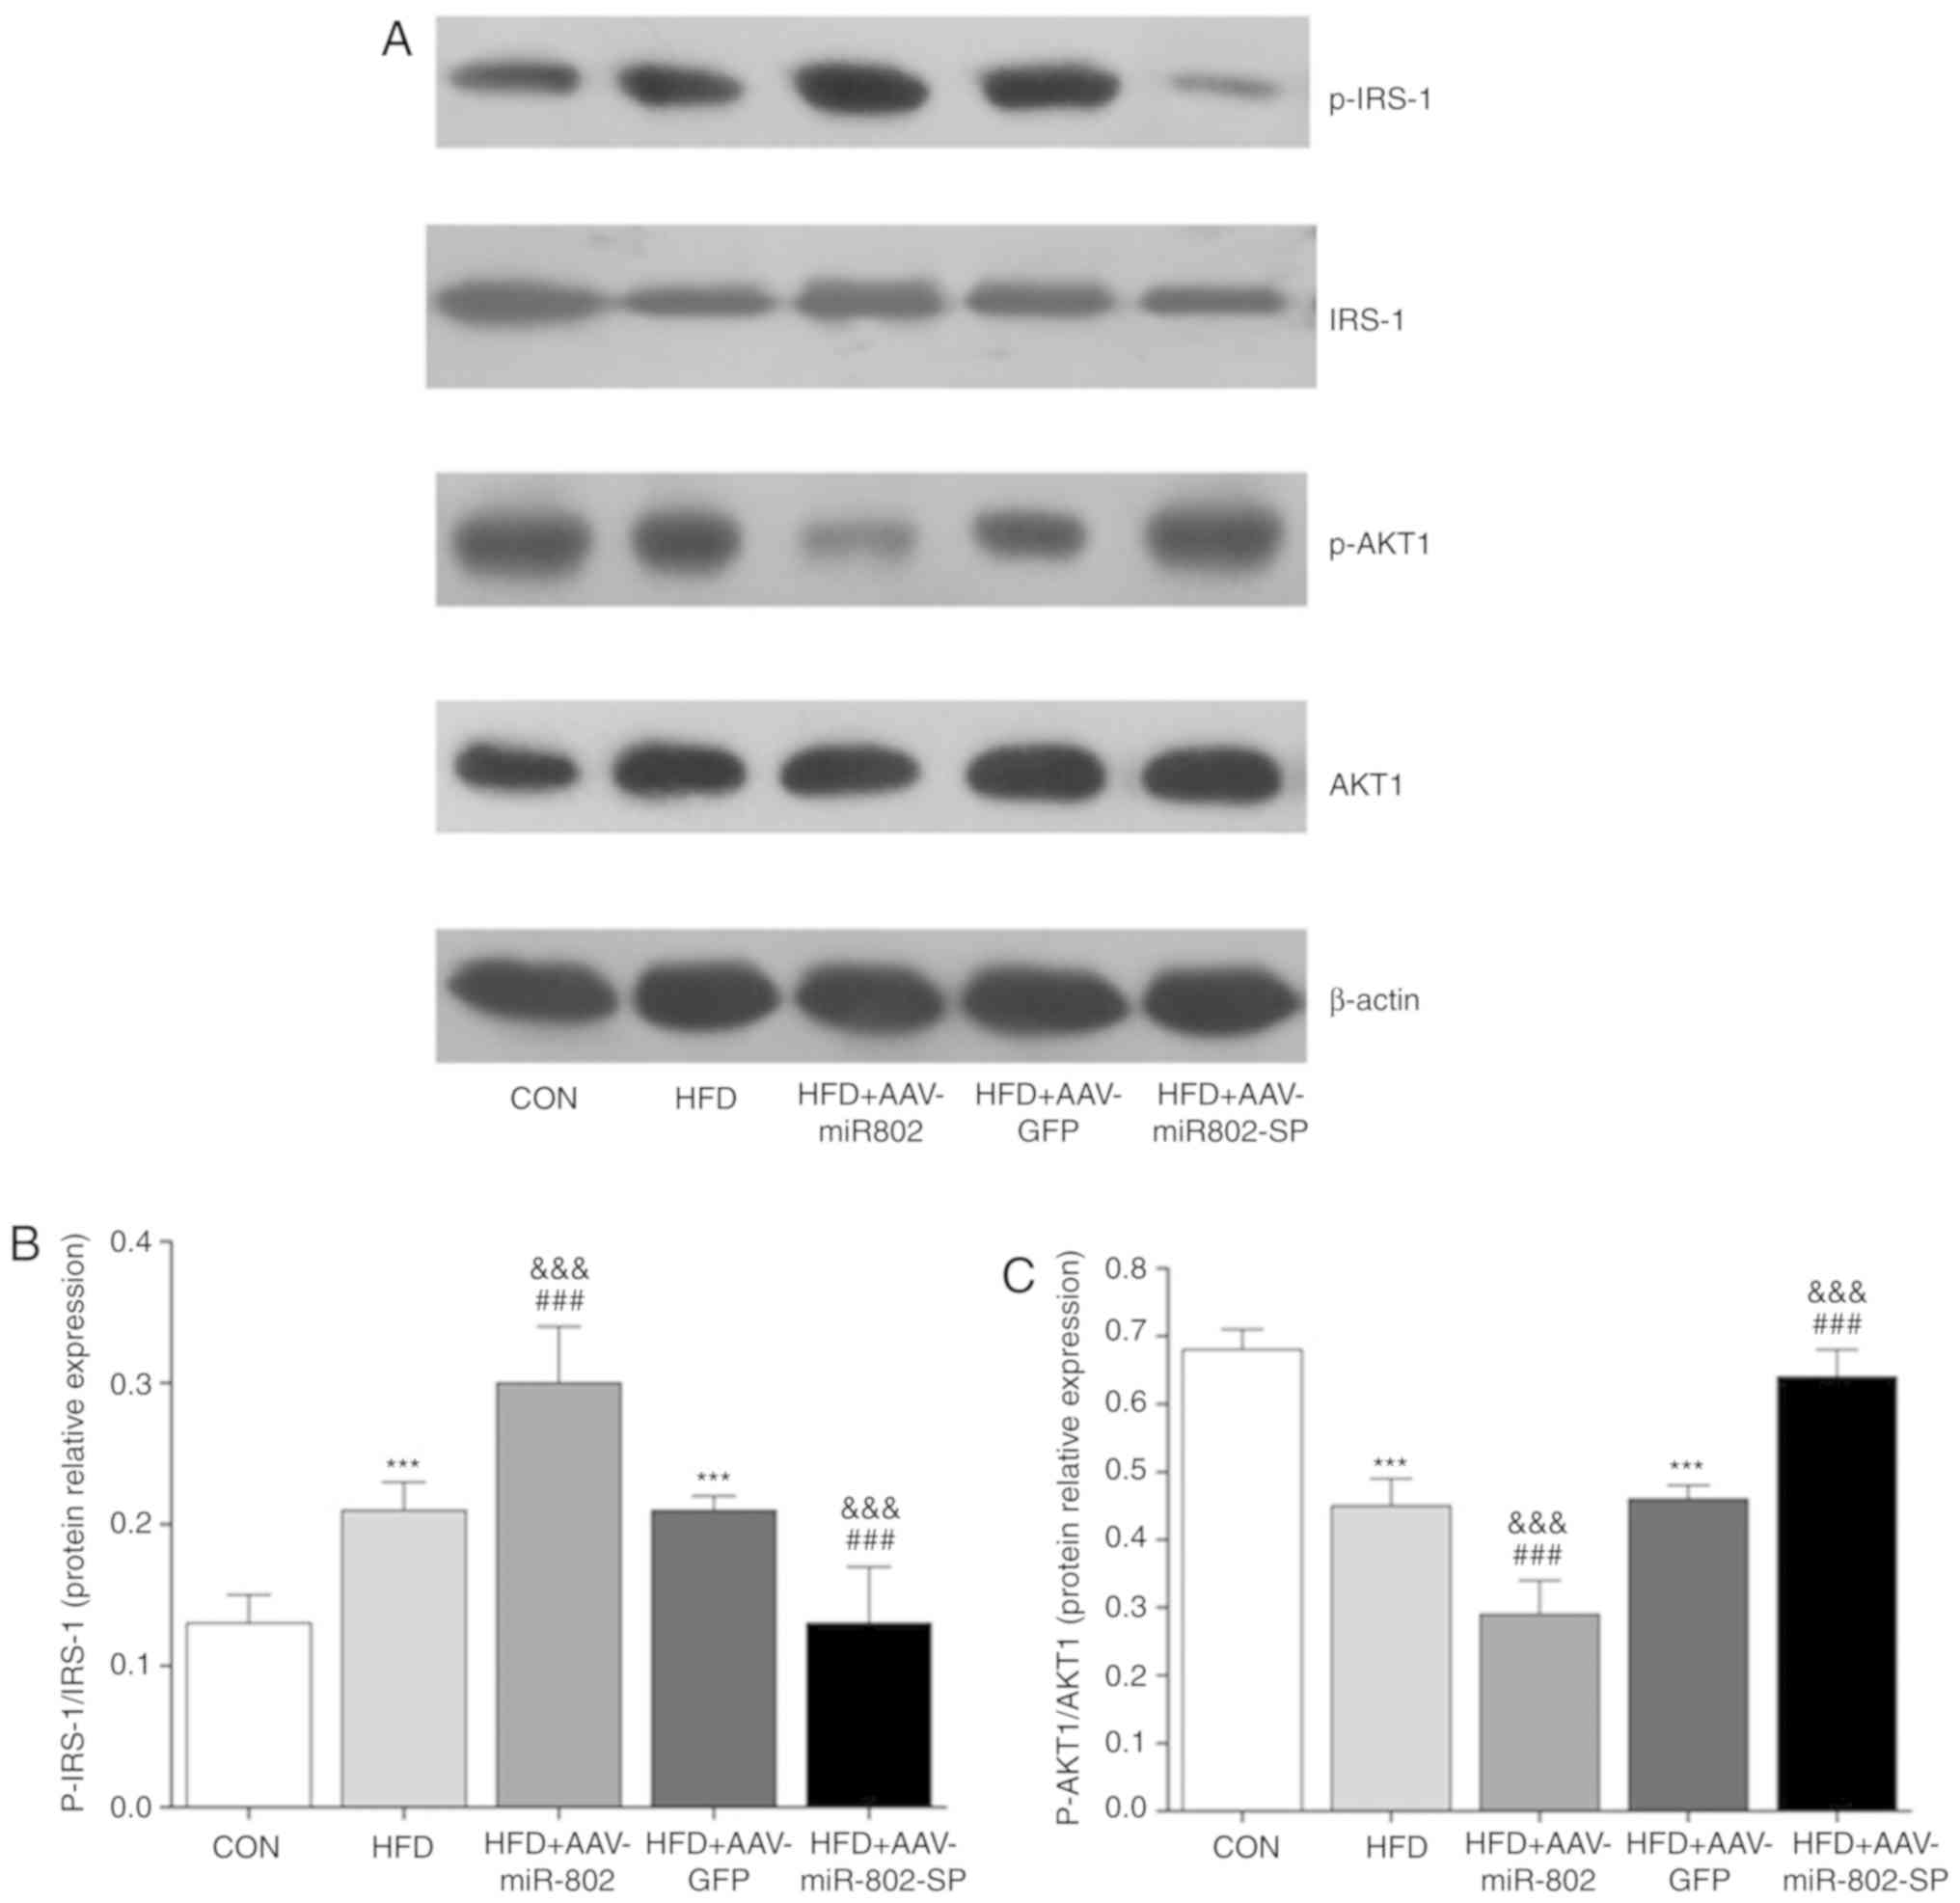 | Figure 8.Effect of miR-802 on insulin pathways
in the liver. (A) Western blot images. The protein expression
levels of IRS-1, p-IRS-1, AKT1 and p-AKT1 were examined using
western blotting. Densitometric analysis of the protein expression
of (B) p-IRS-1/IRS-1 and (C) p-AKT/AKT. Data are presented as the
mean ± standard error of the mean (n=6). ***P<0.001 vs. CON;
###P<0.001 vs. HFD; and
&&&P<0.001 vs. HFD + AAV-GFP. miR-802,
microRNA-802; CON, normal diet; HFD, high-fat diet; AAV-GFP,
adeno-associated virus vector containing GFP; IRS-1, insulin
receptor substrate 1; p-AKT1, phosphorylated protein kinase B;
AAV-miR-802, AAVs expressing miR-802; AAV-miR-802-SP, AAVs
expressing miR-802 sponges. |
Effect of miR-802 on the ERK, JNK and
p38MAPK pathways in mouse liver
In order to investigate the downstream signal
transduction mechanisms in IR induced by oxidative stress, the
total and phosphor protein expression of ERK, JNK and p38MAPK in
the liver tissue of the mice were determined after 5 weeks of
miR-802 treatment. Only the p38MAPK and JNK pathways were
activated, as demonstrated by increased phosphorylation of p38MAPK
and JNK. However, the phosphorylation of ERK was not significantly
different (Fig. 9), suggesting
that miR-802 may have no effect on ERK activity. These results
suggest that miR-802 activates the p38MAPK and JNK signaling
pathways, but not that of ERK.
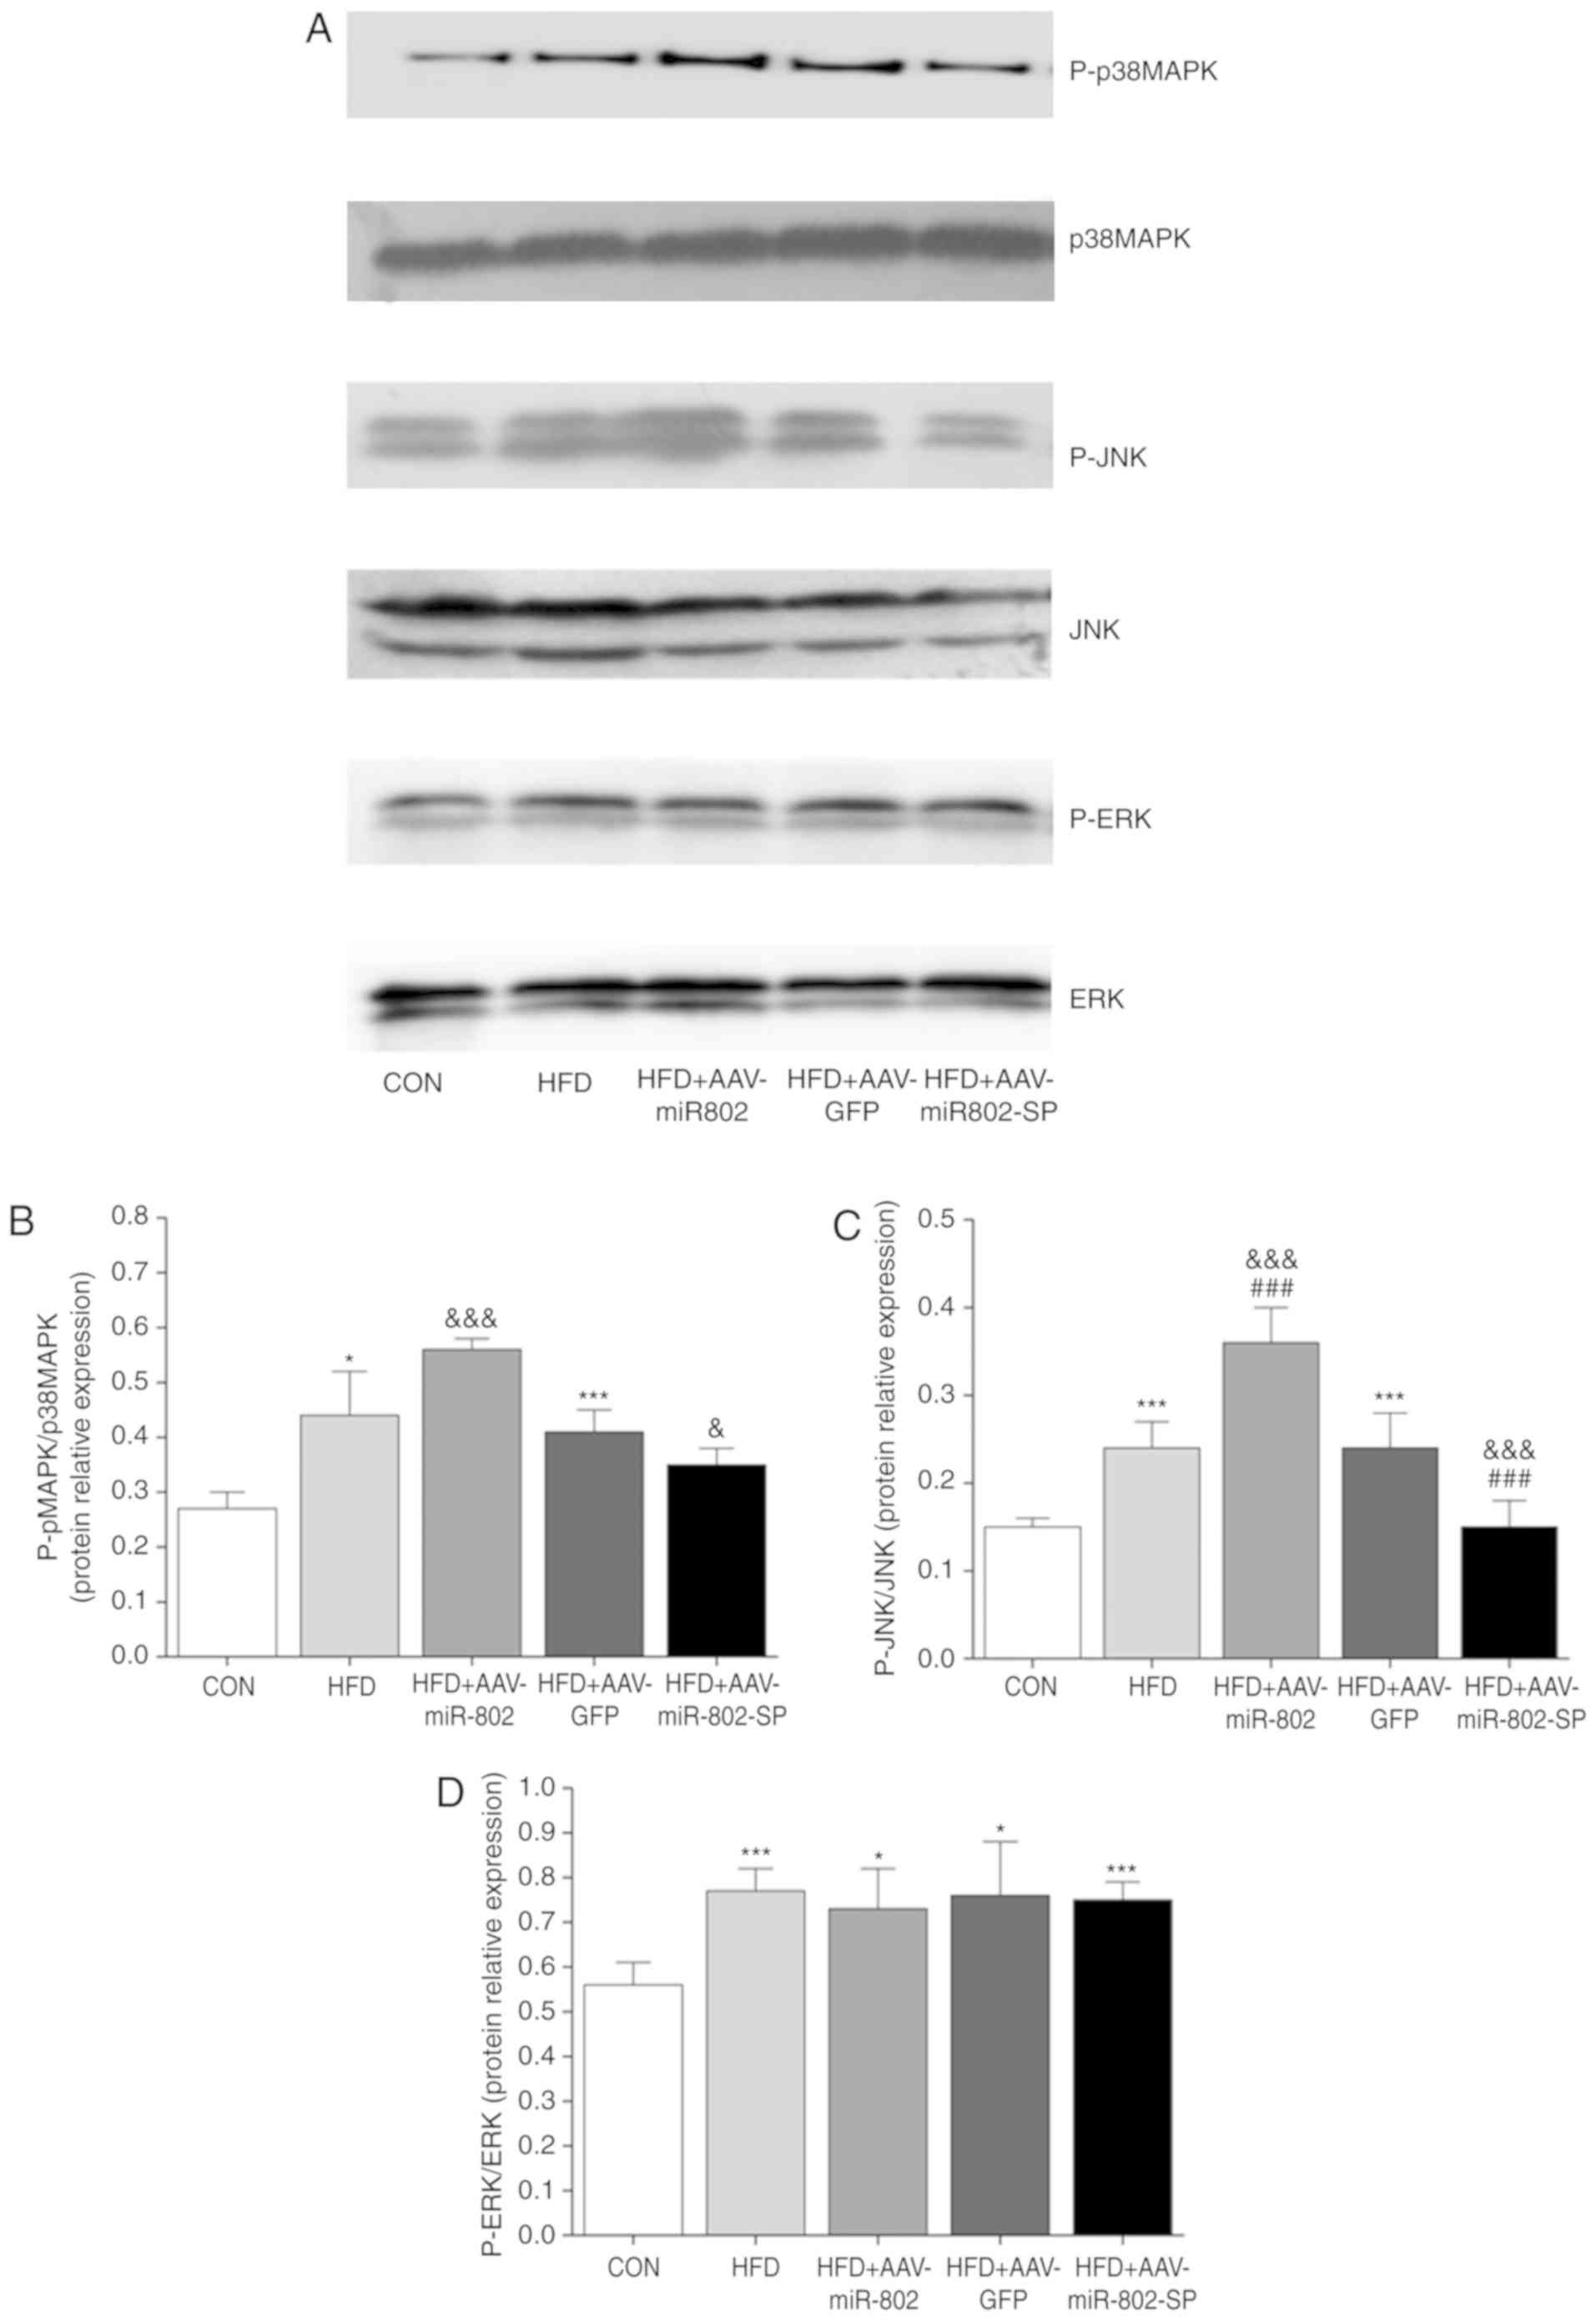 | Figure 9.Effect of miR-802 on the ERK, JNK and
p38MAPK pathways. (A) Western blot images. The protein expression
levels of ERK, p-ERK, p38MAPK, p-p38MAPK, JNK and p-JNK were
examined using western blotting. Densitometric analysis of the
protein expression of (B) MAPK (C) JNK and (D) ERK. Data are
presented as the mean ± standard error of the mean (n=6).
*P<0.05 and ***P<0.001 vs. CON; ###P<0.001 vs.
HFD; &P<0.05 and
&&&P<0.001 vs. HFD + AAV-GFP. miR-802,
microRNA-802; p38MAPK, p38mitogen-activated protein kinases; JNK,
c-Jun N-terminal kinase; p-ERK, phosphorylated-extracellular signal
regulated kinase; CON, normal diet; HFD, high-fat diet; AAV-GFP,
adeno-associated virus vector containing green fluorescent protein;
AAV-miR-802, AAVs expressing miR-802; AAV-miR-802-SP, AAVs
expressing miR-802 sponges. |
Discussion
The present study identifies a novel miRNA-dependent
mechanism of IR. The high-fat-induced model of IR is more
consistent with the pathogenesis of diabetes in humans than db/db
or ob/ob mice (18). As a
classical model of IR, the high-fat induced IR model has been used
for a long time in the authors' laboratory and therefore they have
had enough experience to use this model successfully. The
laboratory provides sufficient conditions for model
establishment.
In the present study, the effect of miR-802 on
HFD-induced oxidative stress in the liver was investigated and the
results demonstrate that miR-802 overexpression results in
increased oxidative stress in mouse livers. Notably, miR-802
overexpression further aggravated hyperinsulinemia, hyperglycemia
and oxidative stress in the HFD fed mice. This effect may be caused
by activation of the p38MAPK and JNK pathways. These results
suggest that increased miR-802 expression is one of the main causes
of obesity-associated metabolic abnormalities. The causative role
of miR-802 was further confirmed by silencing miR-802 in the mice,
which improved insulin sensitivity and glucose homeostasis, and
reduced oxidative stress. These results suggest that downregulation
of miR-802 is sufficient to prevent progression of
obesity-associated metabolic syndrome.
Hepatic lipid accumulation has emerged as one of the
major culprits in the pathogenesis of T2DM (19). In the present study, miR-802 had no
effect on body weight or serum TG and TC. Professor Kornfeld
(8) found that insulin sensitivity
was improved and glucose intake increased, but weight didn't
change, after the expression of miR-802 was knocked down in HFD
mice. Results of the present study are consistent with the
Professor Kornfeld's study, however, the mechanism remains to be
fully elucidated. The possible reasons: i) The intervening time was
not enough to influence the weight of the mice. In subsequent
experiments, the observation time will be extended to further
explore the effect of miR802 on body weight in HFD mice; ii)
miR-802 improved insulin resistance may occur by increasing the
uptake of glucose in tissues and organs but not by affecting fat
content.
Conversely, the levels of hepatic TG were increased
after miR-802 treatment and miR-802-SP reduced the levels of
hepatic TG in the HFD fed mice. Therefore, miR-802 is an important
regulator of HFD-induced hyperlipidemia in the liver.
It has been reported that miR-802 targets Hnf1b in
the livers of HFD fed and Leprdb/db mice, leading to IR
(8). Hnf1b has been causally
linked to the development of maturity-onset diabetes of the young
type 5 and variants in HNF1B have been linked to predisposition for
T2DM (20). However, it is unclear
whether miR-802 serves a role in regulating oxidative stress in HFD
fed mice.
It has been reported that consumption of a HFD can
significantly increase oxidative stress (21). Ectopic overload of fatty acids has
been proposed as a cause of type 2 diabetes, through accelerating
excess generation of ROS. The results of the presents study
revealed increased levels of oxidative stress in the livers of the
HFD fed mice, which is consistent with previous studies (22–24).
The current study demonstrated that miR-802 further increases the
levels of oxidative stress in the livers of HFD fed mice, which is
likely to be caused by reduced activity of multiple antioxidative
enzymes.
Chronic oxidative stress that is mainly caused by
mitochondrial dysfunction can lead to the development T2DM and
metabolic syndrome (25). ROS
directly oxidize and damage DNA, proteins and lipids. In addition
to their ability to directly inflict damage on macromolecules, ROS
indirectly induce damage to tissues by activating a number of
cellular stress-sensitive pathways, including the JNK (26), p38MAPK and ERK1/2 pathways
(27).
A previous study revealed that the family members of
MAPK, ERK1/2, JNK and p38MAPK potentially contribute to the
abnormal insulin signaling associated with T2DM (28). A further study demonstrated that
stress activation of JNK/SAPK increases the levels of serine
phosphorylation (at Ser307) and inhibits insulin-stimulated
tyrosine phosphorylation of IRS-1 (29). The results of the present study
indicate that a HFD promotes the phosphorylation of JNK and
p38MAPK. This may lead to further IRS-1 phosphorylation and less
AKT1 phosphorylation, which impairs insulin signaling.
The effect of oxidative stress on cellular signaling
pathways and activation of the JNK and p38MAPK pathways was
enhanced by miR-802. The insulin-signaling pathway is the central
part of the action of insulin. The present study further identified
that miR-802 reduces the activity of the insulin signaling pathway,
therefore enhancing the IR of HFD fed mice. The decreased activity
of insulin signaling molecules may be a result of the increased
activities of JNK and p38MAPK caused by miR-802. Dual-luciferase
assays, miRNA microarrays and western blotting should be used to
confirm the potential target genes of miR-802 in skeletal muscle in
future studies in order to identify whether the effect is direct or
indirect. Furthermore, it may be of interest to further investigate
whether miR-802 could be used as a biomarker for the diagnosis of
diabetes.
The present study demonstrates that miR-802 induces
IR in HFD fed mice by increasing hepatic oxidative stress. miR-802
achieves this through upregulation of the p38MAPK and JNK pathways
and downregulation of the insulin signaling pathway. Although the
detailed mechanisms regarding how miR-802 regulates liver IR
require further investigation, the results of the present study
provided a mechanistic basis for the targeting of miR-802 as a
potential therapeutic strategy to combat oxidative stress and
IR.
Acknowledgements
The present study was supported in part by the Hebei
Key Laboratory of Metabolic Disease, Hebei General Hospital. The
authors would like to thank Dr Linlin Yang and Dr Donghui Zhang for
their technical assistance.
Funding
The present study was supported by the International
cooperation Program of Hebei Province (grant no. 15397750d) and the
National Natural Science Foundations of China (grant no.
81200638).
Availability of data and materials
The datasets used and/or analyzed during the current
study are available from the corresponding author on reasonable
request.
Authors' contribution
XY collected and analyzed the majority of the data
and wrote the manuscript. HX collected and analyzed data and edited
the manuscript. JL, LY and HuaM performed the experiments. HuiM was
involved in study design, oversaw data collection and analysis and
wrote, and edited the manuscript.
Ethics approval and consent to
participate
All experiments involving animals were performed
according to the procedures approved by the Institutional Animal
care and Use committee of the Institute of Zoology, Hebei General
Hospital (Shijiazhuang, China).
Patient consent for publication
Not applicable.
Competing interests
The authors declare they have no actual or potential
competing financial interests.
References
|
1
|
Lee BC and Lee J: Cellular and molecular
players in adipose tissue inflammation in the development of
obesity-induced insulin resistance. Biochim Biophys Acta.
1842:446–462. 2014. View Article : Google Scholar : PubMed/NCBI
|
|
2
|
Dehwah MA, Xu A and Huang Q: MicroRNAs and
type 2 diabetes/obesity. J Genet Genomics. 39:11–18. 2012.
View Article : Google Scholar : PubMed/NCBI
|
|
3
|
Bartel DP: MicroRNAs: Target recognition
and regulatory functions. Cell. 136:215–233. 2009. View Article : Google Scholar : PubMed/NCBI
|
|
4
|
Trajkovski M, Hausser J, Soutschek J, Bhat
B, Akin A, Zavolan M, Heim MH and Stoffel M: MicroRNAs 103 and 107
regulate insulin sensitivity. Nature. 474:649–653. 2011. View Article : Google Scholar : PubMed/NCBI
|
|
5
|
Zhou B, Li C, Qi W, Zhang Y, Zhang F, Wu
JX, Hu YN, Wu DM, Liu Y, Yan TT, et al: Downregulation of miR-181a
upregulates sirtuin-1 (SIRT1) and improves hepatic insulin
sensitivity. Diabetologia. 55:2032–2043. 2012. View Article : Google Scholar : PubMed/NCBI
|
|
6
|
Fu X, Dong B, Tian Y, Lefebvre P, Meng Z,
Wang X, Pattou F, Han W, Wang X, Lou F, et al: MicroRNA-26a
regulates insulin sensitivity and metabolism of glucose and lipids.
J Clin Invest. 125:2497–2509. 2015. View
Article : Google Scholar : PubMed/NCBI
|
|
7
|
Higuchi C, Nakatsuka A, Eguchi J,
Teshigawara S, Kanzaki M, Katayama A, Yamaguchi S, Takahashi N,
Murakami K, Ogawa D, et al: Identification of circulating miR-101,
miR-375 and miR-802 as biomarkers for type 2 diabetes. Metabolism.
64:489–497. 2015. View Article : Google Scholar : PubMed/NCBI
|
|
8
|
Kornfeld JW, Baitzel C, Konner AC,
Nicholls HT, Vogt MC, Herrmanns K, Scheja L, Haumaitre C, Wolf AM,
Knippschild U, et al: Obesity-induced overexpression of miR-802
impairs glucose metabolism through silencing of Hnf1b. Nature.
494:111–115. 2013. View Article : Google Scholar : PubMed/NCBI
|
|
9
|
Matsuzawa-Nagata N, Takamura T, Ando H,
Nakamura S, Kurita S, Misu H, Ota T, Yokoyama M, Honda M, Miyamoto
K and Kaneko S: Increased oxidative stress precedes the onset of
high-fat diet-induced insulin resistance and obesity. Metabolism.
57:1071–1077. 2008. View Article : Google Scholar : PubMed/NCBI
|
|
10
|
Evans JL, Maddux BA and Goldfine ID: The
molecular basis for oxidative stress-induced insulin resistance.
Antioxid Redox Signal. 7:1040–1052. 2005. View Article : Google Scholar : PubMed/NCBI
|
|
11
|
Manno CS, Pierce GF, Arruda VR, Glader B,
Ragni M, Rasko JJ, Ozelo MC, Hoots K, Blatt P, Konkle B, et al:
Successful transduction of liver in hemophilia by AAV-Factor IX and
limitations imposed by the host immune response. Nat Med.
12:342–347. 2006. View Article : Google Scholar : PubMed/NCBI
|
|
12
|
Grimm D and Kay MA: Therapeutic short
hairpin RNA expression in the liver: Viral targets and vectors.
Gene Ther. 13:563–575. 2006. View Article : Google Scholar : PubMed/NCBI
|
|
13
|
Bagul PK, Middela H, Matapally S, Padiya
R, Bastia T, Madhusudana K, Reddy BR, Chakravarty S and Banerjee
SK: Attenuation of insulin resistance, metabolic syndrome and
hepatic oxidative stress by resveratrol in fructose-fed rats.
Pharmacol Res. 66:260–268. 2012. View Article : Google Scholar : PubMed/NCBI
|
|
14
|
Katz A, Nambi SS, Mather K, Baron AD,
Follmann DA, Sullivan G and Quon MJ: Quantitative insulin
sensitivity check index: A simple, accurate method for assessing
insulin sensitivity in humans. J Clin Endocrinol Metab.
85:2402–2410. 2000. View Article : Google Scholar : PubMed/NCBI
|
|
15
|
Benov L, Sztejnberg L and Fridovich I:
Critical evaluation of the use of hydroethidine as a measure of
superoxide anion radical. Free Radic Biol Med. 25:826–831. 1998.
View Article : Google Scholar : PubMed/NCBI
|
|
16
|
Das M, Das S, Lekli I and Das DK: Caveolin
induces cardioprotection through epigenetic regulation. J Cell Mol
Med. 16:888–895. 2012. View Article : Google Scholar : PubMed/NCBI
|
|
17
|
Pessin JE and Saltiel AR: Signaling
pathways in insulin action: Molecular targets of insulin
resistance. J Clin Invest. 106:165–169. 2000. View Article : Google Scholar : PubMed/NCBI
|
|
18
|
Sone H, Takahashi A, Iida K and Yamada N:
Disease model: Hyperinsulinemia and insulin resistance. Part
B-polygenic and other animal models. Trends Mol Med. 7:373–376.
2001. View Article : Google Scholar : PubMed/NCBI
|
|
19
|
Perry CG and Wright DC: Challenging dogma:
Is hepatic lipid accumulation in type 2 diabetes due to
mitochondrial dysfunction? J Physiol. 594:4093–4094. 2016.
View Article : Google Scholar : PubMed/NCBI
|
|
20
|
Han X, Luo Y, Ren Q, Zhang X, Wang F, Sun
X, Zhou X and Ji L: Implication of genetic variants near SLC30A8,
HHEX, CDKAL1, CDKN2A/B, IGF2BP2, FTO, TCF2, KCNQ1, and WFS1 in type
2 diabetes in a Chinese population. Bmc Med Genet. 11:812010.
View Article : Google Scholar : PubMed/NCBI
|
|
21
|
Erdemir F, Atilgan D, Markoc F, Boztepe O,
Suha-Parlaktas B and Sahin S: The effect of diet induced obesity on
testicular tissue and serum oxidative stress parameters. Actas Urol
Esp (Spanish). 36:153–159. 2012. View Article : Google Scholar
|
|
22
|
Gujjala S, Putakala M, Gangarapu V, Nukala
S, Bellamkonda R, Ramaswamy R and Desireddy S: Protective effect of
Caralluma fimbriata against high-fat diet induced testicular
oxidative stress in rats. Biomed Pharmacother. 83:167–176. 2016.
View Article : Google Scholar : PubMed/NCBI
|
|
23
|
Feng X, Yu W, Li X, Zhou F, Zhang W, Shen
Q, Li J, Zhang C and Shen P: Apigenin, a modulator of PPARγ,
attenuates HFD-induced NAFLD by regulating hepatocyte lipid
metabolism and oxidative stress via Nrf2 activation. Biochem
Pharmacol. 136:136–149. 2017. View Article : Google Scholar : PubMed/NCBI
|
|
24
|
Pan ZG and An XS: SARM1 deletion restrains
NAFLD induced by high fat diet (HFD) through reducing inflammation,
oxidative stress and lipid accumulation. Biochem Biophys Res
Commun. 498:416–423. 2018. View Article : Google Scholar : PubMed/NCBI
|
|
25
|
Styskal J, Van Remmen H, Richardson A and
Salmon AB: Oxidative stress and diabetes: What can we learn about
insulin resistance from antioxidant mutant mouse models? Free Radic
Biol Med. 52:46–58. 2012. View Article : Google Scholar : PubMed/NCBI
|
|
26
|
Zhang ZF, Lu J, Zheng YL, Wu DM, Hu B,
Shan Q, Cheng W, Li MQ and Sun YY: Purple sweet potato color
attenuates hepatic insulin resistance via blocking oxidative stress
and endoplasmic reticulum stress in high-fat-diet-treated mice. J
Nutr Biochem. 24:1008–1018. 2013. View Article : Google Scholar : PubMed/NCBI
|
|
27
|
Sankar P, Zachariah B, Vickneshwaran V,
Jacob SE and Sridhar MG: Amelioration of oxidative stress and
insulin resistance by soy isoflavones (from Glycine max) in
ovariectomized Wistar rats fed with high fat diet: The molecular
mechanisms. Exp Gerontol. 63:67–75. 2015. View Article : Google Scholar : PubMed/NCBI
|
|
28
|
Carlson CJ, Koterski S, Sciotti RJ,
Poccard GB and Rondinone CM: Enhanced basal activation of
mitogen-activated protein kinases in adipocytes from type 2
diabetes: Potential role of p38 in the downregulation of GLUT4
expression. Diabetes. 52:634–341. 2003. View Article : Google Scholar : PubMed/NCBI
|
|
29
|
Bloch-Damti A and Bashan N: Proposed
mechanisms for the induction of insulin resistance by oxidative
stress. Antioxid Redox Signal. 7:1553–1567. 2005. View Article : Google Scholar : PubMed/NCBI
|