Introduction
Breast cancer is one of the most common malignancies
in women of United States, which results in >40,000 deaths every
year. These breast tumors consist of phenotypically diverse
populations (1). Breast cancer can
be divided into subtypes of two estrogen receptor (ER)-positive
(luminal A and luminal B types), human epidermal growth factor
receptor 2 (HER2) enriched, and triple-negative breast cancer
(TNBC) (2). Triple-negative breast
cancer is ER-negative, PgR-negative, and HER2-negative using
clinical assays, which accounts for approximately 15% of all types
of breast cancer (3,4). Furthermore, TNBC has attracted a
tremendous amount of attention due to its unique biology, overall
poor prognosis, aggressive, and pattern of metastases (5). Therefore, it is urgent to gain insight
into the therapeutic targets when compared with endocrine-sensitive
and HER2-positive breast cancer.
Gene expression profiling could categorize the
characteristics of different subtypes and verify the genes as novel
therapeutic targets (6). A limited
number of studies have been conducted on the gene expression
profile of TNBC. Yang et al discovered that FZD7 plays a
critical role in cell proliferation in TNBC (7). Their finding have suggested that
several Wnt pathway genes, such as FZD7, low density lipoprotein
receptor-related protein 6 and TCF7 are overexpressed in TNBC
(7). In another study, Mathe et
al identified the novel genes associated with the lymph node
metastasis in TNBC. According to an analysis of 33 TNBCs, 17 normal
adjacent tissues and 15 lymph node metastases were identified
(8). Wang et al identified
the CDK7-dependent transcriptional addiction in triple-negative
breast cancer (9). Furthermore,
Abramovitz et al identified a 30-biomarker gene set that
could distinguish the breast cancer into subtypes. This study also
uses the subset genes for prognostication of OS and RFS (10).
He et al conducted an analysis to study the
molecular characteristics of triple-negative breast cancer using
microarray (4). Al-Ejeh et
al conducted a meta-analysis for the gene expression profile in
TNBC and clarified the genes for prognostication and therapy. In
this integrated analysis, the combination of clinical samples with
different types of chemotherapy from some databases would increase
the heterogeneity (10,11).
Although the gene expression profiles convey
significant findings in TNBC, there is a lack of sufficient
conclusions to uncover the central mechanisms in TNBC. This
situation requires the integration of different datasets. In the
present study, we first conducted an integrated analysis of TNBC
relative to the non-TNBC. The differentially expressed genes were
identified by statistical analysis. Then, the core DEGs were
selected for functional annotation. The PPI was also reconstructed.
These analyses were conducted to reveal the biological pathway and
molecular mechanisms regarding TNBC. Finally, the selected hub
genes would be the potential and specific biomarkers with
prognostic value and used as the treatment targets in the
future.
Materials and methods
Microarray data analysis
To identify the gene expression mode of TNBC,
microarray data were collected from the Gene Expression Ominibus
(GEO, https://www.ncbi.nlm.nih.gov/geo/), which is freely
available for users. Three independent microarray databases
(GSE27447, GSE61724, GSE18864) were downloaded. A total of 19
samples were studied in GSE27447 including 14 TNBC and 5 non-TNBC.
GSE61724 consisted of 16 TNBC and 48 non-TNBC breast cancer
samples. Moreover, 24 TNBC and 60 non-TNBC samples were involved in
GSE18864.
Identification of differentially
expressed genes (DEGs)
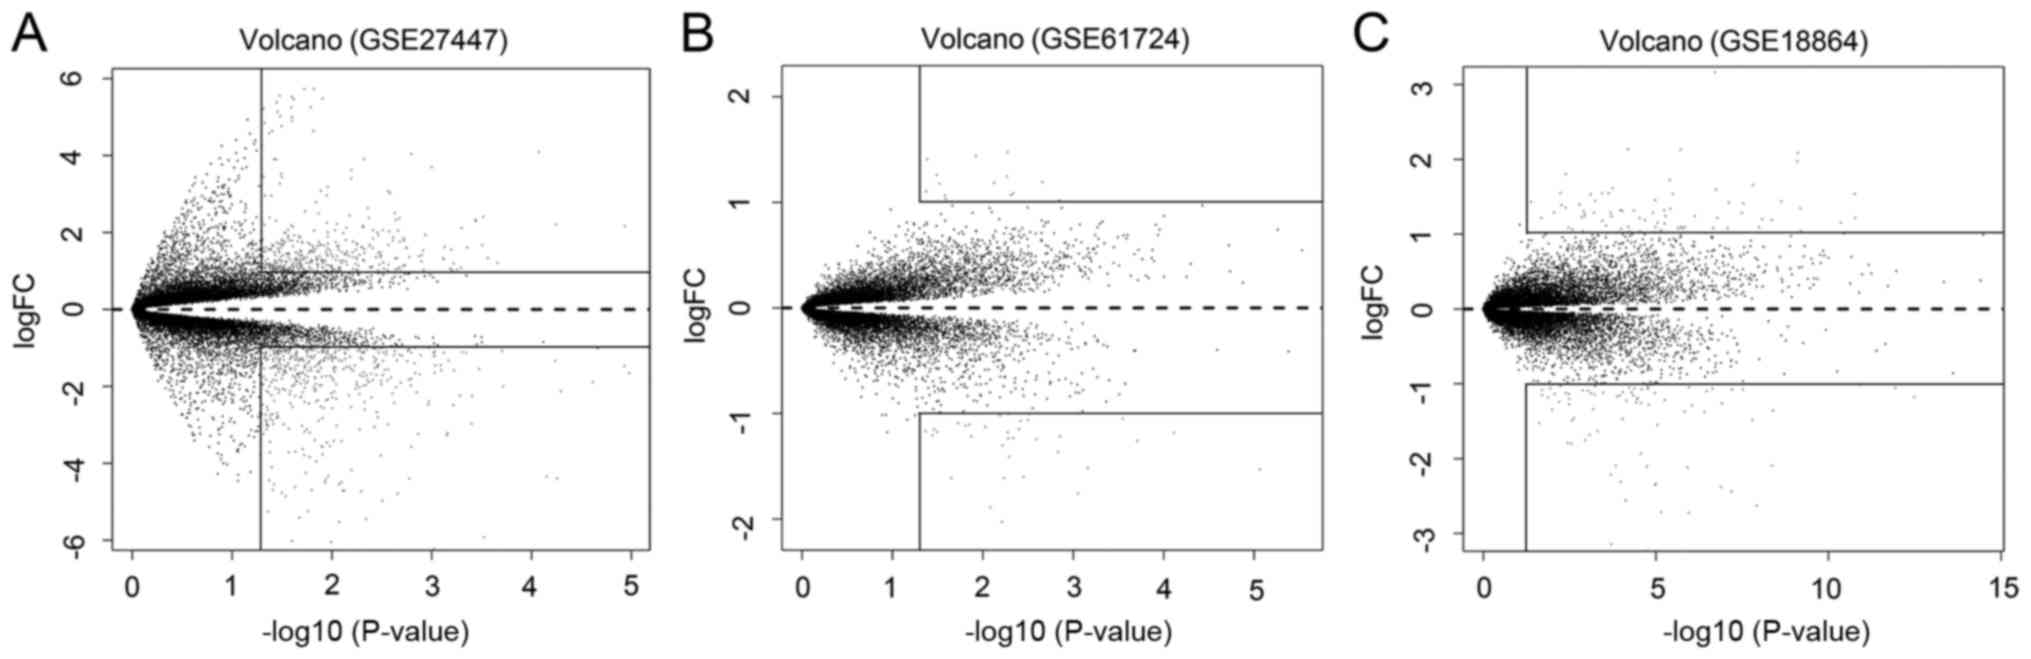
Each dataset was analyzed independently. The raw
data were normalized by R/Bioconductor software. The method of
linear models for microarray data (LIMMA) was employed to screen
the differentially expressed genes (DEGs). P-value <0.05 and
|logFC| >1 were the cut-off criteria to identify the DEGs. The
overall DEGs in the 4 datasets were shown in a volcano plot
(12).
The relative expression pattern of
core DEGs in TNBC
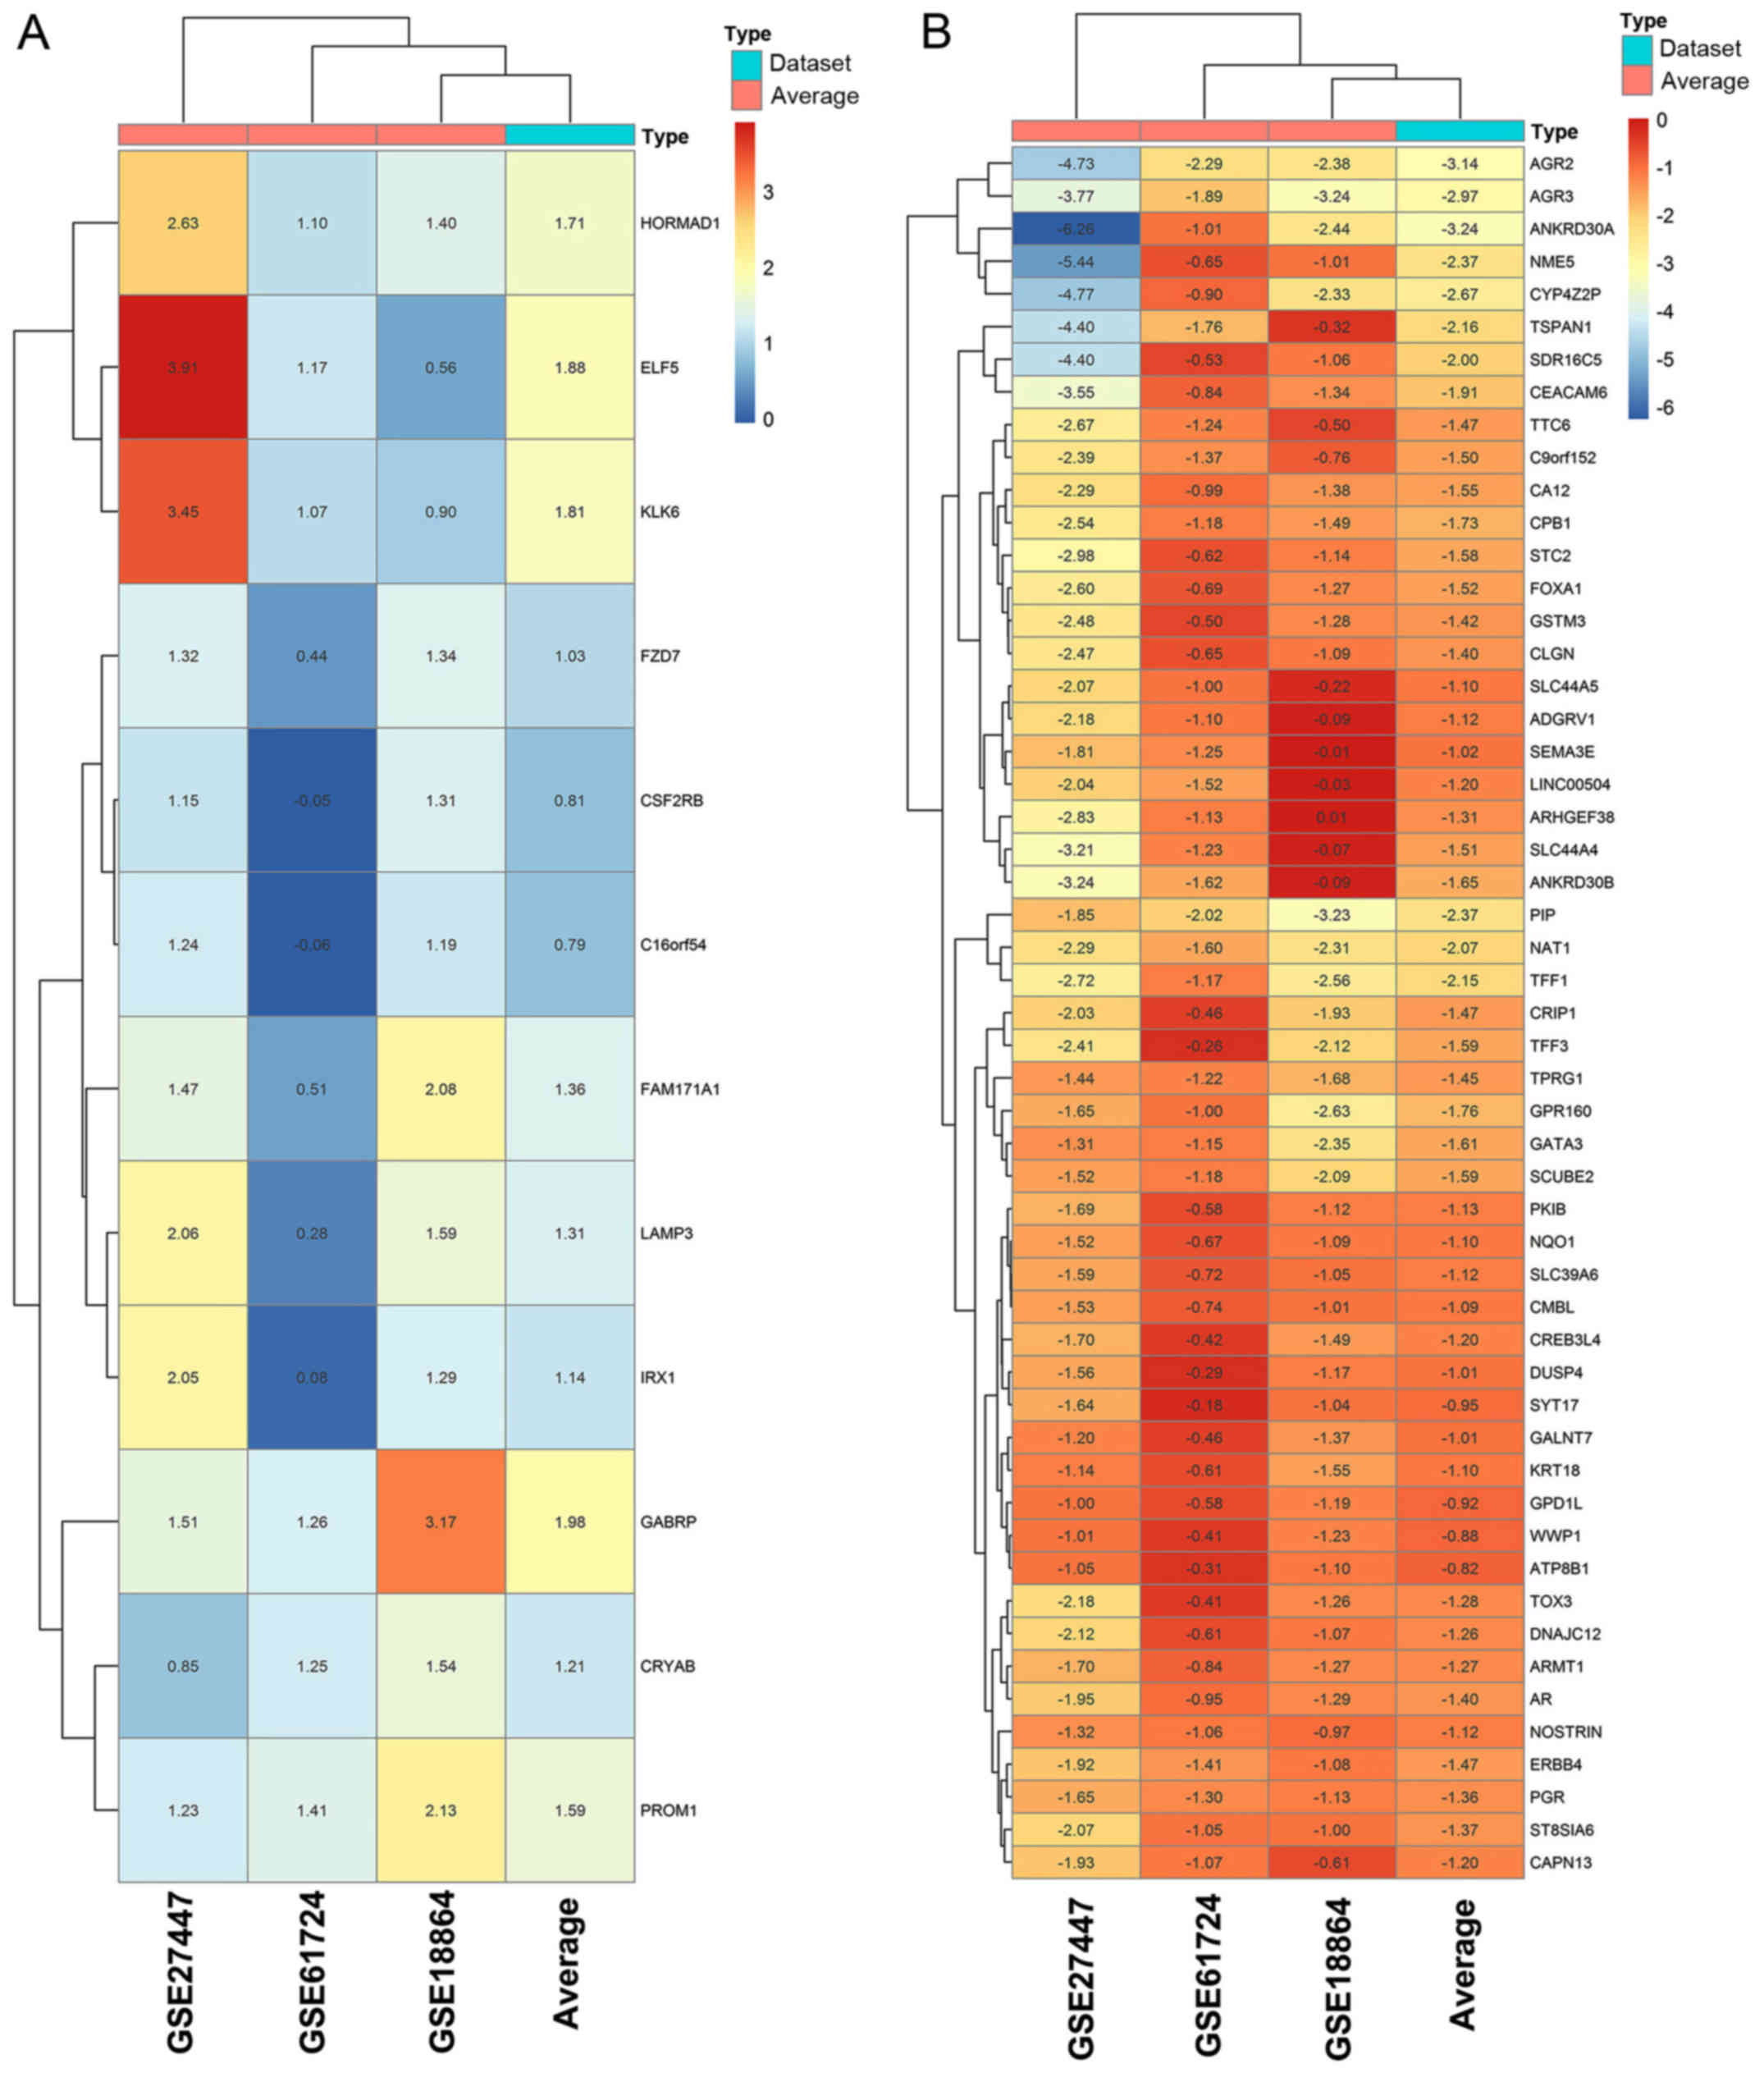
The raw data was normalized. The relative expression
equals the log2FC in each dataset. It was performed with the
quotient of average log expression of TNBC and non-TNBC. The heat
map was used to demonstrate and visualize the result using Package
‘gplots’ of R (13). A cluster
analysis is also presented. According to the average of the
relative expression, the expression pattern of core DEGs are
presented.
Functional annotation of DEGs
The GO enrichment analysis was conducted to gain
insight into the biological process of DEGs. GO included 3 groups:
molecular function, biological process and cellular component.
Kyoto Encyclopedia of Genes Genomes (KEGG, http://www.genome.jp/kegg/) is a knowledge database
for systematic analysis of function annotation. In this study, the
GO and KEGG were performed using web-based software KOBAS
(http://kobas.cbi.pku.edu.cn/). P<0.05
was set as the threshold.
PPI network reconstruction
A protein-protein interaction (PPIs) analysis was
conducted to visualize the functional relationships between the
DEGs and other genes at a molecular level (4), which helped uncover the mechanisms in
TNBC. The DEGs were used for protein-protein interaction (PPI)
networks. These genes were submitted to the Biological General
Repository for Interaction Datasets (BioGRID) (http://thebiogrid.org/) and retrieval of interactors.
A topological analysis and visualization were conducted by
CytoHubba plugin of Cytoscape (cytoHubba identifying hub) to screen
the hub protein of the network.
Survival analysis of DEGs
Kaplan-Meier plotter (KM plotter, www.kmplot.com) is an online survival analysis tool to
assess the effect of 22,277 genes on breast cancer prognosis from
the microarrays of 1,809 patients (14). The patients with TNBC were split
into two groups by the expression status of specific genes. The
relapse-free survival (RFS) was depicted including the hazard ratio
(HR) with 90% confidence intervals and the log rank P-value
(15).
RT-PCR validation
To identify the markers, three TNBC lines
(MDA-MB-231, MDA-MB-435, MDA-MB-468) and three non-TNBC lines
(MCF-7, MDA-MB-453, SK-BR-3) were chosen (4). The total RNA was extracted with the
TRIzol method. First-strand cDNA synthesis and RT-PCR validation
were performed (4). The primers
were designed with Primer Premier5. Reaction was set with 3
replicates, and run under the following conditions: 94°C for 2 min,
35 cycles of 94°C for 30 sec, 55°C for 30 sec, 72°C for 30 sec, and
72°C for 10 min. The relative expression used the 2−∆∆Ct
calculation (16) with the human
GAPDH gene as endogenous control for gene expression analysis. Nine
genes were selected to perform real-time PCR in seven human cancer
cell lines, in which PROM1 and KLK6 were upregulated genes and
KRT18, GPR160, CMBL, AGR3, CREB3L4, CRIP1 and SDR16C5 were
downregulated genes.
Results
Microarray analysis
In this study, the available gene expression
datasets (GSE27447, GSE61724, and GSE18864) were used to gain
insight into the molecular characteristics of TNBC. A total of 167
samples were analyzed (Table I).
According to the statistical analysis, a total of 814 genes were
contained in GSE27447 (442 downregulated and 372 upregulated genes)
(Fig. 1A). Only 51 genes were
identified in GSE61724 (37 downregulated genes and 14 upregulated
genes) (Fig. 1B). In GSE18864, 159
genes were selected including 81 downregulated and 78 upregulated
genes (Fig. 1C). The results are
presented in Table I and Fig. 1.
 | Table I.Microarray database and DEGs in the
present study. |
Table I.
Microarray database and DEGs in the
present study.
| GEO series | No. of TNBC | No. of
non-TNBC | Downregulated
genes | Upregulated
genes | Total DEGs |
|---|
| GSE27447 | 5 | 14 | 442 | 372 | 814 |
| GSE61724 | 16 | 48 | 37 | 14 | 51 |
| GSE18864 | 24 | 60 | 81 | 78 | 159 |
Core DEGs of TNBC
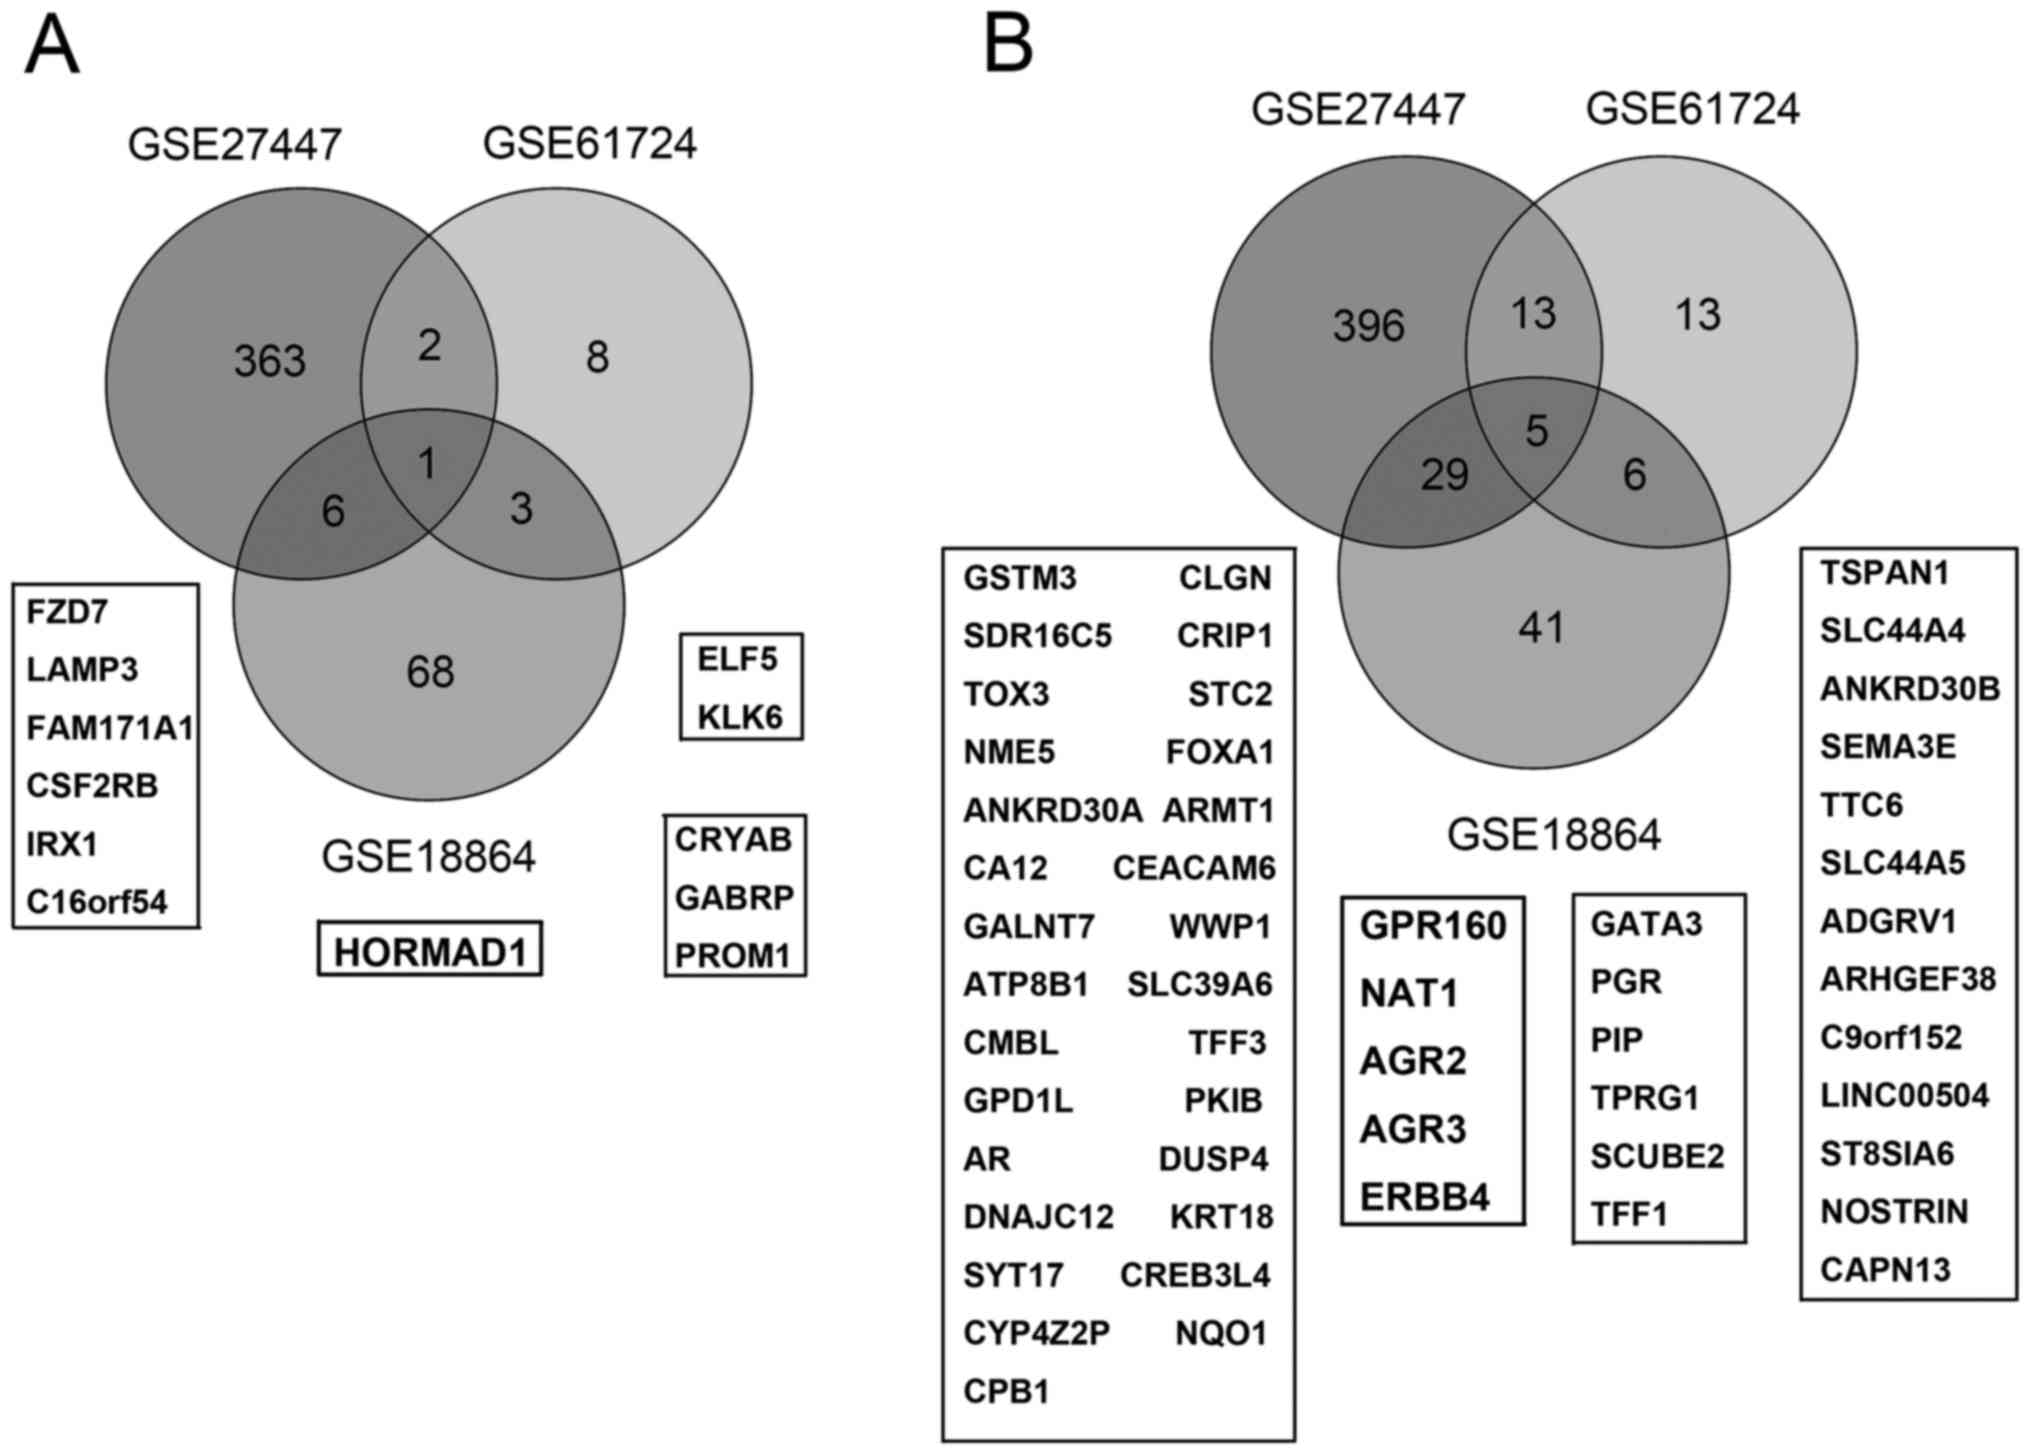
In order to screen common specific genes in TNBC,
the Veen diagram was processed. The overlap between the 3 datasets
was investigated to identify how many common genes were involved in
at least 2 datasets. These genes were named as the ‘core DEGs’.
Twelve upregulated genes and 53 downregulated genes were
identified. The upregulated genes are shown in Fig. 2A. In addition, the downregulated
genes are shown in Fig. 2B. Only
HORMAD1 in the upregulated genes and 5 genes (GPR160, NAT1, AGR2,
AGR3 and ERBB4) were common in all of the three datasets (Fig. 2).
The relative expression pattern of
core DEGs in TNBC
Among the core DEGs, three datasets revealed similar
expression pattern. The cluster result of the sample revealed that
GSE18864 was most consistent with the average expression, followed
by GSE61724 and GSE27447. HORMAD1, ELF5, KLK6 and GABRP represented
higher expression than other genes. AGR2, AGR3, ANKRD30A, NME5 and
CYP4Z3P had lower expression (Fig. 3A
and B). These significant genes would be potential biomarkers
to characterize TNBC.
KEGG and GO results
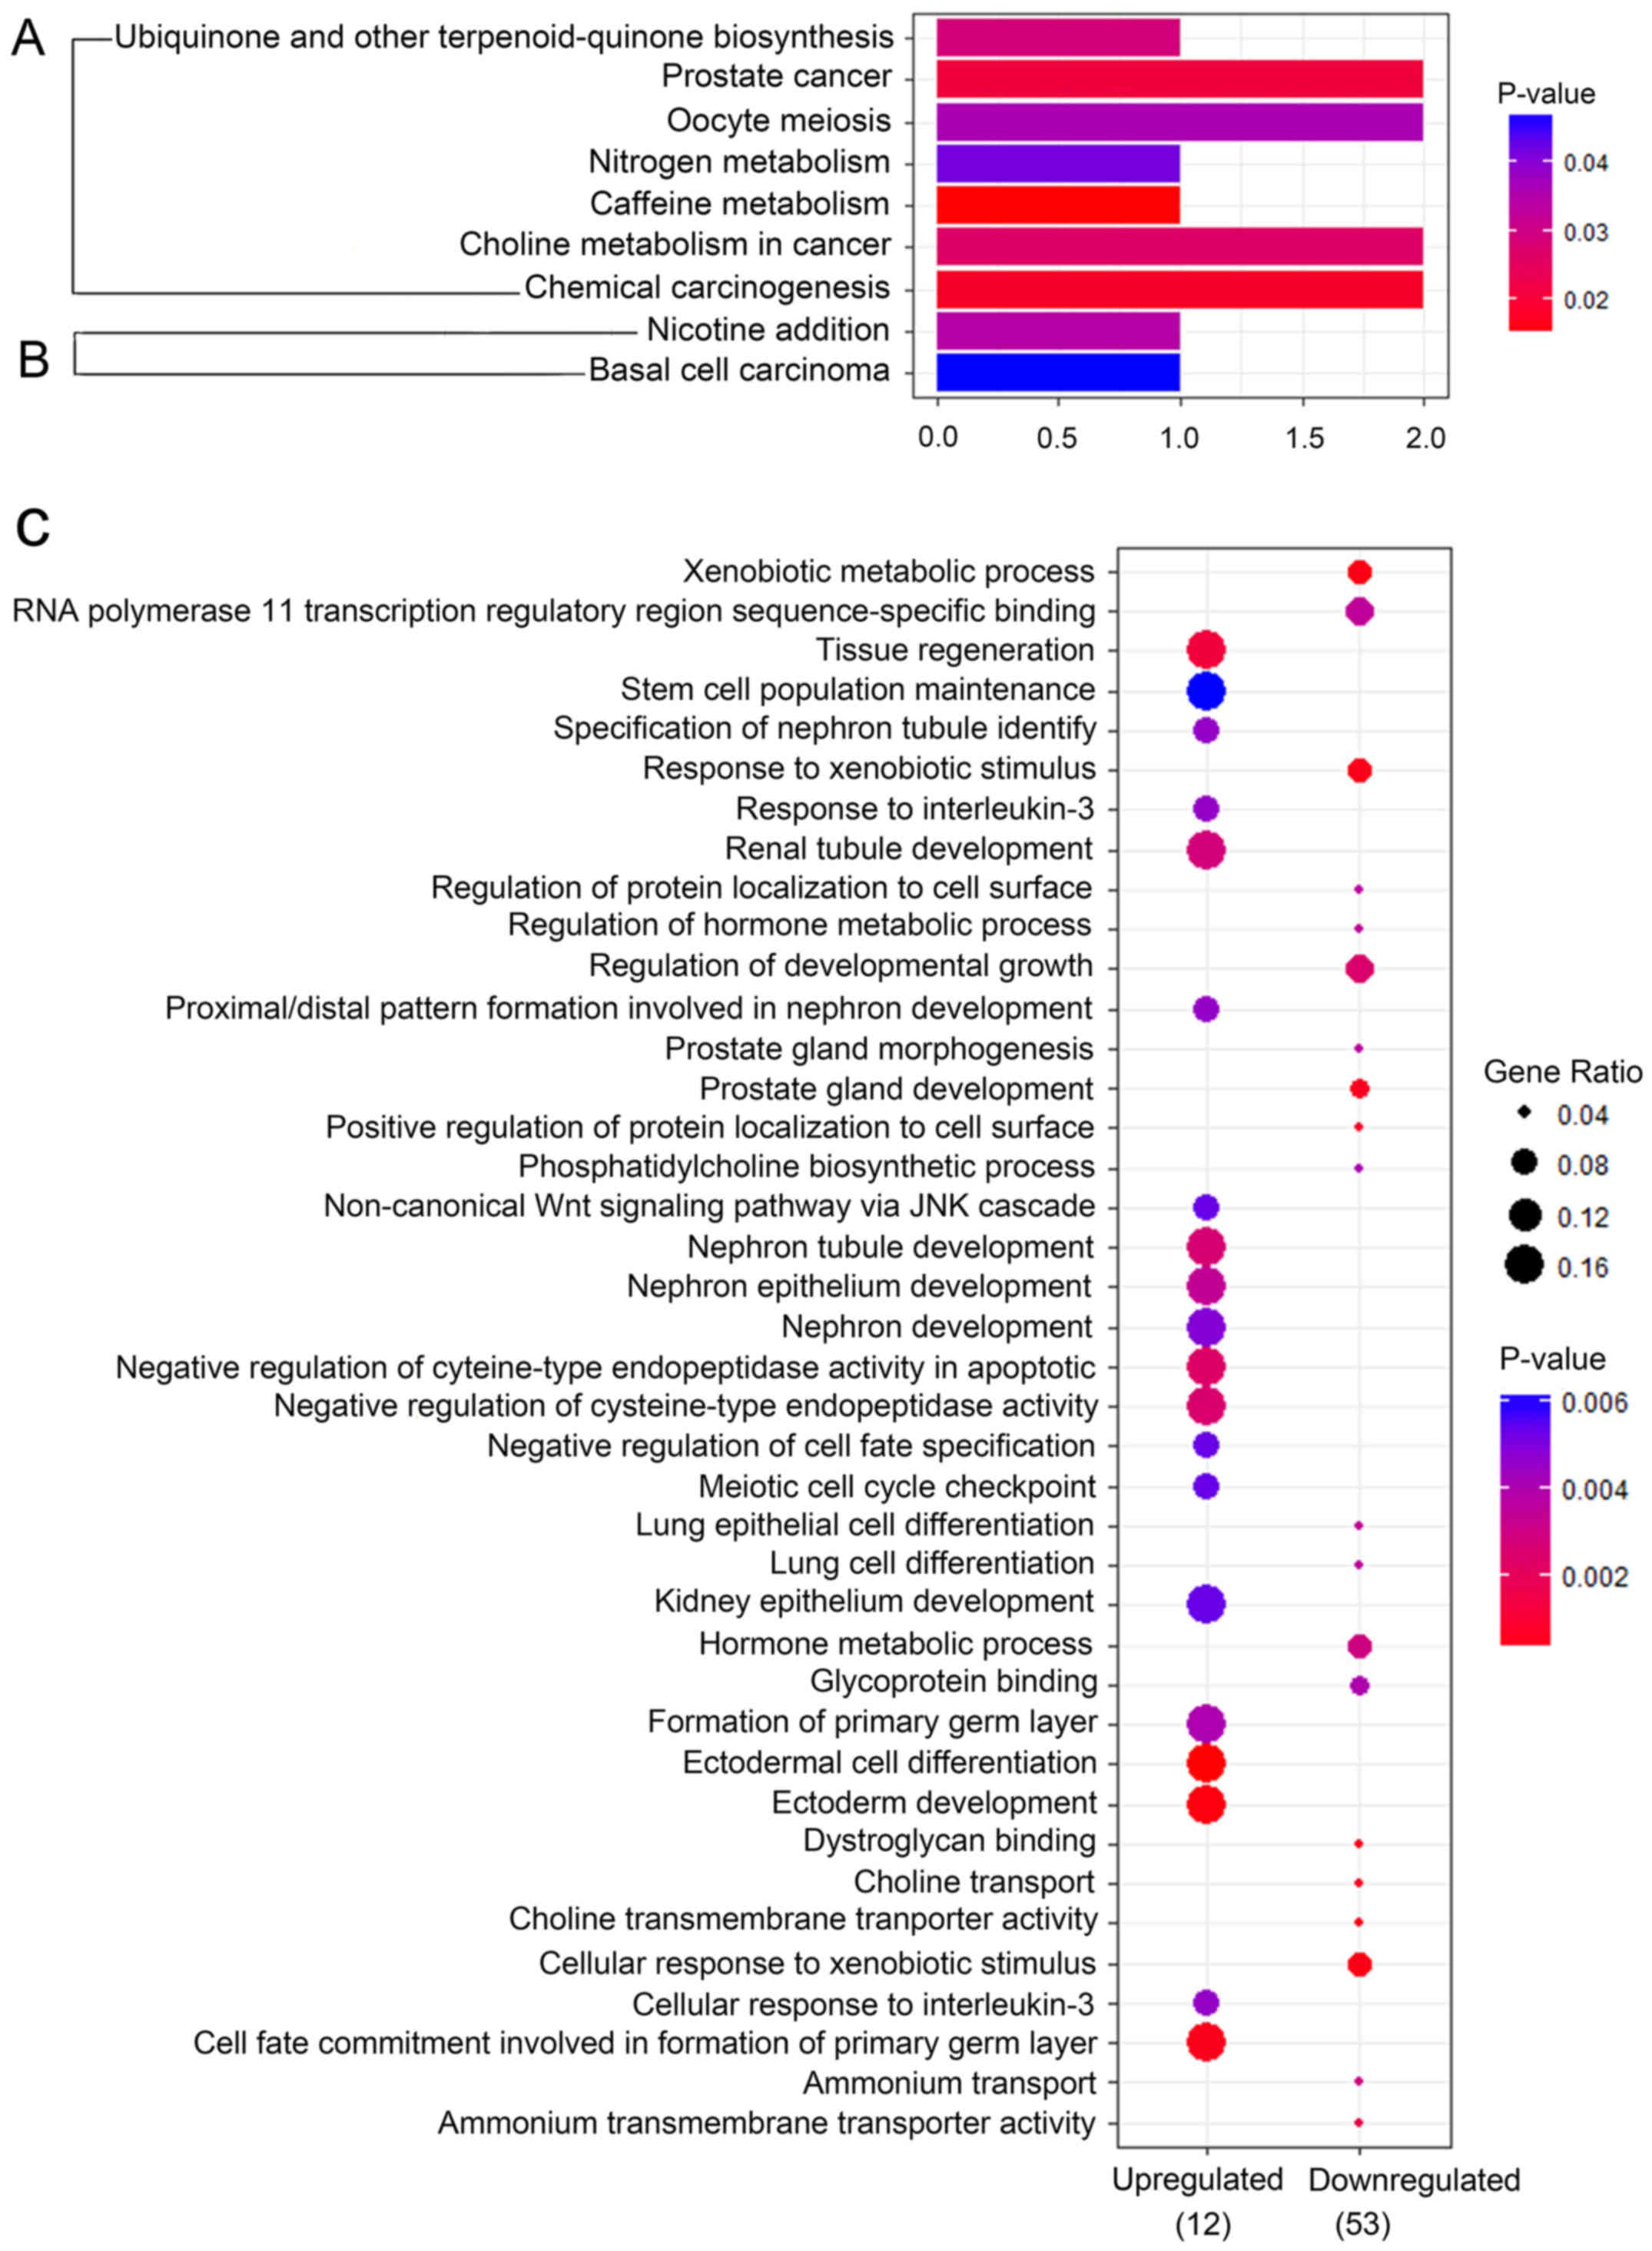
To gain insight into the biological pathways in
TNBC, A KEGG pathway analysis was conducted (Fig. 4A and B). A plot was made with R
package clusterProfiler with a P-value cut-off of <0.05
(17). The result showed that
‘nicotine addiction’ (GABRP) and ‘basal cell carcinoma’ (FZD7)
pathways were involved in the ‘upregulated genes. In addition,
‘ubiquinone and other terpenoid-quinone biosynthesis pathways’
(NQO1), ‘prostate cancer’ (CREB3L4, AR), ‘oocyte meiosis’ (AR,
PGR), ‘nitrogen metabolism’ (CA12), ‘caffeine metabolism’ (NAT1),
‘choline metabolism in cancer’ (SLC44A5, SLC44A4), ‘chemical
carcinogenesis’ (GSTM3, NAT1) were included in downregulated
genes.
Based the GO function annotation, the upregulated
genes were categorized into 39 groups (Fig. 4C). The top five terms were:
ectodermal cell differentiation, ectoderm development, cell fate
commitment involved in formation of primary germ layer, tissue
regeneration and negative regulation of cysteine-type endopeptidase
activity involved in apoptotic process. Furthermore, 32 GO terms
were involved in the downregulated genes. The top five terms were:
xenobiotic metabolic process, cellular response to xenobiotic
stimulus, choline transmembrane transporter activity, response to
xenobiotic stimulus and dystroglycan binding (Fig. 4C). P-value <0.01 was the cut-off
criterion.
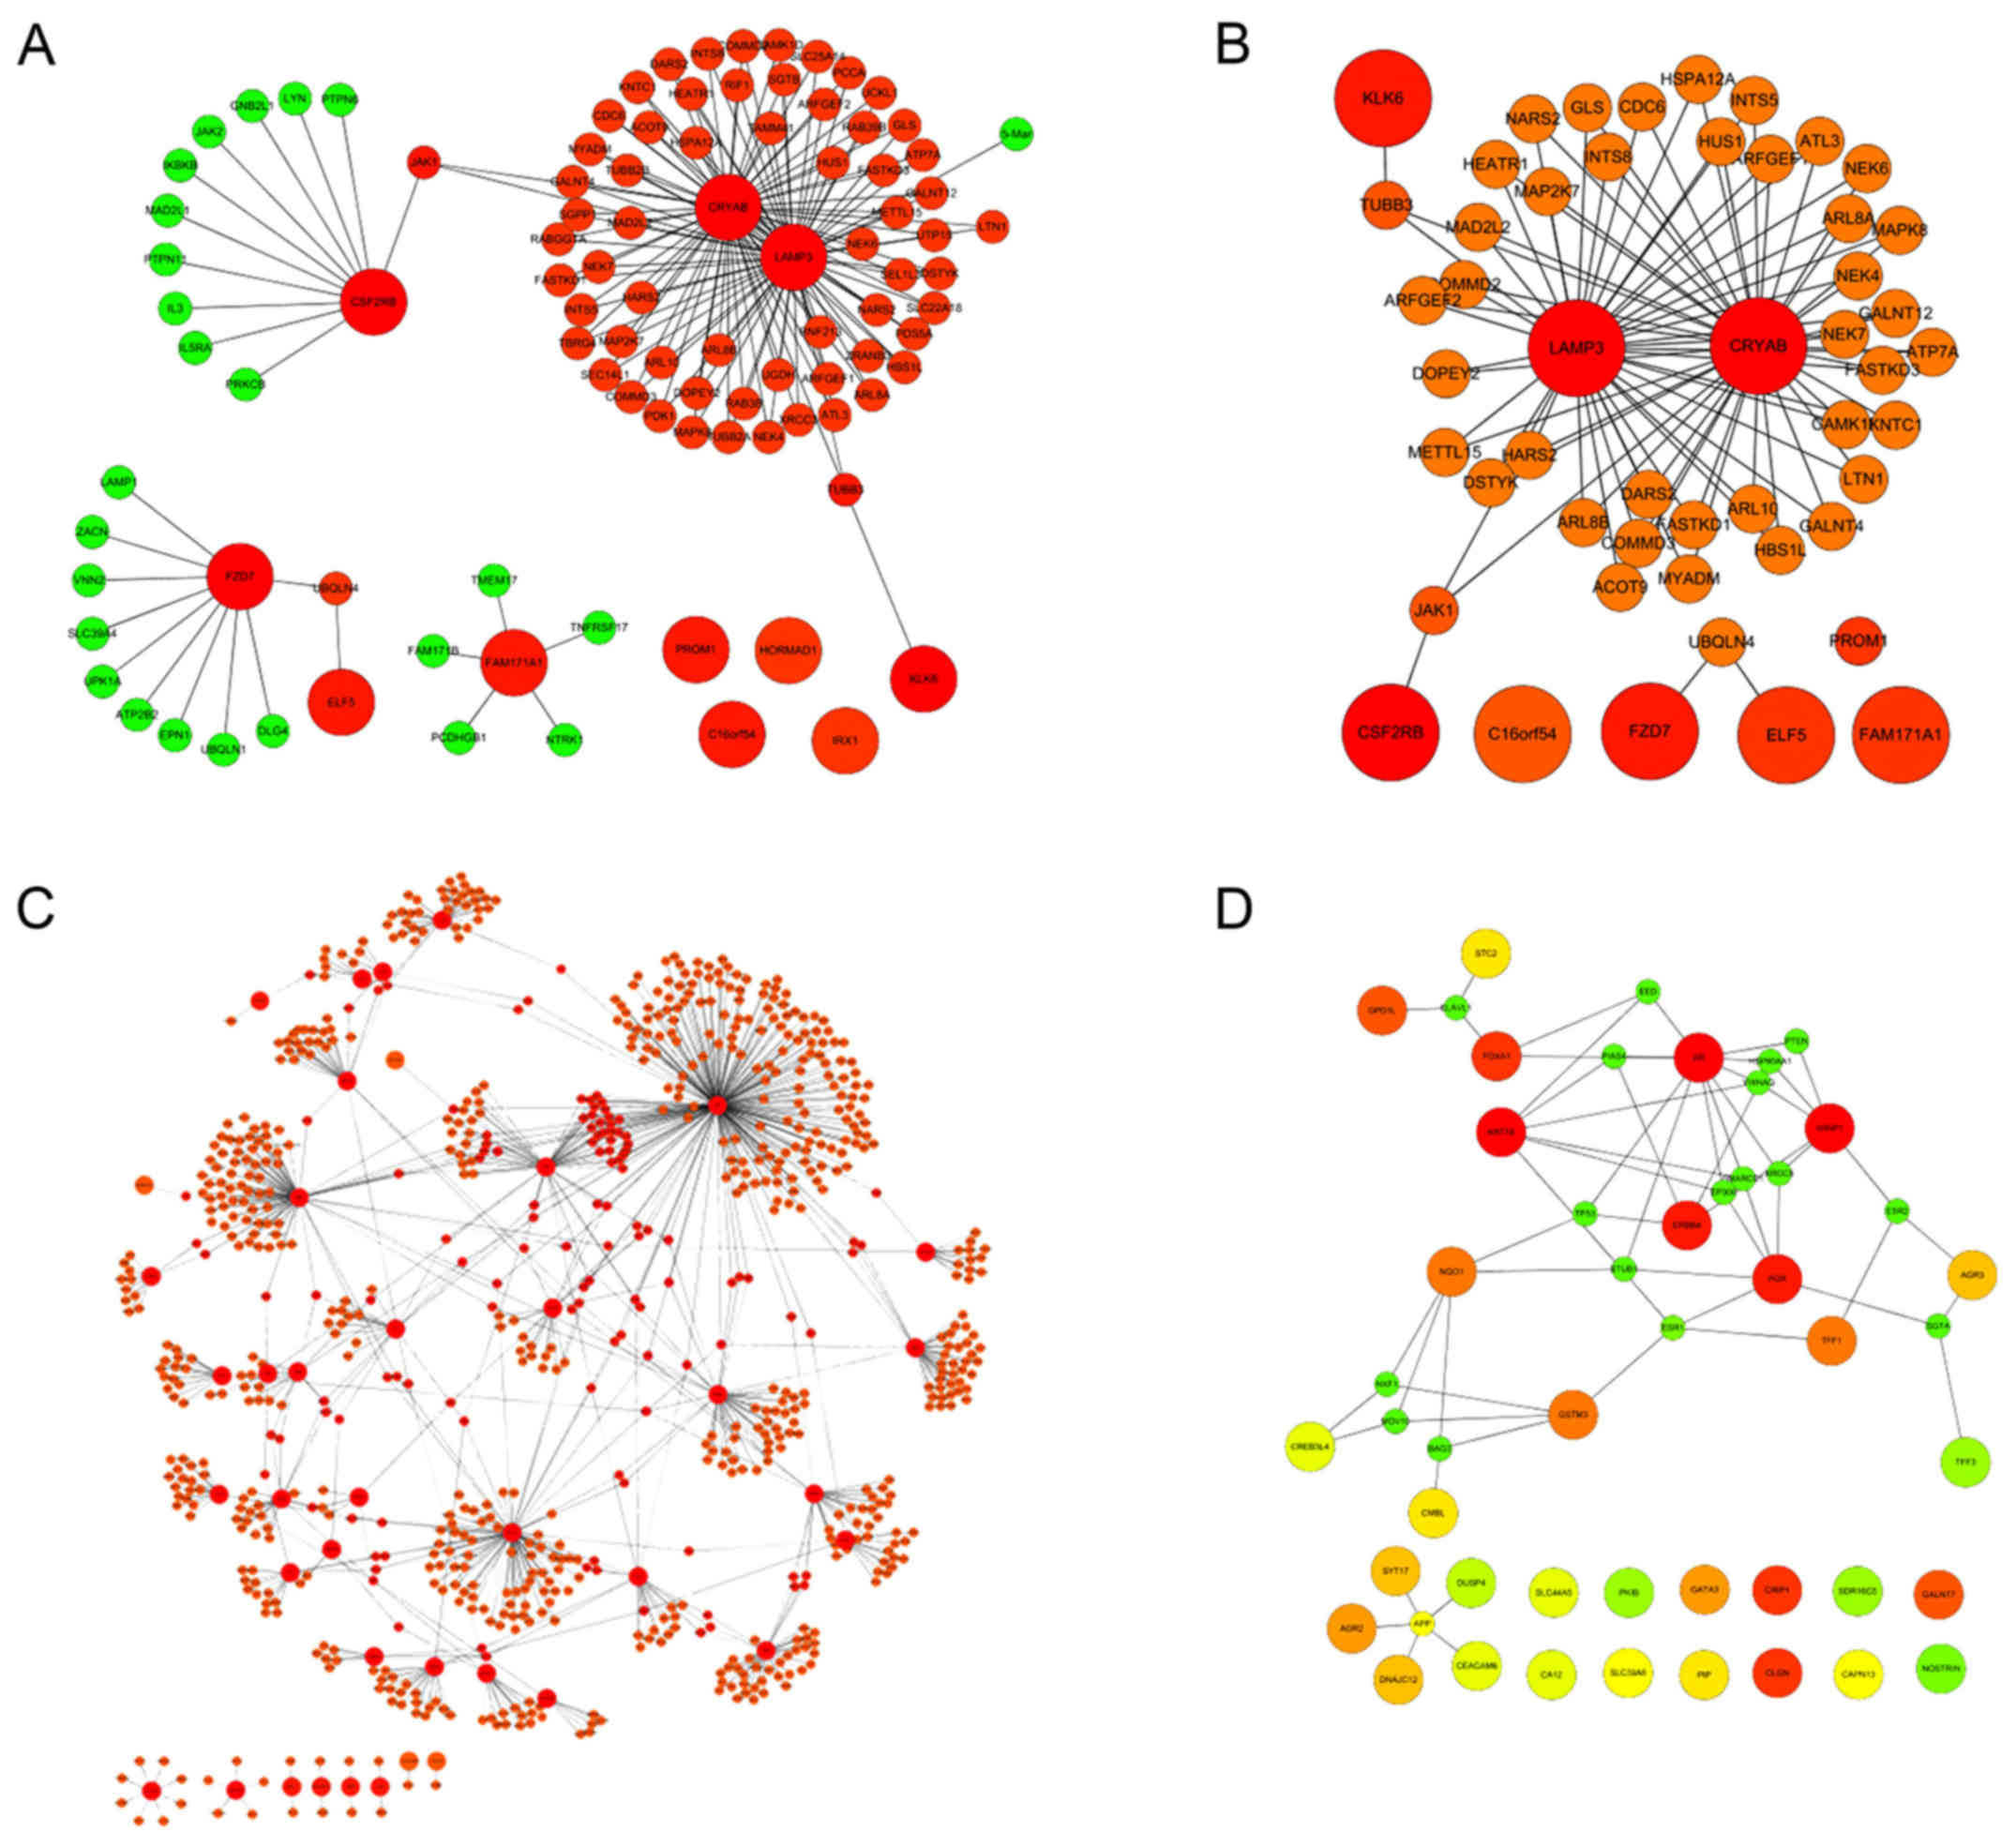
Construction of PPI network in
TNBC
The reconstruction of the PPI network in TNBC was
based on the 65 core DEGs with their interactors. As a result, the
PPI network consisted of 133 nodes and 188 edges in the upregulated
interactions (Fig. 5A), and in
order to screen the hub, the top 50 groups were selected from the
network to construct a subnetwork (Fig.
5B). Furthermore, 872 nodes and 995 edges in the downregulated
interactions (Fig. 5C). The top 50
groups were also selected from the network to construct a
subnetwork (Fig. 5D).
A local-based metric (i.e., degree), and a
global-based metric (i.e., betweenness centrality) were adopted to
determine the main genes (18). By
these indexes, a set of genes were identified, including 5
upregulated genes (CRYAB, LAMP3, CSF2RB, KLK6, FZD7) and 5
downregulated genes (AR, KRT18, WWP1, PGR, ERBB4) (Table II). More attention should be paid
to these genes in further research since they were chosen as the
potential candidate biomarkers of TNBC.
| Table II.Topological characters of the core
genes. |
Table II.
Topological characters of the core
genes.
| GEO series | Protein symbol | Degree | Betweenness |
|---|
| Upregulated
hub | CRYAB | 64 | 1957.5 |
|
| LAMP3 | 64 | 1957.5 |
|
| CSF2RB | 14 | 1105 |
|
| KLK6 | 12 | 946 |
|
| FZD7 | 10 | 117 |
| Downregulated
hub | AR | 238 | 210081.7991 |
|
| KRT18 | 90 | 94918.36244 |
|
| WWP1 | 84 | 79340.42971 |
|
| PGR | 63 | 31428.61489 |
|
| ERBB4 | 51 | 38581.13683 |
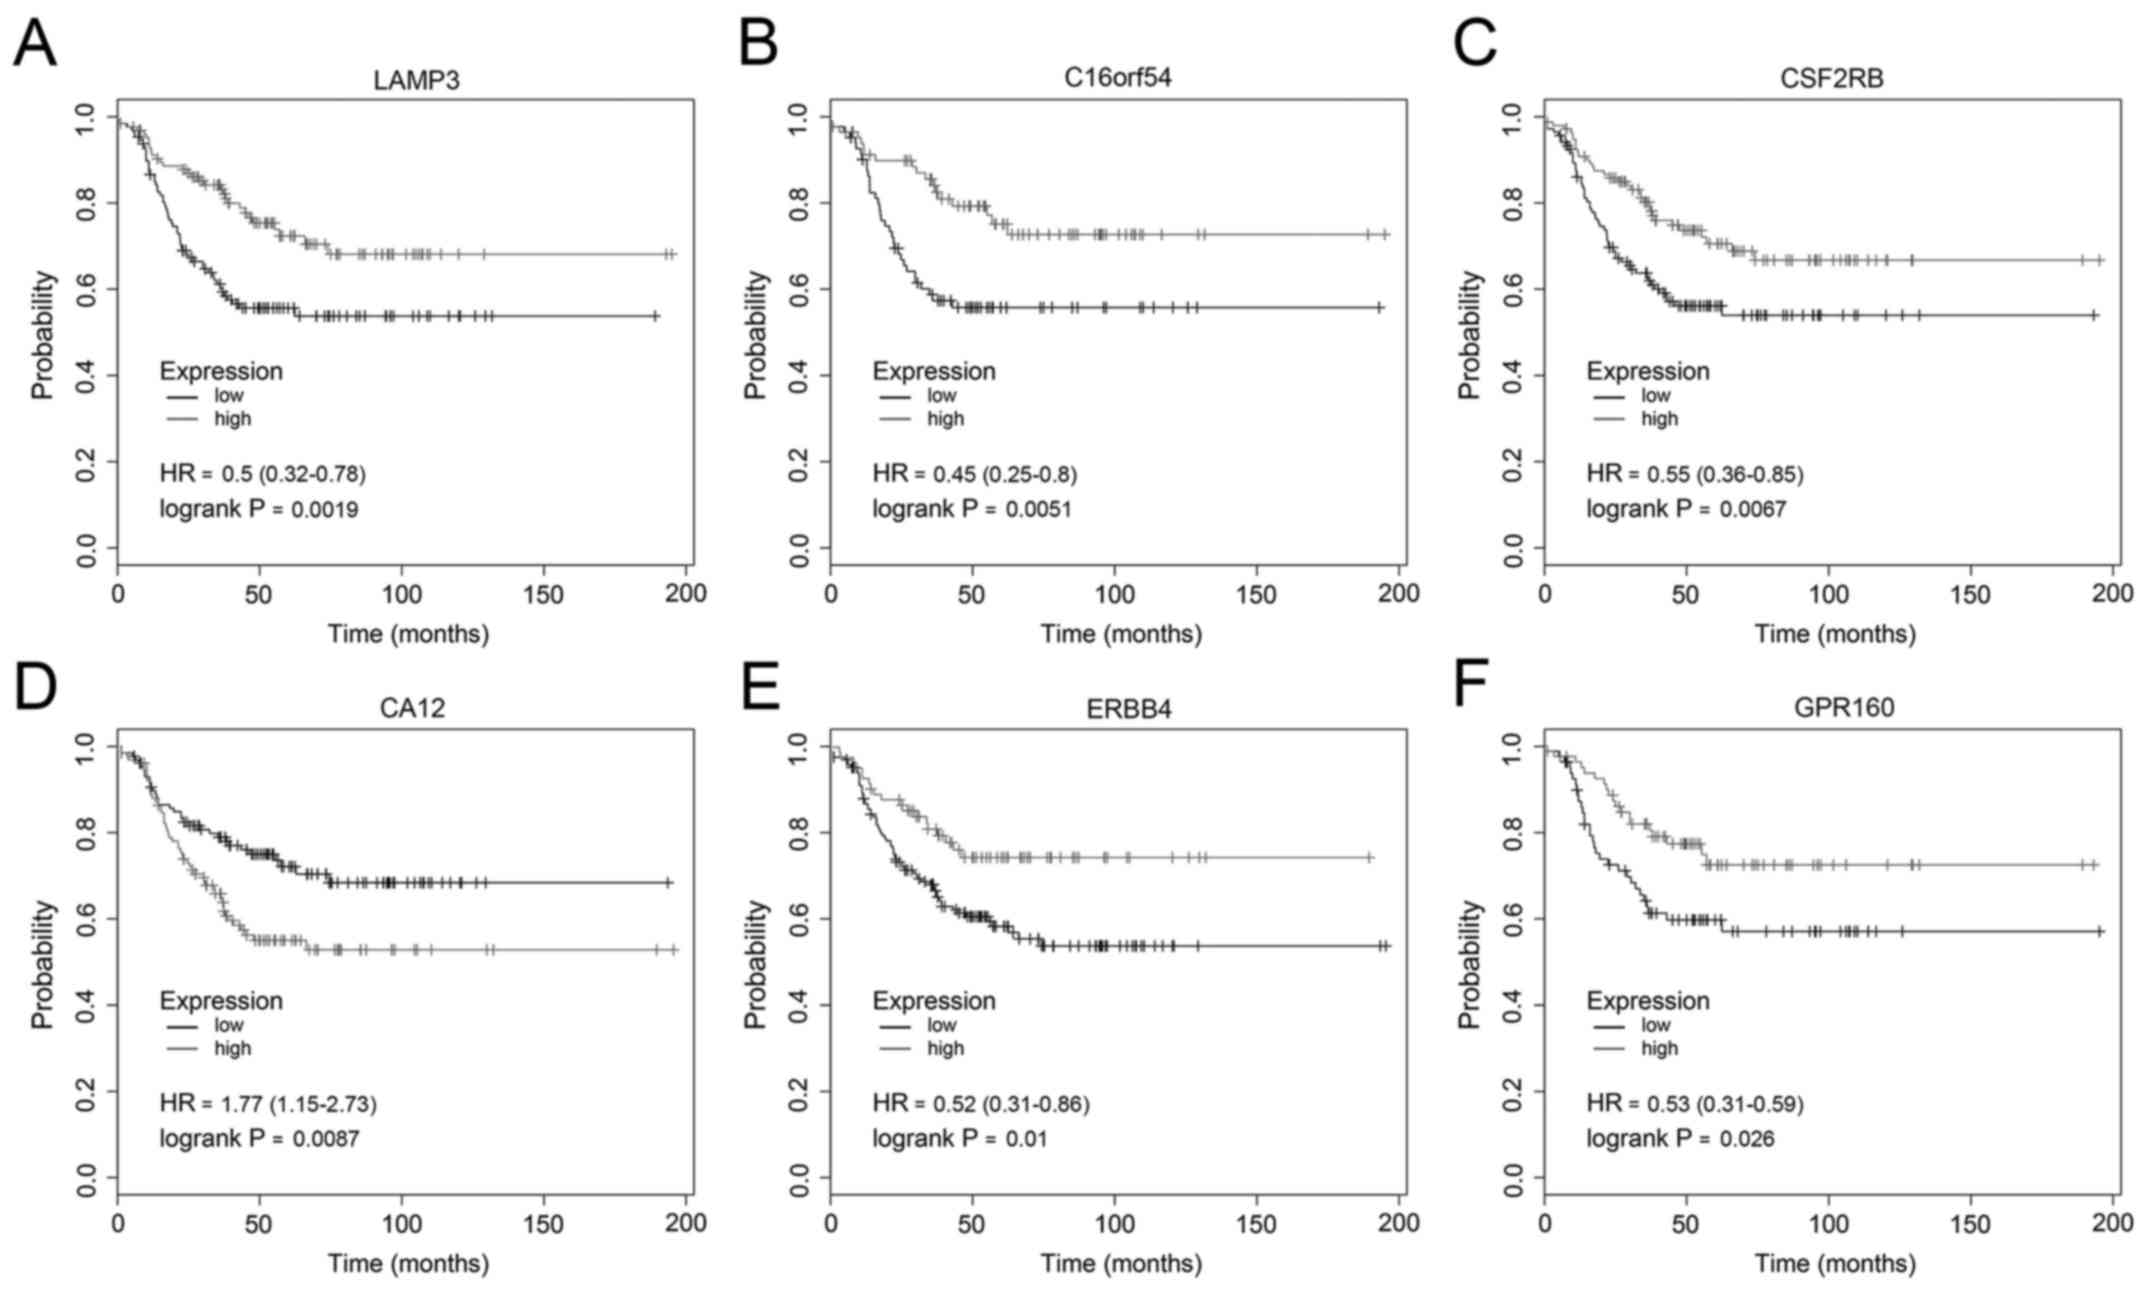
The RFS analysis of TNBC-specific
genes
The prognostic value of TNBC-specific genes was also
implemented in www.kmplot.com. The relapse-free
survival (RFS) for patients with TNBC was assessed by the low and
high expression of each gene. By the log-rank P-value, the top 6
significant genes (LAMP3, C16orf54, CSF2RB, CA12, ERBB4 and GPR160)
were listed (Fig. 6). The HR of
LAMP3 was 0.5 and log-rank P-value of it was 0.0019 (Fig. 6A). The HR of C16orf54 was 0.45 and
log-rank P-value was 0.0051 (Fig.
6B). The HR of CSF2RB was 0.55 and log rank P-value was 0.0067
(Fig. 6C). The HR of CA12 was 1.77
and log rank P-value was 0.0087 (Fig.
6D). The HR of ERBB4 was 0.52 and log rank P-value was 0.01
(Fig. 6E). The HR of GPR160 was
0.53 and log-rank P-value was 0.026 (Fig. 6F). The result showed that the high
expression of CA12 and the low expression of LAMP3, C16orf54,
CSF2RB, ERBB4 and GPR160 exhibited associations with unfavorable
relapse-free survival.
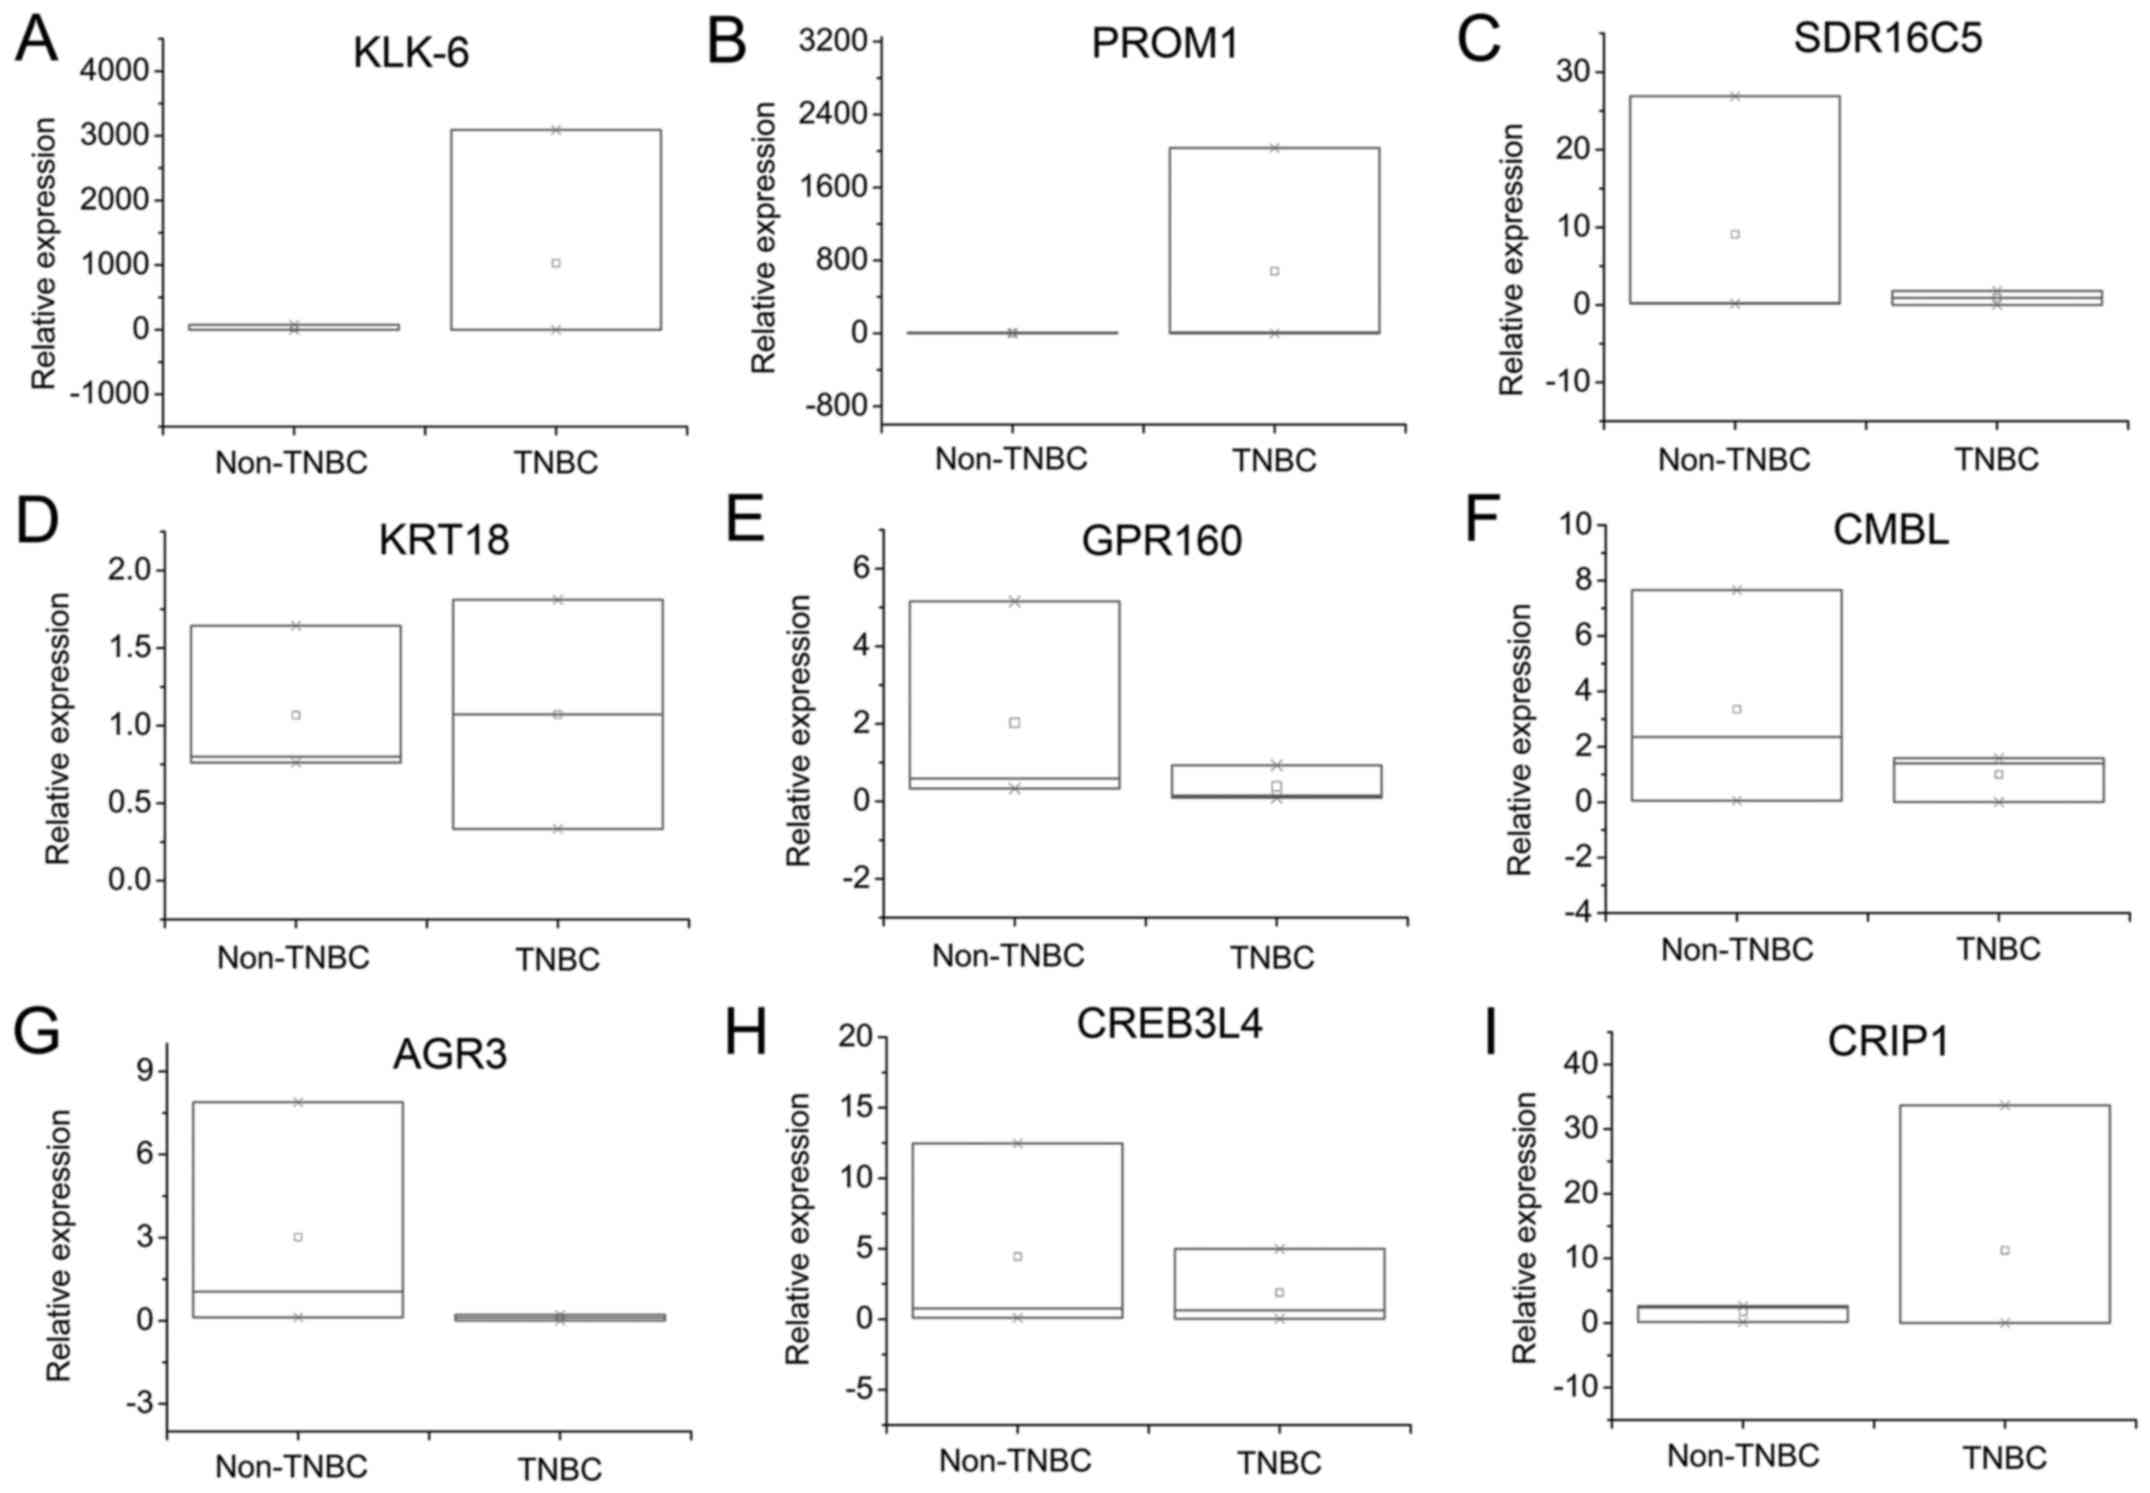
RT-PCR validation
To validate the DEGs in the integrated analysis, 9
TNBC-specific genes were chosen from DEGs by combining the PPI and
marker selection result. PROM1 and KLK6 were selected as the
upregulated genes. In addition, KRT18, GPR160, CMBL, AGR3, CREB3L4,
CRIP1 and SDR16C5 were chosen as the downregulated genes. Primers
are listed in Table III. In
general, the expression patterns in TNBC and non-TNBC lines were
consistent with that in the integrated analysis (Fig. 7). The KLK6 and PROM1 genes were
highly expressed in TNBC cell lines (Fig. 7A and B). In addition, the SDR16C5
was lowly expressed in TNBC cell lines (Fig. 7C). The KRT18 was highly expressed in
TNBC cell lines (Fig. 7D). The
GPR160 was lowly expressed in TNBC cell lines (Fig. 7E). The CMBL was lowly expressed in
TNBC cell lines (Fig. 7F). The AGR3
was lowly expressed in TNBC cell lines (Fig. 7G). The CREB3L4 was also lowly
expressed in TNBC cell lines (Fig.
7H). However, the expression of CRIP1 was slightly higher in
TNBC lines compared with that in non-TNBC lines (Fig. 7I). Finally, the RT-PCR result could
be also used to identify the reliability of the integrated
analysis.
| Table III.The primers used in the RT-PCR
validation. |
Table III.
The primers used in the RT-PCR
validation.
| Gene symbol | Gene full name | Sequence primers
from 5′ to 3′ |
|---|
| GAPDH |
Glyceraldehyde-3-phosphate
dehydrogenase | F:
GCACCGTCAAGGCTGAGAAC |
|
|
| R:
GGATCTCGCTCCTGGAAGATG |
| AGR3 | Anterior gradient
3, protein disulphide isomerase family member | F:
CCAACCTTGCCATTGCAAT |
|
|
| R:
TCATCTCCCCATCCTCTTGAGA |
| CMBL |
Carboxymethylenebutenolidase homolog | F:
CCCTCTGGCGACTGGTCTATC |
|
|
| R:
GCACTGATCTCTCTATCGATCTTCTG |
| CREB3L4 | cAMP responsive
element binding protein 3 like 4 | F:
CCCAGCTTCAGTCCATTCCA |
|
|
| R:
AAGTCACTCCGTGAGGCTGGTA |
| CRIP1 | Cysteine rich
protein 1 | F:
GCTGAGCACGAAGGCAAAC |
|
|
| R:
CAAACATGGCTGCGTAGCA |
| GPR160 | G protein-coupled
receptor 160 | F:
TTTCAGTCCTTGCTTATGTTTTGG |
|
|
| R:
CATTCTGTGCCTTCAGGCTTT |
| KLK6 | Kallikrein related
peptidase 6 | F:
GCCTACCCTGGCCAGATCA |
|
|
| R:
ATCACCCTGGCAGGAATCC |
| KRT18 | Keratin 18 | F:
CTCCGCAAGGTCATTGATGA |
|
|
| R:
TACTTCCTCTTCGTGGTTCTTCTTC |
| PROM1 | Prominin 1 | F:
TTCCCAGAAGATACTTTGAGAA |
|
|
| R:
CATACAAAAGAAATACCCCACCAGAG |
| SDR16C5 | Short chain
dehydrogenase/reductase family 16C member 5 | F:
AGTAGCCGACCAGGTTAAAAAAGA |
|
|
| R:
TGTTACGATTCCGGCATTGTT |
Discussion
Identification of valid biomarkers in diagnosis,
treatment and prognosis in TNBC is a challenging task. Although
individual datasets have produced hundreds of genes (Table I), only six common DEGs are
achieved. In consideration of the sample limitation and
heterogeneity from patients and array platforms, individual
analyses were only confined to uncover the central mechanisms
behind TNBC (18). The integrated
analysis from different gene expression profiles would be efficient
for insight into TNBC.
In our study, we achieved 65 DEGs from at least 2
datasets (Fig. 2). Furthermore,
KEGG enrichment result is related to a range of cancer pathways,
such as basal cell carcinoma (FZD7), prostate cancer (CREB3L4, AR),
choline metabolism in cancer (SLC44A5, SLC44A4) and chemical
carcinogenesis (GSTM3, NAT1), which provide more evidence to
uncover the mechanisms of TNBC (Fig.
4). The GO annotation was mainly enriched in ectodermal cell
differentiation, tissue regeneration, xenobiotic metabolic process,
and prostate gland development. It is consistent with KEGG
annotation. Then, the PPI network was reconstructed.
We chose a global and local metric to investigate
the interaction between the DEGs and other intimate genes in TNBC.
The main genes in the network would benefit the screening of hubs.
These hub genes deserve more attention and further study since they
are potential candidate biomarkers for TNBC.
It has been reported that FZD7 is overexpressed in
67% of TNBC (19). The
FZD7-involved canonical Wnt pathway is the basis for the formation
of TNBC. It could be regarded as the biomarker and potential
therapeutic target of TNBC (7).
LAMP3 is a protein included in cell proliferation term of GO. The
activation of the IFN pathway is an early event following AC
chemotherapy in 9 TNBC (20).
Nagelkerke et al reported the role of UPR-induced LAMP3 in
hypoxia-mediated migration of breast cancer cells (21).
FAM171A1 has been identified as an overexpressed
gene in a large meta-analysis of seven patients with ER-negative
BrCa tumor, which is also revealed as a hub gene (22). CSF2RB is related to the molecular
profiling and computational network of TAZ-mediated mammary
tumorigenesis (23). The
overexpression of IRX1 is associated with growth arrest in gastric
cancer, which can inhibit peritoneal spreading and metastasis
(24). However, it has not been
reported in the TNBC. In the present study, it was found that IRX1
serves as a common gene in GSE27447 and GSE18864, which is a
highly-expressed gene with average lgFC of 1.14 in TNBC compared
with non-TNBC (Figs. 2 and 3). C16orf54 is reported in
immune/inflammation-related genes in the stromal gene set of breast
cancer in multivariate Cox proportional hazard models with HR of
0.507. There is no research on C16orf54 in TNBC (25).
HORMAD1 is the only common gene in the 3 datasets,
which holds the interaction with BRCA1 in the PPI network (Fig. 2). Watkins et al has reported
that the HORMAD1 overexpression contributes to homologous
recombination deficiency in TNBC. Higher expression of HORMAD1
inhibits the RAD51-dependent homologous recombination and promotes
the use of alternative forms of DNA repair (26). Komatsu et al also reported
that HORMAD1 is involved in the carcinogenesis of TNBC (27). In the present study, HORMAD1
possesses the lgFC 1.71, which could be a potential biomarker in
TNBC. Chakrabarti et al reported that the ELF5 regulates the
mammary gland stem cell fate by influencing the notch signaling
(28). CRYAB, ELF5, and GABRP have
been reported as the molecular targeted therapies (29). KLK6 may be a promising biomarker in
epithelial-to-mesenchymal transition (EMT) due to the fact that it
belongs to a family of serine proteases, which involves the
clinical biomarker KLK3 in prostate cancer (30). However, there is no research on KLK6
in TNBC.
Among the downregulated core DEGs, the present
analysis showed that some novel genes were not investigated in TNBC
patients previously, such as KRT18, GPR160, CMBL, AGR3, CREB3L4,
CRIP1 and SDR16C5. Several downregulated genes have been reported
in previous research including STC2, FOXA1, ATP8B1, SLC39A6, DUSP4,
KRT18, TSPAN1, ERBB4, GATA3 (18).
FOXA1, ANKRD30A, CMBL, GPR160 and AGR2 were downregulated genes in
TNBC compared with non-TNBC (4). AR
has been used to indicate the prognostic value in TNBC based on a
tissue microarray (31). In the PPI
network, AR is the top core gene with a degree of 238. NAT1 and PGR
were enriched for genes associated with luminal biology (32). AGR2 has been reported highly
associated with the properties of breast cancer stem cells
(33). AGR3 is regarded as a
suitable serum-based biomarker for early cancer detection with
overexpression (34). Chen et
al reported the amplified WWP1 as the potential molecular
target in breast cancer (35). We
have identified WWP1 as the core gene in the PPI network (Fig. 5 and Table II).
In conclusion, the TNBC-specific gene expression
profiles have been identified and the RFS analyses of these
TNBC-specific genes have been performed. Furthermore, by integrated
analysis, we achieved a set of core DEGs in TNBC compared with
non-TNBC. The function annotation and PPI network reconstruction
would be conducive to understand the underlying mechanisms in TNBC.
According to the combination of the relative expression pattern, GO
and KEGG annotation and PPI network reconstruction, a set of hub
genes have been identified, including HORMAD1, PROM1 and KLK6 from
upregulated genes, KRT18, GPR160, CMBL, AGR3, CREB3L4, CRIP1 and
SDR16C5 from the downregulated genes, which are closely associated
with TNBC. These hub genes are novel and specific genes that have
not been investigated much. They also have higher expression of
dysregulation. In this way, these hub genes will act as potential
biomarkers in TNBC and contribute to the study of TNBC.
Acknowledgements
This study was supported by the National Natural
Science Foundation of China (nos. 81373573 and 81460655) and the
Mongolian Medicine Systems Biology Science and Technology
Innovation Team Plan of Inner Mongolia.
References
|
1
|
Al-Hajj M, Wicha MS, Benito-Hernandez A,
Morrison SJ and Clarke MF: Prospective identification of
tumorigenic breast cancer cells. Proc Natl Acad Sci USA.
100:3983–3988. 2003. View Article : Google Scholar : PubMed/NCBI
|
|
2
|
Yang XR, Sherman ME, Rimm DL, Lissowska J,
Brinton LA, Peplonska B, Hewitt SM, Anderson WF,
Szeszenia-Dabrowska N, Bardin-Mikolajczak A, et al: Differences in
risk factors for breast cancer molecular subtypes in a
population-based study. Cancer Epidemiol Biomarkers Prev.
16:439–443. 2007. View Article : Google Scholar : PubMed/NCBI
|
|
3
|
Cho EY, Chang MH, Choi YL, Lee JE, Nam SJ,
Yang JH, Park YH, Ahn JS and Im YH: Potential candidate biomarkers
for heterogeneity in triple-negative breast cancer (TNBC). Cancer
Chemother Pharmacol. 68:753–761. 2011. View Article : Google Scholar : PubMed/NCBI
|
|
4
|
He J, Yang J, Chen W, Wu H, Yuan Z, Wang
K, Li G, Sun J and Yu L: Molecular features of triple negative
breast cancer: Microarray evidence and further integrated analysis.
PLoS One. 10:e01298422015. View Article : Google Scholar : PubMed/NCBI
|
|
5
|
Anders CK and Carey LA: Biology,
metastatic patterns, and treatment of patients with triple-negative
breast cancer. Clin Breast Cancer. 9 Suppl 2:S73–S81. 2009.
View Article : Google Scholar : PubMed/NCBI
|
|
6
|
Petricoin EF III, Hackett JL, Lesko LJ,
Puri RK, Gutman SI, Chumakov K, Woodcock J, Feigal DW Jr, Zoon KC
and Sistare FD: Medical applications of microarray technologies: A
regulatory science perspective. Nat Genet. 32:S474–S479. 2002.
View Article : Google Scholar
|
|
7
|
Yang L, Wu X, Wang Y, Zhang K, Wu J, Yuan
YC, Deng X, Chen L, Kim CC, Lau S, et al: FZD7 has a critical role
in cell proliferation in triple negative breast cancer. Oncogene.
30:4437–4446. 2011. View Article : Google Scholar : PubMed/NCBI
|
|
8
|
Mathe A, Wong-Brown M, Morten B, Forbes
JF, Braye SG, Avery-Kiejda KA and Scott RJ: Novel genes associated
with lymph node metastasis in triple negative breast cancer. Sci
Rep. 5:158322015. View Article : Google Scholar : PubMed/NCBI
|
|
9
|
Wang Y, Zhang T, Kwiatkowski N, Abraham
BJ, Lee TI, Xie S, Yuzugullu H, Von T, Li H, Lin Z, et al:
CDK7-dependent transcriptional addiction in triple-negative breast
cancer. Cell. 163:174–186. 2015. View Article : Google Scholar : PubMed/NCBI
|
|
10
|
Abramovitz M, Barwick BG, Willis S, Young
B, Catzavelos C, Li Z, Kodani M, Tang W, Bouzyk M, Moreno CS, et
al: Molecular characterisation of formalin-fixed paraffin-embedded
(FFPE) breast tumour specimens using a custom 512-gene breast
cancer bead array-based platform. Br J Cancer. 105:1574–1581. 2011.
View Article : Google Scholar : PubMed/NCBI
|
|
11
|
Al-Ejeh F, Simpson PT, Sanus JM, Klein K,
Kalimutho M, Shi W, Miranda M, Kutasovic J, Raghavendra A, Madore
J, et al: Meta-analysis of the global gene expression profile of
triple-negative breast cancer identifies genes for the
prognostication and treatment of aggressive breast cancer.
Oncogenesis. 3:e1002014. View Article : Google Scholar : PubMed/NCBI
|
|
12
|
Tauber E, Miller-Fleming L, Mason RP, Kwan
W, Clapp J, Butler NJ, Outeiro TF, Muchowski PJ and Giorgini F:
Functional gene expression profiling in yeast implicates
translational dysfunction in mutant huntingtin toxicity. J Biol
Chem. 286:410–419. 2011. View Article : Google Scholar : PubMed/NCBI
|
|
13
|
Warnes GR, Bolker B, Bonebakker L,
Gentleman R, Huber W, Liaw A, Lumley T, Maechler M, Magnusson A,
Moeller S, et al: Package ‘gplots’: Various R programming tools for
plotting data. R package version 2. 2009.https://scholar.google.com/citations?view_op=view_citation&hl=en&user=o7GsfJwAAAAJ&citation_for_view=o7GsfJwAAAAJ:u-x6o8ySG0sC
|
|
14
|
Györffy B, Lanczky A, Eklund AC, Denkert
C, Budczies J, Li Q and Szallasi Z: An online survival analysis
tool to rapidly assess the effect of 22,277 genes on breast cancer
prognosis using microarray data of 1,809 patients. Breast Cancer
Res Treat. 123:725–731. 2010. View Article : Google Scholar : PubMed/NCBI
|
|
15
|
Xu Z, Zhou Y, Cao Y, Dinh TLA, Wan J and
Zhao M: Identification of candidate biomarkers and analysis of
prognostic values in ovarian cancer by integrated bioinformatics
analysis. Med Oncol. 33:1302016. View Article : Google Scholar : PubMed/NCBI
|
|
16
|
Arocho A, Chen B, Ladanyi M and Pan Q:
Validation of the 2-DeltaDeltaCt calculation as an alternate method
of data analysis for quantitative PCR of BCR-ABL P210 transcripts.
Diagn Mol Pathol. 15:56–61. 2006. View Article : Google Scholar : PubMed/NCBI
|
|
17
|
Paranjpe SS, Jacobi UG, van Heeringen SJ
and Veenstra GJ: A genome-wide survey of maternal and embryonic
transcripts during Xenopus tropicalis development. BMC Genomics.
14:7622013. View Article : Google Scholar : PubMed/NCBI
|
|
18
|
Karagoz K, Sinha R and Arga KY: Triple
negative breast cancer: A multi-omics network discovery strategy
for candidate targets and driving pathways. OMICS. 19:115–130.
2015. View Article : Google Scholar : PubMed/NCBI
|
|
19
|
Elsamany S and Abdullah S: Triple-negative
breast cancer: Future prospects in diagnosis and management. Med
Oncol. 31:8342014. View Article : Google Scholar : PubMed/NCBI
|
|
20
|
Legrier M-E, Bièche I, Gaston J, Beurdeley
A, Yvonnet V, Déas O, Thuleau A, Château-Joubert S, Servely JL,
Vacher S, et al: Activation of IFN/STAT1 signalling predicts
response to chemotherapy in oestrogen receptor-negative breast
cancer. Br J Cancer. 114:177–187. 2016. View Article : Google Scholar : PubMed/NCBI
|
|
21
|
Nagelkerke A, Bussink J, Mujcic H, Wouters
BG, Lehmann S, Sweep FC and Span PN: Hypoxia stimulates migration
of breast cancer cells via the PERK/ATF4/LAMP3-arm of the unfolded
protein response. Breast Cancer Res. 15:R22013. View Article : Google Scholar : PubMed/NCBI
|
|
22
|
Stayrook KR, Mack JK, Cerabona D, Edwards
DF, Bui HH, Niewolna M, Fournier PG, Mohammad KS, Waning DL and
Guise TA: TGFβ-mediated induction of SphK1 as a potential
determinant in human MDA-MB-231 breast cancer cell bone metastasis.
Bonekey Rep. 4:7192015. View Article : Google Scholar : PubMed/NCBI
|
|
23
|
Frangou C, Li Y-W, Shen H, Yang N, Wilson
KE, Blijlevens M, Guo J, Nowak NJ and Zhang J: Molecular profiling
and computational network analysis of TAZ-mediated mammary
tumorigenesis identifies actionable therapeutic targets.
Oncotarget. 5:12166–12176. 2014. View Article : Google Scholar : PubMed/NCBI
|
|
24
|
Jiang J, Liu W, Guo X, Zhang R, Zhi Q, Ji
J, Zhang J, Chen X, Li J, Zhang J, et al: IRX1 influences
peritoneal spreading and metastasis via inhibiting BDKRB2-dependent
neovascularization on gastric cancer. Oncogene. 30:4498–4508. 2011.
View Article : Google Scholar : PubMed/NCBI
|
|
25
|
Winslow S, Leandersson K, Edsjö A and
Larsson C: Prognostic stromal gene signatures in breast cancer.
Breast Cancer Res. 17:232015. View Article : Google Scholar : PubMed/NCBI
|
|
26
|
Watkins J, Weekes D, Shah V, Gazinska P,
Joshi S, Sidhu B, Gillett C, Pinder S, Vanoli F, Jasin M, et al:
Genomic complexity profiling reveals that HORMAD1 overexpression
contributes to homologous recombination deficiency in
triple-negative breast cancers. Cancer Discov. 5:488–505. 2015.
View Article : Google Scholar : PubMed/NCBI
|
|
27
|
Komatsu M, Yoshimaru T, Matsuo T, Kiyotani
K, Miyoshi Y, Tanahashi T, Rokutan K, Yamaguchi R, Saito A, Imoto
S, et al: Molecular features of triple-negative breast cancer cells
by genome-wide gene expression profiling analysis. Int J Oncol.
42:478–506. 2013. View Article : Google Scholar : PubMed/NCBI
|
|
28
|
Chakrabarti R, Wei Y, Romano RA, DeCoste
C, Kang Y and Sinha S: Elf5 regulates mammary gland stem/progenitor
cell fate by influencing notch signaling. Stem Cells. 30:1496–1508.
2012. View Article : Google Scholar : PubMed/NCBI
|
|
29
|
Tordai A, Wang B, Andre F, Liedtke C,
Symmans W, Esteva F and Pusztai L: Screening for expression of
novel marker proteins for triple negative breast cancer in breast
cancer cell lines. Cancer Res. Suppl 9:67:19782007.http://cancerres.aacrjournals.org/content/67/9_Supplement/1978
|
|
30
|
Daniele V, Pasquale S, Frank J, Trerotola
M, Giudetti A, Capobianco L, Tinelli A, Bellomo C, Fournier I,
Gaballo A, et al: Translating epithelial mesenchymal transition
markers into the clinic: Novel insights from proteomics. EuPA Open
Proteom. 10:31–41. 2016.http://www.sciencedirect.com/science/article/pii/S2212968516300034
View Article : Google Scholar
|
|
31
|
He J, Peng R, Yuan Z, Wang S, Peng J, Lin
G, Jiang X and Qin T: Prognostic value of androgen receptor
expression in operable triple-negative breast cancer: A
retrospective analysis based on a tissue microarray. Med Oncol.
29:406–410. 2012. View Article : Google Scholar : PubMed/NCBI
|
|
32
|
Anders C, Deal AM, Abramson V, Liu MC,
Storniolo AM, Carpenter JT, Puhalla S, Nanda R, Melhem-Bertrandt A,
Lin NU, et al: TBCRC 018: Phase II study of iniparib in combination
with irinotecan to treat progressive triple negative breast cancer
brain metastases. Breast Cancer Res Treat. 146:557–566. 2014.
View Article : Google Scholar : PubMed/NCBI
|
|
33
|
Jang P, Holleran T, Burns M, Gebizlioglu K
and Governale A: Identifying gene signatures associated with cancer
stem cells and drug resistance from triple negative breast cancer
cells after gene targeting treatment. Austin J Biomed Eng.
1:10182014.
|
|
34
|
Garczyk S, von Stillfried S, Antonopoulos
W, Hartmann A, Schrauder MG, Fasching PA, Anzeneder T, Tannapfel A,
Ergönenc Y, Knüchel R, et al: AGR3 in breast cancer: Prognostic
impact and suitable serum-based biomarker for early cancer
detection. PLoS One. 10:e01221062015. View Article : Google Scholar : PubMed/NCBI
|
|
35
|
Chen C, Zhou Z, Ross JS, Zhou W and Dong
JT: The amplified WWP1 gene is a potential molecular target in
breast cancer. Int J Cancer. 121:80–87. 2007. View Article : Google Scholar : PubMed/NCBI
|