Introduction
Acute myeloid leukemia (AML) is a complex and common
myeloid malignancy, which is accompanied by the abnormal
proliferation and differentiation of bone marrow precursor cells in
the hematopoietic system (1,2). At
the present stage, older adults with this disease have a worse
prognosis (3). In addition,
although certain patients may attain complete remission, it is easy
to relapse (4). In recent years,
second generation sequencing technology has been widely used in the
clinic to aid diagnosis (5). For
example, NPM1 and CEBPA mutations are favorable for clinical
prognosis, but certain gene mutations are associated with poor
outcomes for patients with AML, such as ACTN, TET2 and RUNX1
(5–7). However, it is essential to identify
novel and effective targets for clinical treatment. To further
investigate the mechanism underlying AML development, it is
essential to better understand this disease and thus find new
therapeutic targets.
Immune checkpoint blockades, such as cytotoxic
T-lymphocyte-associated protein 4 (CTLA4) and programmed death 1
(PD-1), have been widely used for different types of cancer
(8). Programmed cell death 1 ligand
1 (PD-L1) is one of the ligands of PD-1, binding to PD-1 to inhibit
activated T-cell function (9). A
large body of evidence has demonstrated that PD-L1 was positively
associated with immune system suppression and tumor progression.
High expression of PD-L1 was significantly associated with lower
tumor-associated antigen distribution and clinical recurrence in
patients with prostate cancer (10). PD-L1 expression in tumor cells could
protect those cells from interferon (IFN) impairment, and the IFN
signaling pathway was inhibited by PD-L1 (11). Bertucci et al also
demonstrated that metastatic relapse in patients with soft-tissue
sarcomas were strongly associated with PD-L1 expression (12). Following treatment with IFN-γ, PDL1
expression was upregulated in myeloid leukemia cell lines via the
STAT3 pathway (13). In symptomatic
multiple myeloma, PD-L1 expression in plasma cells was closely
associated with cancer progression (14). PD-L1 had been used as a therapeutic
target for various different types of cancer treatment (15). Therefore, it is essential to
research the impact of PD-L1 expression in patients with AML.
In recent years, tumor cell metabolism has been a
popular topic for research, with several hallmarks including
increasing the uptake of glucose, amino acids and nitrogen,
alteration of metabolite-associated genes, and the interaction
between metabolites and the tumor microenvironment (16). Mitochondrial ROS in primary AML
cells induced by drugs could be inhibited by SIRT3, a SOD2
deacetylase, which could also protect AML cells from
chemokine-induced apoptosis (17).
AML cells exhibited high metabolism of the amino acid glutamine for
longer survival, and inhibiting this pathway induced AML cell
apoptosis (18). Although the
cytoplasmic tail of PD-L1 is too short to find evident signaling
motifs, certain studies have still reported that PD-L1 could induce
cell signaling activation in tumor cells, such as signaling from
PD-1 toward PD-L1 (19).
PD-L1+ tumor cells resisted apoptosis induced by the
Fas-Fas ligand pathway or cytokines secreted by T cells (20). It has been reported that
PD-L1-expressing tumor cells triggered cell intrinsic glycolysis
through the mTOR signaling pathway, which could enhance tumor
growth and progression (21).
Currently, it is unclear whether PD-L1 expressed in AML cells
enhances cell glycolysis or inhibits tumor cell apoptosis.
Poulain et al demonstrated that AML cells
exhibited high uptake of glucose, strong glycolysis ability and
overactivated mTOR signaling (22).
The TP53-induced glycolysis and apoptosis regulator (TIGAR) was
highly expressed in patients with cytogenetically normal AML, and
knockdown of TIGAR promoted tumor cell apoptosis and enhanced the
sensitivity of tumor cells to glycolysis inhibitor (23). Cascone et al demonstrated
that glycolysis-associated genes included HK2, LDHA, ALDOA, ALDOC,
ENO2 and PGK1 (24). It has also
been revealed that Glut1, associated with glycolysis, was regulated
by the PI3K/Akt/mTOR signaling pathway (19). Despite glycolysis having been
demonstrated in AML cells, the effects of PD-L1 on glycolysis in
patients with AML remain largely unknown. The present study
primarily investigated how PD-L1 regulates tumor cell glycolysis.
First, the present study collected AML patient samples and revealed
that PD-L1 was positively correlated with glycolysis-associated
genes (HK2, PFKM, ALDOA, PGK1, PDK1 and LDHA). Overexpressed PD-L1
in AML cell line MOLM-13 significantly upregulated the expression
of glycolysis-associated genes via the AKT/mTOR signaling pathway,
and downregulated tumor cell apoptosis in vitro, indicating
that PD-L1 could regulate tumor cell metabolism and proliferation
without PD-1 existence.
Materials and methods
Patients and ethical statement
The present study included 90 patients (52 males and
38 females; age range, 14–81 years) that had been newly diagnosed
with AML without any other disease from the First Affiliated
Hospital of Zhengzhou University during January 2016 and May 2019.
All patients provided written informed consent. Ethical approval
was obtained from the Human Research Ethics Committee (First
Affiliated Hospital of Zhengzhou University, China). The database
GEPIA (http://gepia.cancer-pku.cn/) was used
for survival analysis and correlation analysis in TCGA database of
AML.
RNA extraction
Bone marrow mononuclear cells (BMMCs) were obtained
from patients and healthy donors through density gradient
centrifugation. BMMCs were washed with phosphate-buffered solution
(PBS) two times and 1 ml TRIzol (Takara Bio, Inc.) was added.
Chloroform was added to the TRIzol and mixed immediately. After 10
min, BMMCs were centrifuged for 10 min at 13,500 × g. The upper
transparent supernatant was isolated and mixed with isopropanol in
new tubes without RNase. This mixture was then centrifuged for 10
min at 13,500 × g. The white sediment was the separated RNA. A
total of 75% absolute ethyl alcohol were used to wash the RNA
twice. RNAs were stored in an ultra-low temperature freezer.
Synthesis of cDNA and real time PCR
(RT-PCR)
cDNA was synthesized using a PrimeScript RT reagent
kit and a gDNA Eraser kit (Perfect Real Time; Takara Bio, Inc.)
according to the manufacturer's protocol. In general, 1 µg RNA was
used for the cDNA synthesis. An equal amount of cDNA was used as
templates for RT-PCR to detect gene expression. The reaction system
included 2 µl diluted cDNA, 10 µl SYBR Premix Ex Taq (Takara Bio,
Inc.) and 1 µM primer forward and reverse. Finally, water was added
to reach a final volume of 20 µl. Primers used for PCR were
synthesized by Sangon Biotech (Shanghai) Co., Ltd., and their
sequences are presented in Table
S1. The thermocycling conditions for each reaction included an
initial hold at 95°C for 30 sec, followed by 40 denaturation cycles
at 95°C for 5 sec and annealing/extension at 60°C for 30 sec. CFX96
Touch Real-Time PCR Detection System (Bio-Rad Laboratories, Inc.)
was used for the RT-PCR amplification. Finally, the relative level
of each gene expression was calculated using the 2−ΔΔCq
method (25).
Cell culture, lentivirus package and
infection
AML tumor cell lines HL-60 and KG-1a (American Type
Culture Collection) were cultured in Iscove's Modified Dulbecco's
Medium (Thermo Fisher Scientific, Inc.) with 10% fetal bovine serum
(FBS; Thermo Fisher Scientific, Inc.) at 37°C in an incubator with
5% CO2. MOLM-13 and THP1 cells lines were cultured in
RPMI-1640 medium (Thermo Fisher Scientific, Inc.) with 10% FBS at
37°C in an incubator with 5% CO2.
To induce overexpression and knockdown of PD-L1 in
cells, a FUA-CMSZ-GFP vector containing PD-L1 full length, and
GV493-GFP vector containing PD-L1 sh1/sh2 sequences were
constructed. An empty vector served as the negative control. 293T
cells were cultured in 6-well plates to transfect PD-L1
overexpressed (PD-L1-OV) vector or PD-L1-sh1/2 vector with package
vector using Lipofectamine™ 3000 Transfection reagent (Thermo
Fisher Scientific, Inc.) according to the manufacturer's protocol.
Lentiviruses were obtained after 3–7 days and stored in an
ultra-low temperature freezer for follow-up experiments. Lentivirus
of PD-L1-OV or PD-L1-sh1/2 were also used to infect cell lines
MOLM-13 and THP1 using Lipofectamine™ 3000.
Protein extraction and western
blotting
AML cell lines MOLM-13 or THP1 were lysed with RIPA
lysis buffer containing 1 mM PMSF (both from Beyotime Institute of
Biotechnology). BCA assay method was used to detected the
concentration of protein. Proteins (30 µg per 20 µl) were separated
via SDS-PAGE (10% gel) at 80 V for 2 h, and then transferred to
polyvinylidene fluoride membranes (Merck Millipore) at 200 mA for 2
h. 10% skim milk powder were incubated with protein at room
temperature for 2 h. The antibodies of glycolysis-associated
proteins HK2 (product code ab37593; dilution 1:500) and LDHA
(product code ab125683; dilution 1:1,000; both from Abcam), PD-L1
antibody (product no. 13684; dilution 1:1,000; Cell Signaling
Technology, Inc.), HIF-1α antibody (product code H1α67; dilution
1:1,000; Abcam), AKT (catalog no. 60203-2-lg; dilution 1:2,000;
ProteinTech Group, Inc.)/p-AKT antibody (product code ab78403;
dilution 1:2,000; Abcam), S6 (product no. 2217; dilution
1:1,000;)/pS6 antibody (product no. 4858; dilution 1:2,000; both
from Cell Signaling Technology, Inc.) and β-actin (product no.
3700; dilution 1:4,000; Cell Signaling Technology, Inc.) were used
as primary antibodies at 4°C overnight. In addition, the secondary
antibodies included anti-mouse IgG (product code ab6728; dilution
1:5,000) and anti-rabbit IgG (product code ab6721; dilution
1:5,000; both from Abcam) which were incubated with proteins at
room temperature for 1 h following incubation of the primary
antibodies. Enhanced chemiluminescence (ECL) reaction (Thermo
Fisher Scientific, Inc.) was used to detect protein bands and
staining intensity was analyzed with software AI600 control
(version 1.2.0; GE Ηealthcare, Inc.).
Cell apoptosis, proliferation and cell
cycle detection
MOLM-13 (Blank, NC, PD-L1-OV; 1×10⁶) and
THP1 (NC, PD-L1-sh1/sh2; 1×10⁶) were obtained from
6-well plates, and the cell cycle and apoptosis rate were detected
using an Annexin V-FITC/PI Apoptosis Detection kit (Beijing
Solarbio Science & Technology Co., Ltd.) and a Cell Cycle and
Apoptosis Analysis Kit (Beyotime Institute of Biotechnology),
respectively. BD FACSCanto™ II (BD Biosciences) was used to analyze
data. In addition, the MOLM-13 (Blank, NC, PD-L1-OV;
1×10⁶) cell line was cultured in 96-well plates for 1,
2, 3, 4 and 5 days to detect cell proliferation using a CCK-8
assay.
Glucose consumption assay
Tumor cells (Blank, NC and PD-L1-OV) were cultured
in 6-well plates for 24 h, and the supernatants were collected for
testing the glucose consumption with a Glucose Assay kit
(Sigma-Aldrich; Merck KGaA).
Metabolism assay
The extracellular acidification rate (ECAR) was
measured using a Seahorse XF Glycolysis Stress Test kit and
Seahorse XF96 Extracellular Flux Analyzers (both from Agilent
Technologies, inc.). The data were analyzed and exported from Wave
software (version 2.3.0.19; Agilent).
Immunohistochemistry (IHC)
staining
Tumor tissues from mice were fixed with 4%
paraformaldehyde at room temperature for 30 min and embedded in
paraffin for protein detection. First, paraffin-embedded tumor
tissues were dewaxed at 65°C for 30–60 min. Citrate buffer was used
for antigen retrieval using boiling water for 20 min. Nonspecific
blockage solution and 3% hydrogen peroxide was added on the
paraffin-embedded tumor tissues for blocking endogenous peroxidase
and nonspecific antigen after the tissues cooled to the room
temperature. Then, antibodies of glycolysis-associated protein LDHA
(product code ab125683) and Ki67 (product code ab15580; both from
Abcam) were stained at 4°C overnight. The next day, horseradish
peroxidase-labeled rabbit anti-mouse (product code ab6728; dilution
1:200)/goat anti-rabbit (product no. 2217; dilution 1:500; both
from Abcam) secondary antibody was added for the interaction with
3,3′-diaminobenzidine. Nuclear staining was performed using
hematoxylin. Finally, paraffin-embedded tumor tissues were
dehydrated and mounted by Permount TM Mounting medium.
Mouse experiment
The 5–6-week-old female NOD/SCID mice (NOD.
CB17-Prkdcscid/NcrCrl) were obtained from Beijing Vital River
Laboratory Animal Technology Co., Ltd. The formation of tumors were
carried out as described in a previous atudy (26). The mice were randomly assigned into
two groups [NC (n=5) and PD-L1-OV (n=5)]. The mice were euthanized
with 1% pentobarbital sodium (150 mg/kg of body weight) by i.p.
injection after the maximum diameter exceeded 2 cm during tumor
growth. A density of 5×10⁶ PD-L1-OV MOLM-13 and NC
MOLM-13 cells were re-suspended into 100 µl PBS and injected
subcutaneously into the right flank of each mouse. The tumor volume
and mouse weight were measured at 8, 13 and 18 days. Eighteen days
after tumor formation, the mice with tumors were sacrificed in
general in 150 mg/kg of body weight with 1% pentobarbital sodium
through intraperitoneal injection and the animals were considered
dead upon cardiac arrest. The mouse experiments were approved by
the Institutional Animal Care and Use Committee of the First
Affiliated Hospital of Zhengzhou University.
Statistical analysis
Analysis of the data was performed using SPSS
Statistics 16.0 (SPSS, Inc.) and GraphPad Prism software 7.0
(GraphPad Software, Inc.). P<0.05 was considered to indicate a
statistically significant result. The results are expressed as the
mean ± standard error. Statistical significance was determined via
one-way ANOVA, two-way ANOVA, Tukey's multiple comparisons test or
unpaired Student's t-test. Pearson's χ2 test was used to
analyze the relationships between PD-L1 and glycolysis-associated
genes.
Results
PD-L1 expression is associated with
glycolysis and prognosis in patients with AML
A total of 90 patient samples, that had been newly
diagnosed with AML, were collected and divided into two groups
according to the expression of PD-L1. The clinical characteristics
of these patients are presented in Table I. The present study first analyzed
the association between PD-L1 and prognosis in the public database
GEPIA (http://gepia.cancer-pku.cn/) based on
cut-off-high (70%) and cut-off-low (30%) expression (27). Samples with an expression level
>70% were considered as the high-expression cohort; conversely,
samples with an expression level <30% were considered as the
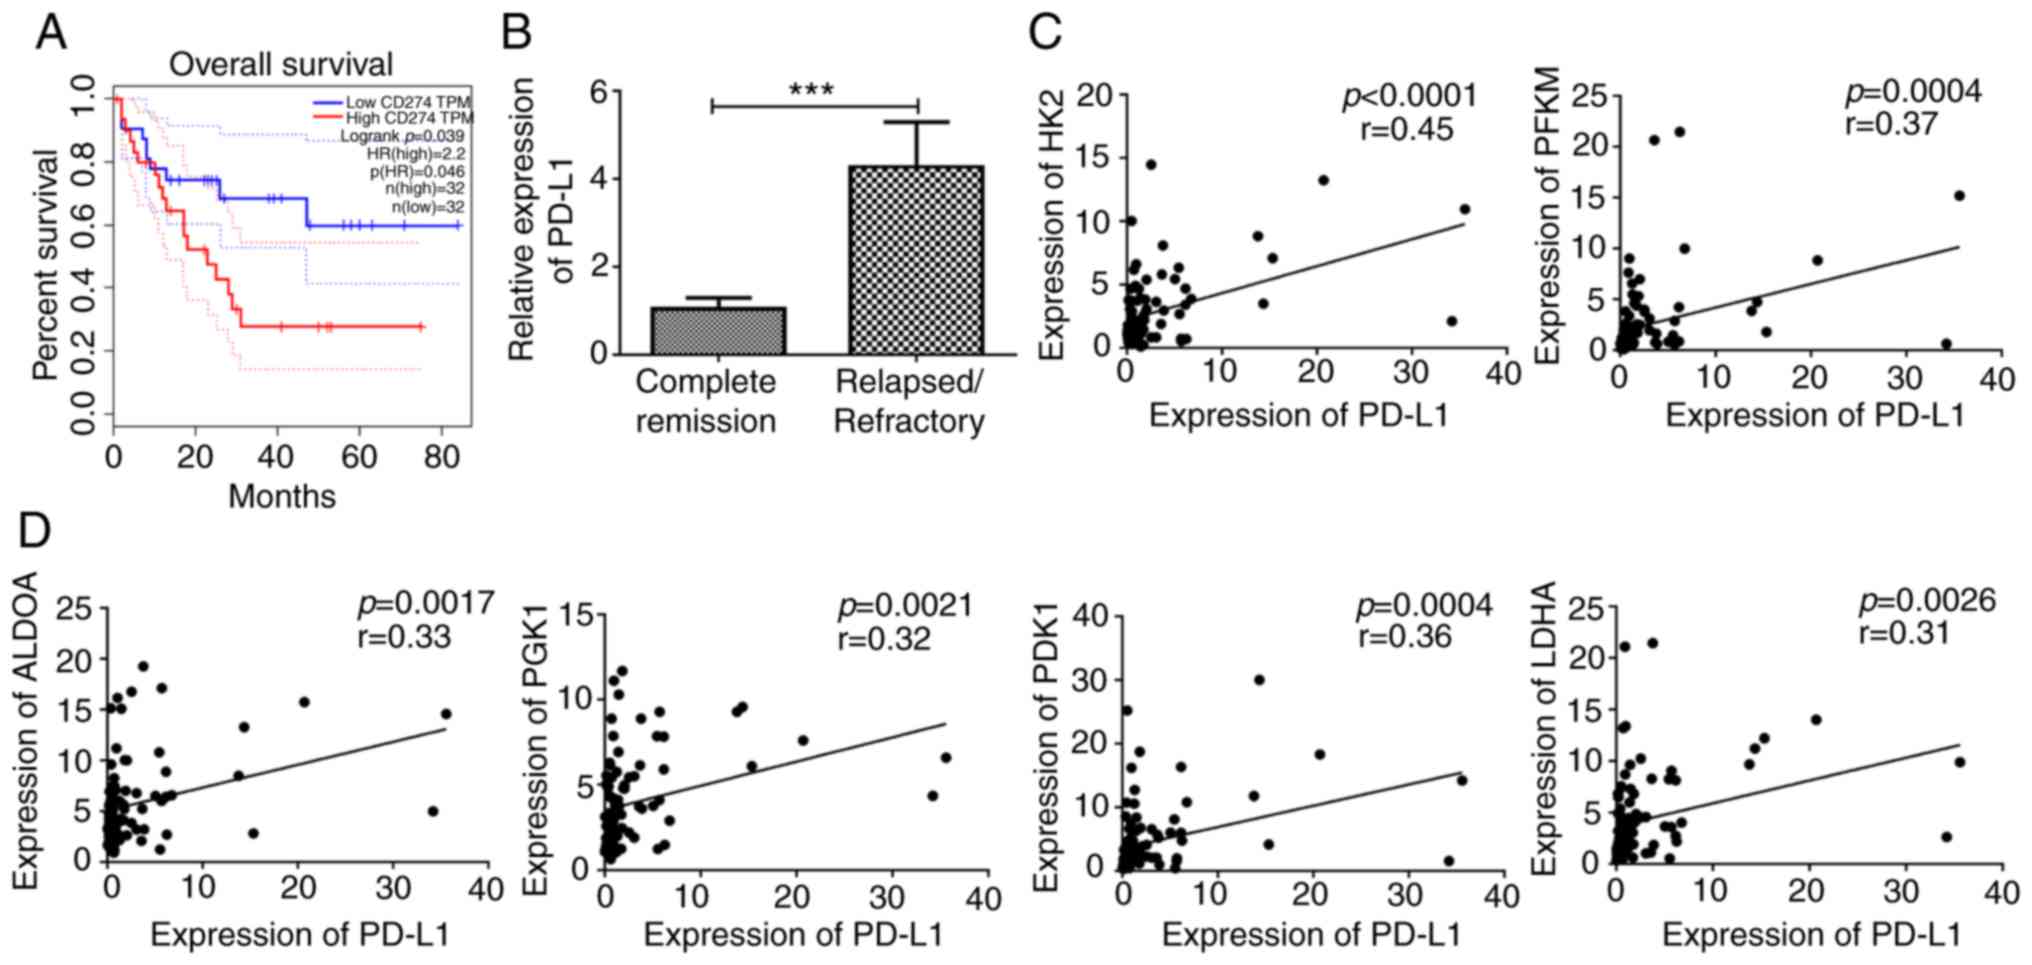
low-expression cohort. The results revealed that high PD-L1
expression predicted poor outcome in patients with AML (Fig. 1A). The 90 patients with AML were
classified into a complete remission group and a relapsed or
refractory group according to the clinical therapy responses. PD-L1
expression was decreased in patients with AML with complete
remission compared with that in patients with relapsed or
refractory AML (Fig. 1B), which was
consistent with the results in the public database. Several studies
have indicated that PD-L1 could promote glycolysis in other types
of cancer (19). The present study
observed a moderately positive correlation of PD-L1 expression with
rate-limiting enzymes (HK2 and PFKM) in glycolysis (Fig. 1C). However, PD-L1 also exhibited a
moderately positive correlation with other glycolysis-associated
enzymes, including ALDOA, PGK1, PDK1 and LDHA (Fig. 1D). It was demonstrated that PD-L1
was correlated with PDK1 and PFKM in GEPIA (Fig. S1A and B).
 | Table I.Clinical characteristics in AML
patients. |
Table I.
Clinical characteristics in AML
patients.
|
|
| PD-L1
expression |
|---|
|
|
|
|
|---|
|
Characteristics | Total | High | Low |
|---|
| Age/years, median
(range) | 43.5
(14–81) | 48
(14–76) | 42
(16–81) |
| Age group/n
(%) |
|
|
|
| ≥60
years | 16
(17.8) | 9
(10) | 10 (11.1) |
| <60
years | 74
(82.2) | 36 (40) | 35 (38.9) |
| Sex/n (%) |
|
|
|
|
Male | 52
(57.8) | 28
(62.2) | 24 (53.3) |
|
Female | 38
(42.2) | 17
(37.8) | 21 (46.7) |
| WBC/ ×
109/l, median (range) | 17.1
(1.1–350.3) | 13.6
(1.1–350) | 39.4
(1.34–229) |
| BM blasts/%, median
(range) | 64.6 (20–99.6) | 57.6
(22.3–99.6) | 66
(20–94.8) |
| PB blasts/%, median
(range) | 38.5 (0–98) | 50
(0–97) | 38 (0–98) |
| FAB subtypes/n
(%) |
|
|
|
| M0 | 3
(3.3) | 2
(4.4) | 1 (2.2) |
| M1 | 3
(3.3) | 2
(4.4) | 1 (2.2) |
| M2 | 43
(47.8) | 20
(44.4) | 23 (51.1) |
| M4 | 13
(14.4) | 6
(13.3) | 7
(15.6) |
| M5 | 25
(27.8) | 13
(28.9) | 12 (26.7) |
| M6 | 2
(2.2) | 2
(4.4) | 0 (0) |
| M7 | 1
(1.1) | 0 (0) | 1 (2.2) |
| Risk/n (%) |
|
|
|
|
Good | 14
(15.6) | 3
(6.7) | 11 (24.4) |
|
Intermediate | 47
(52.2) | 26
(57.8) | 21 (46.7) |
|
Poor | 28
(31.1) | 19
(42.2) | 9 (20) |
| Cytogenetics/n
(%) |
|
|
|
|
Normal | 42
(46.7) | 19
(42.2) | 23 (51.1) |
|
Complex | 6
(6.7) | 1
(2.2) | 5
(11.1) |
|
inv(16)/CBFβ-MYH11 | 9
(10) | 2
(4.4) | 7
(15.6) |
|
t(8;21)/RUNX1-RUNX1T1 | 9
(10) | 2
(4.4) | 7
(15.6) |
|
11q23/MLL | 2
(2.2) | 2
(4.4) | 0 (0) |
|
-7/7q- | 5
(5.6) | 3
(6.7) | 2 (4.4) |
|
t(9;22)/BCR-ABL1 | 2
(2.2) | 2
(4.4) | 3 (6.7) |
|
Others | 15
(16.7) | 9
(20) | 6
(13.3) |
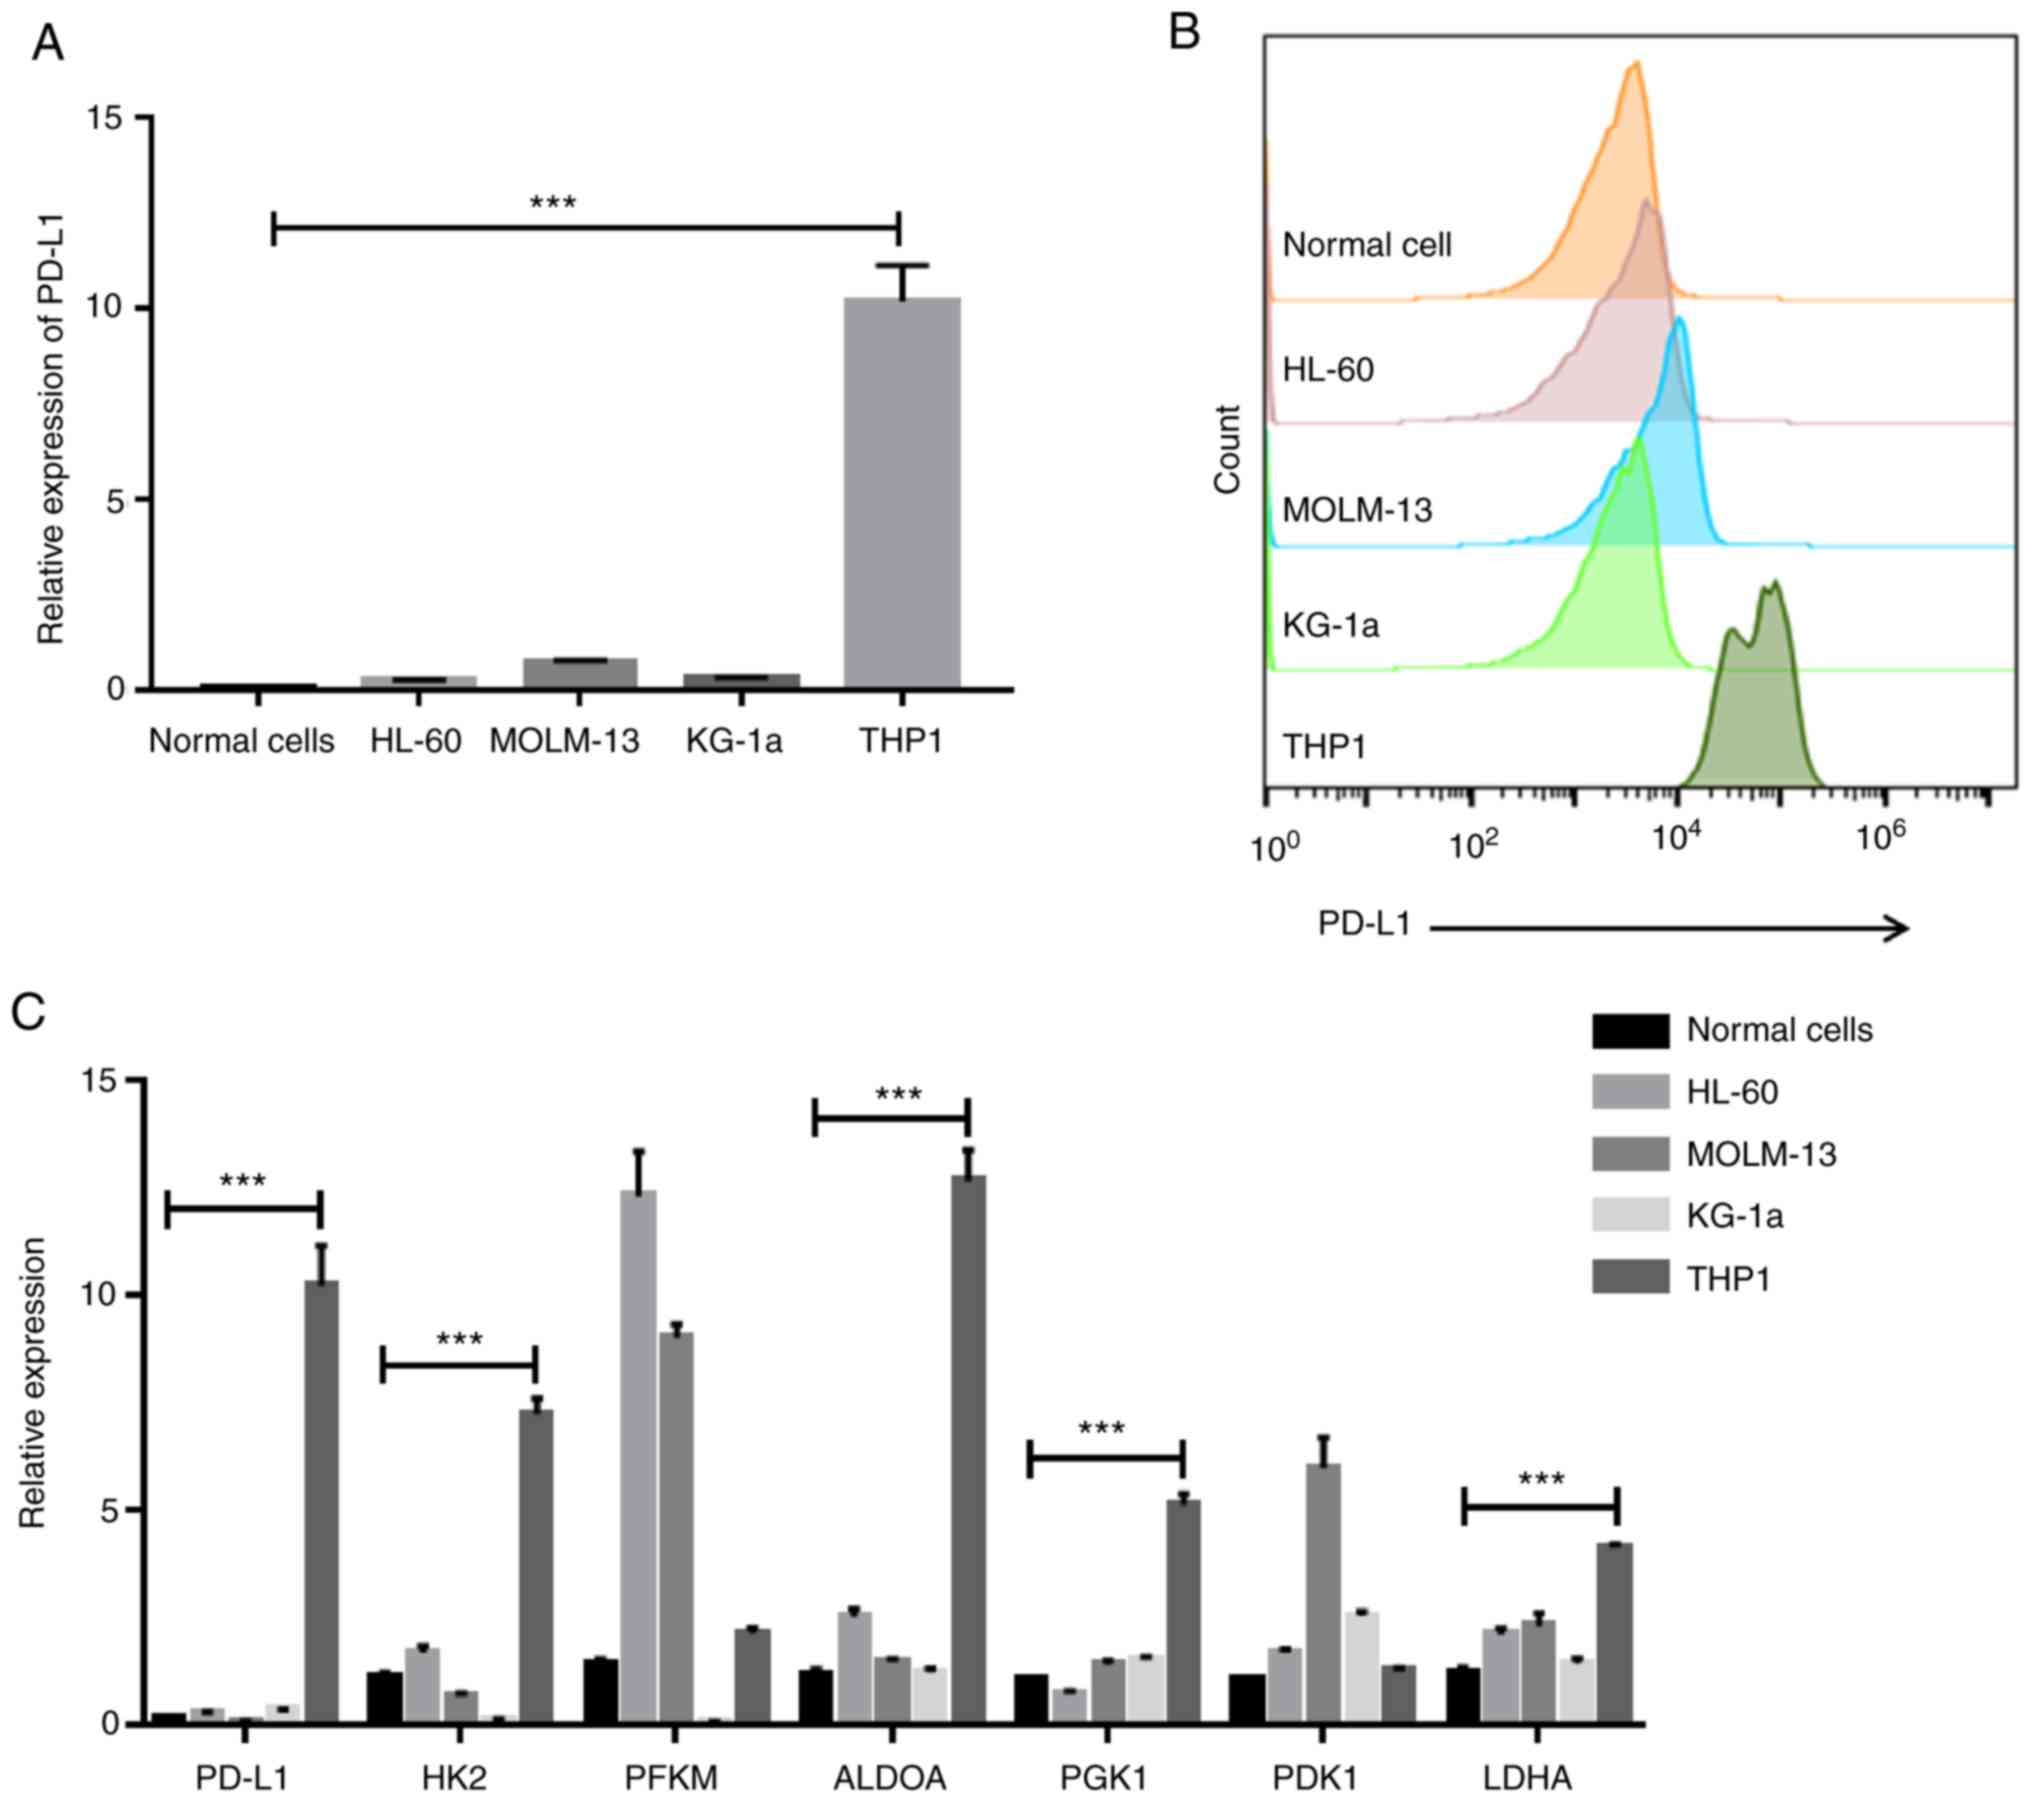
High PD-L1 expression in AML cell
lines exhibits strong glycolysis ability
In order to better investigate the effect of PD-L1
expression, the present study selected four AML cell lines, HL-60,
MOLM-13, KG-1a and THP1. First, the present study detected PD-L1
expression through RT-PCR and flow cytometry. The THP1 cell line
exhibited the highest PD-L1 expression at both the mRNA level
(F=107.5) and protein level (Fig. 2A
and B). The present study also revealed that the expression
levels of HK2 (F=254.5), ALDOA (F=213.5), PGK1 (F=189.2) and LDHA
(F=52.3) were highly expressed in the PD-L1-high expressed cell
line, THP1, indicating that PD-L1 may control cell glycolysis
(Fig. 2C).
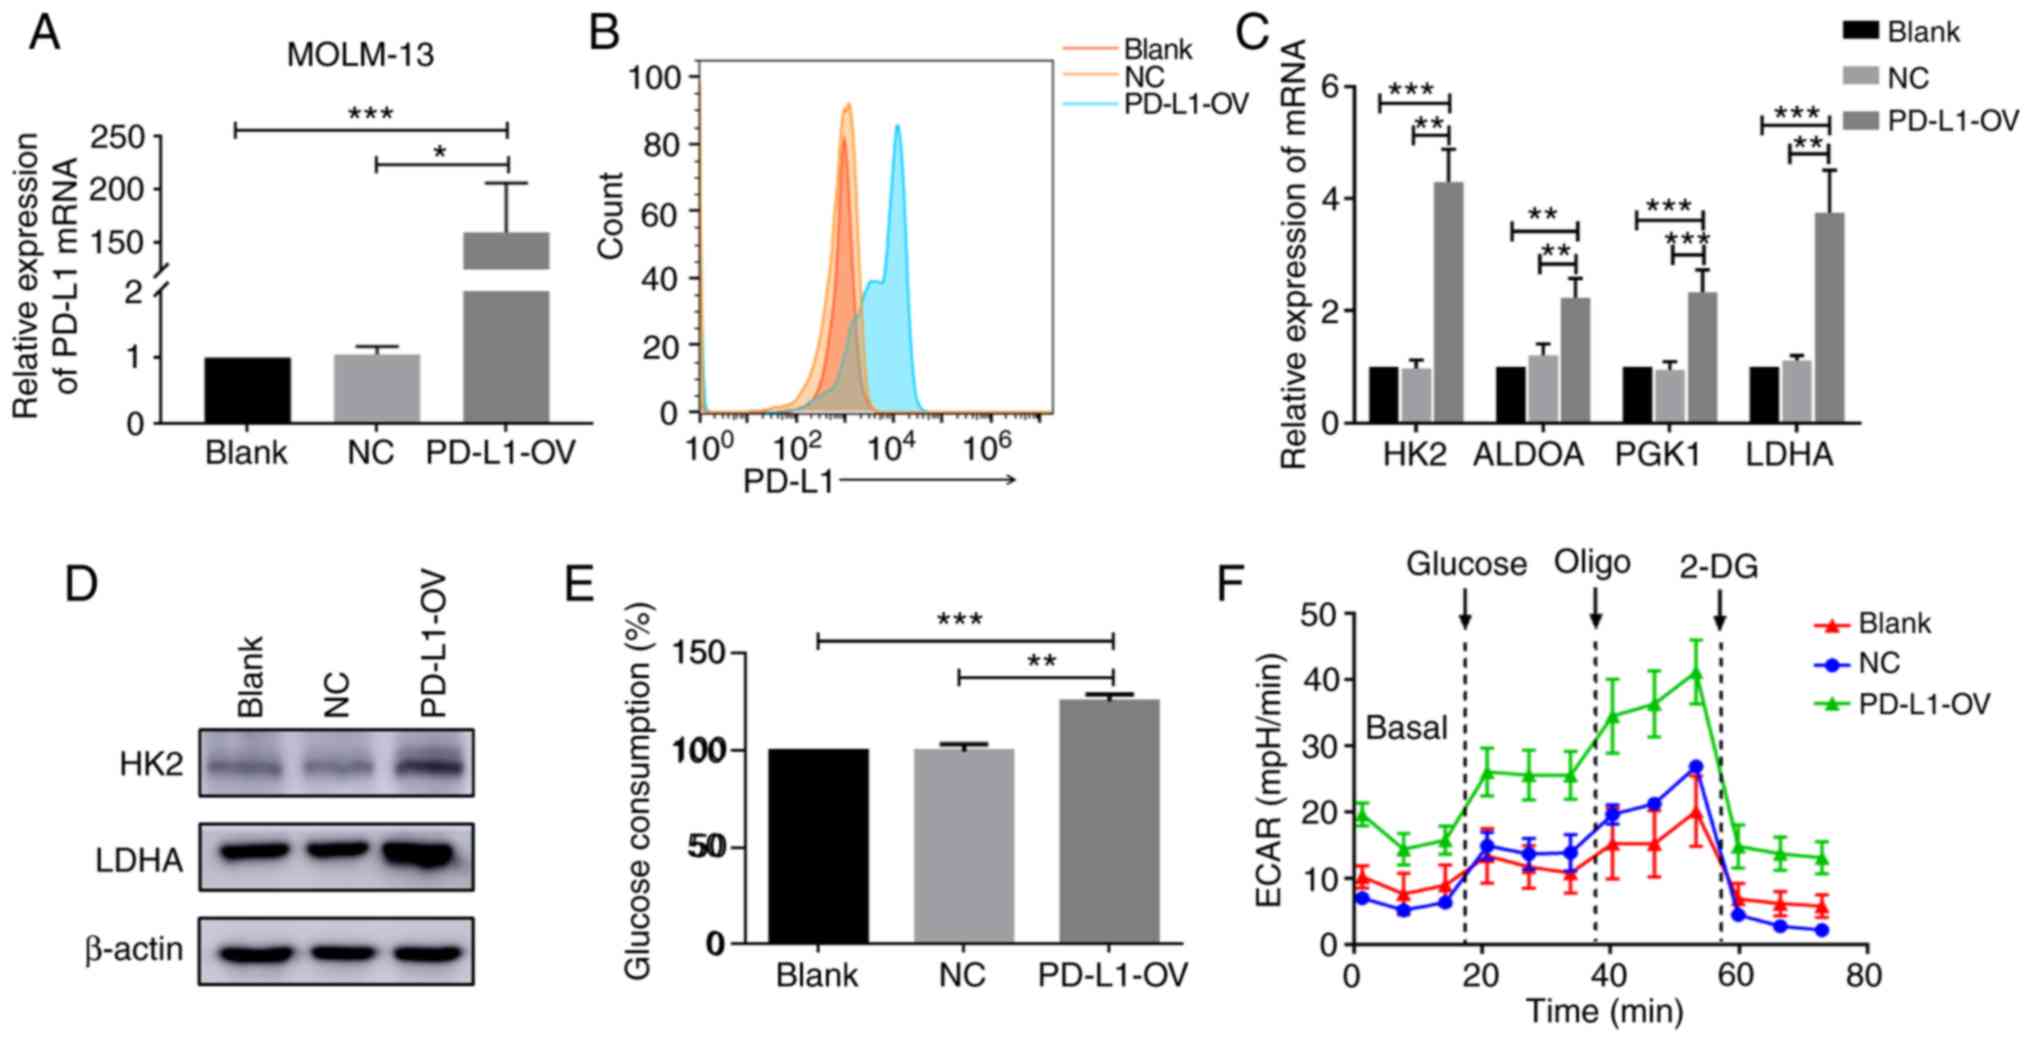
Overexpressed PD-L1 enhances cell
glycolysis
In the present study, the PD-L1-OV MOLM-13 cell line
was first obtained by infection. PD-L1 was successfully expressed
in the PD-L1-OV MOLM-13 cell line (F=36) (Fig. 3A and B). Glycolysis-associated genes
of PD-L1-OV MOLM-13 were assessed. HK2 (F=91.04), ALDOA (F=24.53),
PGK1 (F=31.16) and LDHA (F=37.11) were highly expressed at the mRNA
level in PD-L1-OV MOLM-13 cells compared to the blank and NC groups
(Fig. 3C). HK2 is an important
rate-limiting enzyme in glycolysis and LDHA mainly catalyzes lactic
acid. To further confirm the change of HK2 and LDHA, the present
study determined that the protein level of HK2 and LDHA was
significantly increased in PD-L1-OV MOLM-13 cells (Fig. 3D). Due to the changes in these
enzymes, the glucose consumption of PD-L1-OV MOLM-13 cells was
enhanced (F=69.29) (Fig. 3E). In
addition, PD-L1-OV MOLM-13 cells exhibited a higher level of ECAR,
which could represent the glycolysis (Fig. 3F). PD-L1 expression of THP1 was
knocked-down (F=794.9) (Fig. S2A and
B), with a decrease of glycolysis-associated enzymes (HK2,
F=135.9; ALDOA, F=361.8; PGK1, F=58.73; LDHA, F=89.63) (Fig. S2C and D).
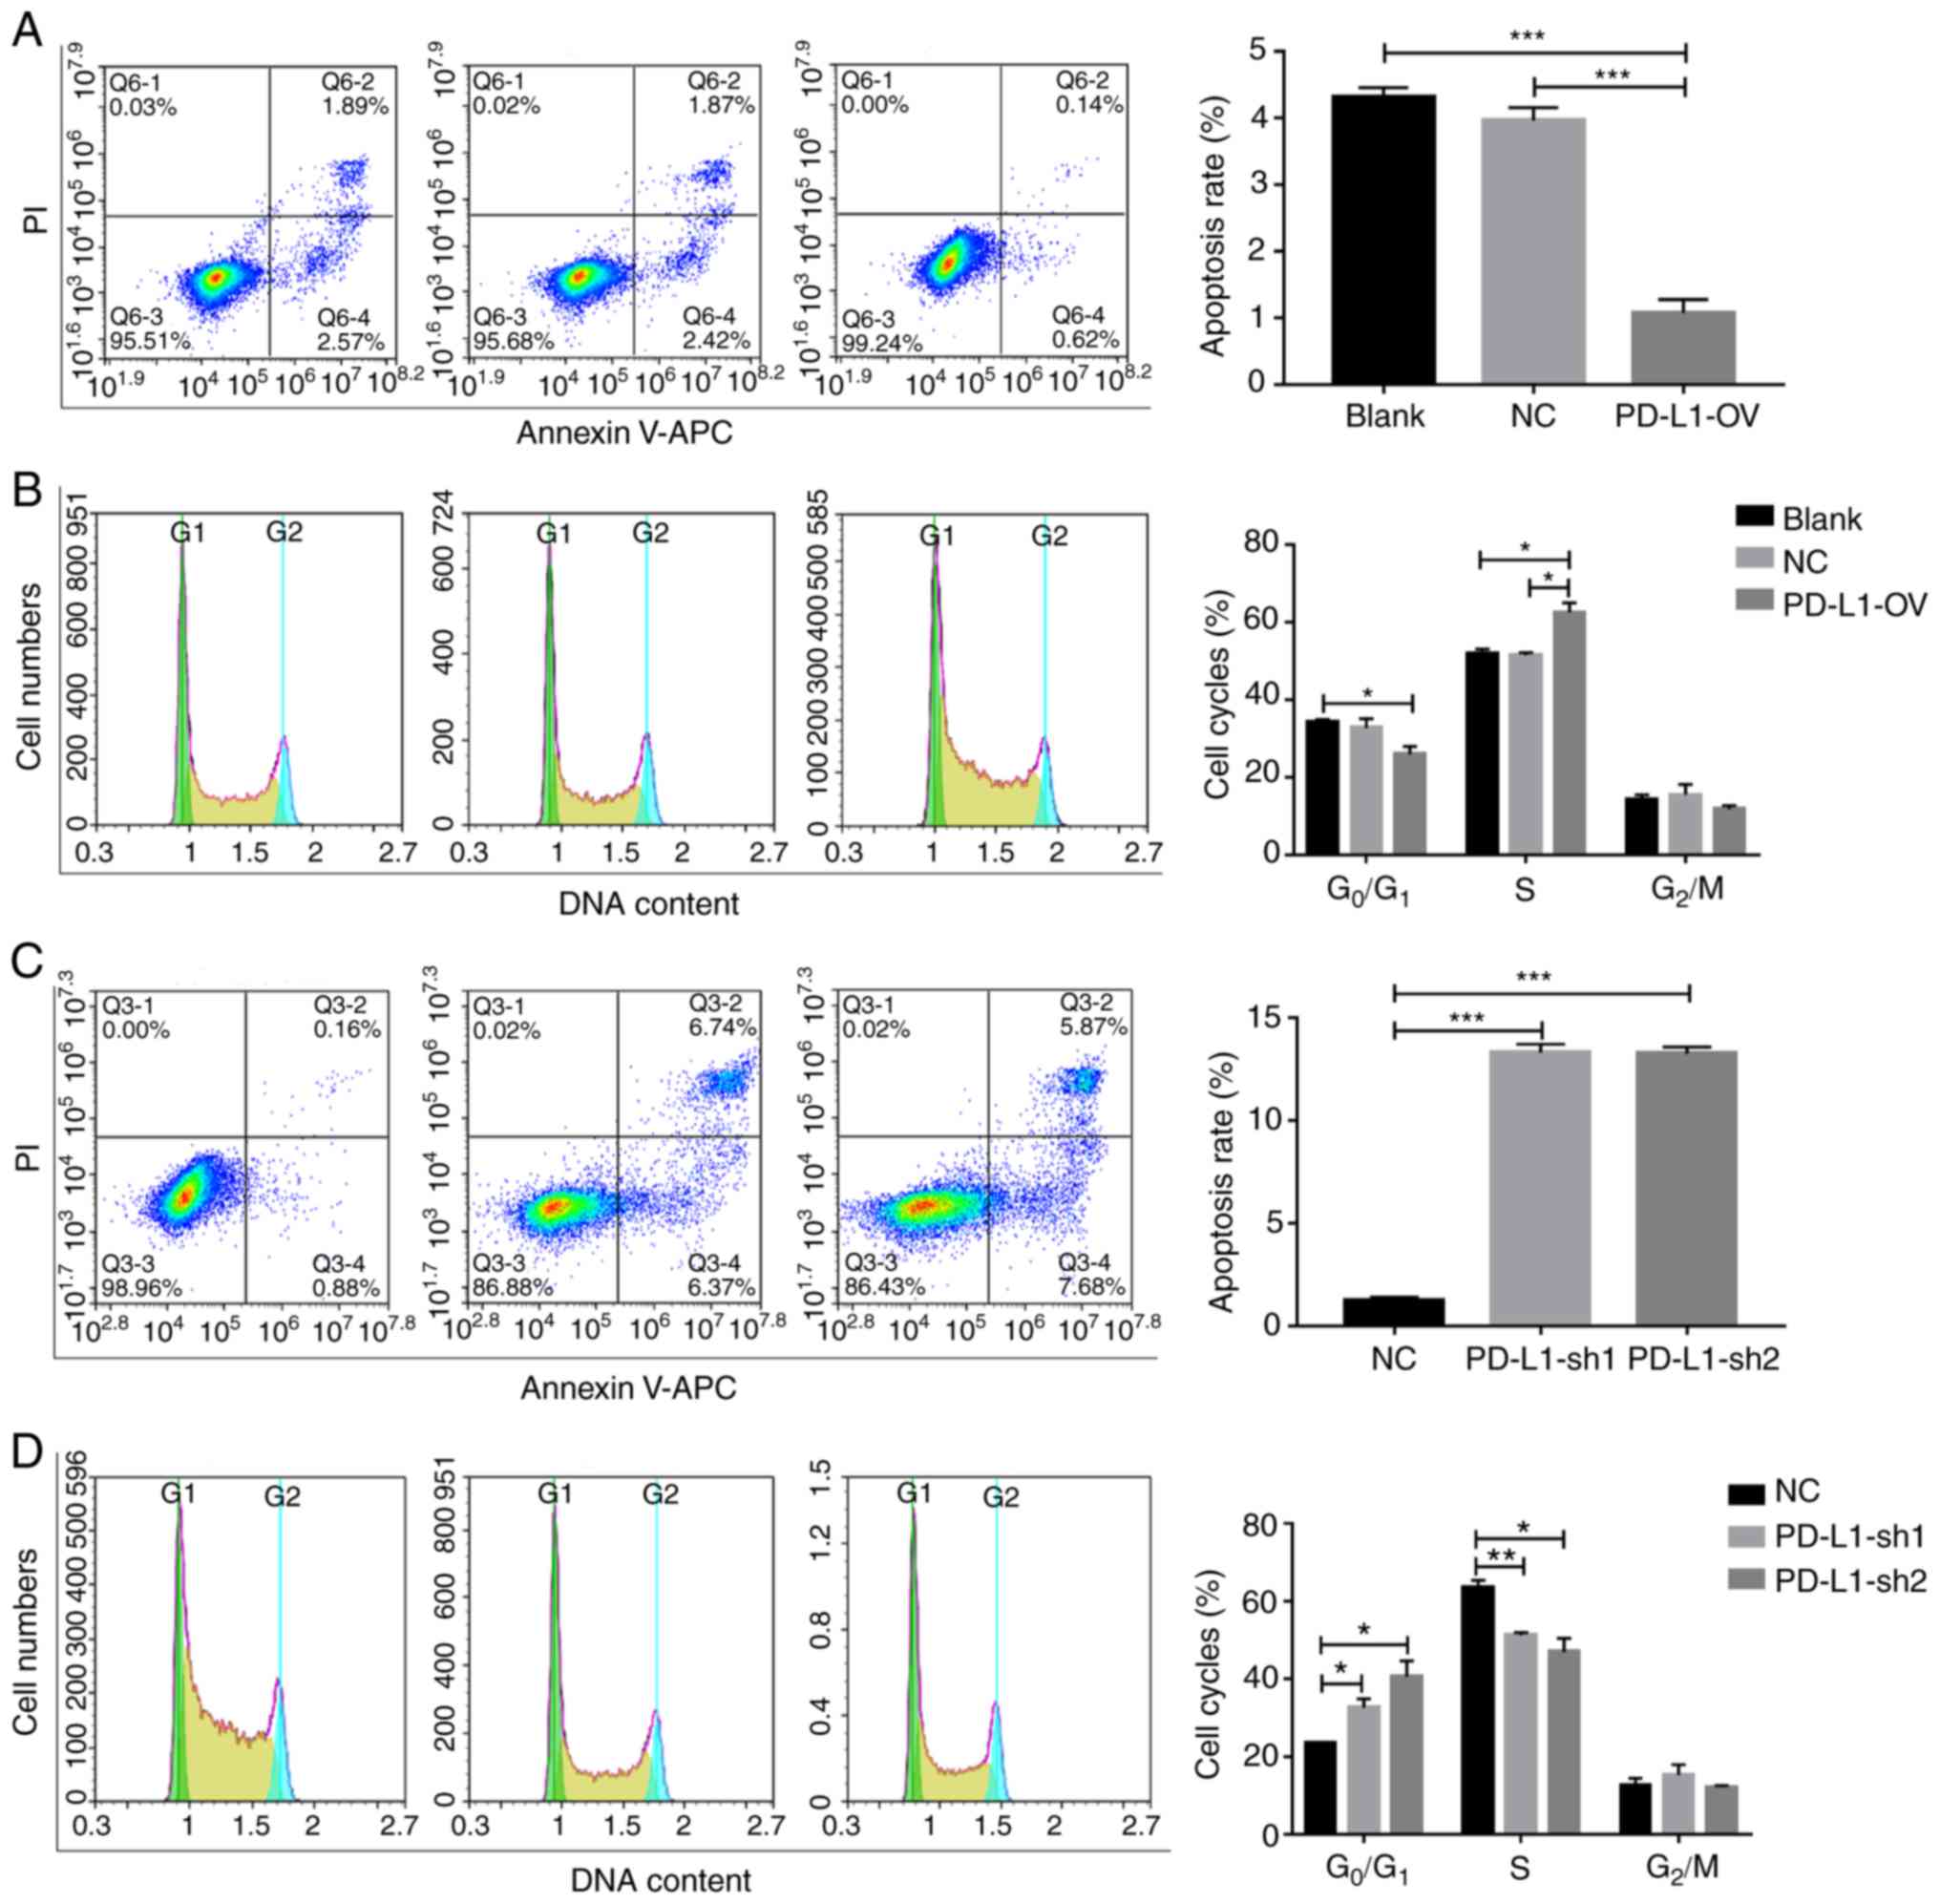
PD-L1 inhibits tumor cell apoptosis
and promotes tumor cells into the S phase
A previous study demonstrated that glycolysis could
affect cell proliferation and apoptosis (28). Therefore, the proliferation of
PD-L1-OV MOLM-13 cells was enhanced and verified using a CCK-8
assay (Fig. S3). Furthermore, the
apoptosis rate of PD-L1-OV MOLM-13 cells exhibited a significantly
decreasing trend (F=98.28) (Fig.
4A). The process of cell proliferation can be classified into
three phases: G0/G1, S and G2/M
(29). PD-L1 promoted tumor cells
into the S phase (F=13.59), indicating that PD-L1 could promote
cell cycle progression (Fig. 4B).
Conversely, the apoptosis of tumor cells (F=466.5) was
significantly increased and the percentage of cells in the S phase
(F=14.02) was significantly decreased following PD-L1 knockdown in
the THP1 cell line (Fig. 4C and D),
with a number of cells remaining in the G0/G1
phase.
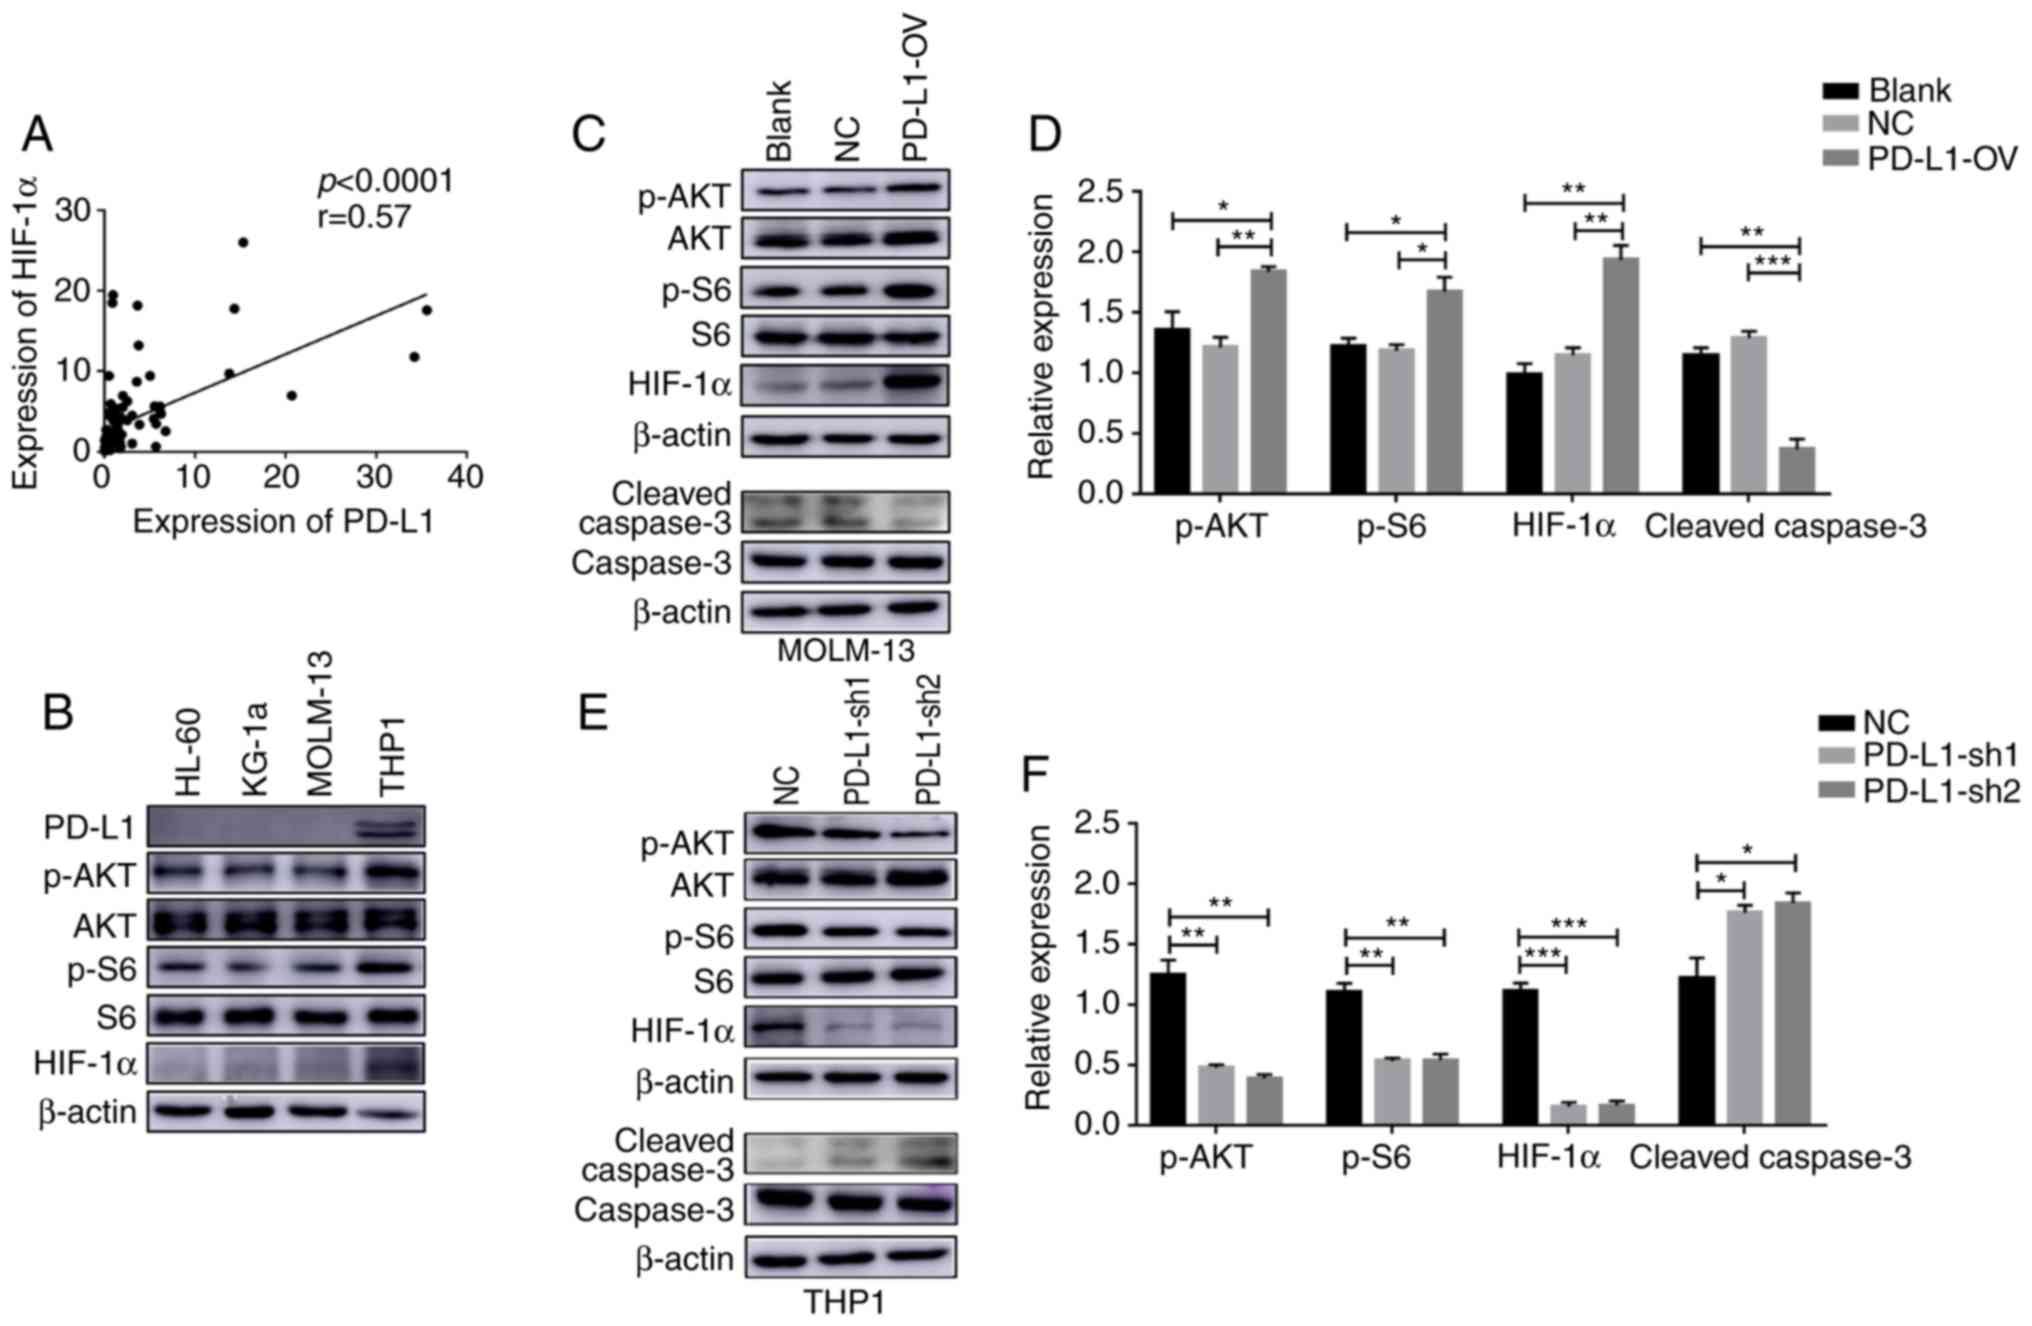
PD-L1 promotes tumor cell glycolysis
through AKT/mTOR/HIF-1α signaling
PD-L1 has been reported to trigger the mTOR
signaling pathway in a mouse sarcoma model (21). Hypoxia is a major characteristic in
the bone marrow microenvironment (30). S6 was reported as a downstream
effector of mTOR signaling (31).
The present study demonstrated that PD-L1 expression was positively
correlated with HIF-1α in 90 patients with AML (Fig. 5A). Furthermore, the present study
demonstrated that the activation of the AKT/mTOR/HIF-1α signaling
pathway was different according to the PD-L1 expression in the 4
AML cell lines (Fig. 5B). In order
to further examine the regulatory mechanism of PD-L1 it was
observed that, phosphorylation of Akt (F=9.485) and S6 (F=10.26)
and HIF-1α (F=30.2) expression was increased after MOLM-13 tumor
cells overexpressed PD-L1, while cleaved caspase-3 (F=44.31) was
decreased (Fig. 5C and D). In
contrast, the Akt/mTOR/HIF-1α signaling pathway (p-AKT, F=37.91;
p-S6, F=39.84; HIF-1α F=122.7) was inactivated in PD-L1-sh1 and
PD-L1-sh2 THP1 cells while cleaved caspase-3 was activated
(F=8.801) (Fig. 5E and F).
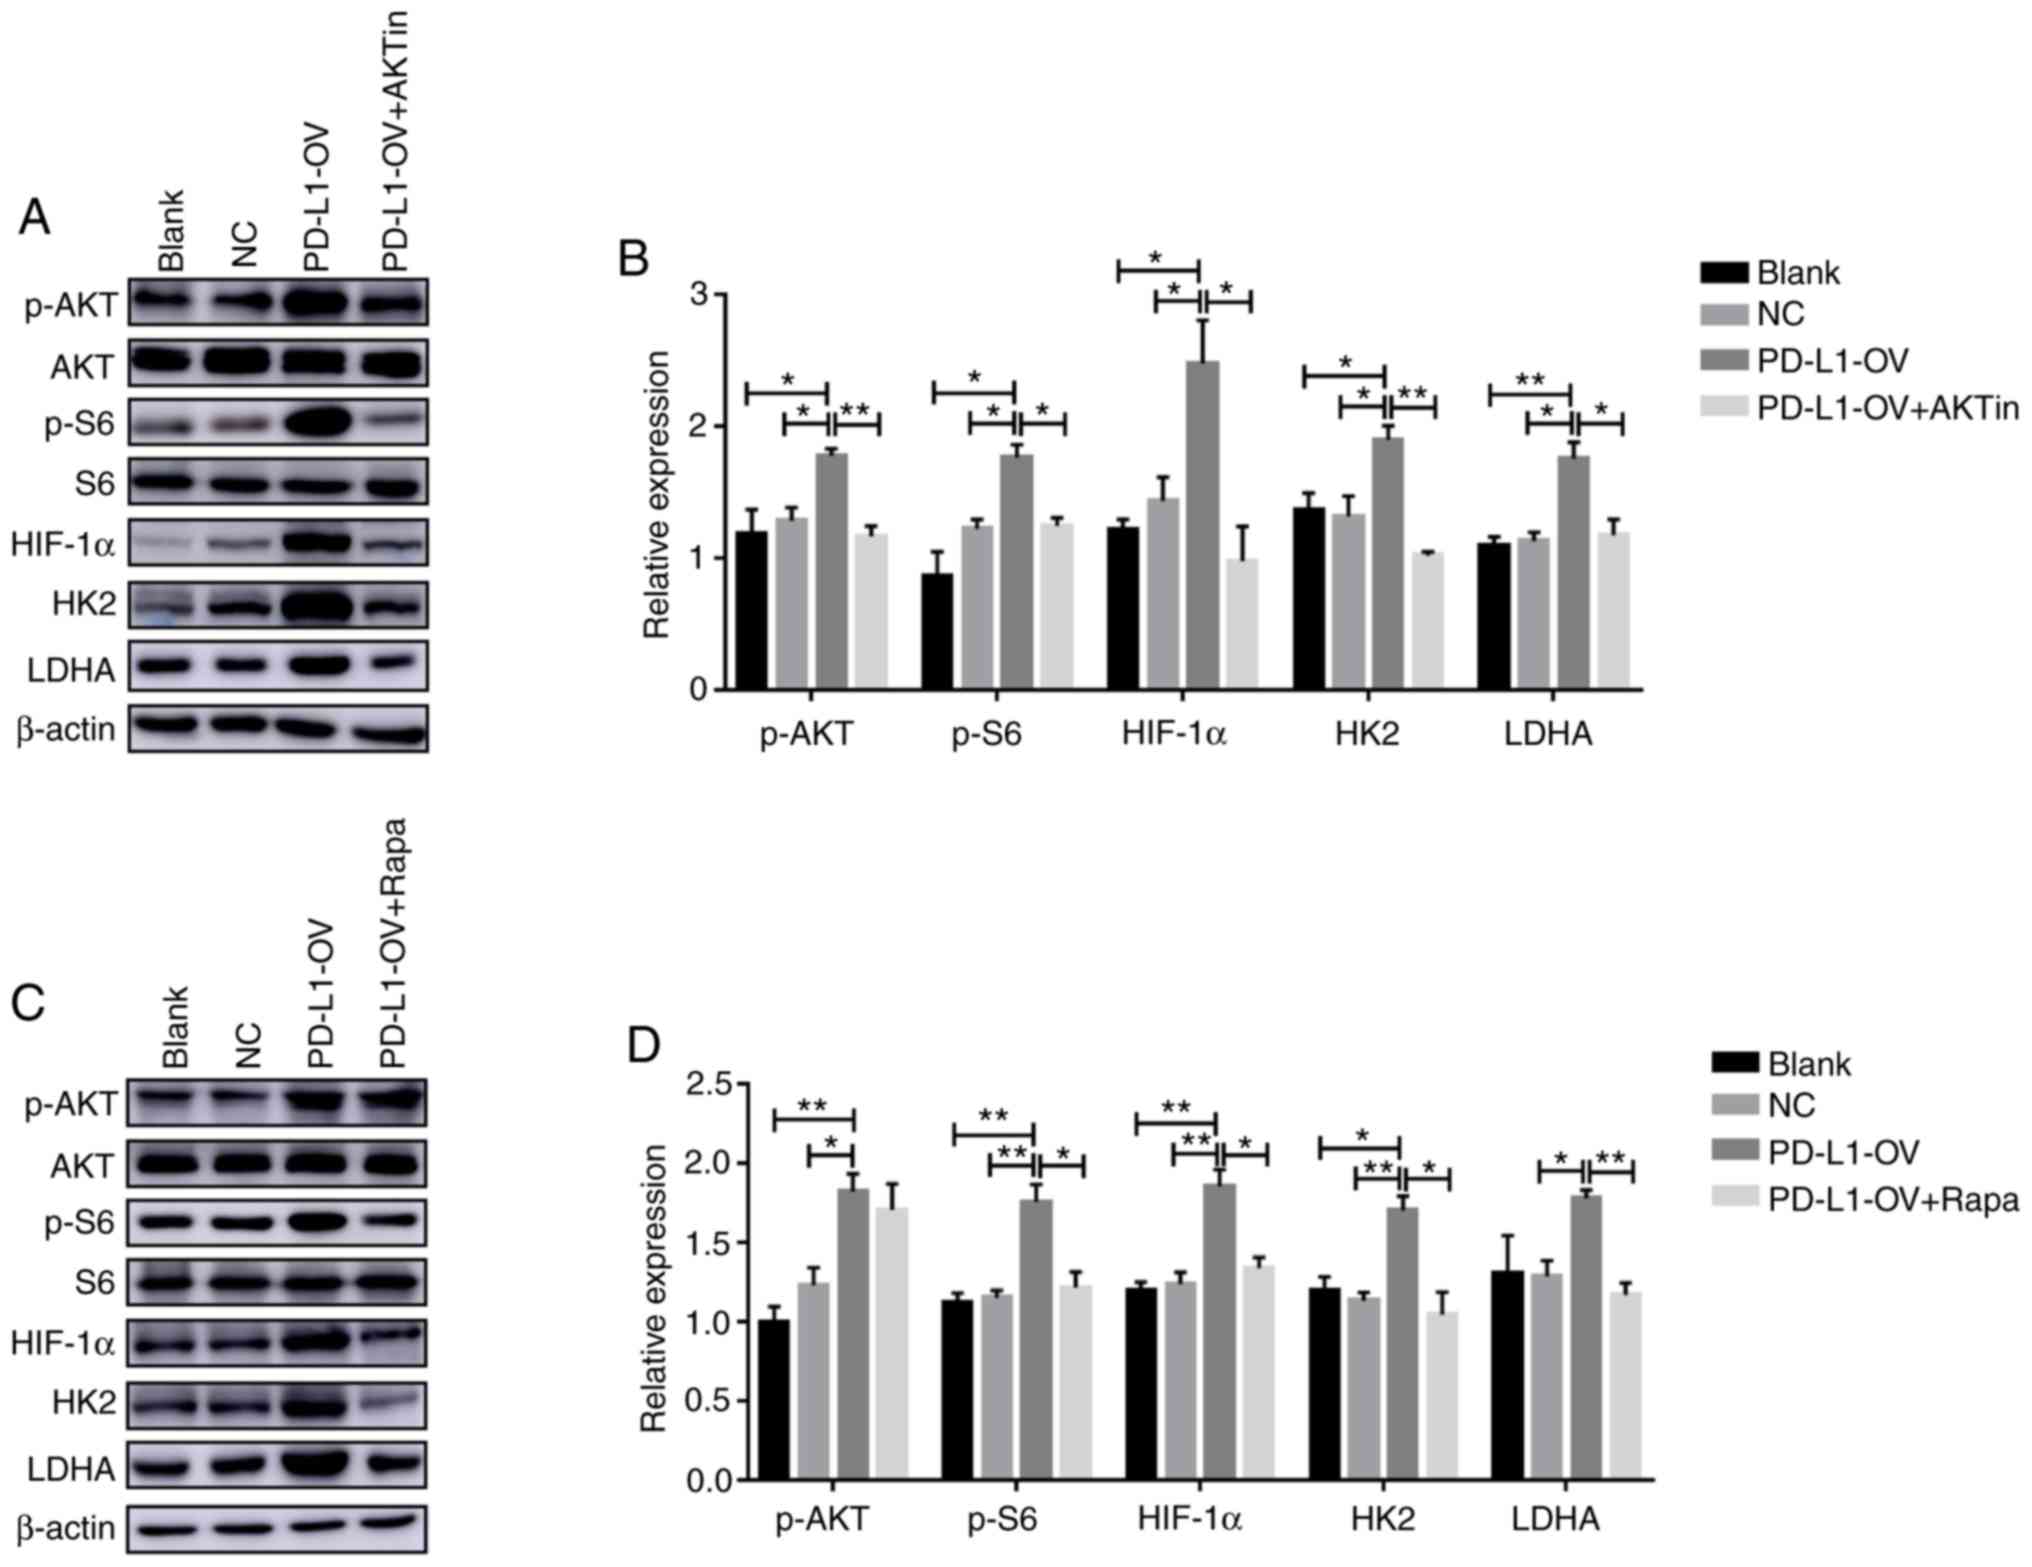
As presented in Fig.
3C, HK2 and LDHA were the genes that exhibited the greatest
change in PD-L1-OV MOLM-13 cells, thus, the present study
speculated that these two genes may be the downstream target genes
of AKT/mTOR/HIF-1α signaling. The present study also demonstrated
that phosphorylation of S6 and HIF-1α expression were downregulated
concurrently following the phosphorylation of Akt via the Akt
inhibitor (p-AKT, F=6.227; p-S6, F=10.16; HIF-1α, F=8.113)
(Fig. 6A and B). In addition, HK2
(F=9.961) and LDHA (F=9.848) expression was also significantly
decreased in PD-L1-OV MOLM-13 cells treated with Akt inhibitor
(Fig. 6A and B). In addition,
rapamycin, an inhibitor of mTOR, was used to treat PD-L1-OV MOLM-13
cells to inhibit phosphorylation of S6. The expression of HK2
(F=8.949), LDHA (F=7.811) and HIF-1α (F=14.66) was decreased in
PD-L1-OV MOLM-13 treated with rapamycin compared to the PD-L1-OV
MOLM-13 cells (Fig. 6C and D).
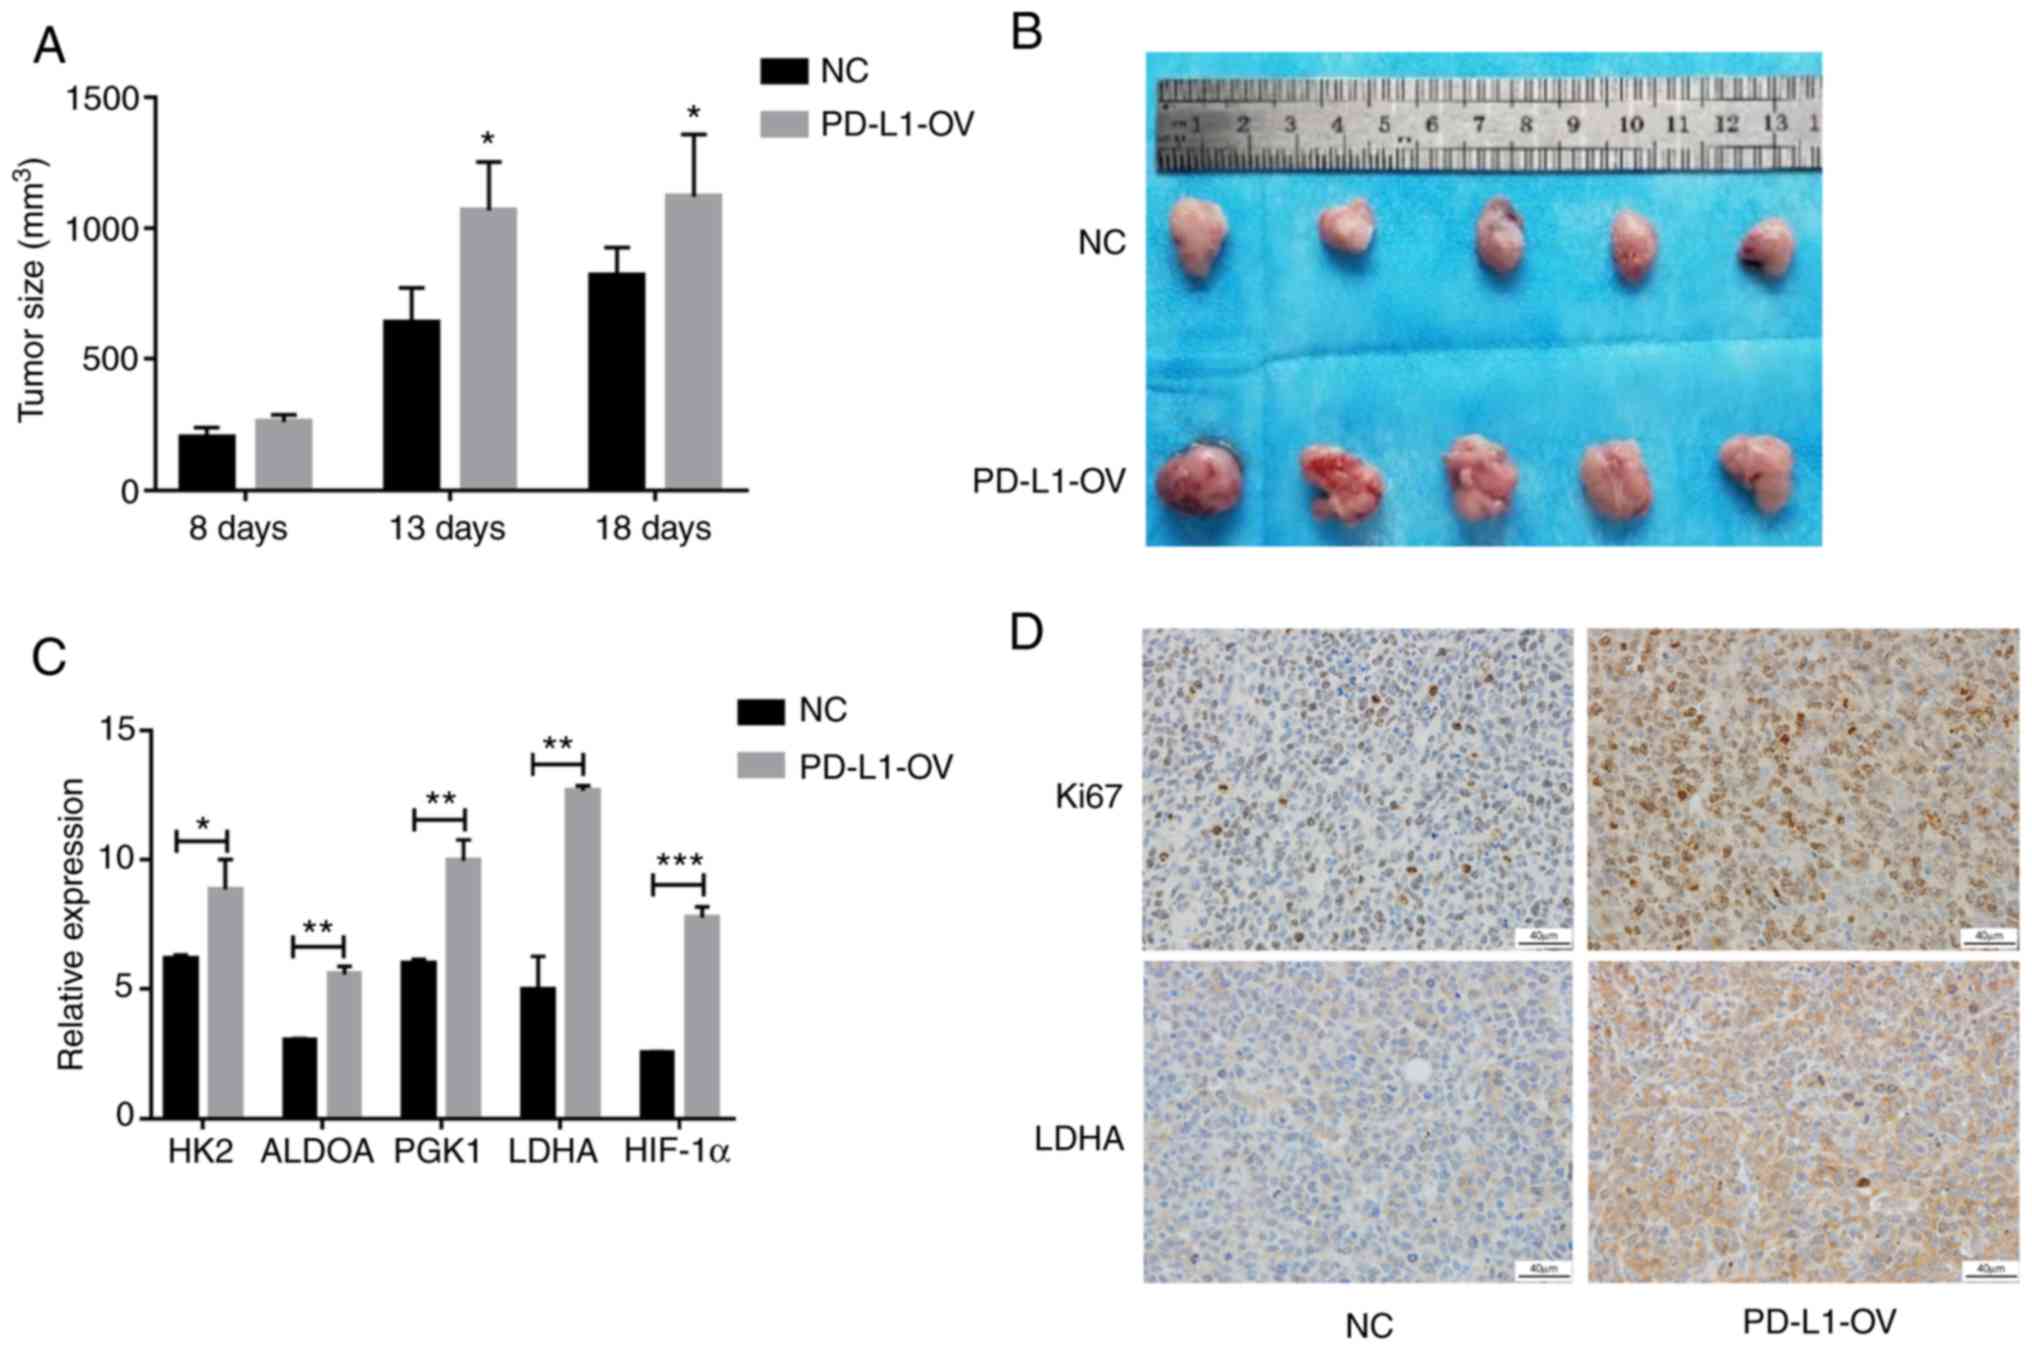
Overexpressed-PD-L1 promotes tumor
growth in vivo
In order to confirm the proliferative effect of
PD-L1 in AML cells in vivo, mouse models of PD-L1-OV MOLM-13
cells and NC were established in the present study. Tumor volumes
of the PD-L1-OV MOLM-13 group were larger at 8, 13 and 18 days
compared with the NC MOLM-13 group (Fig. 7A). The images of the tumor size at
18 days also demonstrated the same result (Fig. 7B). Since it has been confirmed that
the aforementioned glycolysis-associated genes were highly
expressed in the PD-L1-OV MOLM-13 cell in vitro experiment,
the genes were detected in tumor tissues. Glycolysis-associated
genes and HIF-1α were highly expressed in tumor tissues of the
PD-L1-OV MOLM-13 group (Fig. 7C),
and Ki67, a hallmark of proliferation, was increased in the
PD-L1-OV MOLM-13 group (Fig. 7D).
LDHA, regulated by PD-L1/AKT/mTOR, exhibited a highly expressed
trend in tumor tissue of the PD-L1-OV MOLM-13 group (Fig. 7D). The data indicated that PD-L1
promoted AML cell proliferation by enhancing glycolysis.
Discussion
An inreasing number of studies have demonstrated
that cell metabolism adjusted AML cell occurrence and development.
The notion that oxidative phosphorylation could result in
chemotherapy-resistant and tumor progression in patients with AML
has previously been verified (32,33).
AML cell proliferation and stemness were regulated by phospholipid
metabolism (34). The present study
primarily focused on the association between PD-L1 and glycolysis
in AML cells. Patients with AML who expressed high levels of PD-L1
exhibited an enhanced glycolysis ability. However, it was revealed
that some patients with high levels of glycolysis gene expression
exhibited low expression of PD-L1, the reason for this may be
individual heterogeneity. Further assays were performed to
investigate the correlations between PD-L1 and glycolysis in the
present study. By overexpressing PD-L1 in vitro, it was
revealed that the glycolysis-associated genes in tumor cells were
upregulated, with increasing proliferation and decreasing
apoptosis.
Mounting evidence has suggested that the glycolysis
pathway is a potent target of cancer treatment. In pancreatic
cancer, tumor cell invasion and metastasis could be promoted by
glycolysis, which indicates that targeting glycolysis may be a new
therapeutic approach (35). LDHA
plays an important role in glycolysis, and inhibited LDHA-impacted
tumor cell viability in both in vivo and in vitro
preclinical models of Ewing sarcoma, accompanied by weakened
glycolysis (36). HK2, known as a
pivotal rate-limiting enzyme, mainly regulates cell glycolysis.
Targeting HK2 with costunolide decreased the uptake of glucose and
lactate accumulation, resulting in suppression of hepatic stellate
cell viability, which is the major cell for hepatic fibrosis
(37). It has been demonstrated
that glycolysis metabolism was associated with tumor cell
development and progression in oral tongue squamous cell carcinomas
(38). In the results of the
present study, regardless of whether PD-L1 was overexpressed or
knocked-down, the expression of HK2 and LDHA was increased or
decreased in AML cells MOLM-13 with cell proliferation altered,
which was consistent with the results observed in other tumor types
(38). Several studies have
reported the impact of glycolysis in AML. Inhibition of PDK
promoted tumor cell apoptosis, and it has been demonstrated that
PDK would be a poor prognostic marker in patients with AML through
The Cancer Genome Atlas database (39). Song et al observed that
glycolysis was associated with resistance to chemotherapy (40). Although glycolysis was researched in
AML, the majority of studies only reported the phenomenon, without
investigating the mechanism.
In breast cancer, PD-L1 could predict the outcome of
patients (41). PD-L1 promoted
tumor cell growth through mTOR signaling in head and neck squamous
cell carcinoma carcinogenesis cell lines Cal-27 and Fadu (42). Consistent with these findings, the
present study revealed that PD-L1 expression was decreased in
patients with AML with complete remission compared with that in
patients with relapsed or refractory in the 90 samples from
patients with AML. In addition, PD-L1-OV MOLM-13 demonstrated
increasing cell viability and decreasing apoptosis. Li et al
demonstrated that MET downregulated PD-L1 expression by activating
GSK3B. The invasion of liver cancer cells was increased after using
the MET inhibitor (43). Icotinib
increased the proliferation of hepatocellular carcinoma cell lines
both in vitro and in vivo by upregulating PD-L1
expression; this phenomenon would be diminished when knocking-down
PD-L1 expression in tumor cells (44). The results of the present study
coincided with previous research that revealed that Ki67 expression
of tumor tissue in the PD-L1-OV MOLM13 group was higher than in the
NC group in mouse models, indicating that PD-L1 plays a major role
in regulating tumor growth. The molecular mechanism of the
pro-tumor effect of PD-L1 is yet to be elucidated.
There have been a number of studies that have
focused on the regulatory mechanism of glycolysis. It was
investigated that glycolysis was regulated by the long non-coding
RNA HOTTIP/ miR-615-3p/HMGB3 axis to impact tumor cell behaviors in
non-small cell lung carcinoma (45). Another study revealed that
glycolysis metabolism could be controlled by protein kinase C-iota,
due to the progression of non-small-cell lung carcinoma (46). PCK1 is another gene that
participates in cell glycolysis metabolism. Chen and Zhu reported
that Sonic Hedgehog upregulated cell glycolysis by promoting the
phosphorylation of PI3K and Akt and induced the expression of PCK1
(47). In the present study,
PD-L1-OV MOLM-13 cells were treated with Akt inhibitor and
rapamycin, and it was revealed that glycolysis-associated proteins
HK2 and LDHA were downregulated. PD-L1 has been reported to enhance
the proliferation and progression of tumor cells and trigger cell
glycolysis through the mTOR signaling pathway in a mouse sarcoma
model (21). Phosphorylation of Akt
and S6 was enhanced following overexpression of PD-L1 in AML tumor
cells in the present study. In the bone marrow microenvironment,
oxygen pressure is physiologically lower than culture medium, which
induced HIF-1α (30). Although
hypoxia was a significant prognostic factor in solid tumors, the
conclusions of blood tumors, such as AML, were similar (2). In addition, it was also revealed that
PD-L1 expression was positively correlated with HIF-1α both in the
present study and in publicly available data and HIF-1α expression
was affected by Akt/mTOR signaling. Therefore, it was speculated
that HIF-1α impacted by Akt/mTOR signaling could control AML cell
glycolysis and it would be further identified that HIF-1α directly
regulates glycolysis-associated genes in future research. In
addition, due to the lack of knowledge regarding the signaling
motif and signaling transduction of PD-L1, RNA-sequencing of NC and
PD-L1-OV cell lines will be performed our future study, for further
analysis to identify the signal molecules involved in signaling
transduction.
In conclusion, high PD-L1 expression was associated
with high expression of glycolysis-associated genes and poor
prognosis in patients with AML. The present study investigated and
elucidated an important regulatory mechanism of PD-L1 in AML cell
lines. PD-L1 increased glycolysis metabolism through
Akt/mTOR/HIF-1α signaling, leading to rapid cell proliferation and
progression. Based on these findings, PD-L1 may be considered as a
suitable marker for prognosis and treatment in a clinical
setting.
Supplementary Material
Supporting Data
Acknowledgements
We thank Henan Key Laboratory for Pharmacology of
liver diseases for their animal experiment support.
Funding
The present study was supported by grants from the
National Natural Science Foundation of China (81800104).
Availability of data and materials
The data generated, used and analyzed in the current
study are available from the corresponding author in response to
reasonable request.
Authors' contributions
LS conceived and supervised this study. PM and MX
designed and conducted the research. LH, SG, JM, FW, YH, YC, WT, CA
and HS participated in this project and helped to analyze the data.
All authors read and approved the manuscript and agree to be
accountable for all aspects of the research in ensuring that the
accuracy or integrity of any part of the work are appropriately
investigated and resolved.
Ethics approval and consent to
participate
Ethical approval was obtained from the Human
Research Ethics Committee (First Affiliated Hospital of Zhengzhou
University, China). All patients provided written informed consent.
The experiments involving mice were approved by the Institutional
Animal Care and Use committee of the First Affiliated Hospital of
Zhengzhou University.
Patient consent for publication
Not applicable.
Conflict of interests
The authors declare that they have no conflict of
interest.
Glossary
Abbreviations
Abbreviations:
|
AML
|
acute myeloid leukemia
|
|
CTLA4
|
cytotoxic T-lymphocyte-associated
protein 4
|
|
PD-1
|
programmed death 1
|
|
PD-L1
|
programmed cell death 1 ligand 1
|
|
IFN
|
interferon
|
|
TIGAR
|
TP53-induced glycolysis and apoptosis
regulator
|
|
BMMCs
|
bone marrow mononuclear cells
|
|
PBS
|
phosphate-buffered saline
|
|
RT-PCR
|
real time PCR
|
|
FBS
|
fetal bovine serum
|
|
PD-L1-OV
|
PD-L1 overexpressed
|
|
ECAR
|
extracellular acidification rate
|
|
IHC
|
immunohistochemistry
|
References
|
1
|
Liu Y, Lu R, Cui W, Pang Y, Liu C, Cui L,
Qian T, Quan L, Dai Y, Jiao Y, et al: High IFITM3 expression
predicts adverse prognosis in acute myeloid leukemia. Cancer Gene
Ther. Mar 29–2019.(Epub ahead of print). View Article : Google Scholar
|
|
2
|
Jabari M, Allahbakhshian Farsani M, Salari
S, Hamidpour M, Amiri V and Mohammadi MH: Hypoxia-inducible
Factor1-A (HIF1a) and vascular endothelial growth Factor-A (VEGF-A)
expression in de novo AML patients. Asian Pac J Cancer Prev.
20:705–710. 2019. View Article : Google Scholar : PubMed/NCBI
|
|
3
|
Winer ES and Stone RM: Novel therapy in
Acute myeloid leukemia (AML): Moving toward targeted approaches.
Ther Adv Hematol. 10:20406207198606452019. View Article : Google Scholar : PubMed/NCBI
|
|
4
|
Percival MM and Estey EH: Current
treatment strategies for measurable residual disease in patients
with acute myeloid leukemia. Cancer. 125:3121–3130. 2019.
View Article : Google Scholar : PubMed/NCBI
|
|
5
|
Yang X, Pang Y, Zhang J, Shi J, Zhang X,
Zhang G, Yang S, Wang J, Hu K, Wang J, et al: High Expression
levels of ACTN1 and ACTN3 indicate unfavorable prognosis in acute
myeloid leukemia. J Cancer. 10:4286–4292. 2019. View Article : Google Scholar : PubMed/NCBI
|
|
6
|
Yohe S: Molecular genetic markers in acute
myeloid leukemia. J Clin Med. 4:460–478. 2015. View Article : Google Scholar : PubMed/NCBI
|
|
7
|
Mendler JH, Maharry K, Radmacher MD,
Mrózek K, Becker H, Metzeler KH, Schwind S, Whitman SP, Khalife J,
Kohlschmidt J, et al: RUNX1 mutations are associated with poor
outcome in younger and older patients with cytogenetically normal
acute myeloid leukemia and with distinct gene and MicroRNA
expression signatures. J Clin Oncol. 30:3109–3118. 2012. View Article : Google Scholar : PubMed/NCBI
|
|
8
|
Ribas A and Wolchok JD: Cancer
immunotherapy using checkpoint blockade. Science. 359:1350–1355.
2018. View Article : Google Scholar : PubMed/NCBI
|
|
9
|
Zou W and Chen L: Inhibitory B7-family
molecules in the tumour microenvironment. Nat Rev Immunol.
8:467–477. 2008. View
Article : Google Scholar : PubMed/NCBI
|
|
10
|
Li H, Wang Z, Zhang Y, Sun G, Ding B, Yan
L, Liu H, Guan W, Hu Z, Wang S, et al: The immune checkpoint
regulator PDL1 is an independent prognostic biomarker for
biochemical recurrence in prostate cancer patients following
adjuvant hormonal therapy. J Cancer. 10:3102–3111. 2019. View Article : Google Scholar : PubMed/NCBI
|
|
11
|
Gato-Cañas M, Zuazo M, Arasanz H,
Ibañez-Vea M, Lorenzo L, Fernandez-Hinojal G, Vera R, Smerdou C,
Martisova E, Arozarena I, et al: PDL1 signals through conserved
sequence motifs to overcome interferon-mediated cytotoxicity. Cell
Rep. 20:1818–1829. 2017. View Article : Google Scholar : PubMed/NCBI
|
|
12
|
Bertucci F, Finetti P, Perrot D, Leroux A,
Collin F, Le Cesne A, Coindre JM, Blay JY, Birnbaum D and Mamessier
E: PDL1 expression is a poor-prognosis factor in soft-tissue
sarcomas. Oncoimmunology. 6:e12781002017. View Article : Google Scholar : PubMed/NCBI
|
|
13
|
Yoyen-Ermis D, Tunali G, Tavukcuoglu E,
Horzum U, Ozkazanc D, Sutlu T, Buyukasik Y and Esendagli G: Myeloid
maturation potentiates STAT3-mediated atypical IFN-γ signaling and
upregulation of PD-1 ligands in AML and MDS. Sci Rep. 9:116972019.
View Article : Google Scholar : PubMed/NCBI
|
|
14
|
Mussetti A, Pellegrinelli A, Cieri N,
Garzone G, Dominoni F, Cabras A and Montefusco V: PD-L1, LAG3, and
HLA-DR are increasingly expressed during smoldering myeloma
progression. Ann Hematol. 98:1713–1720. 2019. View Article : Google Scholar : PubMed/NCBI
|
|
15
|
Zerdes I, Matikas A, Bergh J, Rassidakis
GZ and Foukakis T: Genetic, transcriptional and post-translational
regulation of the programmed death protein ligand 1 in cancer:
Biology and clinical correlations. Oncogene. 37:4639–4661. 2018.
View Article : Google Scholar : PubMed/NCBI
|
|
16
|
Pavlova NN and Thompson CB: The emerging
hallmarks of cancer metabolism. Cell Metab. 23:27–47. 2016.
View Article : Google Scholar : PubMed/NCBI
|
|
17
|
Ma J, Liu B, Yu D, Zuo Y, Cai R, Yang J
and Cheng J: SIRT3 deacetylase activity confers chemoresistance in
AML via regulation of mitochondrial oxidative phosphorylation. Br J
Haematol. 187:49–64. 2019. View Article : Google Scholar : PubMed/NCBI
|
|
18
|
Gregory MA, Nemkov T, Park HJ, Zaberezhnyy
V, Gehrke S, Adane B, Jordan CT, Hansen KC, D'Alessandro A and
DeGregori J: Targeting glutamine metabolism and redox state for
leukemia therapy. Clin Cancer Res. 25:4079–4090. 2019. View Article : Google Scholar : PubMed/NCBI
|
|
19
|
Boussiotis VA: Molecular and biochemical
aspects of the PD-1 checkpoint pathway. N Engl J Med.
375:1767–1778. 2016. View Article : Google Scholar : PubMed/NCBI
|
|
20
|
Azuma T, Yao S, Zhu G, Flies AS, Flies SJ
and Chen L: B7-H1 is a ubiquitous antiapoptotic receptor on cancer
cells. Blood. 111:3635–3643. 2008. View Article : Google Scholar : PubMed/NCBI
|
|
21
|
Chang CH, Qiu J, O'Sullivan D, Buck MD,
Noguchi T, Curtis JD, Chen Q, Gindin M, Gubin MM, van der Windt GJ,
et al: Metabolic competition in the tumor microenvironment is a
driver of cancer progression. Cell. 162:1229–1241. 2015. View Article : Google Scholar : PubMed/NCBI
|
|
22
|
Poulain L, Sujobert P, Zylbersztejn F,
Barreau S, Stuani L, Lambert M, Palama TL, Chesnais V, Birsen R,
Vergez F, et al: High mTORC1 activity drives glycolysis addiction
and sensitivity to G6PD inhibition in acute myeloid leukemia cells.
Leukemia. 31:2326–2335. 2017. View Article : Google Scholar : PubMed/NCBI
|
|
23
|
Qian S, Li J, Hong M, Zhu Y, Zhao H, Xie
Y, Huang J, Lian Y, Li Y, Wang S, et al: TIGAR cooperated with
glycolysis to inhibit the apoptosis of leukemia cells and
associated with poor prognosis in patients with cytogenetically
normal acute myeloid leukemia. J Hematol Oncol. 9:1282016.
View Article : Google Scholar : PubMed/NCBI
|
|
24
|
Cascone T, McKenzie JA, Mbofung RM, Punt
S, Wang Z, Xu C, Williams LJ, Wang Z, Bristow CA, Carugo A, et al:
Increased tumor glycolysis characterizes immune resistance to
adoptive T cell therapy. Cell Metab. 27:977–987.e4. 2018.
View Article : Google Scholar : PubMed/NCBI
|
|
25
|
Livak KJ and Schmittgen TD: Analysis of
relative gene expression data using real-time quantitative PCR and
the 2(-Delta Delta C(T)) method. Methods. 25:402–408. 2001.
View Article : Google Scholar : PubMed/NCBI
|
|
26
|
Liu CC, Wang H, Wang WD, Wang L, Liu WJ,
Wang JH, Geng QR and Lu Y: ENO2 promotes cell proliferation,
glycolysis, and glucocorticoid-resistance in acute lymphoblastic
leukemia. Cell Physiol Biochem. 46:1525–1535. 2018. View Article : Google Scholar : PubMed/NCBI
|
|
27
|
Tang Z, Li C, Kang B, Gao G, Li C and
Zhang Z: GEPIA: A web server for cancer and normal gene expression
profiling and interactive analyses. Nucleic Acids Res. 45:W98–W102.
2017. View Article : Google Scholar : PubMed/NCBI
|
|
28
|
Fan K, Fan Z, Cheng H, Huang Q, Yang C,
Jin K, Luo G, Yu X and Liu C: Hexokinase 2 dimerization and
interaction with voltage-dependent anion channel promoted
resistance to cell apoptosis induced by gemcitabine in pancreatic
cancer. Cancer Med. 8:5903–5915. 2019. View Article : Google Scholar : PubMed/NCBI
|
|
29
|
Wang L, Shen S, Xiao H, Ding F, Wang M, Li
G and Hu F: ARHGAP24 inhibits cell proliferation and cell cycle
progression and induces apoptosis of lung cancer via a
STAT6-WWP2-P27 axis. Carcinogenesis. Aug 20–2019.(Epub ahead of
print). View Article : Google Scholar :
|
|
30
|
Harrison JS, Rameshwar P, Chang V and
Bandari P: Oxygen saturation in the bone marrow of healthy
volunteers. Blood. 99:3942002. View Article : Google Scholar : PubMed/NCBI
|
|
31
|
Liu J, Ren Y, Hou Y, Zhang C, Wang B, Li
X, Sun R and Liu J: Dihydroartemisinin induces endothelial cell
autophagy through suppression of the Akt/mTOR pathway. J Cancer.
10:6057–6064. 2019. View Article : Google Scholar : PubMed/NCBI
|
|
32
|
Baccelli I, Gareau Y, Lehnertz B, Gingras
S, Spinella JF, Corneau S, Mayotte N, Girard S, Frechette M,
Blouin-Chagnon V, et al: Mubritinib targets the electron transport
chain complex I and reveals the landscape of OXPHOS dependency in
acute myeloid leukemia. Cancer Cell. 36:84–99.e8. 2019. View Article : Google Scholar : PubMed/NCBI
|
|
33
|
Pollyea DA, Stevens BM, Jones CL, Winters
A, Pei S, Minhajuddin M, D'Alessandro A, Culp-Hill R, Riemondy KA,
Gillen AE, et al: Venetoclax with azacitidine disrupts energy
metabolism and targets leukemia stem cells in patients with acute
myeloid leukemia. Nat Med. 24:1859–1866. 2018. View Article : Google Scholar : PubMed/NCBI
|
|
34
|
Xu M, Seneviratne AK and Schimmer AD:
Phospholipid metabolism regulates AML growth and stemness. Aging
(Albany NY). 11:3895–3897. 2019. View Article : Google Scholar : PubMed/NCBI
|
|
35
|
Yang J, Ren B, Yang G, Wang H, Chen G, You
L, Zhang T and Zhao Y: The enhancement of glycolysis regulates
pancreatic cancer metastasis. Cell Mol Life Sci. Aug 20–2019.(Epub
ahead of print).
|
|
36
|
Yeung C, Gibson AE, Issaq SH, Oshima N,
Baumgart JT, Edessa LD, Rai G, Urban DJ, Johnson MS, Benavides GA,
et al: Targeting glycolysis through inhibition of lactate
dehydrogenase impairs tumor growth in preclinical models of Ewing
sarcoma. Cancer Res. 79:5060–5073. 2019. View Article : Google Scholar : PubMed/NCBI
|
|
37
|
Ban D, Hua S, Zhang W, Shen C, Miao X and
Liu W: Costunolide reduces glycolysis-associated activation of
hepatic stellate cells via inhibition of hexokinase-2. Cell Mol
Biol Lett. 24:522019. View Article : Google Scholar : PubMed/NCBI
|
|
38
|
Nakazato K, Mogushi K, Kayamori K,
Tsuchiya M, Takahashi KI, Sumino J, Michi Y, Yoda T and Uzawa N:
Glucose metabolism changes during the development and progression
of oral tongue squamous cell carcinomas. Oncol Lett. 18:1372–1380.
2019.PubMed/NCBI
|
|
39
|
Cui L, Cheng Z, Liu Y, Dai Y, Pang Y, Jiao
Y, Ke X, Cui W, Zhang Q, Shi J and Fu L: Overexpression of PDK2 and
PDK3 reflects poor prognosis in acute myeloid leukemia. Cancer Gene
Ther. Dec 22–2018.(Epub ahead of print). View Article : Google Scholar
|
|
40
|
Song K, Li M, Xu X, Xuan LI, Huang G and
Liu Q: Resistance to chemotherapy is associated with altered
glucose metabolism in acute myeloid leukemia. Oncol Lett.
12:334–342. 2016. View Article : Google Scholar : PubMed/NCBI
|
|
41
|
Wu Z, Zhang L, Peng J, Xu S, Zhou L, Lin
Y, Wang Y and Lu J, Yin W and Lu J: Predictive and prognostic value
of PDL1 protein expression in breast cancer patients in neoadjuvant
setting. Cancer Biol Ther. 20:941–947. 2019. View Article : Google Scholar : PubMed/NCBI
|
|
42
|
Zheng A, Li F, Chen F, Zuo J, Wang L, Wang
Y, Chen S, Xiao B and Tao Z: PD-L1 promotes head and neck squamous
cell carcinoma cell growth through mTOR signaling. Oncol Rep.
41:2833–2843. 2019.PubMed/NCBI
|
|
43
|
Li H, Li CW, Li X, Ding Q, Guo L, Liu S,
Liu C, Lai CC, Hsu JM, Dong Q, et al: MET inhibitors promote liver
tumor evasion of the immune response by stabilizing PDL1.
Gastroenterology. 156:1849–1861.e13. 2019. View Article : Google Scholar : PubMed/NCBI
|
|
44
|
Sun J, Jiang W, Tian D, Guo Q and Shen Z:
Icotinib inhibits the proliferation of hepatocellular carcinoma
cells in vitro and in vivo dependently on EGFR activation and PDL1
expression. Onco Targets Ther. 11:8227–8237. 2018. View Article : Google Scholar : PubMed/NCBI
|
|
45
|
Shi J, Wang H, Feng W, Huang S, An J, Qiu
Y and Wu K: Long non-coding RNA HOTTIP promotes hypoxia-induced
glycolysis through targeting miR-615-3p/HMGB3 axis in non-small
cell lung cancer cells. Eur J Pharmacol. 862:1726152019. View Article : Google Scholar : PubMed/NCBI
|
|
46
|
Liu L, Lei B, Wang L, Chang C, Yang H, Liu
J, Huang G and Xie W: Protein kinase C-iota-mediated glycolysis
promotes non-small-cell lung cancer progression. Onco Targets Ther.
12:5835–5848. 2019. View Article : Google Scholar : PubMed/NCBI
|
|
47
|
Chen Y and Zhu W: Knockdown of the Sonic
Hedgehog (SHH) gene inhibits proliferation of Hep3B and SMMC-7721
hepatocellular carcinoma cells via the PI3K/Akt/PCK1 signaling
pathway. Med Sci Monit. 25:6023–6033. 2019. View Article : Google Scholar : PubMed/NCBI
|